Reactive Oxygen Species Derived from NOX3 and NOX5 Drive Differentiation of Human Oligodendrocytes
 Roberta Accetta1
  Simona Damiano1
  Annalisa Morano2
  Paolo Mondola1
  Roberto Paternò1*
  Enrico V. Avvedimento3*
  Mariarosaria Santillo1*
- 1Dipartimento di Medicina Clinica e Chirurgia, Università degli Studi di Napoli Federico II, Naples, Italy
- 2Laboratori di Ricerca Preclinica e Traslazionale, Istituto di Ricovero e Cura a Carattere Scientifico – Centro di Riferimento Oncologico della Basilicata, Rionero in Vulture, Italy
- 3Dipartimento di Medicina Molecolare e Biotecnologie Mediche, Università degli Studi di Napoli Federico II, Naples, Italy
Reactive oxygen species (ROS) are signaling molecules that mediate stress response, apoptosis, DNA damage, gene expression and differentiation. We report here that differentiation of oligodendrocytes (OLs), the myelin forming cells in the CNS, is driven by ROS. To dissect the OL differentiation pathway, we used the cell line MO3-13, which display the molecular and cellular features of OL precursors. These cells exposed 1–4 days to low levels of H2O2 or to the protein kinase C (PKC) activator, phorbol-12-Myristate-13-Acetate (PMA) increased the expression of specific OL differentiation markers: the specific nuclear factor Olig-2, and Myelin Basic Protein (MBP), which was processed and accumulated selectively in membranes. The induction of differentiation genes was associated with the activation of ERK1-2 and phosphorylation of the nuclear cAMP responsive element binding protein 1 (CREB). PKC mediates ROS-induced differentiation because PKC depletion or bis-indolyl-maleimide (BIM), a PKC inhibitor, reversed the induction of differentiation markers by H2O2. H2O2 and PMA increased the expression of membrane-bound NADPH oxidases, NOX3 and NOX5. Selective depletion of these proteins inhibited differentiation induced by PMA. Furthermore, NOX5 silencing down regulated NOX3 mRNA levels, suggesting that ROS produced by NOX5 up-regulate NOX3 expression. These data unravel an elaborate network of ROS-generating enzymes (NOX5 to NOX3) activated by PKC and necessary for differentiation of OLs. Furthermore, NOX3 and NOX5, as inducers of OL differentiation, represent novel targets for therapies of demyelinating diseases, including multiple sclerosis, associated with impairment of OL differentiation.
Introduction
Reactive oxygen species (ROS), including hydrogen peroxide (H2O2), superoxide anion ( ) and hydroxyl radical (•OH), are highly reactive molecules generated by the chemical transformation of oxygen inside the cells. High levels of ROS induce cell damage causing oxidation of macromolecules and play an important role in the pathogenesis of many disorders, including inflammatory and neurodegenerative diseases (Maes et al., 2011). However, controlled ROS generation play a physiological role in redox-sensitive gene expression and cell signaling by regulating physiological processes (Sauer et al., 2001; D’Autréaux and Toledano, 2007).
A growing body of evidence links cell differentiation with ROS generation (Burdon and Rice-Evans, 1989; Rao and Berk, 1992). Redox sensitive signaling pathways have also a role in the development of nervous system cells (Morrison, 2001; Kageyama et al., 2005; Kennedy et al., 2012). In addition, in the adult brain the oxygen tension is one of important factor driving the proliferation and differentiation of Neural Stem Cells (NSC) (Panchision, 2009). A direct role of ROS in neuronal differentiation has been demonstrated in vitro in PC12 (Katoh et al., 1997) or neuroblastoma cells (Nissen et al., 1973). ROS dependent signaling is also involved in glial cells specification and differentiation (Cavaliere et al., 2012). In oligodendrocyte (OL) a key determinant of the balance between self-renewal and differentiation is the intracellular redox state of precursor cells (Smith et al., 2000). OLs are responsible in CNS for myelin sheath formation assuring the fast saltatory transmission of the action potentials in neurons. In the adult brain, the turnover of OLs and myelination take place continuously ensuring continuous myelin formation. OLs originate from OL precursor cells (OPCs) (Clemente et al., 2013). These cells progress through pre-OLs, immature OLs and mature non-myelinating OLs, before reaching their final stage of post-mitotic myelin forming cells. Each step of maturation is characterized by the expression of specific markers (Baumann and Pham-Dinh, 2001). It is likely that any redox unbalance in OPC or OL may alter terminal differentiation and seriously compromise the formation of myelin forming cells. Multiple sclerosis (MS) is an inflammatory autoimmune disease characterized by multifocal demyelinating lesions in the white matter of CNS. OL replacement and remyelination rarely occur in MS lesions (Franklin and Ffrench-Constant, 2008; Lopez Juarez et al., 2015), suggesting that impaired OL differentiation may represent the ultimate consequence of OL-targeted inflammation. It is known that inflammation leads to the activation of oxidative stress and, as a consequence, high levels ROS can be achieved within MS lesions influencing the local environment where OPCs maturation and remyelination occurs (di Penta et al., 2013).
Our data suggest that maturation of OL is tightly associated to redox balance and the two NOX3 and 5 enzymes seem to be relevant modulators of ROS homeostasis in OL. ROS are generated by different systems such as mitochondrial electron transport chain enzymes, xanthine/xanthine oxidase system and membrane NADPH oxidases (NOXs), which were originally found in phagocytic cells. In mammalian there are seven NOX genes encoding distinct catalytic subunits, namely NOXs 1-5 and DUOX1-2 (Bedard and Krause, 2007). There are several structural and functional differences among NOXs isoforms (Lambeth, 2004). NOX1-4 share a common structure characterized by six trans-membrane helices and a short N-terminus. The catalytic subunits of NOX1-4 are associated with the integral membrane protein, p22phox. NOX1-3 require membrane translocation of cytosolic components for their activity. NOX5 is activated by calcium ions. NOXs isoforms are differentially expressed in cells and tissues; in many cases, multiple NOXs are expressed in the same cell type with different subcellular localization and functions (Santillo et al., 2015).
NOX-derived ROS seem to be involved in NMDA-induced OL differentiation in the subventricular region in rat brain (Cavaliere et al., 2013). However, little is known about the modulation of NOX expression during OLs differentiation and the role of the different NOX isoforms. This is relevant because different subcellular localization of NOXs may determine the availability of ROS in specific cell compartments (Li et al., 2006; Oakley et al., 2009; Prosser et al., 2011). However, we wish to note that most of our knowledge about the biology of OLs derives from studies in rodents and therefore the role of NOXs-dependent redox signaling in human model of OL differentiation has not yet been thoroughly addressed.
Here we sought to evaluate the involvement of redox signaling dependent by NOXs isoforms in the molecular mechanisms leading to human OLs differentiation. To this end we evaluated the effects of low levels of H2O2 and the involvement of the membrane-bound superoxide generating NADPH oxidase NOXs in human OL differentiation.
We report that OL cells MO3-13, with the phenotypic characteristics of human OPCs, express NOX3 and NOX5 isoforms and when exposed to low H2O2 levels (200 μM H2O2), express early and late OL differentiation markers. Moreover, OL differentiation, induced by 100 nM Phorbol-12-Myristate-13-Acetate (PMA) in the absence of serum, is dependent on ROS generated by these two NOXs isoforms.
Materials and Methods
Cell Cultures
The MO3-13 cells (CELLution Biosystem Inc., Canada) are an immortal human–human hybrid cell line with the phenotypic characteristics of primary OLs, derived from the fusion of a 6-thioguanine-resistant mutant of a human rhabdomyosarcoma with OLs obtained from adult human brain. They were grown in Dulbecco’s Modified Eagles Medium (DMEM; GIBCO Invitrogen), containing 4.5 g/L glucose (GIBCO, Auckland, New Zealand), supplemented with 10% Fetal Bovine Serum (FBS; Sigma S. Louis, USA), 100 U/ml penicillin and 100 μg/ml streptomycin. The cells were kept in a 5% CO2 and 95% air atmosphere at 37° C.
PMA and H2O2 Cell Treatment
The cells were differentiated in FBS-free DMEM, supplemented with 100 nM of Phorbol-12-Myristate-13-Acetate (PMA; Sigma–Aldrich) until 4 days and the FBS-free medium containing PMA was replaced every day.
To study the effects of chronic H2O2 treatment on OL differentiation, MO3-13 cells were incubated with 200 μM of H2O2 until 4 days in complete medium in the absence of any other differentiation stimulus and the medium containing H2O2 was replaced every day.
When not differentiated cells were compared to 1 or 4 days differentiated cells, the treatments were staggered to allow harvesting all cell samples at the same time.
Flow Cytometric Assay of Cell Viability
The toxicity of H2O2 treatment was tested by cytofluorimetric analysis of Propidium Iodide (PI) staining of PMA-differentiated (4 days) and not differentiated MO3-13 cells. Both cell samples, plated in 35 mm Petri dishes, were treated with increasing doses of H2O2 (200, 400, 600, 800, and 1000 μM) for 18 h in medium without serum. After trypsinization and wash in PBS, the cells were resuspended in 500 μl of PBS and 1 μg/ml of PI was added before the flow cytometric analysis of PI-positive cells performed with a FCSscan apparatus (Becton-Dickinson). Data were analyzed using WinMDI 2.9 software.
Inhibitors Treatment and PKC Depletion
MO3-13 cells were preincubated for 1 h with 1-(4-Hydroxy-3-methoxyphenyl)ethanone, also known as Apocynin (50 μM, Sigma–Aldrich) or for 30 min with Bisindolylmaleimide VIII acetate (BIM, 100 μM, Sigma–Aldrich), N-acetyl Cysteine (NAC, 200 μM, Sigma–Aldrich), Cu,Zn superoxide dismutase (SOD1, 400 ng/ml) and then stimulated for 4 days with PMA (100 nM) or with H2O2 (200 μM).
Protein kinase C-depleted MO3-13 cells were prepared by treating the cells with PMA 1 μM for 24 h in medium containing 0.2% FBS (Rogers et al., 1990) and then stimulated with H2O2 (200 μM) for 30min.
Western Blotting Analysis
MO3-13 cell lysates were obtained in RIPA buffer (50 mM Tris-HCl, pH 7.5, 150 mM NaCl, 1% NP40, 0.5% deoxycholate, 0.1% sodium dodecyl sulphate (SDS) containing 2.5 mM Na-pyrophosphate, 1 mM β-glycerophosphate, 1 mM NaVO4, 1 mM NaF, 0.5 mM phenyl-methyl-sulfonyl-fluoride (PMSF), and a cocktail of protease inhibitors (Roche Applied Bioscience). The cells were kept for 15 min at 4°C and disrupted by repeated aspiration through a 21-gage needle. Cell lysates were centrifuged for 10 min at 11,600 × g and the pellets were discarded. Fifty micrograms of total proteins were subjected to SDS – 10% polyacrylamide gel electrophoresis (SDS-PAGE) under reducing conditions. After electrophoresis, the proteins were transferred onto a nitrocellulose filter membrane (GE-Healthcare, Amersham PI, UK) with a Trans-Blot Cell (Bio-Rad Laboratories, Berkeley, CA, USA) and transfer buffer containing 25 mM Tris, 192 mM glycine, 20% methanol. For proteins detection membranes were placed in 5% non-fat milk in tris-buffered saline, 0.1% Tween 20 (TBST, Bio-Rad Laboratories) at room temperature for 2 h to block the non-specific binding sites. Filters were incubated with specific rabbit polyclonal antibodies against Olig-2 (Millipore), p-Creb (Ser 133) (Millipore), NOX3 (abcam), NOX5 (abcam), p-PKCα (Ser657) (Upstate) or a specific mouse polyclonal antibody against p-Erk (Santa Cruz Biotecnology, INC.), and then incubated with a peroxidase-conjugated anti-rabbit or anti-mouse secondary antibody (GE-Healthcare, UK). Peroxidase activity was detected with the enhanced chemiluminescence (ECL) system (GE-Healthcare). To normalize for sample loading and protein transfer the membranes were then stripped and reprobed with an anti α-tubulin antibody (Sigma–Aldrich) or an anti Total Erk 1–2 (Santa Cruz Biotecnology, INC.). Protein bands were revealed by ECL and, when specified, quantified by densitometry using ImageJ software.
Flow Cytometric Analysis of Myelin Basic Protein (MBP)
Cells were grown to semiconfluency in 60-mm culture dishes. After detachment by trypsin, 5 × 10⁵ cells are suspended in 1 mL of phosphate buffered saline (PBS) and fixed overnight with 1% formaldehyde at room temperature. Next, cells were permeabilized with 0.1% Triton X-100 for 40 min at 4°C, washed 4x with PBS containing 2% FBS, 0.01% NaN3, 0.1% Triton X-100 (buffer A), and incubated for 45 min at 4° C with 1:50 dilution of rabbit polyclonal anti-human MBP Ig. The cells were then washed twice with the same buffer and incubated for 45 min at 4°C with Cy3-conjugated anti-(rabbit IgG) Ig at 1:50 dilution. Control cells were incubated with Cy3-conjugated anti-(rabbit IgG) Ig alone. After two washes in buffer A, cells were resuspended in PBS and analyzed by flow cytometry using FACSCAN (BD, Heidelberg, Germany) and WINMDI 2.9 software.
Fluorimetric Determination of ROS and Superoxide Levels
Reactive oxygen species levels were determined by the membrane-permeant ROS sensitive fluorogenic probe 5,6-carboxy-2′, 7′-dichlorofluoresceindiacetate, DCHF-DA (Molecular Probes, Leiden, The Netherlands). MO3-13 cells were grown to semi-confluence in 24 multiwell plates and incubated for 18 h in medium containing 0.2% FBS before the experiments. Cells were preincubated for 30 min with NAC (200 μM) or SOD1 (400 μg/ml). The cells were washed twice with PBS and incubated in the same buffer with 10 μM DCHF-DA for 10 min. Then, cells were washed three times with PBS containing 10 mM glucose, 1.2 mM MgCl2 and 1.2 mM CaCl2 and dichlorofluorescein (DCF) fluorescence was measured at different time intervals using the plate reader Fluoroskan Ascent FL fluorometer (Thermo Electron Oy, Vantaa, Finland) and data analyzed by Ascent software.
Superoxide levels were assayed by flow cytometry using two different fluorescent probes, Dihydroethidium (DHE) (Molecular ProbeTM) or the mitochondria-targeted equivalent MitoSOXTMRed reagent (Molecular ProbeTM). MO3-13 cells were grown to semi-confluence in 60-mm culture dishes and incubated for 18 h in medium containing 0.2% FBS.
For the DHE staining the cells were preincubated for 30 min with Cu,Zn superoxide dismutase (SOD1, 400 ng/ml) and stimulated for 30 min with PMA (100 nM). After incubations the cells were washed twice with PBS and incubated with DHE (10 μM) for 30 min at 37°C, protected from light. For the MitoSOXTMRed staining the cells were stimulated for 30 min with PMA (100 nM), washed twice with PBS and incubated in the same buffer with 5 μM MitoSOXTMRed reagent for 10 min at 37°C, protected from light.
Then, for both assays, the cells were washed twice with PBS, trypsinized and centrifuged at 2000 rpm for 5 min, and then resuspended in PBS. The cells were analyzed using FACSCAN flow cytometer (BD, Heidelberg, Germany) and WINMDI 2.9 software.
Immunofluorescence Confocal Microscopy
MO3-13 cells were grown on glass coverslip under culture conditions described in the specific experiments. Then, the medium was removed and cells immediately fixed in 3.7% Paraformaldehyde in PBS with 2% Sucrose, pH 7.4, for 5 min at 22°C, and, after two washes in PBS with 2% Sucrose, permeabilized for 10 min at 4°C with 0.01% Saponin (Sigma–Aldrich, from quillaja bark) in PBS for MBP staining; cells were permeabilized for 5 min at 4°C with 0.1%Triton X-100 in 20 mM Hepes, 300 mM Sucrose, 50 mM NaCl, 3 mM MgCl2 for Olig-2 staining.
The cells, after blocking with 20% FBS in PBS with 0.01% Saponin for 30 min at 4°C, were labeled with primary rabbit-polyclonal anti human MBP antibody (Millipore Upstate) or after blocking with 20% FBS in PBS for 30 min at 4°C, were labelled with primary rabbit polyclonal anti human Olig-2 antibody (Millipore). The cells were washed and labeled with secondary Cy3-conjugated anti-rabbit IgG (Jackson ImmunoResearch, USA). Controls were incubated with secondary antibodies alone. After treatment with nuclear marker, 4′,6-diamidino-2-phenylindole (DAPI), the coverslips were briefly washed first, in PBS and then in distilled water, and finally mounted on glass slides for microscopy examination. Cells were analyzed with a Zeiss LSM 510 Meta laser scanning confocal microscope.
Afterward, images were analyzed using the ImageJ software: we set the threshold on the maximum fluorescent value of the sample treated only with secondary antibody, and quantified 25 cells for each sample. Regions of interest (ROI) were defined to restrict the analysis to a spatially confined cellular area.
RNA Interference
Human NOX3, NOX5 and PKCα small interfering RNAs ON-TARGETplus (siRNAs) were obtained from Dharmacon (USA). Transfection was carried out by Neon Transfection System by Life Technology (Invitrogen). The experimental conditions were optimized for MO3-13 cells: voltage 1700, width 20 ms, 1 pulse and transfection efficiency (70 ± 7%) was evaluated using 2 μg of Green Fluorescent Protein (GFP). Percent of GFP positive cells were evaluated after 48 h of transfection by flow cytometry using FACSCAN (BD, Heidelberg, Germany) and WINMDI software.
Cells were dissociated by a brief treatment with trypsin-ethylenediaminetetraacetic acid (EDTA), and counted. siRNAs were introduced into each 1 × 10⁶ dissociated cells in 300 μl volume according to manufacturer’s instructions; electroporated cells were then seeded into culture dishes containing pre-warmed culture media.
NOX3 and NOX5 knockdowns were tested by immunoblot and RT-PCR too. PKCα knockdown was tested by immunoblot for p-PKCα. As controls were used “non-targeting” (NT) scrambled siRNAs. In all experiments siRNAs were used at a final concentration of 100 nM.
RNA Isolation
Total RNA was extracted using TRIzol reagent according to the protocol provided by the manufacturer (Sigma–Aldrich). Total RNA (1 μg) was reverse transcribed using Transcriptor First Strand cDNA Synthesis Kit (Roche Applied Science) by oligo-dT primers for 30 min at 55°C in a 20 μl reaction volume.
Qualitative PCR
Qualitative PCR was performed using Hot Master Taq DNA Polymerase (5PRIME) in 20 μl final volume containing 0.2 mM dNTP, 0.2 μM of the specific primers and 100 ng of sample cDNA. The PCR conditions used were 94°C 2 min, (94°C 30 s, 60°C 30 s, 70°C 30 s) and 70°C 5 min in GeneAmp PCR Sysyem 9700 (Applied Biosystem Inc, USA). The reactions were carried out at different cycles (30–35).
Real-Time PCR
Real-time PCR was performed using LightCycler480 II System (Roche) in 96-well optical reaction plates and in a 20 μl final volume containing 10 μl of LightCycler480 SYBR GREEN I Master (Roche Applied Science), 1 μl of each gene-specific primer and 50 ng of sample cDNA. Gene-specific primers were designed to selectively amplify MBP, Olig-2, NOX1, NOX2, NOX3, NOX4 and NOX5, and relative expression values were normalized using glyceraldehyde 3-phosphate dehydrogenase (GAPDH). The SYBR GREEN fluorescence was measured at each extension step. The Threshold Cycle (Ct) reflects the cycle number at which the fluorescence generated crosses an arbitrary threshold. Melting curve analysis was performed to determine the specificity of the reaction. Real-time PCR was conducted in triplicate for each sample and the mean value was calculated.
Primers used in these studies are the following:
MBP: (F), CTC CAT CGG GCG CTT CTT TG (R), CGG GTG GTG TGA GTC CTT GT
OLIG-2: (F), CCA GAG CCC GAT GAC CTT TTT (R), CAC TGC CTC CTA GCT TGT C
Human NOX1 (F), TTA ACA GCA CGC TGA TCC TG (R), CAC TCC AGT GAG ACC AGC AA
Human cytochrome b-245, beta polypeptide (CYBB, alias NOX2): (F), GGA GTT TCA AGA TGC GTG GAA ACT A (R), GCC AGA CTC AGA GTT GGA GAT GCT
Human NOX 3: (F), CCA GGG CAG TAC ATC TTG GT (R), CCG TGT TTC CAG GGA GAG TA
Human NOX4: (F), GCT TAC CTC CGA GGA TCA CA (R), CGG GAG GGT GGG TAT CTA A
Human NOX5: (F), ATC AAG CGG CCC CCT TTT TTT CAC (R), CTC ATT GTC ACA CTC CTC GAC AGC
Human GAPDH: (F), AGG CTG AGA ACG GGA AGC (R), CCA TGG TGG TGA AGA CGC
Statistical Analysis
Statistical differences were evaluated using a Student’s t-test for unpaired samples.
Results
Differential Effects of H2O2 on Viability of MO3-13 Precursor or Differentiated Cells
To evaluate whether ROS influence human OLs differentiation, we analyzed the effects of H2O2 on the expression of specific OL differentiation markers. To this end, we used human OL MO3-13 cells which express phenotypic markers of primary OPCs. These cells, when cultured in serum-free medium, supplemented with 100 nM of PMA arrest growth and differentiate to mature OLs (McLaurin et al., 1995; Buntinx et al., 2003).
To investigate the impact of H2O2 on OL differentiation, we first determined the survival of cells exposed to increasing concentration of H2O2. Cell viability was assessed by flow-cytometric analysis either on precursor or on PMA-differentiated MO3-13 cells in the absence (Figure 1) or in the presence of serum (Supplementary Figure S1). Differentiated cells were more susceptible to death induced by high oxidative stress in both conditions (with or without serum). On the basis of dose-response curves we conclude that 200 μM of H2O2, did not alter survival of differentiated or undifferentiated cells. This is the main reason why we used this dose in all the subsequent experiments.
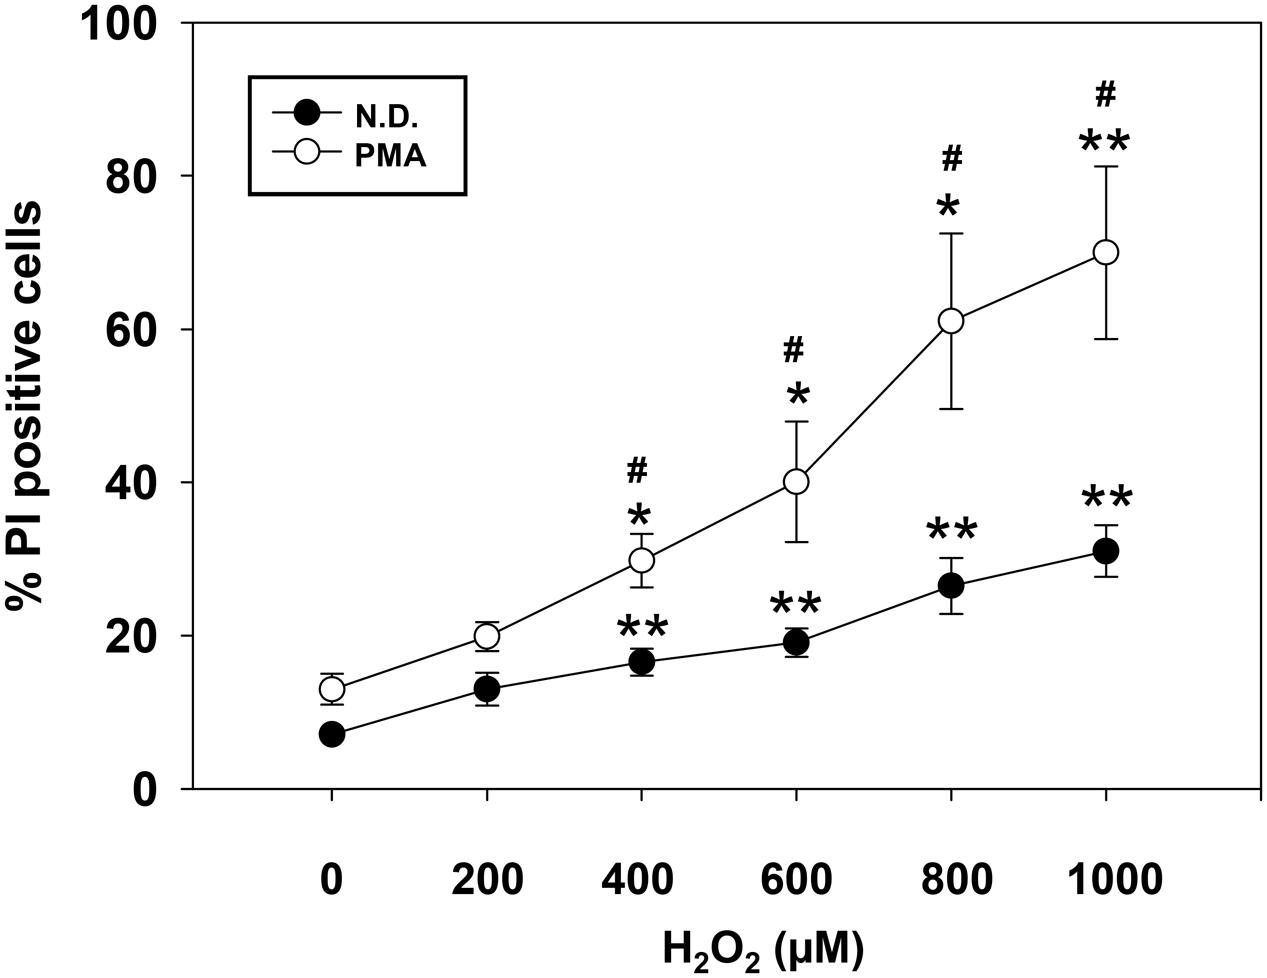
FIGURE 1. Dose-dependent effect of H2O2 on cell viability. Not differentiated (N.D.), growing in complete medium, and differentiated (PMA) MO3-13 cells were stimulated with increasing doses of H2O2 and cell viability was evaluated by cytofluorimetry after Propidium Iodide (PI) staining. The MO3-13 cells were differentiated in FBS-free DMEM supplemented with 100 nM of PMA for 4 days. The graphs show the mean ± SEM values relative to control of three independent experiments. ∗p < 0.05, ∗∗p < 0.01 vs. Control; #p < 0.05 vs. Corresponding dose.
MO3-13 Cells Exposed to H2O2 Differentiate
MO3-13 cells express low levels of the OL differentiation markers MBP and Olig-2 (Supplementary Figure S2). MBP is one of the major proteins of CNS myelin sheath and constitutes as much as 30% of its protein content (Baumann and Pham-Dinh, 2001), while Olig-2 is a specific OL transcription factor essential for OL lineage commitment both in vivo and in vitro (Lu et al., 2002; Samanta and Kessler, 2004).
The effects of PMA and H2O2 on these two differentiation markers were evaluated after 1 and 4 days of treatment. Indirect immunofluorescence and flow cytometric analysis showed that MBP levels progressively increase after 1 and 4 days of treatment (Figure 2A). Similarly, PMA or H2O2 progressively increased mRNA levels of MBP after 1 and 4 days of treatment (Figure 2B).
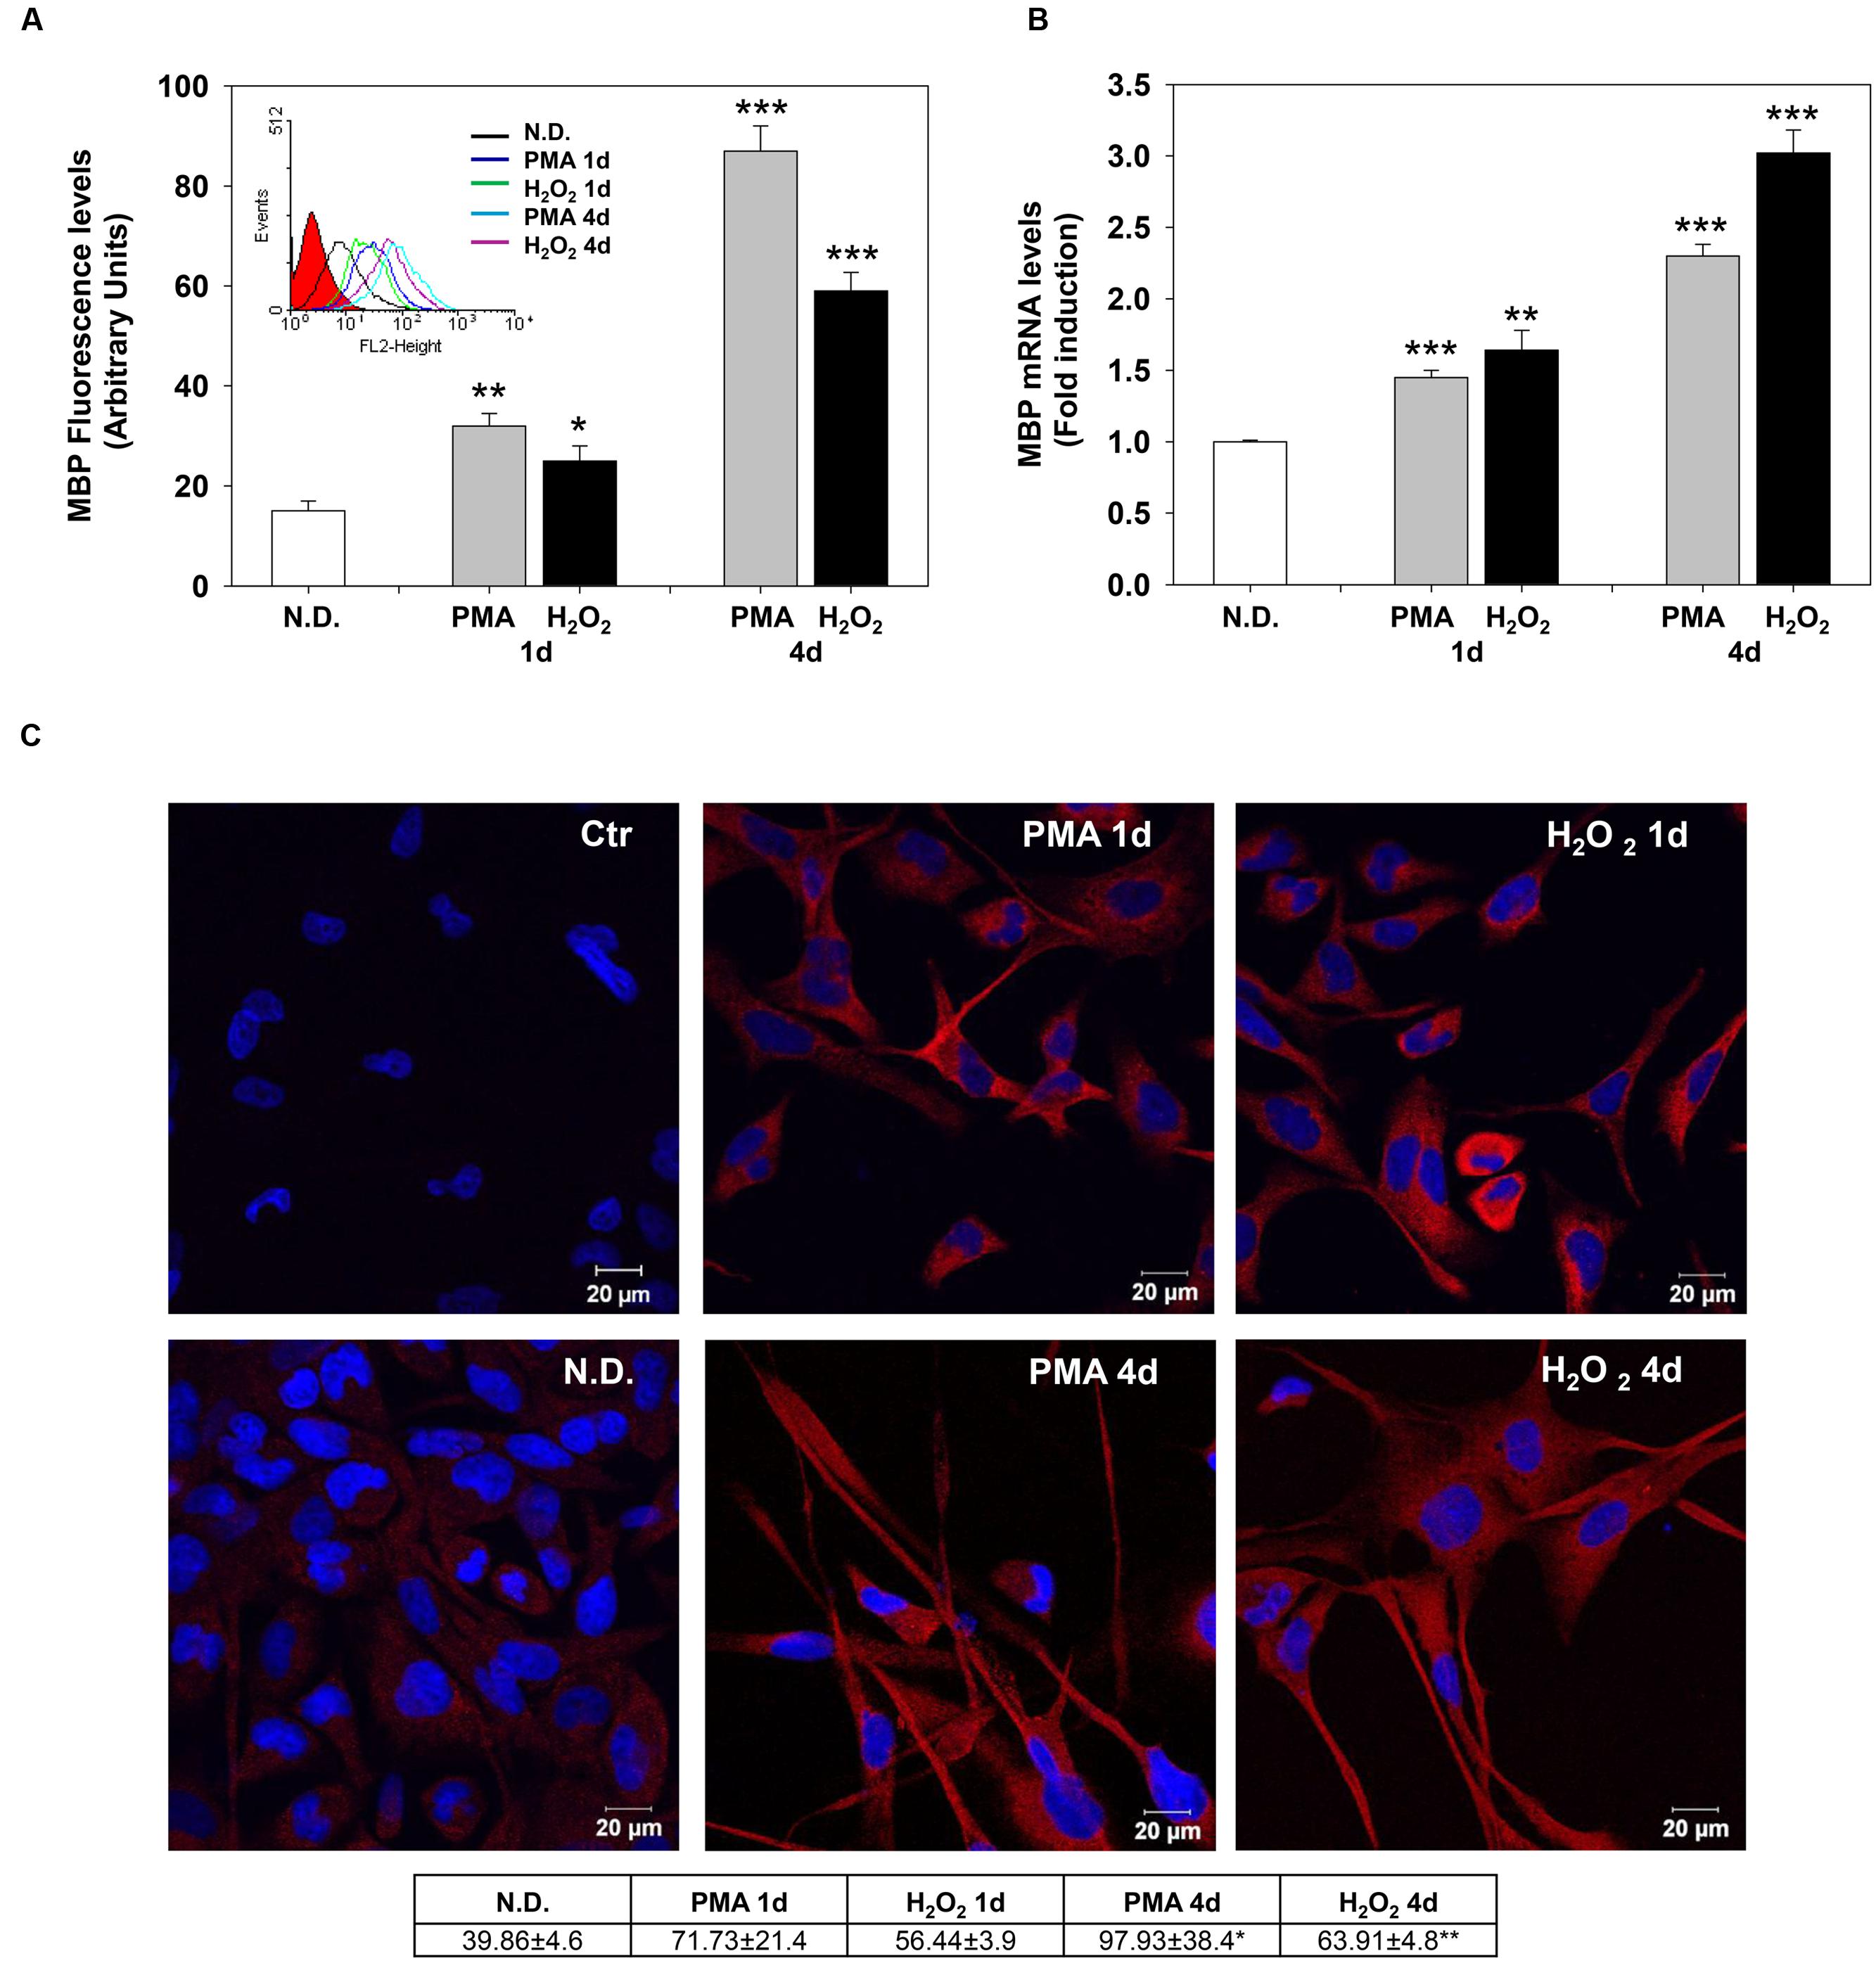
FIGURE 2. Phorbol-12-Myristate-13-Acetate and H2O2 induce MBP expression levels. (A) MBP protein levels in MO3-13 cells treated for 1 and 4 days with 100 nM PMA in medium without serum or with 200 μM H2O2. Immunoreactivity for MBP was evidenced by indirect immunofluorescence and flow cytometric analysis, using primary antibodies against MBP and CY3-conjugated anti rabbit IgG as secondary antibodies. 10,000 cells were counted for each sample. N.D. indicates Not Differentiated cells, growing in complete medium. The graph shows the mean ± SEM values of three independent experiments. The insert shows the histograms of a representative experiment; the red histogram denotes the sample treated with secondary antibodies alone. (B) Real-time-PCR analysis of MBP mRNA levels in MO3-13 cells treated for 1 and 4 days with 100 nM PMA in medium without serum or with 200 μM H2O2. N.D. indicates Not Differentiated cells, growing in complete medium. Expression values were normalized using glucose-6-phosphate-dehydrogenase mRNA (G6PD). The histogram shows means ± SEM values relative to control of three independent experiments. (C) Confocal images of MBP immunoreactivity of MO3-13 cells after 1 and 4 days of differentiation with 100nM PMA in medium without serum or with 200 μM H2O2. Cells were stained with the nuclear dye DAPI (blue) and with primary anti human MBP antibodies and CY3-conjugated anti rabbit IgG as secondary antibodies (red). Control (Ctr) was treated with secondary antibodies and DAPI alone. N.D. indicates Not Differentiated cells, growing in complete medium. The table under the images shows means ± SEM values obtained by the quantitative analysis of 25 cells for each sample. ∗p < 0.05, ∗∗p < 0.01, ∗∗∗p < 0.001 vs. N.D.
Confocal microscopy confirmed the increase of MBP levels after PMA or H2O2 treatment (Figure 2C). The distribution of the protein in the cell processes and membrane patches confirms the differentiation in mature OLs (Barbarese et al., 1988). Also, Olig-2 protein (Figure 3A) and mRNA (Figure 3B) levels significantly increased following 1 or 4 days of treatment with PMA or H2O2. Confocal microscopy analysis confirmed the increase of Olig-2 protein after PMA or H2O2 treatments (Figure 3C).
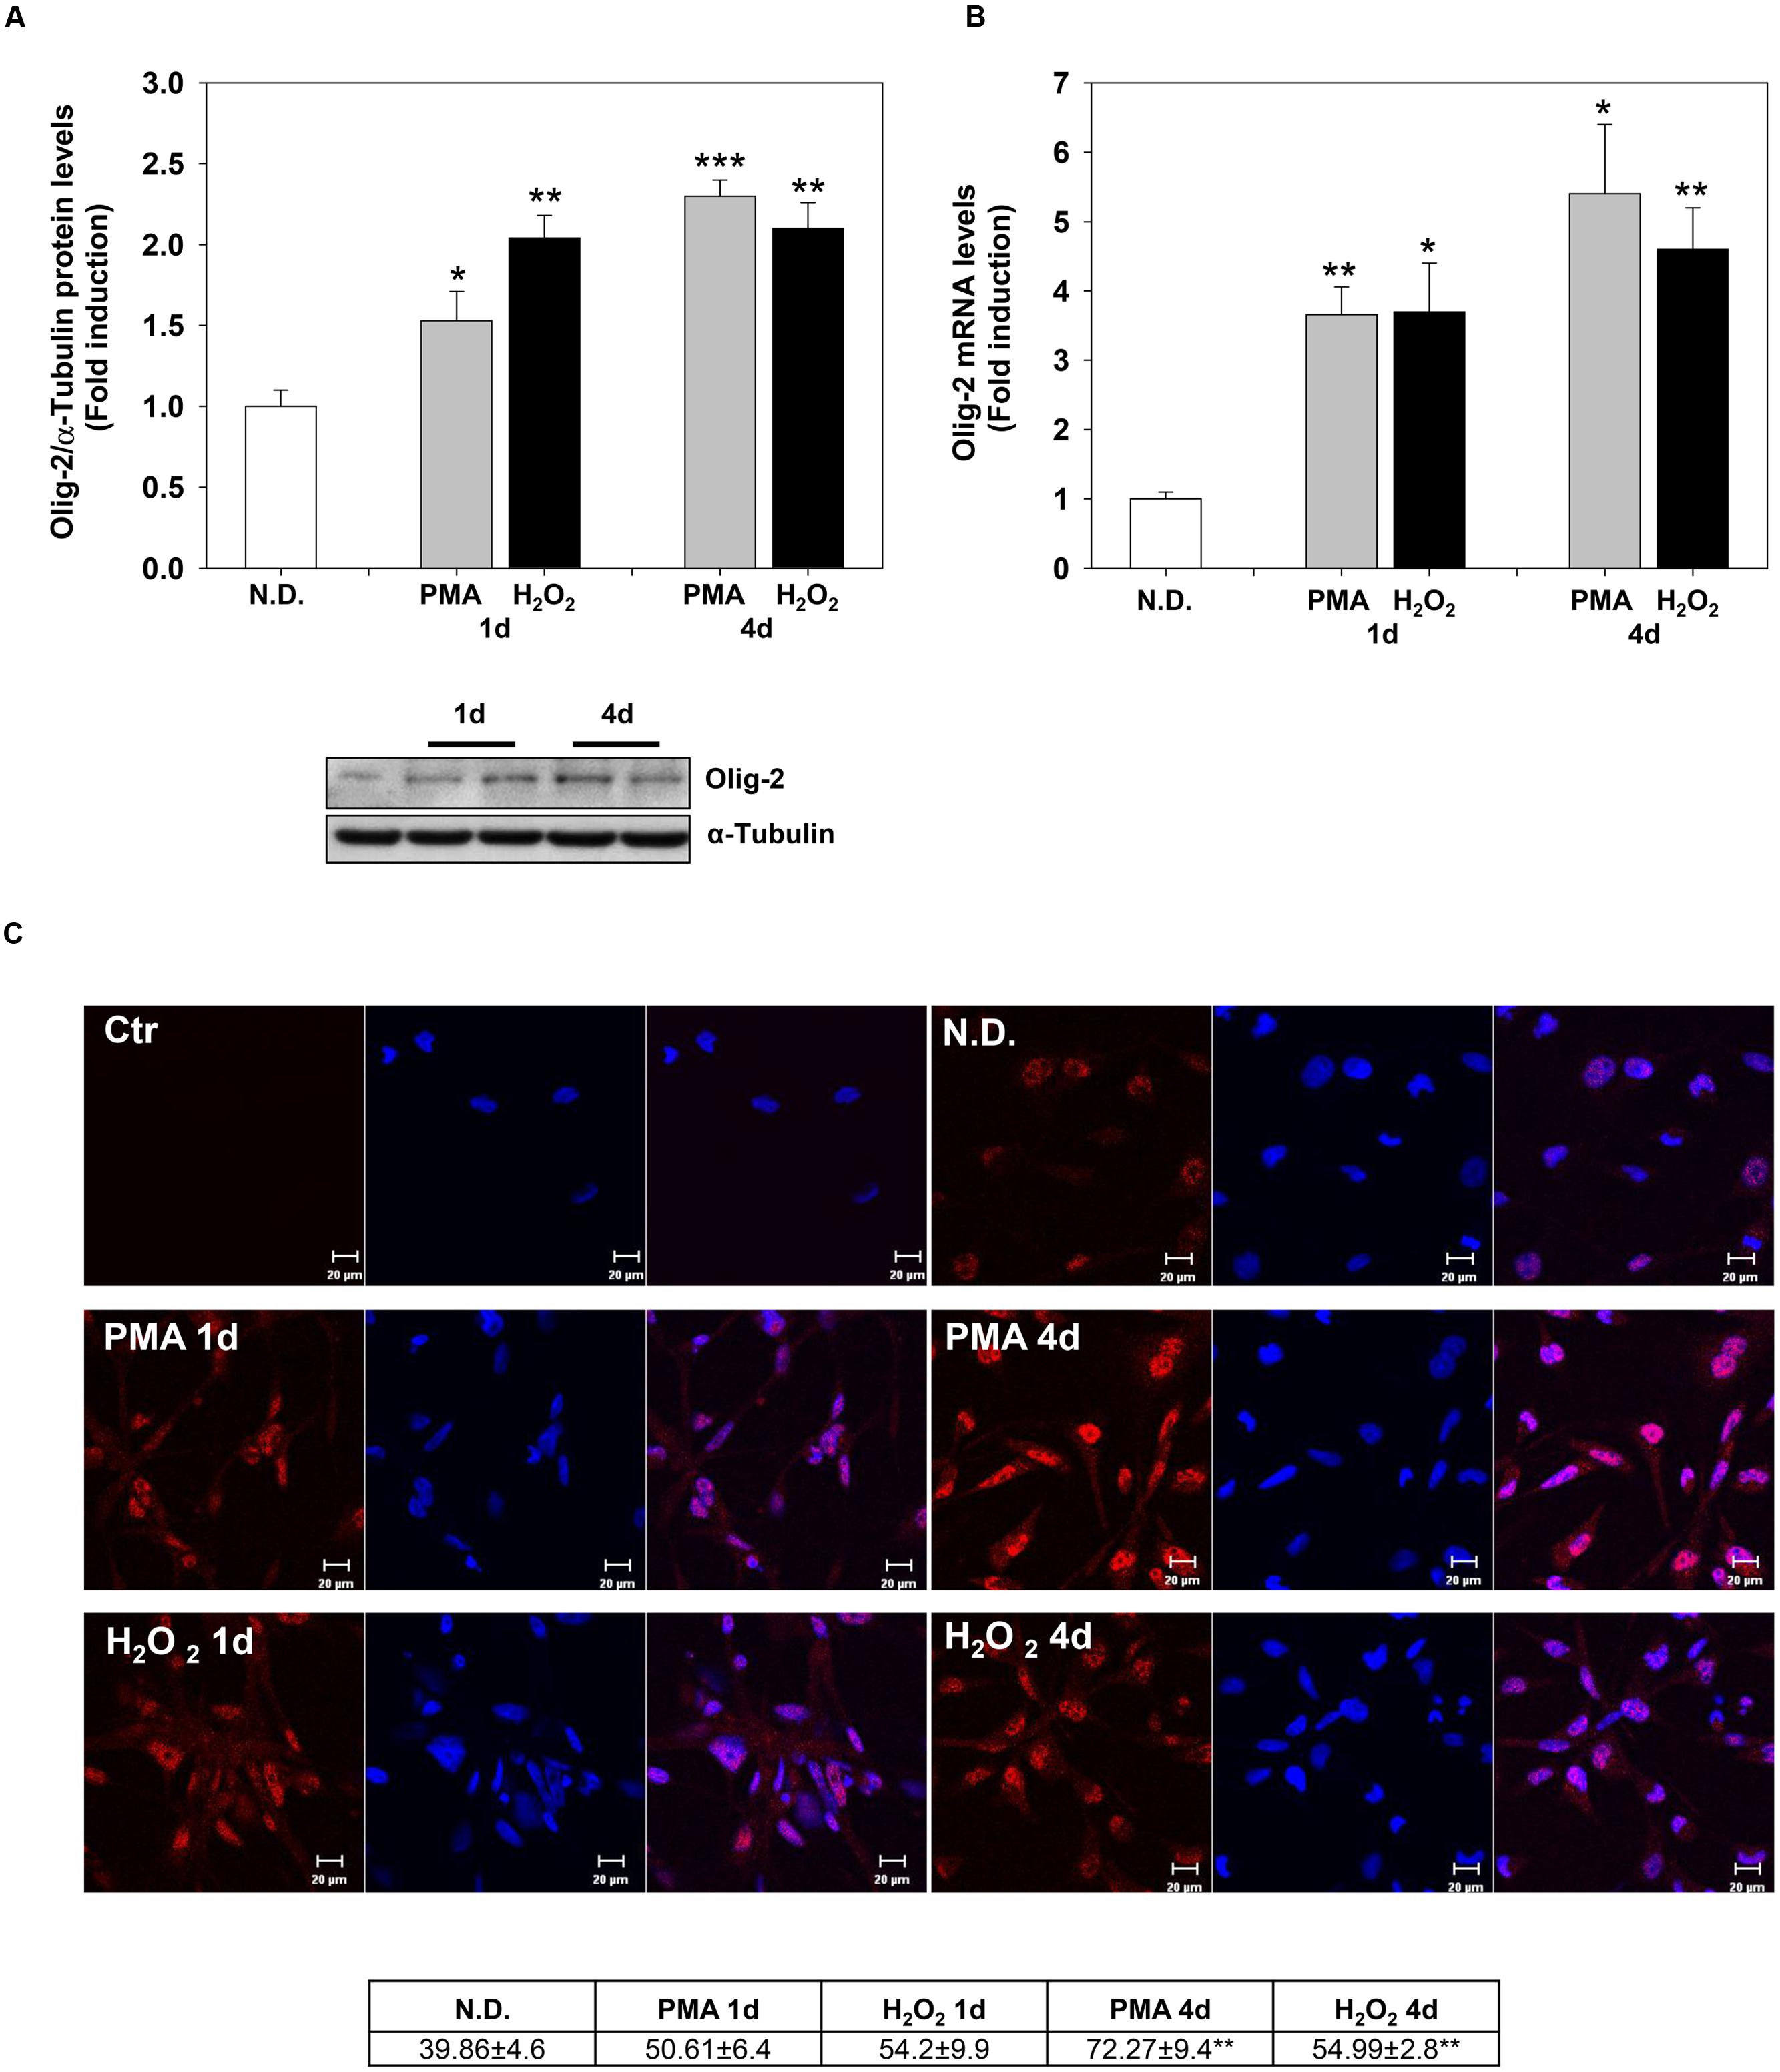
FIGURE 3. Phorbol-12-Myristate-13-Acetate and H2O2 induce Olig-2 expression levels. (A) Western blotting analysis of Olig-2 levels in MO3-13 cells treated for 1 and 4 days with 100 nM PMA in medium without serum or with 200 μM H2O2. N.D. indicates Not Differentiated cells, growing in complete medium. The histogram shows the values (means ± SEM) relative to control obtained by densitometric analysis of Olig-2 normalized to α-Tubulin of three independent experiments. (B) Real-time-PCR analysis of Olig-2 m-RNA levels in MO3-13 cells treated for 1 and 4 days with 100 nM PMA in medium without serum or with 200 μM H2O2. N.D. indicates Not Differentiated cells, growing in complete medium. Expression values were normalized using glucose-6-phosphate-dehydrogenase mRNA (G6PD). The histogram shows means ± SEM values relative to control of three independent experiments. (C) Confocal images of Olig-2 immunoreactivity of MO3-13 cells after 1 and 4 days of differentiation with 100 nM PMA in medium without serum or with 200 μM H2O2. Cells were stained with the nuclear dye DAPI (blue) and with primary anti human Olig-2 antibodies followed by CY3-conjugated anti rabbit IgG as secondary antibodies. Control (Ctr) was treated with secondary antibodies and DAPI alone. N.D. indicates Not Differentiated cells, growing in complete medium. For each image are shown three panels: on the left Olig-2 (red); on the center nuclei (blue); on the right the merged image. The table under the images shows means ± SEM values obtained by the quantitative analysis of 25 cells for each sample. ∗p < 0.05, ∗∗p < 0.01, ∗∗∗p < 0.001 vs. N.D.
Increased expression of MBP and Olig-2 is associated with higher phosphorylation levels of extracellular signal regulated kinase 1-2 (ERK1-2) and of cyclic AMP responsive element binding protein 1 (CREB), which are selectively activated by neurotransmitters or growth factors at specific stages of OL development (Sato-Bigbee et al., 1999; Johnson et al., 2000; Fyffe-Maricich et al., 2011). ERK1-2 and CREB control OPCs differentiation at early (Syed et al., 2013) and late stages, promoting myelin growth in fully differentiated myelinating OLs (Afshari et al., 2001; Ishii et al., 2013).
The levels of P-ERK1-2 and P-CREB increased rapidly after PMA or H2O2 stimulation. PMA and H2O2 significantly induced P-ERK1-2 and P-CREB levels as soon as 5 and 30 min, respectively (Figures 4A,B) and the levels of both phosphoproteins remained high during the 4 days of treatment (Figures 4C,D).
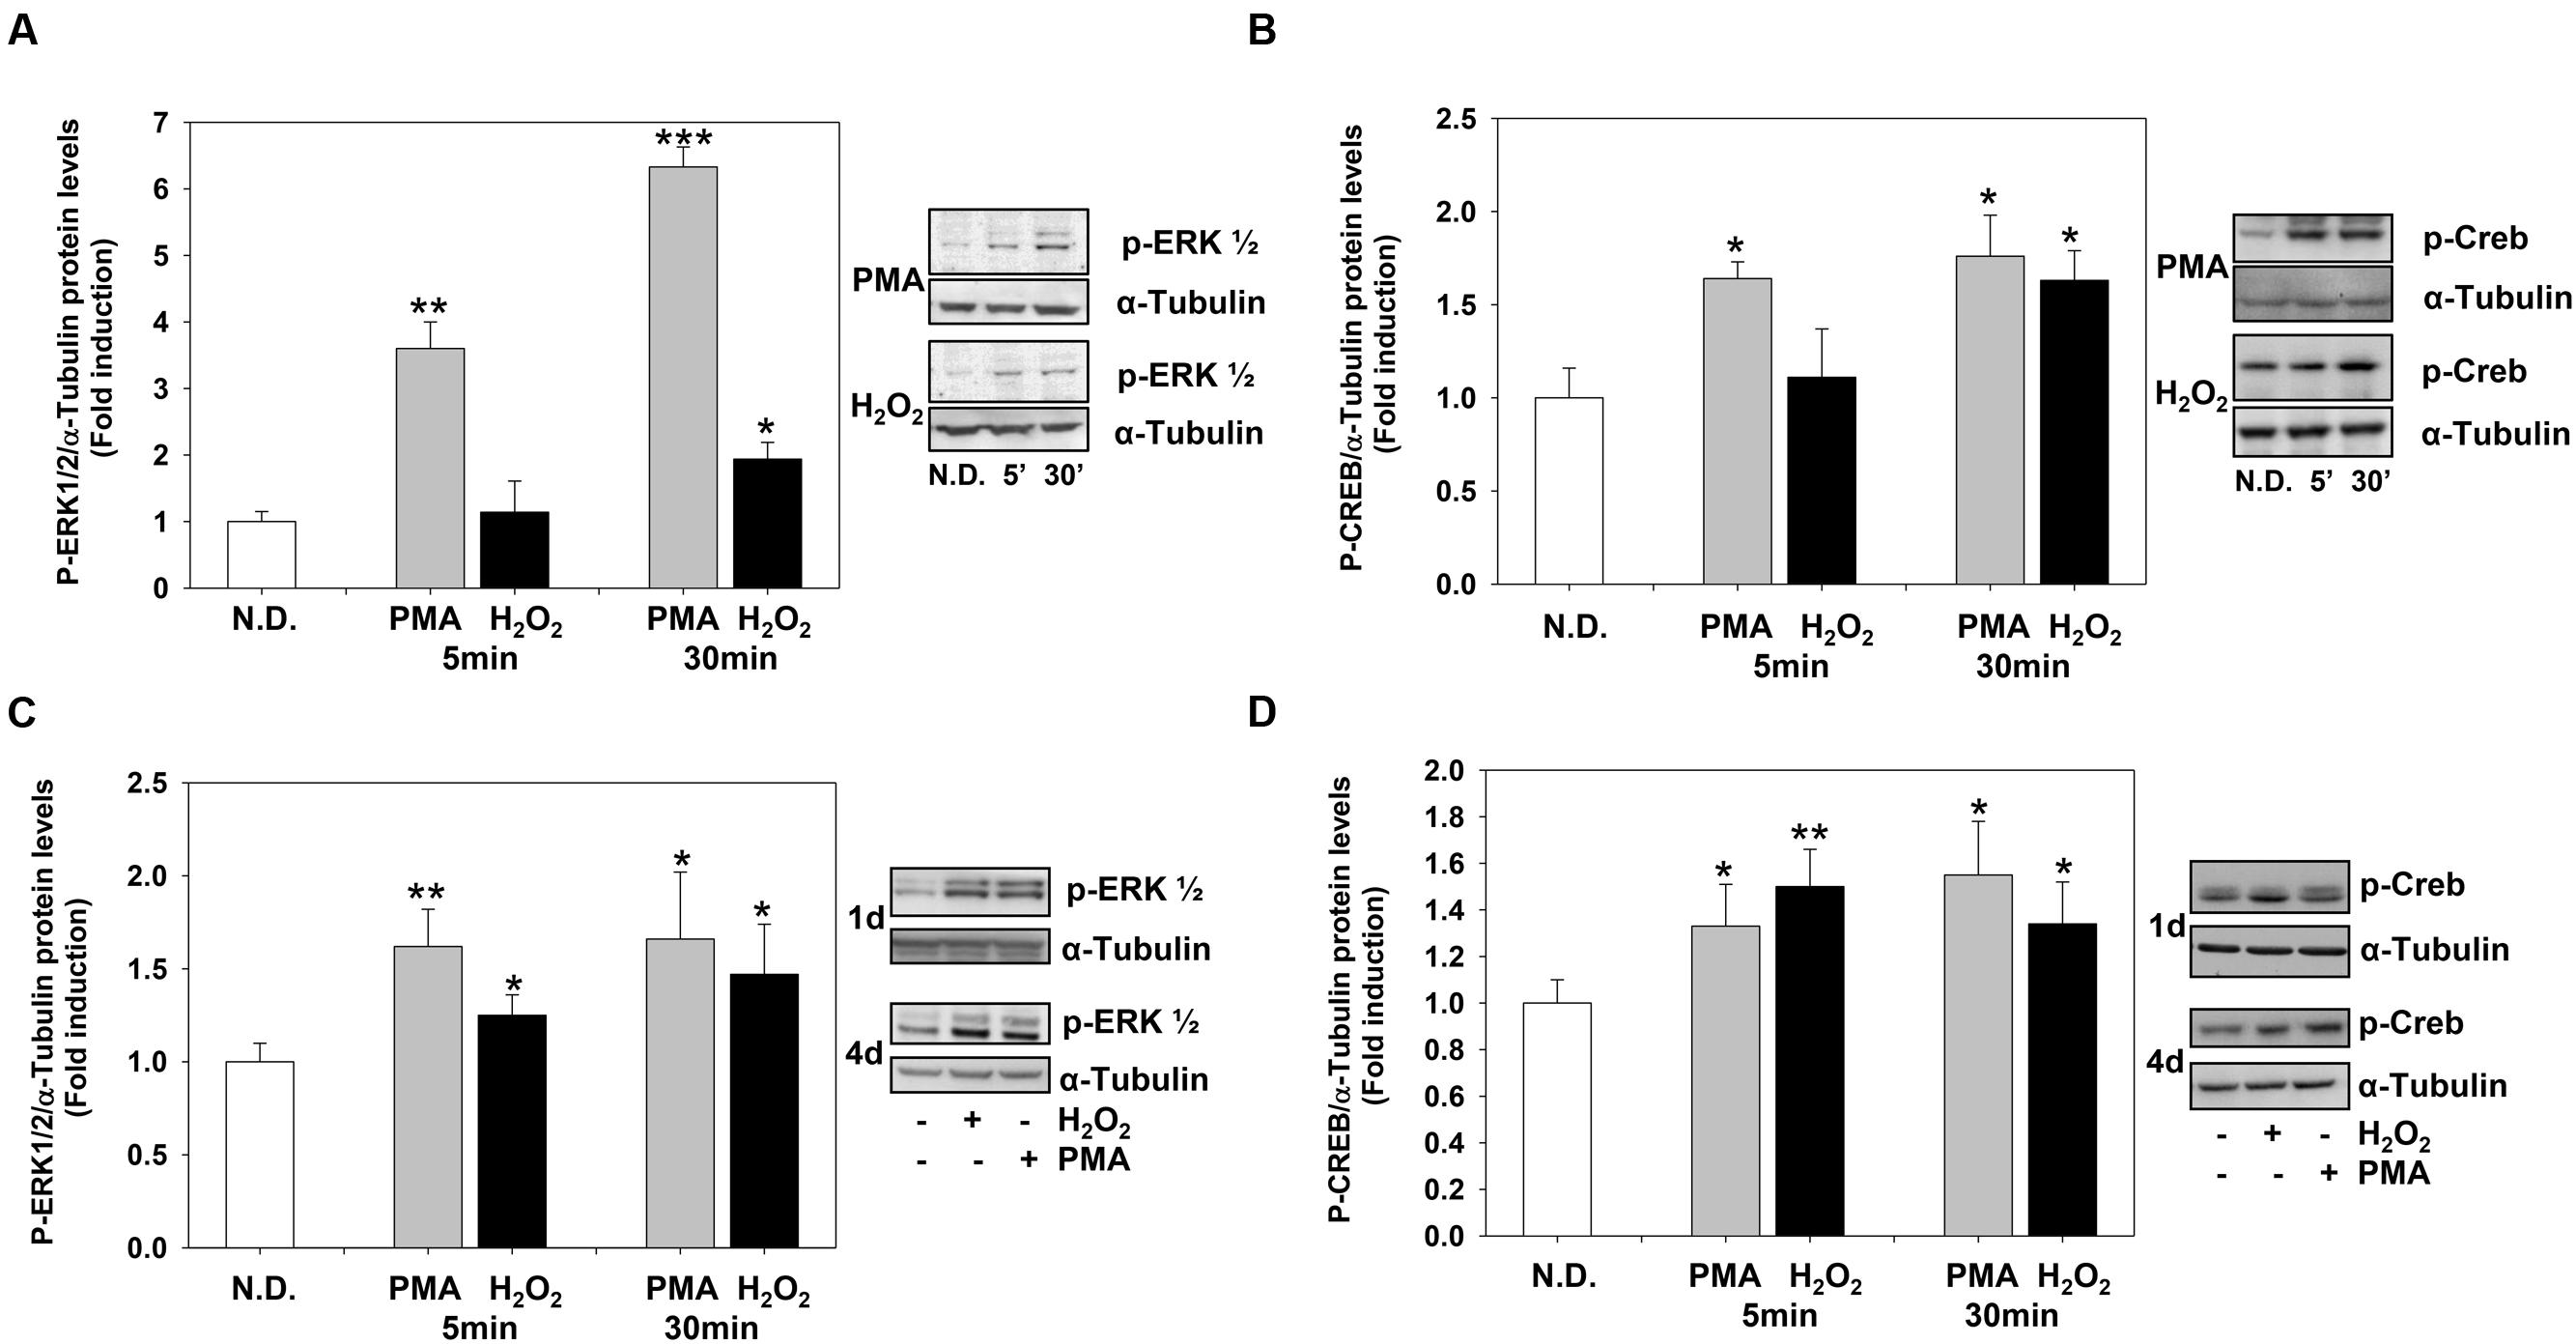
FIGURE 4. Phorbol-12-Myristate-13-Acetate and H2O2 induce ERK1-2 and CREB phosphorylation levels. (A,B) Western blotting analysis of p-ERK1-2 (A) and p-CREB (B) levels in MO3-13 cells treated for 5 or 30 min with 100 nM PMA in medium without serum or with 200 μM H2O2. (C,D) Western blotting analysis of p-ERK1-2 (C) and p-CREB (D) levels in MO3-13 cells treated for 1 or 4 days with 100 nM PMA in medium without serum or with 200 μM H2O2. N.D. indicates Not Differentiated cells, growing in complete medium. The histograms show the values (means ± SEM) relative to control (N.D.) obtained by densitometric analysis of protein bands normalized to α-Tubulin of three independent experiments. ∗p < 0.05, ∗∗p < 0.01, ∗∗∗p < 0.001 vs. N.D.
PKC Signaling Mediate H2O2-Induced OPC Differentiation
To evaluate whether PMA and H2O2 effects on MO3-13 precursor cells differentiation are linked and converge on the PKC pathway, we first assessed the activation of PKC by H2O2. Both treatments increased the phosphorylation levels of the α subunit of PKC (Figure 5A). Then, we depleted the cells of PKC by long-term treatment (24 h) with 1 μM PMA in medium containing 0.2% FBS before stimulating them for 30 min with H2O2 200 μM. This treatment leads to a strong down-regulation of P-PKCα levels that become undetectable by immunoblot (Figure 5B). PKC depletion inhibits the induction of CREB and ERK1-2 phosphorylation levels by H2O2 (Figures 5C–E). Similar results were obtained by knock-down experiments by using specific PKCα siRNA (Figures 5F–I).
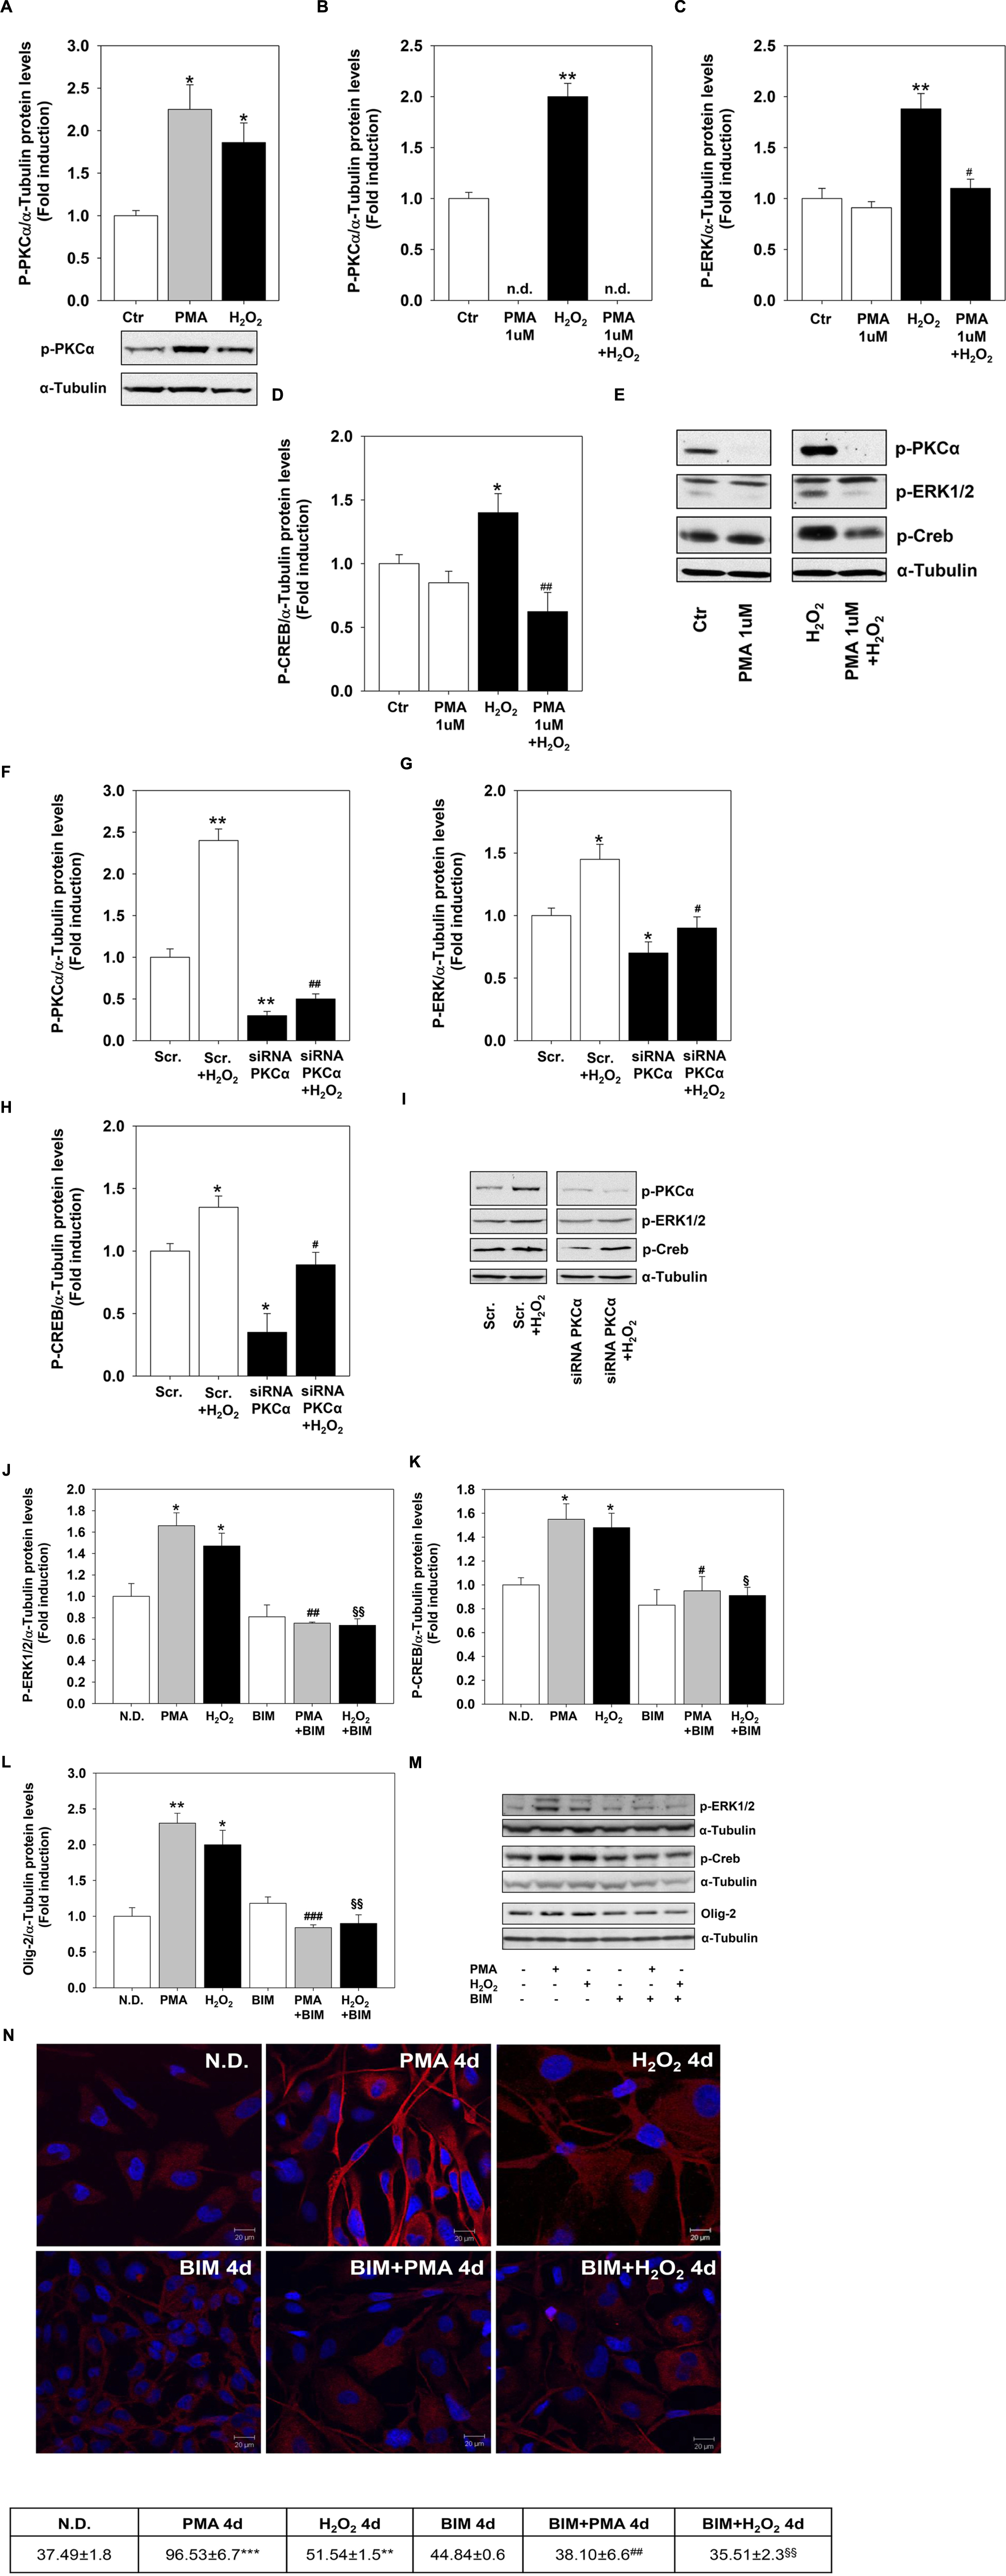
FIGURE 5. Protein kinase C mediates H2O2 effects. (A) Western blotting analysis of P-PKCα expression levels in MO3-13 cells incubated for 18 h in medium containing 0.2% FBS and then stimulated with H2O2 (200 μM) or PMA (100 nM) for 30 min. The histogram shows the values (means ± SEM) relative to control obtained by densitometric analysis of protein bands normalized to α-Tubulin of three independent experiments. Under the histogram is shown a representative experiment.∗p < 0.05 vs. control (Ctr). (B–E) PKC depletion was obtained by treatment of MO3-13 cells for 24 h with 1 μM PMA in medium containing 0.2% FBS. Then cells were stimulated for 30 min with H2O2 (200 μM) before Western blotting analysis of p-PKCα (B), P-ERK1-2 (C) and P-CREB (D) expression levels. n.d., not detectable. The histograms show the values (means ± SEM) relative to control obtained by densitometric analysis of protein bands normalized to α-Tubulin of three independent experiments. (E) A representative experiment is shown. ∗p < 0.05, ∗∗p < 0.01 vs. control (Ctr); #p < 0.05, ##p < 0.01 vs. H2O2. (F–I) MO3-13 cells were transfected by electroporation with siRNA to PKCα or control, scrambled siRNA (Scrambled) as described in Materials and Methods. 24 h after transfection, cells were stimulated with H2O2 (200 μM) for 30 min in medium containing 0.2% FBS and total proteins were extracted and subjected to immunoblot analysis of p-PKCα (F), P-ERK1-2 (G) and P-CREB (H) expression levels. The histograms show the values (means ± SEM) relative to control obtained by densitometric analysis of protein bands normalized to α-Tubulin of three independent experiments. (I) A representative experiment is shown. ∗p < 0.05, ∗∗p < 0.01 vs. Scrambled (Scr.); #p < 0.05, ##p < 0.001 vs. Scrambled (Scr.) + H2O2. (J–M) Western blotting analysis of p-ERK1-2 (J) p-CREB (K), and Olig-2 (L) expression levels in MO3-13 cells stimulated with H2O2 (200 μM) or PMA (100 nM) for 4 days in the presence or absence of BIM (100 μM). N.D. indicates Not Differentiated cells, growing in complete medium. The histograms show the values (means ± SEM) relative to control obtained by densitometric analysis of protein bands normalized to α-Tubulin of three independent experiments. (M) A representative experiment is shown. (N) Confocal images of MBP immunoreactivity of MO3-13 cells after 4 days of treatment with 100 nM PMA in medium without serum or with 200 μM H2O2 in the presence or absence of BIM (100 μM). Cells were stained with nuclear dye DAPI and with primary anti human MBP antibodies and CY3-conjugated anti rabbit IgG as secondary antibodies. N.D. indicates Not Differentiated cells, growing in complete medium. The table under the images shows means ± SEM values obtained by the quantitative analysis of 25 cells for each sample. ∗p < 0.05, ∗∗p < 0.01, ∗∗∗p < 0.001 vs. N.D.; #p < 0.05, ##p < 0.01, ###p < 0.001 vs. PMA; § p < 0.05, §§ p < 0.01 vs. H2O2.
To further evaluate whether PCK signaling mediates H2O2 effects on MO3-13 precursor cells differentiation we used the PKC α-β-γ inhibitor BIM. Figures 5J–M shows that pretreatment of the cells with, BIM completely reversed the induction by PMA or H2O2 of P-ERK1-2, P-CREB and Olig-2. The PKC inhibitor also reversed long term effects of PMA and H2O2 (4 days) on MBP protein levels as shown by confocal microscopy analysis (Figure 5N).
These data link H2O2 and PKC signals and suggest that PKC is upstream and downstream H2O2 because the PKC depletion or inhibition prevents H2O2 induction of differentiation.
ROS Derived from NOX3 and NOX5 Mediate PMA-Induced MO3-13 Cells Differentiation
To define precisely the link between H2O2 and PKC we measured the effects of PMA on ROS levels. PMA stimulation significantly and rapidly (15 min) induced ROS levels, measured as DCF fluorescence (Figure 6A). ROS levels remained higher compared to the controls for 4 days of continuous treatment (data not shown). To evaluate the nature of DCF signal we used two different superoxide fluorescent probes, DHE or the mitochondria-targeted equivalent MitoSOX–Red. Flow cytometry experiments shows that PMA increases superoxide levels (DHE staining) without affecting mitochondrial superoxide production (Mito-SOX-Red staining) (Figure 6B).
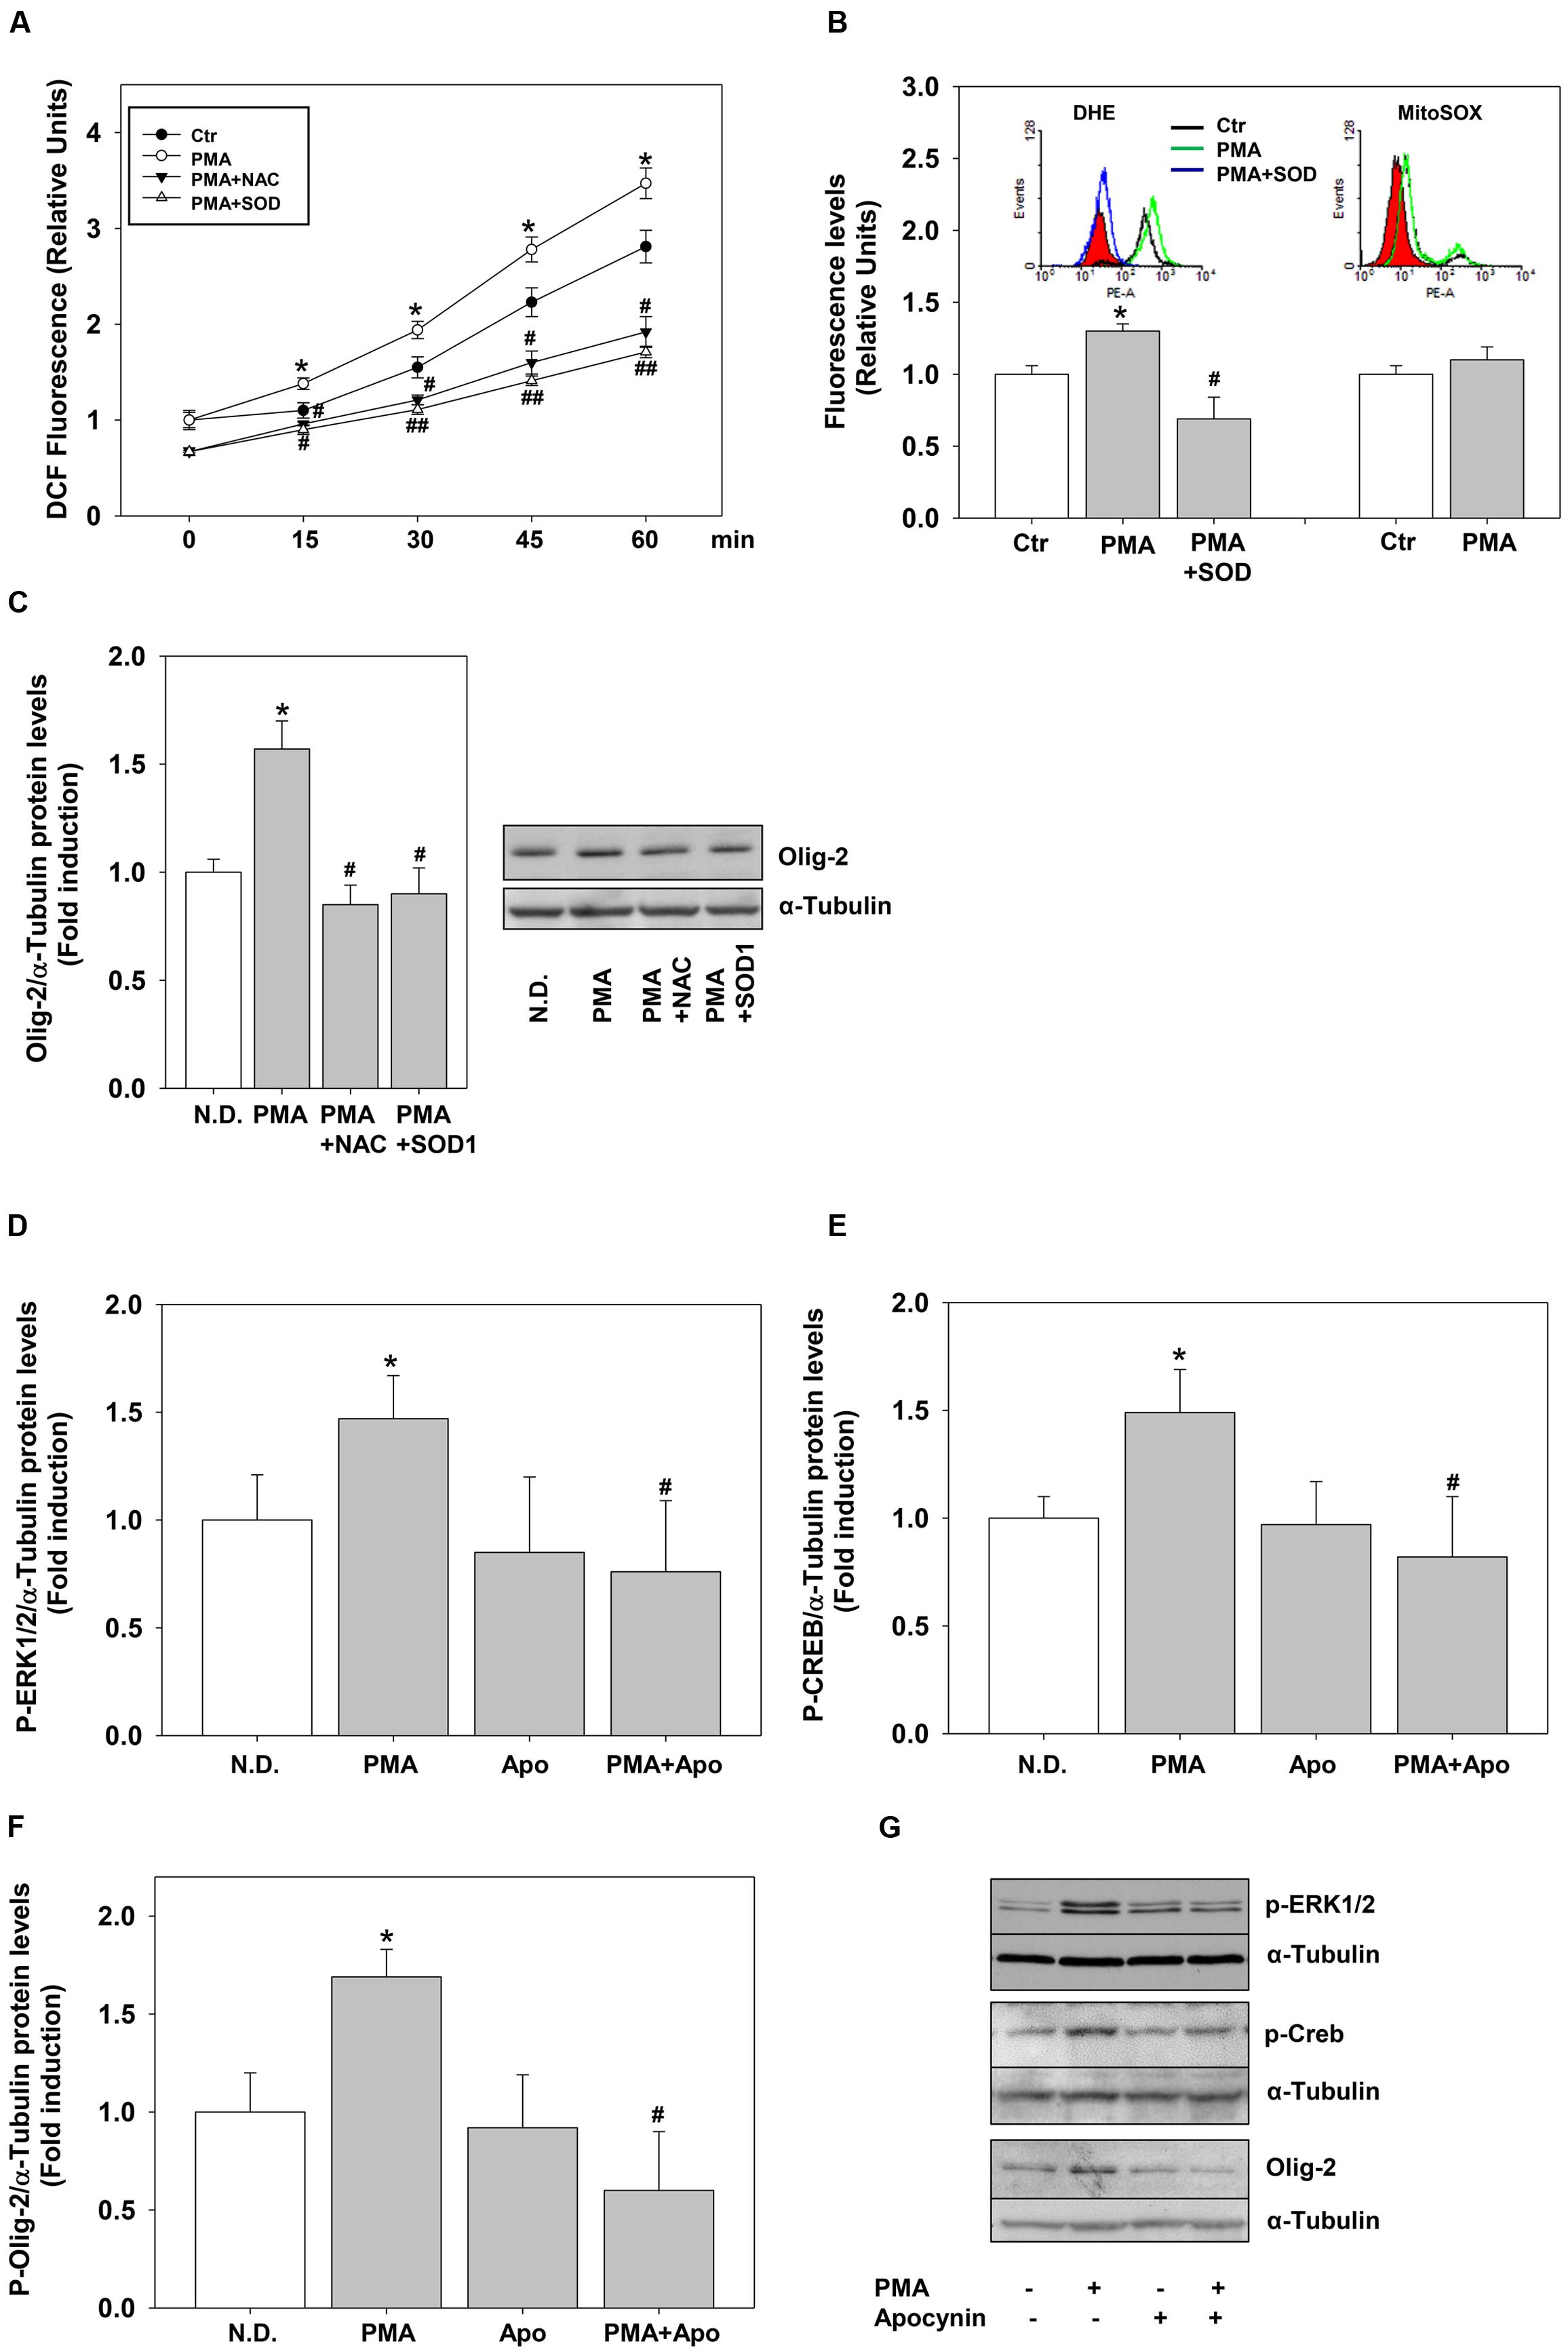
FIGURE 6. Phorbol-12-Myristate-13-Acetate pro-differentiative effects rely on NOX dependent ROS. (A) MO3-13 cells were grown in complete medium, preincubated with antioxidants (200 μM NAC or 400 μg/ml SOD1), incubated with 10 μM of the ROS sensitive probe DCHF-DA and then stimulated with PMA 100 nM in absence of serum. ROS levels were measured by fluorometric analysis at various times.The graphs show the mean ±SEM values relative to control of three independent experiments. ∗p < 0.05 vs. corresponding time points of not stimulated samples (Ctr) #p < 0.05, ##p < 001 vs. corresponding time points of PMA stimulated samples. (B) MO3-13 cells were incubated for 18 h in medium containing 0.2% FBS. For the DHE staining the cells were preincubated for 30 min with SOD1 (400 ng/ml) and stimulated for 30 min with PMA (100 nM). For MitoSOX staining cells were incubated for 30 min with PMA (100 nM). Superoxide levels were measured by flow cytometry. The graphs show the mean ±SEM values relative to control (Ctr) of three independent experiments. The inserts show the hystograms of representative experiments; the red histogram denotes the sample treated with secondary antibodies alone. ∗p < 0.05 vs. control; #p < 0.05 vs. PMA. (C) MO3-13 cells were grown in complete medium, pre-incubated in the absence and presence of 200 μM NAC or 400 μg/ml SOD1 for 30 min and stimulated for 4 days with 100 nM PMA in the absence of serum before being collected and analyzed by Western Blotting. N.D. indicates Not Differentiated cells, growing in complete medium. The histogram shows the values (means ± SEM) relative to control obtained by densitometric analysis of Olig-2 normalized to α-tubulin compared to undifferentiated control of three independent experiments. ∗p < 0.02 vs. N.D.; #p < 0.05 vs. PMA (D–G) Western blotting analysis of p-ERK1-2 (D), p-CREB (E) and Olig-2 (F) expression levels in MO3-13 cells stimulated with PMA (100 nM) for 4 days in serum-free medium in the presence or absence of Apocynin (50 μM). N.D. indicates Not Differentiated cells, growing in complete medium. The histograms shows the values (means ± SEM) relative to control obtained by densitometric analysis of protein bands normalized to α-Tubulin compared to undifferentiated control of three independent experiments. ∗p < 0.05 vs. N.D.; #p < 0.05 vs. PMA. (G) A representative experiment is shown.
To demonstrate a direct link between PMA-induced ROS and cell differentiation, we evaluated the effects of the generic ROS scavenger NAC and of the superoxide scavenger enzyme superoxide dismutase1 (SOD1). Externally added SOD1 is internalized by endocytosis exerting intracellular antioxidant activity (Dini and Rotilio, 1989; Mondola et al., 2002). The antioxidants were able not only to reduce PMA-dependent ROS production but also PMA-induction of Olig-2 (Figures 6A–C).
The main sources of ROS are NOX enzymes and the data shown above suggest that PMA and/or H2O2 may induce these enzymes. We measured the expression of many NOX-DUOX enzymes in MO3-13 cells by semi-quantitative and real-time PCR. Besides the dual oxidases DUOX1 and 2 (Damiano et al., 2012), we found that MO3-13 cells express NOX3 and NOX5 (Supplementary Figure S3; Figure 7). Therefore, to test whether these enzymes were mediators of PMA effects on MO3-13 precursor cells differentiation, we exposed the cells stimulated by PMA to apocynin. Apocynin is an inhibitor of NOX enzymes; specifically it inhibits the interaction of the cytosolic subunit p47phox with the catalytic membrane subunit gp91phox of NOXs and therefore apocynin inhibits NOX1, NOX2, and NOX3, enzymes that are dependent for their activity on membrane translocation of cytosolic subunits. Figures 6D–G shows that in the presence of apocynin, PMA failed to induce P-ERK1-2, P-CREB and Olig-2 levels (after 4 days of treatment), suggesting an involvement of NOXs-derived ROS in PMA-induced differentiation.
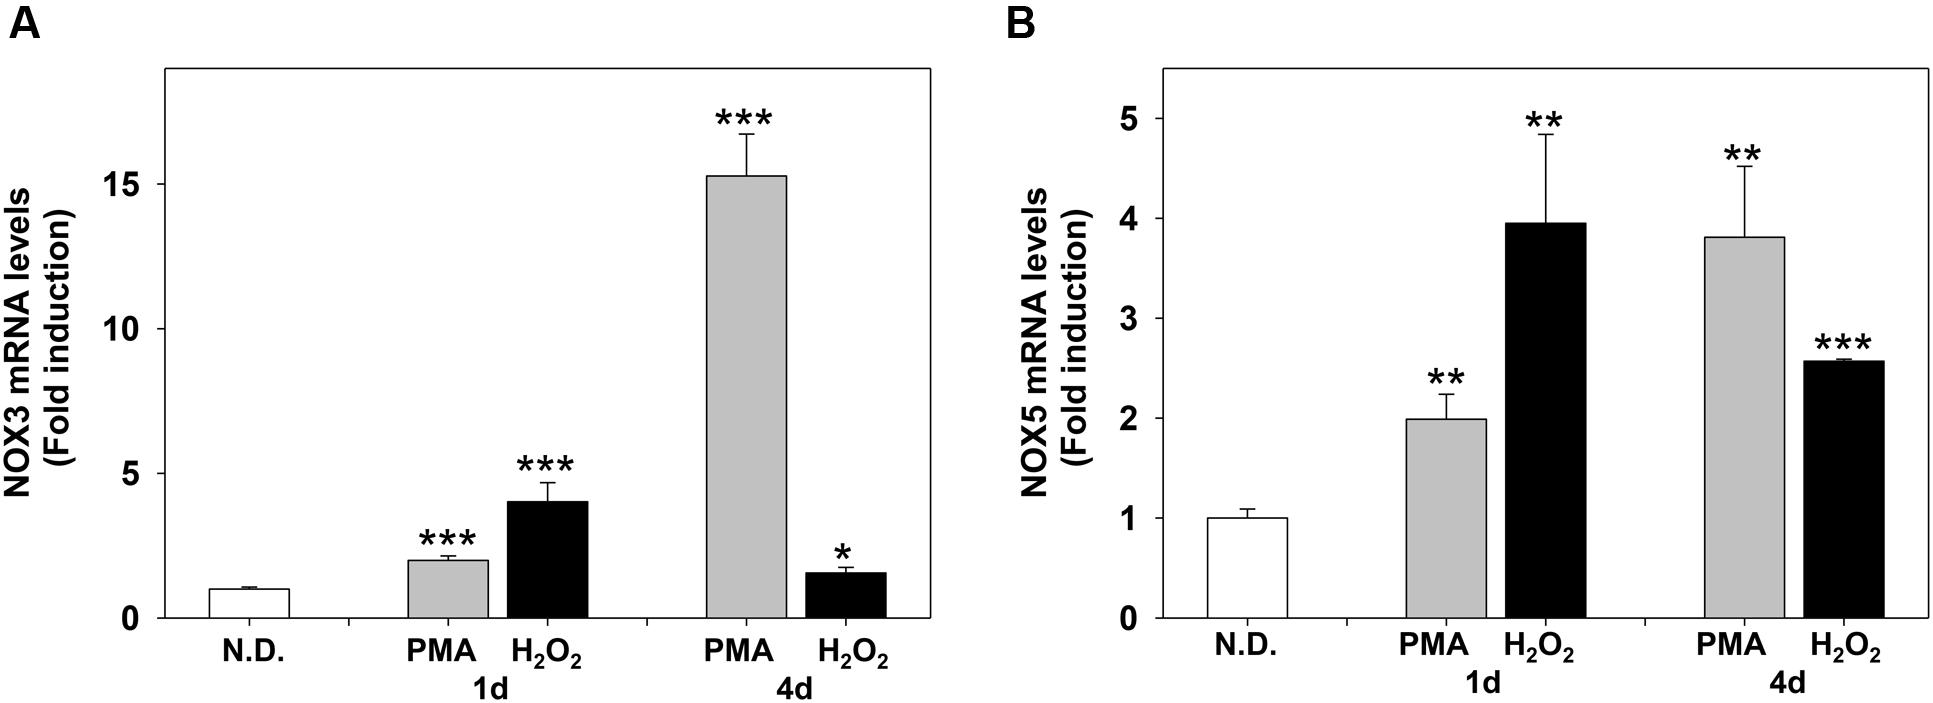
FIGURE 7. Phorbol-12-Myristate-13-Acetate and H2O2 induce NOX3 and NOX5 m-RNA levels in MO3-13 cells. Real-time-PCR analysis of NOX3 (A) and NOX5 (B) mRNA levels in MO3-13 cells treated for 1 and 4 days with 100 nM PMA in medium without serum or with 200 μM H2O2. N.D. indicates Not Differentiated cells, growing in complete medium. Expression values were normalized using glucose-6-phosphate-dehydrogenase mRNA (G6PD). The histograms show means ± SEM values relative to control in eight independent experiments. ∗p < 0.05, ∗∗p < 0.01, ∗∗∗p < 0.001 vs. N.D.
We next evaluated the effects of PMA and H2O2 on NOX3 and NOX5 expression. Figures 7A,B show that PMA and H2O2 induce NOX3 and NOX5 mRNA levels in MO3-13 cells. The timing of induction was slightly different: H2O2 induced NOX3 and NOX5 mRNA in 1 day, while PMA progressively increased NOX3 and NOX5 in 4 days of treatment.
To demonstrate the direct link between the increased expression of NOX3 and NOX5 by PMA and H2O2 and their role in OL differentiation, we performed knock-down experiments by using specific NOX3 and NOX5 siRNA. We were able to significantly reduced NOX3 and NOX5 protein and mRNA levels in OLs (Figures 8A–D). Unexpectedly, we found that NOX5 silencing down-regulated basal protein and mRNA levels of NOX3 (Figures 8A,C). NOX3 silencing did not modify basal NOX5 expression levels (Figures 8B,D). These data indicate that NOX5 regulates the expression of NOX3. Inhibition of both genes prevented PMA effects on MBP and Olig-2 mRNA levels, demonstrating that NOX3 and NOX5 are essential for OL differentiation (Figures 8E,F).
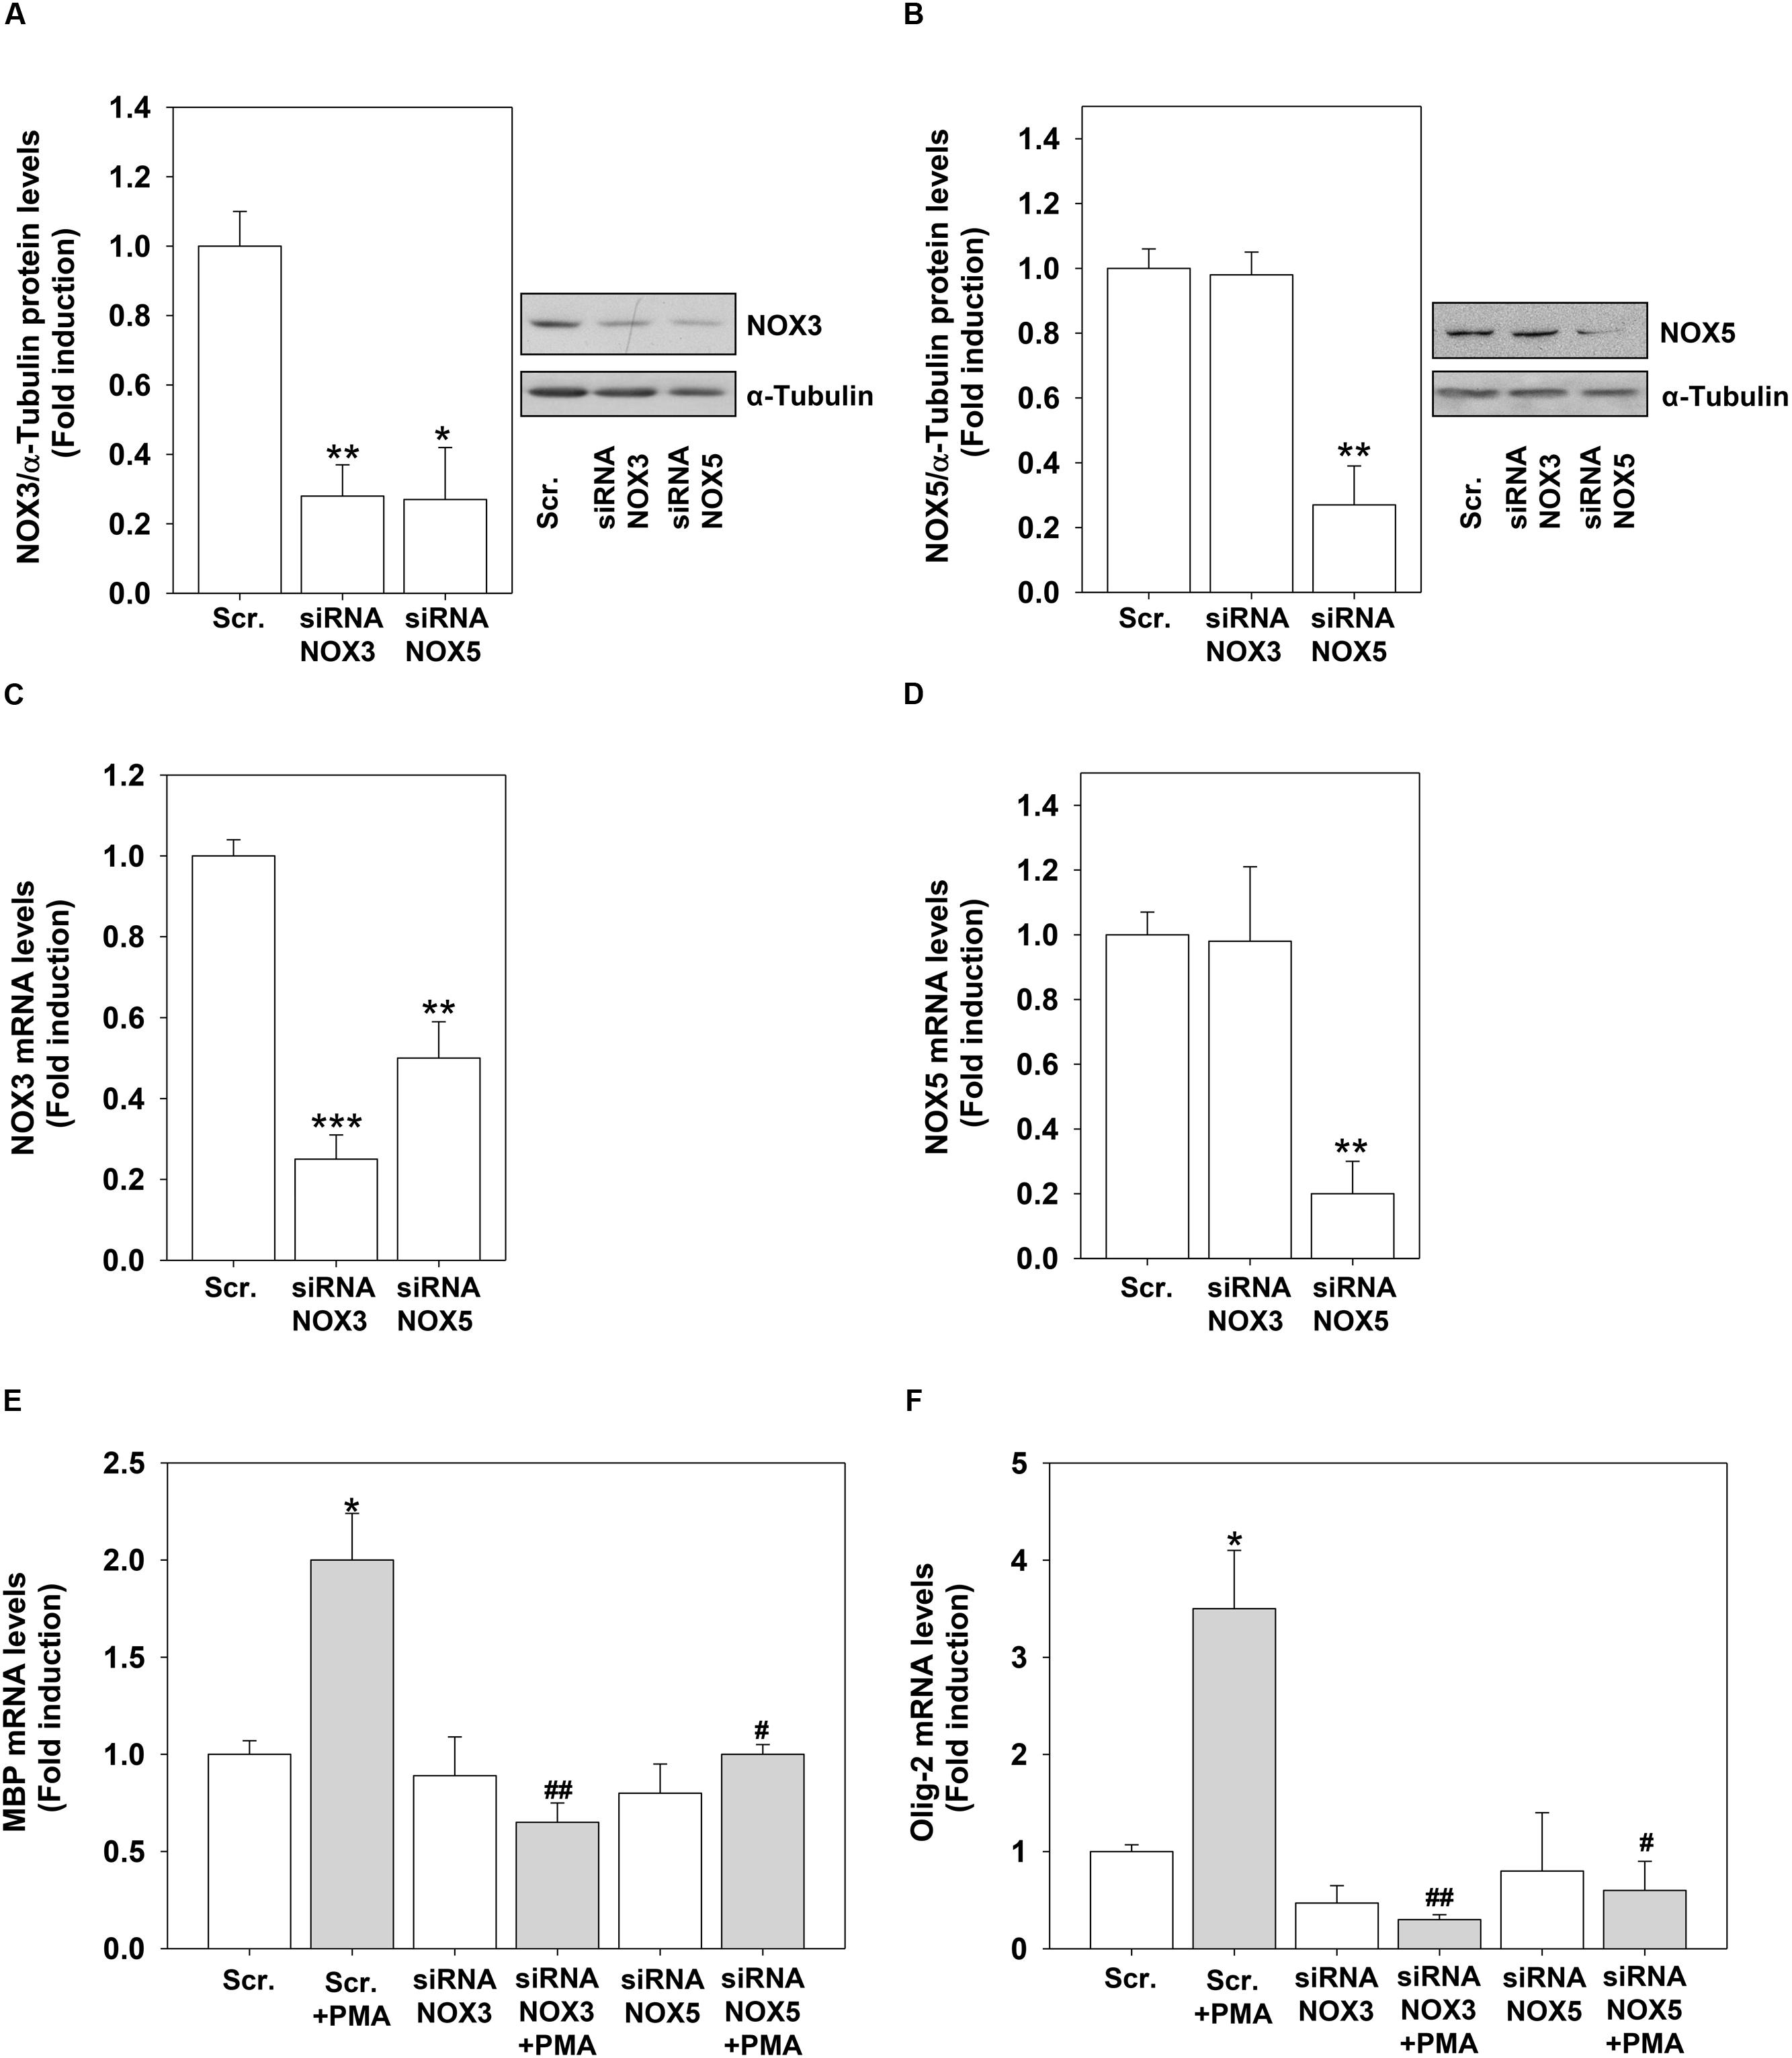
FIGURE 8. NOX3 or NOX5 silencing inhibits PMA-induced differentiation. MO3-13 cells were transfected by electroporation with siRNA to NOX3 (siRNA NOX3) or NOX5 (siRNA NOX5) or control, scrambled siRNA (Scrambled) as described in Section “Materials and Methods.” Twenty four hours after transfection, total proteins were extracted and subjected to immunoblot analysis of NOX3 (A) and NOX5 (B). The histograms show the mean ±SEM values relative to control scrambled obtained by densitometric analysis of proteins bands normalized for α-Tubulin of three independent experiments. A representative experiments is shown on the left of each histogram. ∗p < 0.05 vs. Scrambled. (C,D) mRNA from cells treated as in (A) was extracted and NOX3 (C) or NOX5 (D) mRNA levels were analyzed by Real-time-PCR as described in Section “Materials and Methods.” The graphs show the mean ± SEM values relative to scrambled control of three independent experiments. (E,F) mRNA from cells treated as in (A) was extracted and MBP (E) or Olig-2 (F) mRNA levels were analyzed by Real-time-PCR as described in Section “Materials and Methods.” The graphs show the mean ±/ SEM values relative to scrambled control of three independent experiments. ∗p < 0.05, ∗∗p < 0.01, ∗∗∗p < 0.001 vs. Scrambled; #p < 0.05, ##p < 0.01, vs. Scrambled + PMA.
Discussion
We report here that ROS produced by the NOX isoforms NOX3 and NOX5, induce OL differentiation. As cell model, we used the human OL precursor cells MO3-13 that, following PMA treatment in the absence of serum, assume the morphological and biochemical features of mature OLs. To monitor the progress of differentiation, we measured the expression of OLs differentiation markers, MBP and Olig-2 and the phosphorylation of ERK1-2 and CREB.
Reactive oxygen species can induce cellular and DNA damage or differentiation, depending on levels and the source of production. It is known that in rat glial precursor cells the redox state is a central modulator of OLs differentiation (Smith et al., 2000). Our data indicate that ROS produced by NOX3 and NOX5 induce differentiation of OL. However, in MO3-13 cells H2O2 is bi-functional: at low doses promotes differentiation, at higher doses induces cell death. It is worth noting that differentiated cells become more sensitive to death induced by H2O2 compared to MO3-13 precursor cells, while proliferating oligodendroglia like (OLN 93) cells are more resistant to the apoptotic effect of H2O2 compared to differentiated cells (Kameshwar-Rao et al., 1999). The enhanced sensitivity to oxidative stress of differentiated cells may reflect the amplification of a NOX-dependent ROS release leading to an unbalance of the redox state and cell death. In agreement with our findings, NOX inhibitors reduce H2O2-induced cell death of differentiated neuronal cells (Bertoni et al., 2011).
This is the first report showing the expression of NOX isoforms (3 and 5) in human OLs. The Ca2+-dependent NOX5, is expressed in many tissues (Bánfi et al., 2001; Bedard and Krause, 2007) including cells of the cardiovascular system (Bedard et al., 2012). However, NOX5 is absent in rodents and this may explain the lack of data on its expression and function in OLs, because many studies on neuro-glial specification and differentiation were performed with these models. As to NOX3, this enzyme is highly expressed in vestibular and cochlear sensory epithelia and in the spiral ganglion in the inner ear (Bánfi et al., 2004) and its activity has been linked to deafness and to the ototoxicity of drugs and toxins (Mukherjea et al., 2006). Data available on NOX3 in the nervous system are limited, except a report on its increased expression in Alzheimer brain (de la Monte and Wands, 2006).
Our data show that differentiation of OL requires NOX3 and NOX5. PKC seems to be the central inducer of differentiation. PKC is upstream of ROS, because it phosphorylates the cytosolic subunit p47phox stimulating its membrane localization and enzymatic activation (Fontayne et al., 2002). But PKC is also downstream of ROS as shown by PKC activation by H2O2. The output of ROS-PKC-ROS cascade is the phosphorylation of ERK1-2 and CREB, which can be sustained for 1–4 days. ROS inhibition of tyrosine phosphatases acting on MEK may contribute to the long lasting ERK1-2 and CREB1 phosphorylation (Jiang et al., 2011). Moreover, NOX3 and NOX5 are linked, since depletion of NOX5 reduces the expression of NOX3. We have reported a similar crosstalk between NOXs in another cell system (Damiano et al., 2012). This is not surprising due to the modulation of NOX3 and NOX5 mRNA levels by ROS. In particular, NOX5-derived ROS modulate basal NOX3 expression as shown by the down regulation of NOX3 protein and mRNA levels by NOX5 silencing. On the contrary, even if NOX3 or NOX5 constitutively produces ROS (Ueno et al., 2005; Wang et al., 2014), NOX3 silencing does not affect basal NOX5 expression. Both NOX3 and NOX5 are localized in the plasma-membrane (Brown and Griendling, 2009), and the activity of NOX5 is calcium dependent. We hypothesize that calcium modulation of NOX5 cooperates with ROS in the induction of NOX3 and probably of other genes involved in OL differentiation. PKC is activated by calcium (Cullen, 2003) and apocynin inhibits NMDA-induced OLs differentiation (Cavaliere et al., 2013) or differentiation of MO3-13 precursor cells. Collectively, these data suggest that ROS and calcium are essential for OL differentiation.
Many membrane receptors activate NOXs, and ROS produced following ligand-receptor interaction, function as second messenger molecules mediating several cellular events (Serù et al., 2004; Svegliati et al., 2005; Baroni et al., 2006; Gabrielli et al., 2008; Damiano et al., 2012, 2015). P-ERK1-2 and P-CREB levels increase after acute treatment with PMA or H2O2 in MO3-13 cells and the effects of PMA preceded that of H2O2. Therefore, we propose that ROS produced by NOX enzymes stabilize membrane receptors involved in OLs differentiation, thus amplifying downstream signals relying on PKC, ERK1-2 and CREB (Figure 9). At the moment we do not know which receptor is involved in vivo in the redox-dependent signaling leading to OL differentiation and therefore this point needs further investigation. ERK1-2 signaling and CREB phosphorylation seem to have a role in the stimulation of MBP expression and represent signals triggering the final steps of OL maturation (Sato-Bigbee et al., 1999). Accordingly, we found that sustained treatment of MO3-13 cells with H2O2 exerts long term effects on P-ERK1-2 and P-CREB, demonstrating a role of ROS signaling at early and late steps of OLs differentiation.
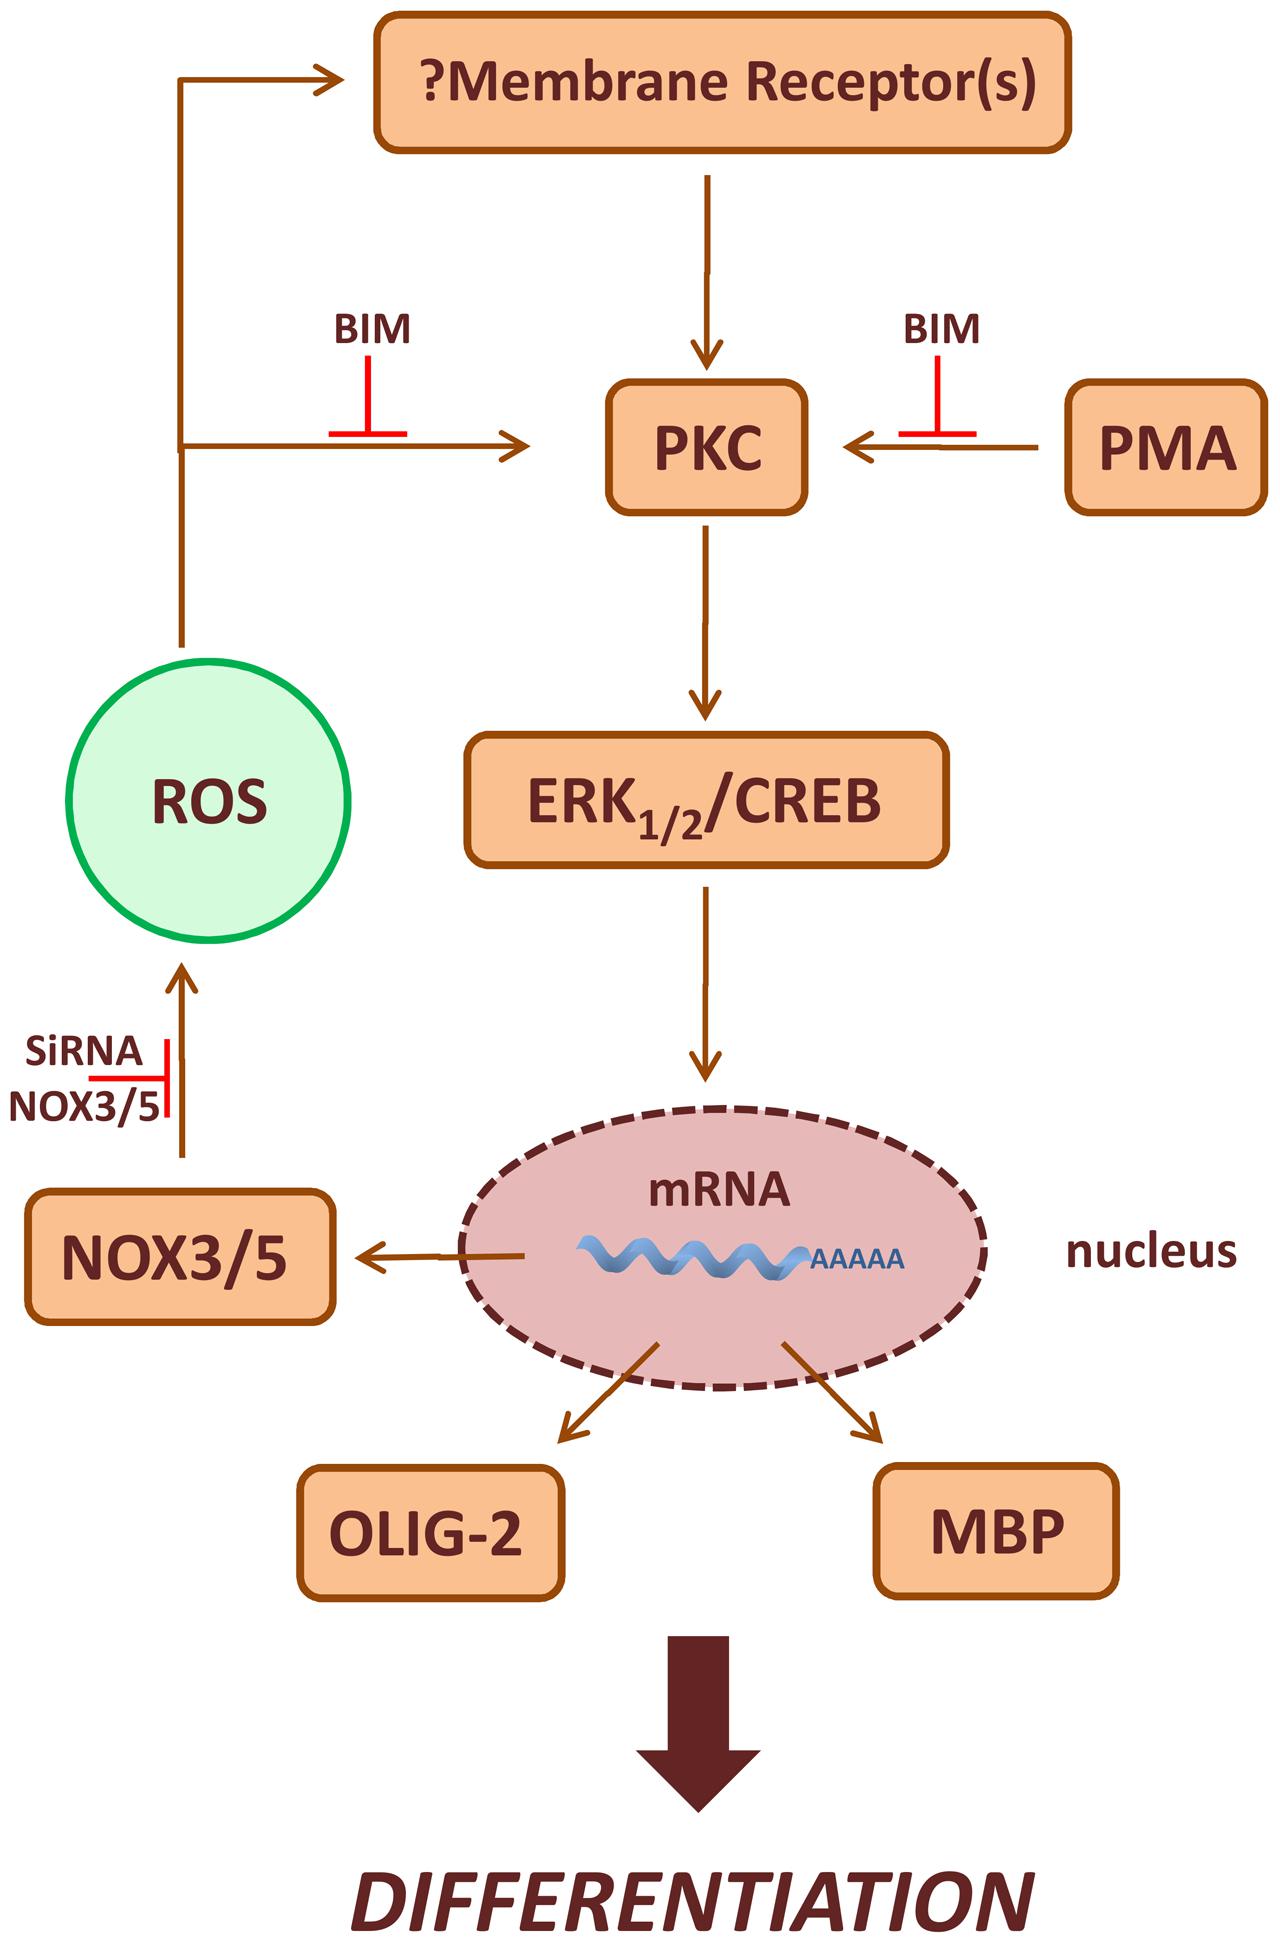
FIGURE 9. Scheme of PKC/ROS signaling pathways involved in OLs differentiation. ROS produced by NOX3/5 amplify PMA activated PKC, ERK1-2 and CREB signaling increasing the expression of the differentiation markers MBP and Olig-2. In the figure is also depicted the possible role of NOX3/5 derived ROS in the stabilization of membrane receptor(s) leading to OLs differentiation.
A key feature in the development of demyelinating MS lesions is the loss of OLs (Noseworthy et al., 2000). OLs and OPC are highly sensitive to oxidative stress for the low levels of antioxidant defense systems and high intracellular iron content (Thorburne and Juurlink, 1996). It is evident that fine tuning of the type and the levels of ROS generated by NOXs may have profound effects on OPC differentiation and survival.
Traditional disease-modifying therapies for MS based on immunomodulatory and immunosuppressive drugs are mainly aimed at reducing the relapse rate and the formation of new lesions in the relapsing-remitting multiple sclerosis (RRMS) patients, but they are relatively ineffective in preventing the progression of disability. Recently, major attention has been paid to regenerative treatments able to prevent neurodegeneration and favoring remyelination (Zhang et al., 2013). Our data linking OL differentiation with NOX3 and NOX5 expression and activity, suggest that NOX enzymes can represent potential targets of new regenerative therapies ending and reversing the progression of the lesions in MS.
Author Contributions
MS supervised the entire project, designed research, and wrote the paper. RA conceived and designed the experiments, performed research, interpreted and analyzed data, supervised all the experimental procedure. SD conceived and designed the experiments, performed research interpreted and analyzed data. AM performed research and analyzed data. PM critically revised the manuscript. RP Analyzed data and critically revised the manuscript. EA analyzed data and critically revised the manuscript
Funding
This work was partly granted by the Spin off Prindex s.r.l. and by Prius s.r.l., Integrated System of Diagnosis and Therapy to RA, SD, RP, EA, and MS and partly supported by AIRC IG [11364 to EA].
Conflict of Interest Statement
The authors declare that the research was conducted in the absence of any commercial or financial relationships that could be construed as a potential conflict of interest.
Acknowledgments
The authors wish to thank Dr. Raffaella De Falco for her encouragement and invaluable logistic support for the experimental work.
Supplementary Material
The Supplementary Material for this article can be found online at: https://www.frontiersin.org/article/10.3389/fncel.2016.00146
References
Afshari, F. S., Chu, A. K., and Sato-Bigbee, C. (2001). Effect of cyclic AMP on the expression of myelin basic protein species and myelin proteolipid protein in committed oligodendrocytes: differential involvement of the transcription factor CREB. J. Neurosci. Res. 66, 37–45. doi: 10.1002/jnr.1195
Bánfi, B., Malgrange, B., Knisz, J., Steger, K., Dubois-Dauphin, M., and Krause, K. H. (2004). NOX3, a superoxide-generating NADPH oxidase of the inner ear. J. Biol. Chem. 279, 46065–46072. doi: 10.1074/jbc.M403046200
Bánfi, B., Molnár, G., Maturana, A., Steger, K., Hegedûs, B., Demaurex, N., et al. (2001). A Ca(2+)-activated NADPH oxidase in testis, spleen, and lymph nodes. J. Biol. Chem. 276, 37594–37601. doi: 10.1074/jbc.M103034200
Barbarese, E., Barry, C., Chou, C. H., Goldstein, D. J., Nakos, G. A., Hyde-DeRuyscher, R., et al. (1988). Expression and localization of myelin basic protein in oligodendrocytes and transfected fibroblasts. J. Neurochem. 51, 1737–1745. doi: 10.1002/jnr.22570
Baroni, S. S., Santillo, M., Bevilacqua, F., Luchetti, M., Spadoni, T., Mancini, M., et al. (2006). Stimulatory autoantibodies to the PDGF receptor in systemic sclerosis. New Eng. J. Med. 354, 2667–2676. doi: 10.1056/NEJMoa052955
Baumann, N., and Pham-Dinh, D. (2001). Biology of oligodendrocyte and myelin in the mammalian central nervous system. Physiol. Rev. 81, 871–927.
Bedard, K., Jaquet, V., and Krause, K. H. (2012). NOX5: from basic biology to signaling and disease. Free Radic. Biol. Med. 52, 725–734. doi: 10.1016/j.freeradbiomed.2011.11.023
Bedard, K., and Krause, K. H. (2007). The NOX family of ROS-generating NADPH oxidases: physiology and pathophysiology. Physiol. Rev. 87, 245–313. doi: 10.1111/j.1471-4159.2011.07231.x
Bertoni, A., Giuliano, P., Galgani, M., Rotoli, D., Ulianich, L., Adornetto, A., et al. (2011). Early and late events induced by polyQ-expanded proteins: identification of a common pathogenic property of polYQ-expanded proteins. J. Biol. Chem. 286, 4727–4741. doi: 10.1074/jbc.M110.156521
Brown, D. I., and Griendling, K. K. (2009). Nox proteins in signal transduction. Free Radic. Biol. Med. 47, 1239–1253. doi: 10.1016/j.freeradbiomed.2009.07.023
Buntinx, M., Vanderlocht, J., Hellings, N., Vandenabeele, F., Lambrichts, I., Raus, J., et al. (2003). Characterization of three human oligodendroglial cell lines as a model to study oligodendrocyte injury: morphology and oligodendrocyte-specific gene expression. J. Neurocytol. 32, 25–38. doi: 10.1023/A:1027324230923
Burdon, R. H., and Rice-Evans, C. (1989). Free radicals and the regulation of mammalian cell proliferation. Free Radic. Res. Commun. 6, 345–358. doi: 10.3109/10715768909087918
Cavaliere, F., Benito-Muñoz, M., Panicker, M., and Matute, C. (2013). NMDA modulates oligodendrocyte differentiation of subventricular zone cells through PKC activation. Front. Cell. Neurosci. 7:261. doi: 10.3389/fncel.2013.00261
Cavaliere, F., Urra, O., Alberdi, E., and Matute, C. (2012). Oligodendrocyte differentiation from adult multipotent stem cells is modulated by glutamate. Cell Death Dis. 3:e268. doi: 10.1038/cddis.2011.144
Clemente, D., Ortega, M. C., Melero-Jerez, C., and de Castro, F. (2013). The effect of glia-glia interactions on oligodendrocyte precursor cell biology during development and in demyelinating diseases. Front. Cell. Neurosci. 7:268. doi: 10.3389/fncel.2013.00268
Cullen, P. J. (2003). Calcium signalling: the ups and downs of protein kinase C. Curr. Biol. 13, R699–R701. doi: 10.1016/j.cub.2003.08.041
D’Autréaux, B., and Toledano, M. B. (2007). ROS as signalling molecules: mechanisms that generate specificity in ROS homeostasis. Nat. Rev. Mol. Cell Biol. 8, 813–824. doi: 10.1038/nrm2256
Damiano, S., Fusco, R., Morano, A., De Mizio, M., Paternò, R., and De Rosa, A. (2012). Reactive oxygen species regulate the levels of dual oxidase (Duox1-2) in human neuroblastoma cells. PLoS ONE 7:e34405. doi: 10.1371/journal.pone.0034405
Damiano, S., Morano, A., Ucci, V., Accetta, R., Mondola, P., Paternò, R., et al. (2015). Dual oxidase 2 generated reactive oxygen species selectively mediate the induction of mucins by epidermal growth factor in enterocytes. Int. J. Biochem. Cell Biol. 60, 8–18. doi: 10.1016/j.biocel.2014.12.014
de la Monte, S. M., and Wands, J. R. (2006). Molecular indices of oxidative stress and mitochondrial dysfunction occur early and often progress with severity of Alzheimer’s disease. J. Alzheimers Dis. 9, 167–181.
di Penta, A., Moreno, B., Reix, S., Fernandez-Diez, B., Villanueva, M., Errea, O., et al. (2013). Oxidative stress and proinflammatory cytokines contribute to demyelination and axonal damage in a cerebellar culture model of neuroinflammation. PLoS ONE 8:e54722. doi: 10.1371/journal.pone.0054722
Dini, L., and Rotilio, G. (1989). Electron microscopic evidence for endocytosis of superoxide dismutase by hepatocytes using protein-gold adducts. Biochem. Biophys. Res. Commun. 162, 940–944. doi: 10.1016/0006-291X(89)90763-8
Fontayne, A., Dang, P. M., Gougerot-Pocidalo, M. A., and El-Benna, J. (2002). Phosphorylation of p47phox sites by PKC alpha, beta II, delta, and zeta: effect on binding to p22phox and on NADPH oxidase activation. Biochemistry 41, 7743–7750. doi: 10.1021/bi011953s
Franklin, R. J., and Ffrench-Constant, C. (2008). Remyelination in the CNS: from biology to therapy. Nat. Rev. Neurosci. 9, 839–855. doi: 10.1038/nrn2480
Fyffe-Maricich, S. L., Karlo, J. C., Landreth, G. E., and Miller, R. H. (2011). The ERK2 mitogen-activated protein kinase regulates the timing of oligodendrocyte differentiation. J. Neurosci. 31, 843–850. doi: 10.1523/jneurosci.3239-10.2011
Gabrielli, A., Svegliati, S., Moroncini, G., Pomponio, G., Santillo, M., and Avvedimento, E. V. (2008). Oxidative stress and the pathogenesis of scleroderma: the Murrell’s hypothesis revisited. Semin. Immunopathol. 30, 329–337. doi: 10.1007/s00281-008-0125-4
Ishii, A., Furusho, M., and Bansal, R. (2013). Sustained activation of ERK1/2 MAPK in oligodendrocytes and schwann cells enhances myelin growth and stimulates oligodendrocyte progenitor expansion. J. Neurosci. 33, 175–186. doi: 10.1523/jneurosci.4403-12.2013
Jiang, F., Zhang, Y., and Dusting, G. J. (2011). NADPH oxidase-mediated redox signaling: roles in cellular stress response, stress tolerance, and tissue repair. Pharmacol. Rev. 63, 218–242. doi: 10.1124/pr.110.002980
Johnson, J. R., Chu, A. K., and Sato-Bigbee, C. (2000). Possible role of CREB in the stimulation of oligodendrocyte precursor cell proliferation by neurotrophin-3. J. Neurochem. 74, 1409–1417. doi: 10.1046/j.1471-4159.2000.0741409.x
Kageyama, R., Ohtsuka, T., Hatakeyama, J., and Ohsawa, R. (2005). Roles of bHLH genes in neural stem cell differentiation. Exp. Cell Res. 306, 343–348. doi: 10.1016/j.yexcr.2005.03.015
Kameshwar-Rao, A. S., Gil, S., Richter-Landsberg, C., Givol, D., and Yavin, E. (1999). H2O2-induced apoptotic death in serum-deprived cultures of oligodendroglia origin is linked to cell differentiation. J. Neurosci. Res. 56, 447–456. doi: 10.1002/(SICI)1097-4547(19990601)56:53.0.CO;2-T
Katoh, S., Mitsui, Y., Kitani, K., and Suzuki, T. (1997). Hyperoxia induces the differentiated neuronal phenotype of PC12 cells by producing reactive oxygen species. Biochem. Biophys. Res. Commun. 241, 347–351. doi: 10.1006/bbrc.1997.7514
Kennedy, K. A., Sandiford, S. D., Skerjanc, I. S., and Li, S. S. (2012). Reactive oxygen species and the neuronal fate. Cell. Mol. Life Sci. 69, 215–221. doi: 10.1007/s00018-011-0807-2
Lambeth, J. D. (2004). NOX enzymes and the biology of reactive oxygen. Nat. Rev. Immunol. 4, 181–189. doi: 10.1038/nri1312
Li, Q., Harraz, M. M., Zhou, W., Zhang, L. N., Ding, W., Zhang, Y., et al. (2006). Nox2 and Rac1 regulate H2O2-dependent recruitment of TRAF6 to endosomal interleukin-1 receptor complexes. Mol. Cell. Biol. 26, 140–154. doi: 10.1128/MCB.26.1.140-154.2006
Lopez Juarez, A., He, D., and Richard Lu, Q. (2015). Oligodendrocyte progenitor programming and reprogramming: toward myelin regeneration. Brain Res. 1638, 209–220. doi: 10.1016/j.brainres.2015.10.051
Lu, Q. R., Sun, T., Zhu, Z., Ma, N., Garcia, M., Stiles, C. D., et al. (2002). Common developmental requirement for Olig function indicates a motor neuron/oligodendrocyte connection. Cell 109, 75–86. doi: 10.1016/S0092-8674(02)00678-5
Maes, M., Galecki, P., Chang, Y. S., and Berk, M. (2011). A review on the oxidative and nitrosative stress (O&NS) pathways in major depression and their possible contribution to the (neuro)degenerative processes in that illness. Prog. Neuropsychopharmacol. Biol. Psychiatry 35, 676–692. doi: 10.1016/j.pnpbp.2010.05.004
McLaurin, J., Trudel, G. C., Shaw, I. T., Antel, J. P., and Cashman, N. R. (1995). A human glial hybrid cell line differentially expressing genes subserving oligodendrocyte and astrocyte phenotype. J. Neurobiol. 26, 283–293. doi: 10.1002/neu.480260212
Mondola, P., Serù, R., Santillo, M., Damiano, S., Bifulco, M., Laezza, C., et al. (2002). Effect of Cu, Zn superoxide dismutase on cholesterol metabolism in human hepatocarcinoma (HepG2) cells. Biochem. Biophys. Res. Commun. 295, 603–609. doi: 10.1016/S0006-291X(02)00720-9
Morrison, S. J. (2001). Neuronal potential and lineage determination by neural stem cells. Curr. Opin. Cell Biol. 13, 666–672. doi: 10.1016/S0955-0674(00)00269-6
Mukherjea, D., Whitworth, C. A., Nandish, S., Dunaway, G. A., Rybak, L. P., and Ramkumar, V. (2006). Expression of the kidney injury molecule 1 in the rat cochlea and induction by cisplatin. Neuroscience 139, 733–740. doi: 10.1016/j.neuroscience.2005.12.044
Nissen, C., Ciesielski-Treska, J., Hertz, L., and Mandel, P. (1973). Regulation of oxygen consumption in neuroblastoma cells: effects of differentiation and of potassium. J. Neurochem. 20, 1029–1035. doi: 10.1111/j.1471-4159.1973.tb00074.x
Noseworthy, J. H., Lucchinetti, C., Rodriguez, M., and Weinshenker, B. G. (2000). Multiple sclerosis. N. Engl. J. Med. 343, 938–952. doi: 10.1056/NEJM200009283431307
Oakley, F. D., Smith, R. L., and Engelhardt, J. F. (2009). Lipid rafts and caveolin-1 coordinate interleukin-1beta (IL-1beta)-dependent activation of NFkappaB by controlling endocytosis of Nox2 and IL-1beta receptor 1 from the plasma membrane. J. Biol. Chem. 284, 33255–33264. doi: 10.1074/jbc.M109.042127
Panchision, D. M. (2009). The role of oxygen in regulating neural stem cells in development and disease. J. Cell. Physiol. 220, 562–568. doi: 10.1002/jcp.21812
Prosser, B. L., Ward, C. W., and Lederer, W. J. (2011). X-ROS signaling: rapid mechano-chemo transduction in heart. Science 333, 1440–1445. doi: 10.1126/science.1202768
Rao, G. N., and Berk, B. C. (1992). Active oxygen species stimulate vascular smooth muscle cell growth and proto-oncogene expression. Circ. Res. 70, 593–599. doi: 10.1161/01.RES.70.3.593
Rogers, T. B., Gaa, S. T., Massey, C., and Dosemeci, A. (1990). Protein Kinase C inhibits Ca2+ accumulation in cardiac sarcoplasmic reticulum. J. Biol. Chem. 265, 4302–4308.
Samanta, J., and Kessler, J. A. (2004). Interactions between ID and OLIG proteins mediate the inhibitory effects of BMP4 on oligodendroglial differentiation. Development 131, 4131–4142. doi: 10.1242/dev.01273
Santillo, M., Colantuoni, A., Mondola, P., Guida, B., and Damiano, S. (2015). NOX signaling in molecular cardiovascular mechanisms involved in the blood pressure homeostasis. Front. Physiol. 6:194. doi: 10.3389/fphys.2015.00194
Sato-Bigbee, C., Pal, S., and Chu, A. K. (1999). Different neuroligands and signal transduction pathways stimulate CREB phosphorylation at specific developmental stages along oligodendrocyte differentiation. J. Neurochem. 72, 139–147. doi: 10.1046/j.1471-4159.1999.0720139.x
Sauer, H., Wartenberg, M., and Hescheler, J. (2001). Reactive oxygen species as intracellular messengers during cell growth and differentiation. Cell Physiol. Biochem. 11, 173–186. doi: 10.1159/000047804
Serù, R., Mondola, P., Damiano, S., Svegliati, S., Agnese, S., Avvedimento, E. V., et al. (2004). HaRas activates the NADPH oxidase complex in human neuroblastoma cells via extracellular signal-regulated kinase 1/2 pathway. J. Neurochem. 91, 613–622. doi: 10.1111/j.1471-4159.2004.02754.x
Smith, J., Ladi, E., Mayer-Proschel, M., and Noble, M. (2000). Redox state is a central modulator of the balance between self-renewal and differentiation in a dividing glial precursor cell. Proc. Natl. Acad. Sci. U.S.A. 97, 10032–10037. doi: 10.1073/pnas.170209797
Svegliati, S., Cancello, R., Sambo, P., Luchetti, M., Paroncini, P., Orlandini, G., et al. (2005). PDGF and reactive oxygen species (ROS) regulate Ras protein levels in primary human fibroblasts via ERK1/2: amplification of ROS and Ras in systemic sclerosis fibroblasts. J. Biol. Chem. 280, 36474–36482. doi: 10.1074/jbc.M502851200
Syed, Y. A., Baer, A., Hofer, M. P., González, G. A., Rundle, J., Myrta, S., et al. (2013). Inhibition of phosphodiesterase-4 promotes oligodendrocyte precursor cell differentiation and enhances CNS remyelination. EMBO Mol. Med. 5, 1918–1934. doi: 10.1002/emmm.201303123
Thorburne, S. K., and Juurlink, B. H. (1996). Low glutathione and high iron govern the susceptibility of oligodendroglial precursors to oxidative stress. J. Neurochem. 67, 1014–1022. doi: 10.1046/j.1471-4159.1996.67031014.x
Ueno, N., Takeya, R., Miyano, K., Kikuchi, H., and Sumimoto, H. (2005). The NADPH oxidase Nox3 constitutively produces superoxide in a p22phox-dependent manner: its regulation by oxidase organizers and activators. J. Biol. Chem. 280, 23328–23339. doi: 10.1074/jbc.M414548200
Wang, Y., Chen, F., Le, B., Stepp, D. W., and Fulton, D. J. (2014). Impact of Nox5 polymorphisms on basal and stimulus-dependent ROS generation. PLoS ONE 9:e100102. doi: 10.1371/journal.pone.0100102
Keywords: NOX3, NOX5, reactive oxygen species, oligodendrocyte, differentiation, multiple sclerosis
Citation: Accetta R, Damiano S, Morano A, Mondola P, Paternò R, Avvedimento EV and Santillo M (2016) Reactive Oxygen Species Derived from NOX3 and NOX5 Drive Differentiation of Human Oligodendrocytes. Front. Cell. Neurosci. 10:146. doi: 10.3389/fncel.2016.00146
Received: 05 January 2016; Accepted: 18 May 2016;
Published: 02 June 2016.
Edited by:
Pier Giorgio Mastroberardino, Erasmus University Medical Center Rotterdam, NetherlandsReviewed by:
Marina Guizzetti, Oregon Health and Science University, USAGiuseppe Filomeni, Danish Cancer Society Research Center, Denmark
Copyright © 2016 Accetta, Damiano, Morano, Mondola, Paternò, Avvedimento and Santillo. This is an open-access article distributed under the terms of the Creative Commons Attribution License (CC BY). The use, distribution or reproduction in other forums is permitted, provided the original author(s) or licensor are credited and that the original publication in this journal is cited, in accordance with accepted academic practice. No use, distribution or reproduction is permitted which does not comply with these terms.
*Correspondence: Mariarosaria Santillo, marsanti@unina.it; Enrico V. Avvedimento, avvedim@unina.it; Roberto Paternò, rpaterno@unina.it