 Eric Peter Thelin1,2*
 Frederick Adam Zeiler3,4,5
 Ari Ercole3
 Stefania Mondello6
 András Büki7,8,9
 Bo-Michael Bellander2
 Adel Helmy1
 David K. Menon3,10
 David W. Nelson11
- 1Division of Neurosurgery, Department of Clinical Neurosciences, University of Cambridge, Cambridge Biomedical Campus, Cambridge, United Kingdom
- 2Department of Clinical Neuroscience, Karolinska Institutet, Stockholm, Sweden
- 3Division of Anaesthesia, Department of Medicine, University of Cambridge, Cambridge, United Kingdom
- 4Department of Surgery, Rady Faculty of Health Sciences, University of Manitoba, Winnipeg, MB, Canada
- 5Clinician Investigator Program, Rady Faculty of Health Sciences, University of Manitoba, Winnipeg, MB, Canada
- 6Department of Biomedical and Dental Sciences and Morphofunctional Imaging, University of Messina, Messina, Italy
- 7Szentagothai Research Centre, University of Pecs, Pecs, Hungary
- 8Department of Neurosurgery, University of Pecs, Pecs, Hungary
- 9MTA-PTE Clinical Neuroscience MR Research Group, Pecs, Hungary
- 10Wolfson Brain Imaging Centre, Department of Clinical Neurosciences, University of Cambridge, Cambridge Biomedical Campus, Cambridge, United Kingdom
- 11Section of Perioperative Medicine and Intensive Care, Department of Physiology and Pharmacology, Karolinska Institutet, Stockholm, Sweden
Background: The proteins S100B, neuron-specific enolase (NSE), glial fibrillary acidic protein (GFAP), ubiquitin carboxy-terminal hydrolase L1 (UCH-L1), and neurofilament light (NF-L) have been serially sampled in serum of patients suffering from traumatic brain injury (TBI) in order to assess injury severity and tissue fate. We review the current literature of serum level dynamics of these proteins following TBI and used the term “effective half-life” (t1/2) in order to describe the “fall” rate in serum.
Materials and methods: Through searches on EMBASE, Medline, and Scopus, we looked for articles where these proteins had been serially sampled in serum in human TBI. We excluded animal studies, studies with only one presented sample and studies without neuroradiological examinations.
Results: Following screening (10,389 papers), n = 122 papers were included. The proteins S100B (n = 66) and NSE (n = 27) were the two most frequent biomarkers that were serially sampled. For S100B in severe TBI, a majority of studies indicate a t1/2 of about 24 h, even if very early sampling in these patients reveals rapid decreases (1–2 h) though possibly of non-cerebral origin. In contrast, the t1/2 for NSE is comparably longer, ranging from 48 to 72 h in severe TBI cases. The protein GFAP (n = 18) appears to have t1/2 of about 24–48 h in severe TBI. The protein UCH-L1 (n = 9) presents a t1/2 around 7 h in mild TBI and about 10 h in severe. Frequent sampling of these proteins revealed different trajectories with persisting high serum levels, or secondary peaks, in patients with unfavorable outcome or in patients developing secondary detrimental events. Finally, NF-L (n = 2) only increased in the few studies available, suggesting a serum availability of >10 days. To date, automated assays are available for S100B and NSE making them faster and more practical to use.
Conclusion: Serial sampling of brain-specific proteins in serum reveals different temporal trajectories that should be acknowledged. Proteins with shorter serum availability, like S100B, may be superior to proteins such as NF-L in detection of secondary harmful events when monitoring patients with TBI.
Introduction
Globally, traumatic brain injury (TBI) is one of the leading causes of death and disability among young adults, and due to sociodemographic changes, it is increasing among the elderly (1–3). TBI consists of two processes: the initial traumatic impact at the scene causing primary damage to the cerebral parenchyma and blood vessels, which can be followed by the onset of detrimental secondary insults (4), characterized by progressive cell death due to inflammation, impaired cerebral blood flow and metabolic function (5). As cells in the central nervous system are injured/compromised or succumb, they either secrete, release, or leak proteins, some of which are relatively enriched in the CNS (6). By measuring these proteins it is possible to assess the extent of cellular injury. Unconscious patients suffering from TBI are often treated in specialized neurointensive care units (NICU) where the goal is to detect, avoid, and treat these secondary insults to optimize cerebral recovery. Implementing measurement of these proteins of tissue fate (“biomarkers”) into clinical practice may help in the detection of secondary injury (7, 8).
The most studied TBI biomarker is S100B (9), a predominantly intracellular-, calcium-binding protein present primarily in mature, perivascular astrocytes (10). Other brain-specific proteins that have been extensively studied in TBI include the glycolytic enzyme neuron-specific enolase (NSE) (11); the astrocytic cytoskeleton component glial fibrillary acidic protein (GFAP) (12); ubiquitin carboxy-terminal hydrolase L1 (UCH-L1) involved in the neuronal production of ubiquitin (12) as well as neurofilament light (NF-L), the smallest component of the axonal cytoskeleton (13). Today, S100B is used locally as an early screening tool in the Scandinavian Guidelines in mild and moderate TBI (14), where low levels in serum have been shown to be able to safely exclude the presence of intracranial injury in mild TBI patients and thus obviate the needs for head computed tomography in these cases. However, it has been suggested that one of the limitations with the protein is the relatively short serum elimination half-life (suggested to be as short as 25 min in patients with no ongoing brain injury) (15). Thus, in patients with mild/moderate TBI without pathophysiological processes to cause a sustained release in S100B, delayed sampling may be falsely reassuring and this is reflected in the guidelines, which suggest a cutoff of 6 h after trauma (16). It is becoming increasingly clear that a specific level in serum is of little importance if in the absence of kinetic considerations.
It is not completely clear how these proteins leave the injured brain and enter the blood. Blood–brain barrier (BBB) disruption (17) or release independent of BBB integrity (18) as well as passage through the newly discovered glymphatic system (19) have been suggested as possible routes. Presumably, these proteins are first released in the brain extracellular space, a component difficult to access for repeated sampling (20), before being transported to the cerebral spinal fluid (CSF) [where a passive diffusion from CSF to blood the first 24 h after injury has been suggested (21)] and/or subsequently into serum where it is most easily sampled. However, there are several factors that may influence this transport and thus the availability in serum, including clearance, redistribution, protein stability, and ongoing release from the damaged brain (22). The protein S100B has been shown to have a 100% renal clearance (23), and may thus be affected in patients with renal insufficiency (15, 24, 25). Studies regarding serum clearance for the other biomarkers are scarce, but as they are larger, it is probable that liver metabolism is involved (26).
Thus, the serum concentrations of these biomarkers over time are the net sum of complex wash-in (“leak” from the injured brain) and washout (clearance and elimination from the blood) processes that are variable over time, together creating a profile with an expected peak time and a decay rate. This “fall” rate after peak gives rise to what is here termed the effective half-life (t1/2). This process may vary under different conditions and over time in a way that has not yet been properly studied in biomarker research and is distinct from the elimination half-life. Because of this, it will not be possible to present accurate true serum half-lives of these proteins in TBI cohorts. However, composite peak times and biological half-lives can to some extent be grossly estimated from the literature. In this review, we have chosen to focus specifically on these serum trajectories and temporal profiles after TBI.
While there have been several systematic review articles addressing the utility of different biomarkers in detecting injury and predicting outcome (16, 27, 28), there are no studies that have systematically integrated the current knowledge concerning serial sampling of serum biomarkers in brain injured patients, with the goal of suggesting interpretation of levels and estimating peak times and biological half-lives. Understanding the temporal profiles of biomarkers is crucial, as it will provide pertinent information on how to interpret trends. Additionally, current and ongoing studies assessing treatment efficacy (29) as well as multicenter TBI studies such as CENTER-TBI are providing researchers with large cohorts of serial serum samples, where the utility of serial sampling in monitoring secondary events could be assessed (30).
Aim
By systematically and comprehensively reviewing the available literature on serial serum biomarker sampling in human TBI, we wish to assess temporal trajectories in order to better understand serum t1/2 of these proteins.
Materials and Methods
A systematic review was performed, using the methodology outlined in the Cochrane Handbook for Systematic Reviewers (31). Data were reported following the Preferred Reporting Items for Systematic Reviews and Meta-Analyses (PRISMA) (see Data Sheet S1 in Supplementary Material for PRISMA checklist) (32).
Search Question and Population of Interest
The main question posed for this scoping systematic review was as follows: How do serum S100B, NSE, GFAP, UCH-L1, and NF-L levels change with time following TBI? Thus, we aimed to include all studies reporting at least two serum samples of S100B, NSE, GFAP, UCH-L1, or NF-L (respectively) in human TBI. The primary outcome of interest was serum dynamics, and the resulting effective serum half-life (t1/2), over time for these proteins.
Inclusion/Exclusion Criteria
Inclusion Criteria
All studies including human subjects with TBI, any study size, any age category, and reporting at least two serum samples of either/or S100B, NSE, GFAP, UCH-L1, and/or NF-L.
Exclusion Criteria
Animal studies, non-TBI studies, studies without neuroradiological examinations, studies analyzing the biomarker in other bodily compartments than serum, non-English studies (very few available, only one such study n = 1 for S100B was found that could otherwise have been potentially included), meeting abstracts, and studies failing to adequately demonstrate data from multiple sampling.
Search Strategies
MEDLINE, EMBASE, and SCOPUS from December 1, 1945 to January 31, 2017 were searched using similar search strategies, which were individualized for each database interface. The search strategy using MEDLINE and EMBASE can be seen in Data Sheet S2 in Supplementary Material, with a similar search strategy utilized for the other database. All possible MESH-terms were used for the different biomarkers (Data Sheet S2 in Supplementary Material). Reference lists of any review articles on this subject were reviewed for any missed relevant studies.
Study Selection
Utilizing two reviewers, a two-step review of all articles returned by our search strategies was performed. First, the reviewers independently (Frederick Adam Zeiler and Eric Peter Thelin) screened titles and abstracts of the returned articles to decide if they met the inclusion criteria. Any meeting abstracts returned by the search strategy were not included in the final review. However, we hand searched the abovementioned databases for any published manuscripts corresponding to these meeting abstracts, prior to discarding them. Second, full texts of the chosen articles were then assessed, to confirm if they met the inclusion criteria and that the primary outcome of interest was reported in the study (Frederick Adam Zeiler and Eric Peter Thelin). Any discrepancies between the two reviewers were resolved by a third reviewer if needed (Adel Helmy or David K. Menon).
Data Extraction
Using a tailored form, data were extracted from the selected articles and stored in an electronic database. Data fields included the following: number of patients, patient demographics [age and injury severity, usually based on Glasgow Coma Scale (GCS) (33)], type of assay used (technique and manufacturer, if available), sampling frequency, trend over time for the specific biomarker (looking at serum data either in tables or figures presented in the articles), estimated temporal profile/serum availability, and any specific notes concerning the serial sampling of the biomarker. As delta values were not provided, to calculate the t1/2 the concentration decrease was divided by time. So, if the first concentration following the peak was 0.50 µg/L and a second sample acquired after 12 h was 0.25 µg/L, it would have resulted in a t1/2 of 12 h. If the serum concentration initially increased, the decrease following the peak concentration was used (and was commented on in “notes”). If the concentration only increased over time, it was commented on, and no t1/2 was calculated. In the case of long sampling frequency, a non-accurate range for the effective serum half-life was noted.
Quality/Bias Assessment
As only three S100B studies and one UCH-L1 study (29–32) investigated serum dynamics over time, a formal bias assessment of all the included studies is not possible. However, as the goal of this review was to produce a systematically conducted review of the available literature on serial sampling of serum biomarkers in TBI, this is not critical. Our main aim was instead to produce a comprehensive overview of the current literature on the topic.
Statistical Analysis
Due to the heterogeneity of the data, both between severity grades of included TBI patients and varying sampling times and assays used, we could not perform a formal meta-analysis of the collected data. However, we did make histograms for the different biomarker studies with a sampling frequency of 24 h or less that indicated an estimate of t1/2.
Results
S100B
A search for S100B identified a total of 3,113 manuscripts. Following removal of duplicates and after assessing full manuscripts, 66 articles were deemed eligible for final inclusion (Figure 1) and are listed in Table 1.
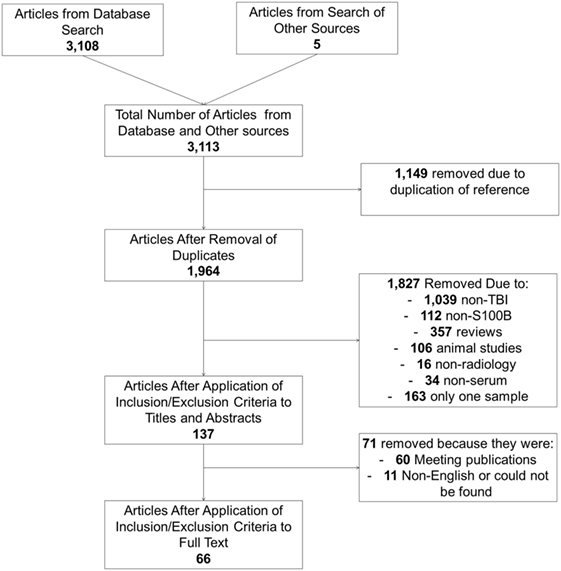
Figure 1. Illustrating the selection of articles with serial sampling of S100B.
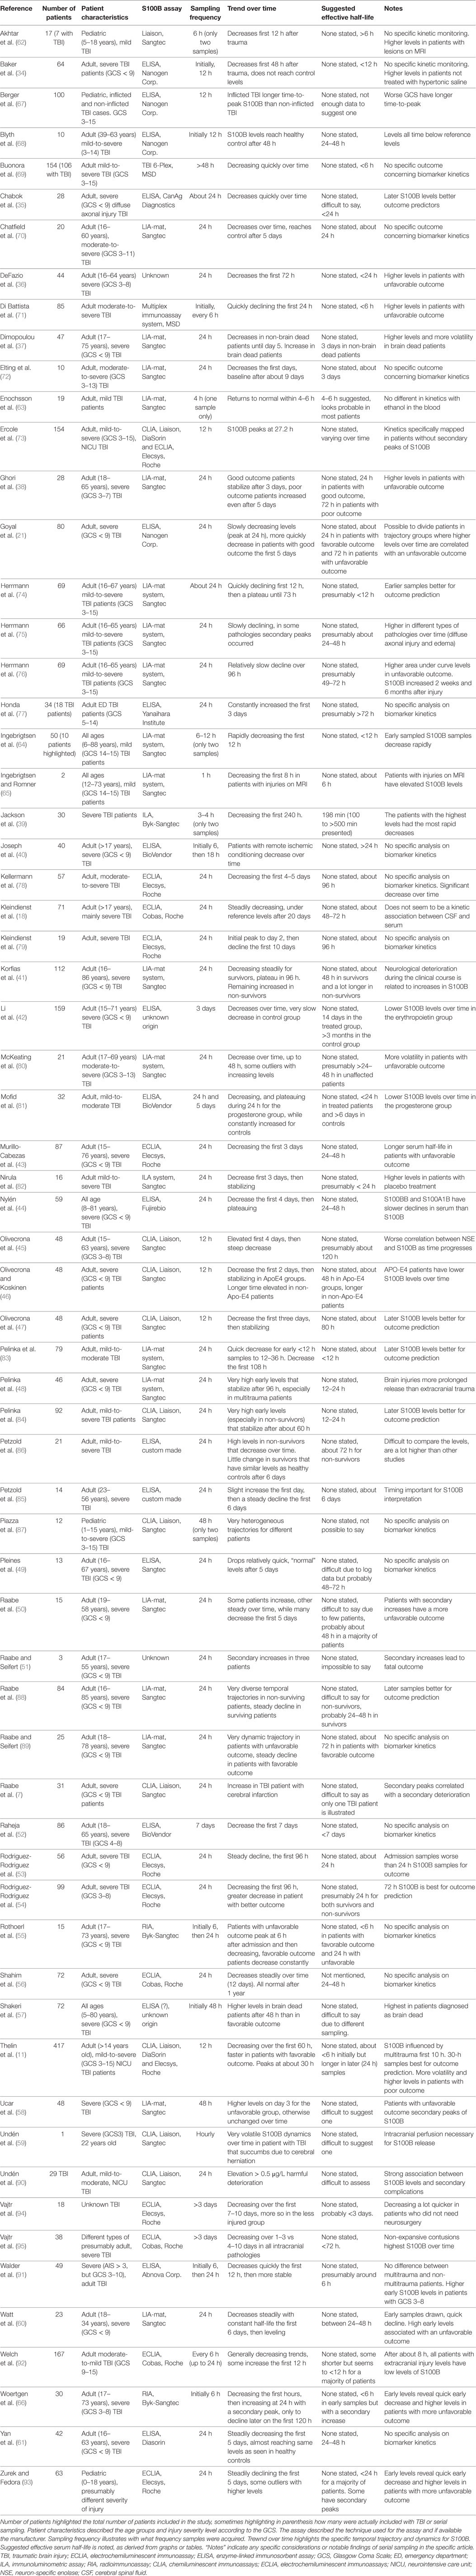
Table 1. Analysis of S100B studies.
Patient Characteristics
Generally, the patient characteristics in the S100B studies were severely injured TBI patients (GCS < 9 at admission, unconscious) (21, 34–61) and mild (GCS 14–15) (62–66) or in combination (including moderate GCS 9–13) (7, 11, 18, 67–92) (Table 1). All different age groups were analyzed, including only or partial pediatric populations (44, 57, 62, 64, 65, 67, 93), even if a vast majority included solely adult patients (7, 11, 18, 21, 34–38, 40–43, 45–51, 53–56, 59–61, 63, 66, 68, 71–92).
Assays Used to Analyze Serum S100B
The studies used a wide variety of different assays to analyze S100B. Commercial or custom made enzyme-linked immunosorbent assays (ELISAs) were used in some studies (21, 34, 35, 40, 42, 44, 49, 52, 57, 61, 67, 68, 77, 81, 85, 86, 91), as well as other techniques (or not mentioned in the text) (36, 51, 55, 66, 69, 71), even if a majority used clinically available assays such as the (C)LIA-mat system from Sangtec/DiaSorin (7, 11, 18, 37–39, 41, 43, 45–48, 50, 53, 54, 56, 58–60, 62–65, 70, 72–76, 78–80, 82–84, 87–90, 92–95). In general, ELISA samples showed less volatility over time (42, 49, 68, 81, 91). Specifically, they tended to have elevated levels over a prolonged period of time as compared to the automated, clinical assays (42, 49, 52, 77, 81, 85, 86, 91).
Sampling Frequency of S100B
While some studies had more than 24 h between sampling times (42, 52, 57, 58, 81, 87, 94, 95), generally the studies had a sampling frequency of every 24 h (7, 18, 21, 35–38, 41, 43, 44, 48–51, 53, 54, 56, 60, 61, 70, 72, 74–86, 88–90, 93), or sometimes twice daily (11, 34, 45–47, 67, 68, 73), or every 4–6 h (39, 40, 55, 62–64, 66, 69, 71, 91, 92). In contrast to the other biomarkers, there were some studies that assessed S100B hourly in order to track the serum dynamics (59, 65).
Trend of S100B over Time after Trauma
Following trauma, almost all articles proclaim a steadily decline in levels of S100B (18, 21, 35, 36, 40, 43–48, 52–54, 56, 60, 61, 64, 69–72, 78, 80–84, 86, 88, 91, 93–95), while some suggested a slight increase before declining (55, 73, 79, 85, 92). Patients suffering from multitrauma and TBI were seen to have higher levels compared to patients with only TBI (11, 48, 92). Generally, the decreasing trajectory of S100B was strongly correlated with the severity of trauma and/or the outcome for the patient (11, 21, 36–38, 41–43, 50, 54, 55, 58, 60, 62, 65, 66, 71, 75, 84, 86, 93–95). Some papers indicate a very quick decline of serum S100B (39, 49, 83), while some suggest that it is a slower decline over time in relation to when the sample is acquired (11, 60, 64, 69, 71, 73, 74, 85, 93). Several studies indicate volatile S100B trajectories in more unstable patients with detrimental outcomes due to injury development (37, 38, 41, 50, 57, 59, 66, 67, 80, 84, 87–89). Secondary increases (“peaks”) of S100B were found in several studies and correlated with secondary adverse events (7, 41, 51, 58, 75, 90). Some clinical trials noted a faster decrease of S100B in serum over time in the trial group as compared to placebo (34, 42, 81, 82).
Suggested Serum t1/2 of S100B
Available data suggest that there is a rapid influx and fast t1/2 of about 2–6 h in mild TBI patients, which is similar in more severe TBI patients if acquired early (11, 34, 39, 55, 63–66, 69, 71, 74, 83, 91, 92) (Figure 2A). Additionally, a slower influx with a later peak and t1/2 of about 24 h the first days in severe TBI patients are described (11, 21, 35, 36, 38, 40, 43, 44, 48, 53, 54, 56, 60, 61, 70, 73, 75, 81, 82, 84, 88, 93). Some studies reported t1/2 of days (24–120 h) (18, 21, 37, 41, 45–47, 49, 72, 76–80, 85, 86, 89) or even weeks (14 days) (42).
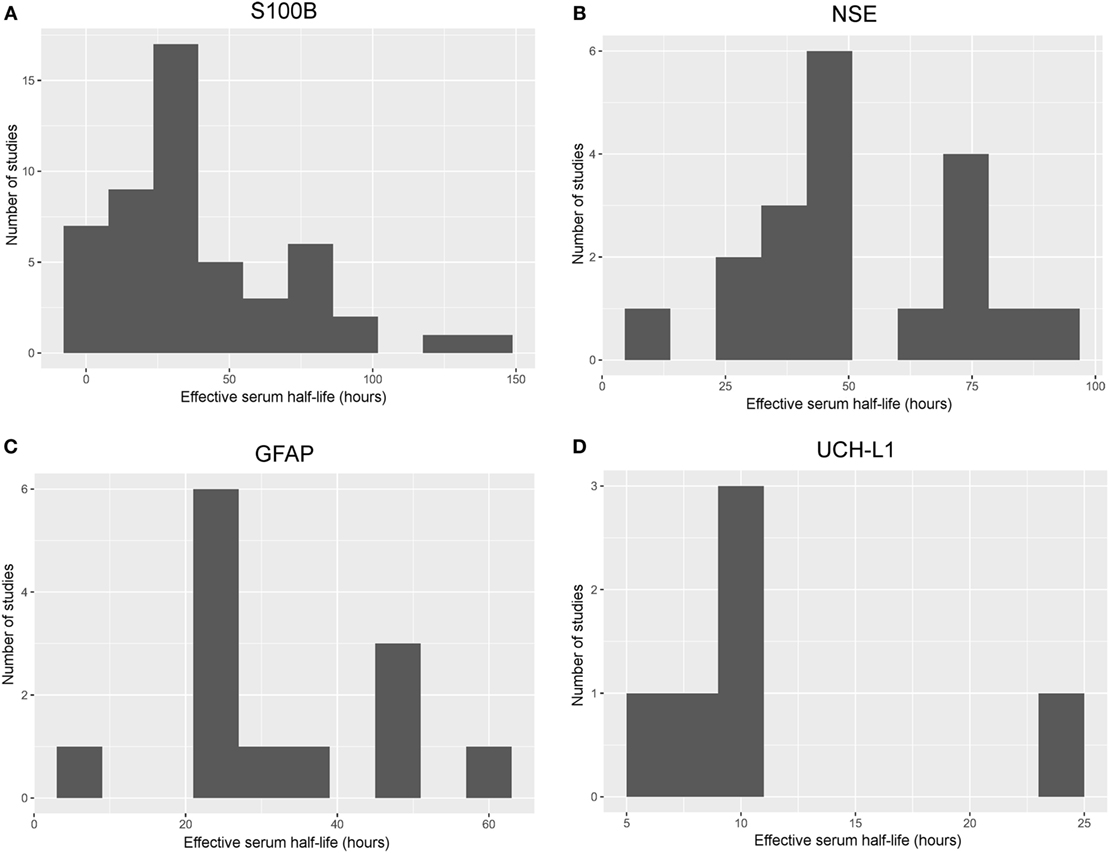
Figure 2. Histograms of frequency of effective serum half-life in different studies. Histograms illustrating the aggregated effective serum half-lives as derived from the different studies including S100B (A), neuron-specific enolase (NSE) (B), glial fibrillary acidic protein (GFAP) (C), and ubiquitin carboxy-terminal hydrolase L1 (UCH-L1) (D). Studies with a sampling frequency of 24 h or shorter and a valid estimate of the effective serum half-life were included. The bin size is set to 10 h in order to easily visualize trends; a relatively short effective serum half-life for S100B and UCH-L1, while it was longer for NSE and GFAP. An effective serum half-life for neurofilament light could not be included as it was impossible to estimate from the available literature.
Neuron-Specific Enolase
A search for NSE identified a total of 4,511 manuscripts. Following the removal of duplicates and after assessing full manuscripts, 27 articles were deemed eligible for final inclusion (Figure S1 in Supplementary Material) and are listed in Table 2.
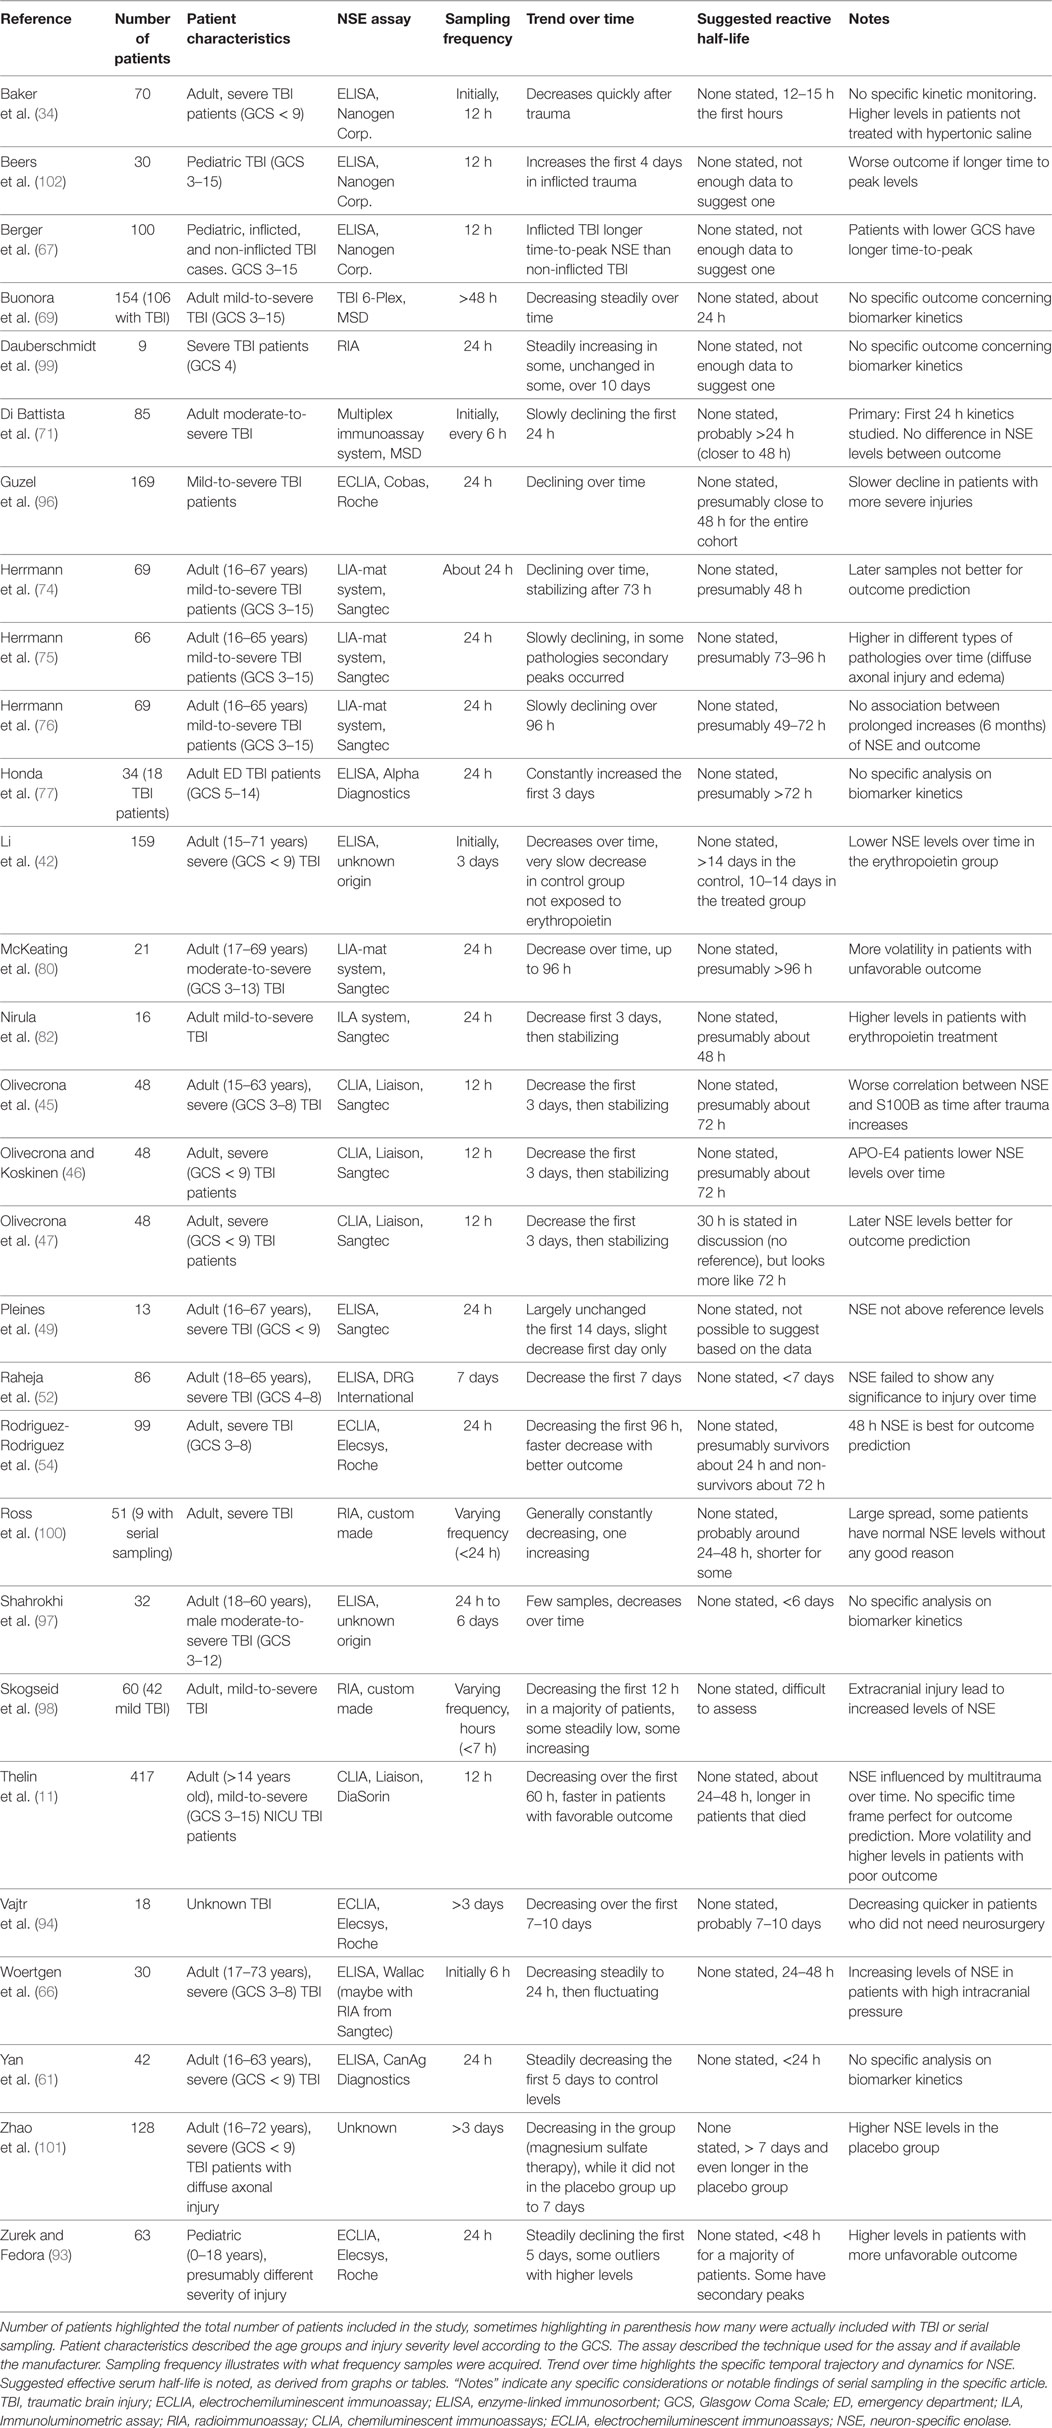
Table 2. Analysis of NSE studies.
Patient Characteristics
Generally, the patient characteristics in the NSE studies were very similar to the S100B studies with a variety of primarily adult, mild/moderate-to-severely (11, 71, 74–77, 80, 82, 96–98), or only severely injured patients (34, 42, 45–47, 49, 52, 54, 61, 66, 99–101) (Table 2). However, some looked at more minor injuries and included pe diatric patients (67, 93, 102).
Assays Used to Analyze Serum NSE
Similar to S100B, the studies used to analyze NSE utilize a wide variety of different assays. A majority of studies used clinically available assays such as the LIA-mat system from Sangtec/DiaSorin (11, 45–47, 74–76, 80, 82) or Elecsys/Cobas systems from Roche (54, 93, 94, 96), but commercial/custom made ELISAs (34, 42, 49, 52, 61, 66, 67, 77, 97, 102) and other techniques (69, 71, 98–101) were also used. Comparable to results of the S100B, the ELISA methods generally showed higher levels over time and with less dynamics, as compared to the automated assays (42, 49, 52, 97).
Sampling Frequency of NSE
Generally, NSE was sampled either every 6 h (66, 71, 98), 12 h (11, 34, 45–47, 67, 102), and 24 h (54, 61, 74–77, 80, 82, 93, 96, 99, 100) in a majority of studies, while some reported longer sampling frequencies (42, 52, 69, 94, 97, 101).
Trend of NSE over Time after Trauma
Neuron-specific enolase has not been as extensively analyzed as S100B, but it shows similar characteristics with early high levels that decrease over time (34, 61, 69, 94, 97, 98, 100). However, the levels do not seem to decline with the same velocity as S100B (11, 42, 45–47, 49, 52, 69, 71, 74, 76, 80, 82) and even increase without any known association with outcome/injury in a few cases (77, 98, 99, 102). Nevertheless, a slower decline of NSE is seen in patient with more severe injuries or a more unfavorable outcome in many studies (11, 54, 66, 67, 93, 94, 96), and some increasing trajectories in patients with poor outcome were reported (66, 80, 93). Patients with concomitant extracranial injuries had higher levels of NSE (11, 98). Similar to S100B, secondary peaks of NSE were shown in some studies for patients with progressing injuries (75, 93). Likewise, some clinical trials noted a faster decrease of NSE in serum over time in the trial group as compared to placebo (34, 42, 101).
Suggested Serum t1/2 of NSE
Available data suggest that the serum t1/2 for NSE is longer than for S100B, presumably around 48–72 h in patients with severe TBI (11, 45–47, 54, 66, 71, 74, 76, 82, 93, 96) or even longer (42, 75, 77, 80, 94) (Figure 2B). However, some studies reported a shorter t1/2 at 12 (34) or 24 h (61, 69, 100).
Glial Fibrillary Acidic Protein
A search for GFAP identified a total of 1,953 manuscripts. Following removal of duplicates and after assessing full manuscripts, 18 articles were deemed eligible for final inclusion (Figure S2 in Supplementary Material) and are listed in Table 3.
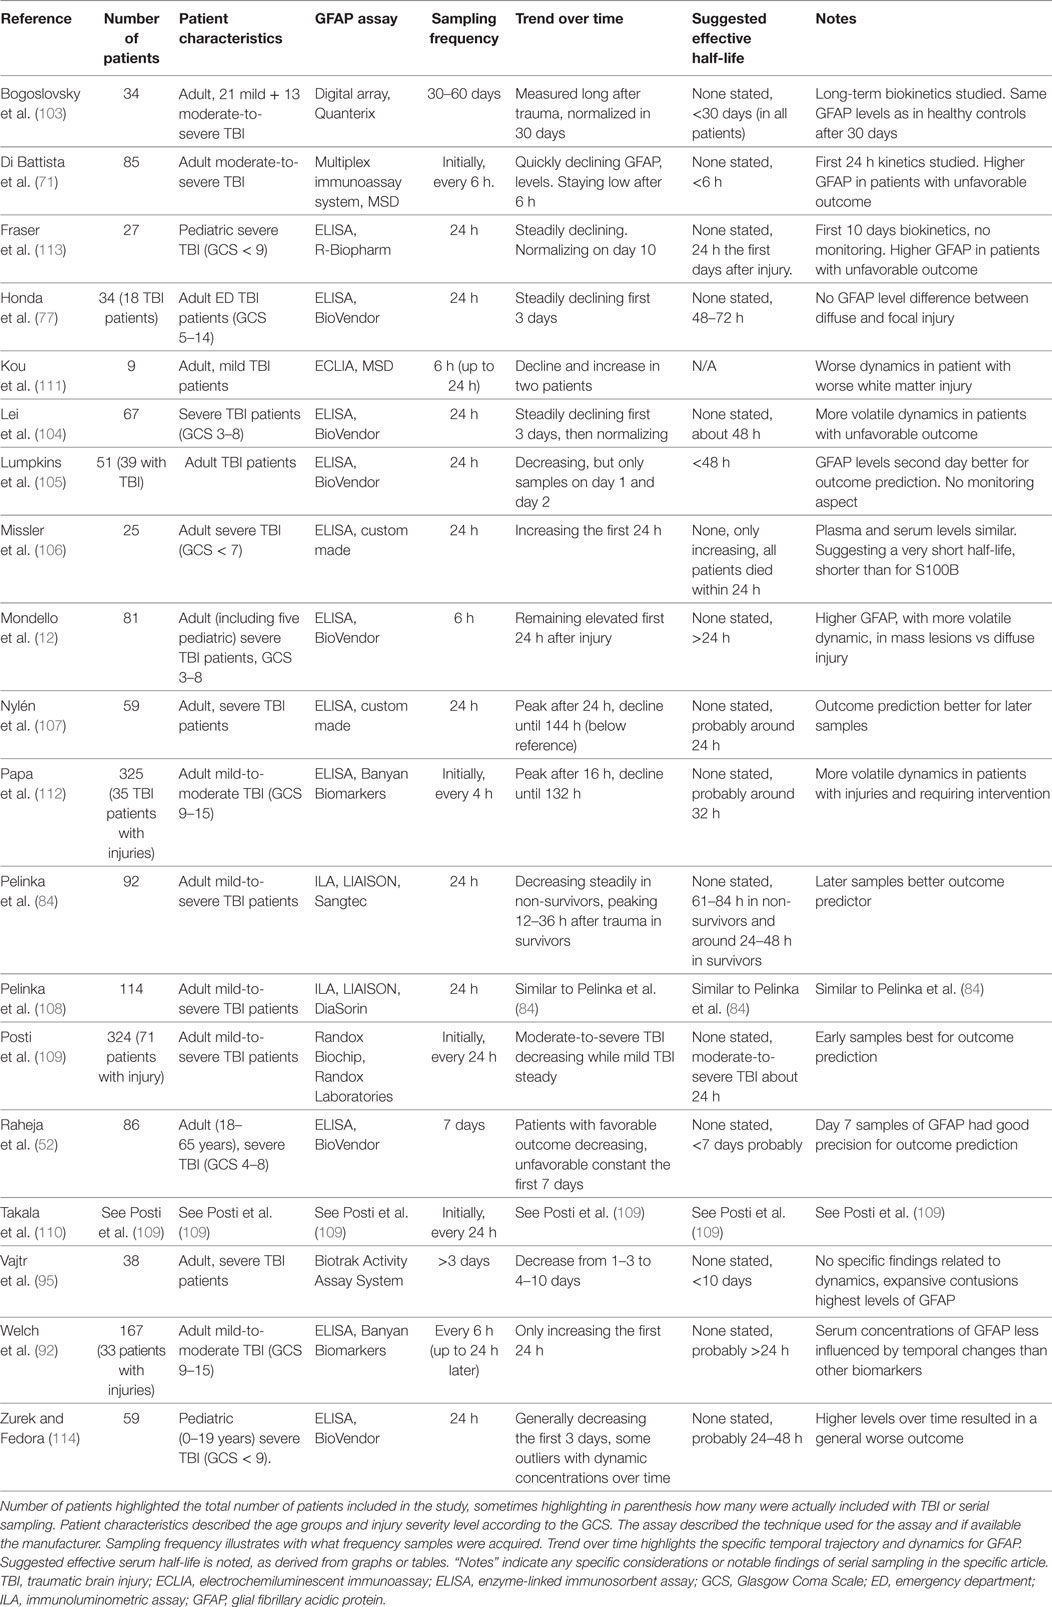
Table 3. Analysis of GFAP studies.
Patient Characteristics
Similar to studies analyzing S100B and NSE, the patient characteristics of the GFAP patients were mixed, but with a preponderance toward more severely injured patients (12, 52, 71, 77, 84, 95, 103–110), even if milder cohorts also have been analyzed (92, 111, 112). Some studies looked partly, or solely, at pediatric cohorts (12, 113, 114).
Assays Used to Analyze Serum GFAP
A majority of the GFAP studies used various ELISA assays (12, 52, 77, 92, 104–107, 112–114), except two which used an ILA from Liaison™ (84, 108), two studies which used the Randox Biochip™ (109, 110), one an assay from Biotrak™ (95), one used a digital array from Quanterix™ (103), and two that used an immunoassay from MSD™ (71, 111). Currently, there are no clinically available assays. However, fully automated assays are under development.
Sampling Frequency of GFAP
Generally, GFAP was sampled every 24 h (77, 84, 104–110, 113, 114) in a majority of studies (one outlier with 30 days between samples (103)), while some had as short as 6 h sampling (12, 71, 92, 111), and one even 4 h initially (112). Two studies had longer sampling frequencies (52, 95).
Trend of GFAP over Time after Trauma
Similar to the previously studied markers, GFAP seems to decrease after trauma over time (71, 77, 95, 104, 105, 109, 110, 113). However, some studies noted initially increasing levels, up to about 16–24 h following injury (84, 107, 108, 112). GFAP usually remained elevated for a prolonged period of time, as compared with S100B (12, 84). One study showed limited contribution of extracranial trauma (108). As with the other biomarkers, some studies noted prolonged elevated levels, or even continually increasing levels/volatile dynamics, in patients with unfavorable outcome or worse injuries (52, 71, 84, 104, 106–114).
Suggested Serum t1/2 for GFAP
The t1/2 for GFAP appears longer than for S100B, most studies reported a t1/2 at around 24–48 h in severe TBI patients (12, 77, 84, 92, 104, 105, 107–110, 112–114), while some published data suggesting a shorter t1/2 (71, 106) (Figure 2C).
Ubiquitin Carboxy-Terminal Hydrolase L1
A search for UCH-L1 identified a total of 234 manuscripts. Following removal of duplicates and after assessing full manuscripts, nine articles were deemed eligible for final inclusion (Figure S3 in Supplementary Material) and are listed in Table 4.
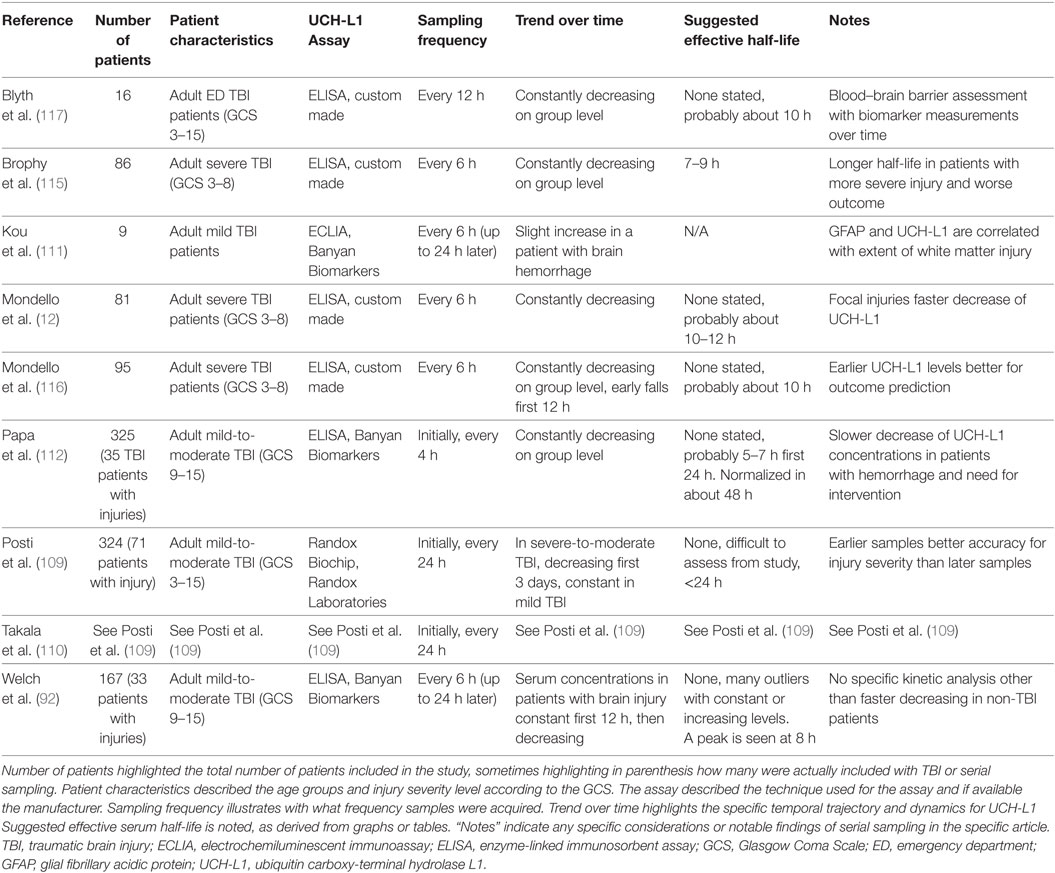
Table 4. Analysis of UCH-L1 studies.
Patient Characteristics
Generally, the patient characteristics in the UCH-L1 studies were somewhat trichotomized with some of the articles focusing more on the milder TBI spectrum (111, 112), while the others included primarily severe (12, 115–117), or a mix of TBI patients (92, 109, 110) (Table 4). No pediatric TBI population was found.
Assays Used to Analyze Serum UCH-L1
Currently, no clinically available assays exist to analyze UCH-L1 and all studies used different ELISAs, either custom made (12, 115–117) or commercially available (92, 112) except for two studies which used a Randox Biochip™ method (109, 110) and one with a ECLIA method from Banyan Biomarkers™ (111).
Sampling Frequency of UCH-L1
In comparison to the other proteins, most UCH-L1 studies had a 4–6 h (12, 92, 111, 112, 115, 116), or 12 h (117), sampling frequency, allowing for a good estimate of the temporal profile. Two studies had a longer and varying sampling frequency (109, 110).
Trend of UCH-L1 over Time after Trauma
In unison with the other markers, UCH-L1 usually decreased steadily following TBI (12, 109, 110, 112, 116, 117). Secondary peaks, or increasing trajectories in patients with serious injuries, were found in patients in a few papers (92, 111, 112, 115, 116). One study suggested that UCH-L1 peaks at around 8 h after injury (92).
Suggested Serum t1/2 of UCH-L1
Looking at the available data, the serum t1/2 seems to be about 10 h (12, 112, 116, 117) in severe TBI patients, a few hours shorter in milder cases (112) (Figure 2D). In comparison to the other markers, UCH-L1 actually had one study with the goal of establishing a “half-life” of UCH-L1, which was given at 7–9 h (115) in severe TBI patients. This was found shorter in milder TBI cohorts, where data indicated that it was around 6 h (115).
Neurofilament Light
A search for NF-L identified a total of 575 manuscripts. Following removal of duplicates and after assessing full manuscripts, only n = 2 articles were deemed eligible for final inclusion (Figure S4 in Supplementary Material) and are listed in Table 5.
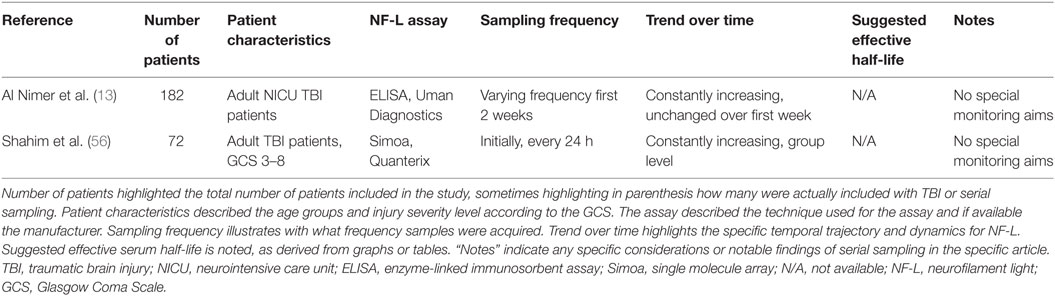
Table 5. Analysis of NF-L studies.
Patient Characteristics
Only two studies were included which both presented NICU TBI materials with mixed TBI severity according to GCS admission (Table 5) (13, 56). No pediatric TBI population has been studied.
Assays to Analyze NF-L
Officially, there are currently no available ELISAs for NF-L in serum. One of the included studies instead used an ELISA assay developed for CSF samples (13), and the other used the newly developed single molecule array technique to create a functional assay (56).
Trend of NF-L over Time after Trauma
In contrast to the other serum biomarkers, the two available studies suggest that NF-L levels in serum in a mild-to-severe (and one severe) TBI cohort of NICU patients tend to increase over time during the first 1–2 weeks (increased during the whole sampled period) (13, 56). Additionally, some patients were found to have elevated levels even 1 year after trauma (56).
Suggested Serum t1/2 of NF-L
With the data available, it is not possible to determine a serum t1/2 for NF-L (13, 56). However, it is evident that this is the protein with the longest t1/2 of these biomarkers.
Discussion
This systematic review highlights that serial sampling of different biomarkers in serum results in distinguishably different temporal trajectories in TBI patients. Serum S100B and UCH-L1 levels seem to have the shortest t1/2 while the serum levels of the biomarkers GFAP and NSE both remain elevated for a prolonged period of time, as compared to S100B and UCH-L1. Even more extended, NF-L appears to have the longest t1/2 of the biomarkers. However, a specific value could not be identified in the studies, as it continued to increase over the sampling period of 2 weeks. Due to the heterogeneity of included patients, secondary brain injury development, assays used, and sampling frequency, it is impossible to draw any accurate conclusions regarding standardized elimination half-lives after concentration peaks for these proteins, but we believe our effort including effective half-lives provides the best possible attempt to date. Moreover, different sources of biomarkers seem to influence the total serum levels over time, with extracranial contribution being most influential for S100B and NSE, where this has been most extensively studied. Despite these caveats and in contrast to the other biomarkers, S100B and NSE have fully automated clinical assays, making them accessible for routine clinical use. To our knowledge, this is the first systematic review of temporal profiles of biomarkers following TBI, and it could serve as a platform to better assess and compare novel brain biomarkers to be introduced, as well as relate future studies presenting serial sampling of TBI patients.
Unsurprisingly, the searches that generated the greatest numbers of research articles were that of S100B and NSE. These markers are by far the most studied in TBI but have also been studied in other intracranial conditions, mainly in stroke (118) and to assess brain injuries in patients suffering from circulatory arrest (119). Regarding different aspects of the temporal trajectories, S100B is by far the most studied. It is becoming increasingly clear that temporal changes of S100B in serum are highly dynamic following brain injury (39, 66, 73, 120). Figure 3 is an attempt to better illustrate these changes, and while it is constructed with the dynamics of S100B in mind, it may be generally applicable to the other biomarkers as well, but with different t1/2. The exception is NF-L, where the t1/2 is so long that it has not yet even been estimated. The highest levels of S100B are seen early (within 60–120 min after trauma) in patients suffering from multitrauma where bone, adipose tissue, and internal organs [tissues known to express S100B as well (121, 122)] are injured (11, 48). However, these extracranial contributions of S100B will decrease rapidly, as is seen in patients with only multitrauma and without brain injury (48). Jackson et al. estimated these rapid falls of S100B to have a serum “half-life” of 198 min (first sample within 60 min) (39). Townend et al. looked at S100B in mild TBI patients and found that S100B only had an estimated “half-life” of 97 min, even though these samples were acquired a bit later after trauma (CI: 75–136 min, first sample within 240 min following trauma) and all did not have structural injuries (37). In our own experience, the highest level of S100B in serum we have seen was 23.0 µg/L (healthy reference < 0.11 and 1.0–2.0 µg/L usually seen in severe TBI patients) sampled 29 min following trauma from a patient who had fallen from the fifth floor and had severe extracranial injuries as well as intracranial focal mass lesions [patient in study (11)]. The next sample was 6.2 µg/L acquired 6.5 h after trauma, suggesting a “half-life” similar to Jackson et al. of around 3 h. It is import to realize that levels of S100B may represent two processes, where the initial early peak probably represents a more bolus-like dose of S100B assumed predominantly of extracranial origin and is eliminated quickly (Figure 3), here better reflecting its true serum elimination half-life. The second peak, after about 24 h, represents a slow release net sum of influx and outflux of S100B to serum, predominantly from the injured brain and where the slower decay is affected by the continued release, thus the extended t1/2. This interpretation is supported by our study of moderate-to-severe TBI patients, where we saw that the late 24 (27.2)-h peak is highly related to outcome whereas the initial peak is not (11). We have also modeled the functional kinetics of S100B in moderate-to-severe TBI patients, after excluding this initial “trauma peak” (73). S100B was found to have an expected “brain injury” peak level at around 27 h after injury (38). After that peak, it should drop with an expected rate during the upcoming days (38). If S100B does not follow this trajectory, it could indicate ongoing brain injury (9, 43, 44), resulting in an unfavorable outcome (11). We must stress that the trajectory described here is that of TBI and has not been extensively studied in other contexts. Our experience of several thousand patients in routine clinical use, in for example patients with embolic stroke, is that they can express an extended release, often peaking at day 2–3. The cause of this is not yet understood, but could reflect ongoing penumbral leakage or patterns of recirculation. The presence of secondary peaks of S100B should be highlighted (7, 8, 44–46), as they have been shown to be associated with secondary brain injuries or neurological deterioration in TBI patients. In summary, it is important to understand the kinetic profile of S100B, and its different components when interpreting it as a biomarker of brain injury.
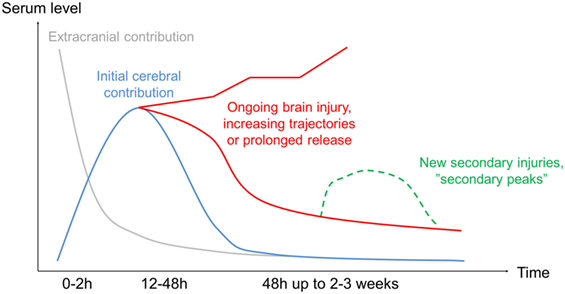
Figure 3. Protein kinetics following injury. Highlighting the estimated temporal profile from trauma if frequently sampled. Initially, there will be a major release of the protein from extracranial sources (gray line), in theory more so if it is present to a larger extent in tissue likely to be injured (i.e., S100B in adipose tissue), even if this contribution generally decreases rapidly. The cerebral contribution (blue line) will continue to increase in serum (for S100B up to 27 h), presumably due to influx from the injured brain. In case of ongoing injury development, the subsequent serum samples may have a prolonged decline or even continue to increase depending on the injury severity (red line). In case of a new injury development, secondary peaks have been shown (green line). While this pattern is most studied for S100B, it applies to some extent to all the biomarkers even if the time frames are different.
The second most studied protein was NSE. Similar to S100B, a steady decline is generally seen but with a serum t1/2 longer than for S100B. However, patients with severe injuries may continue to present increasing levels in serum after trauma (47, 48). The general decrease seen for NSE may be delayed in patients with unfavorable outcome or more severe injuries (11, 44), and NSE has been shown to be influenced by extracranial contribution (11, 49), possibly more so than S100B. Another major caveat with NSE is its presence in erythrocytes making serum sampling unreliable if hemolysis is present (50) despite that there are tools attempting to adjust for this (51) and procedures in automatic clinical assays that discard. Similar to S100B, secondary peaks of NSE have been shown in patients with new or progressing injuries (44, 52). In aggregate, NSE behaves similar to that of S100B in serum, albeit it appears to have a longer contextual half-life in serum of about 48 h and has larger influence from extracranial sources.
Serial sampling of GFAP has been less commonly studied in TBI, but interest is increasing, presumably due to GFAP’s superior brain specificity (41). The serum t1/2 levels of GFAP are extended, as compared to S100B, presumably at around 24–48 h in severe TBI patients and thus similar to NSE. This prolonged increase in serum levels may prove to be beneficial for diagnostic screening of intracranial lesions in milder TBI, being more detectable >6 h after injury, as compared to S100B (53, 54). However, it appears to lack granularity to detect more rapidly changing trajectories as seen when serially sampling proteins with shorter effective half-lives, such as S100B and UCH-L1. This may explain why only a limited amount of studies report secondary peaks of GFAP (12). A long t1/2 will make it difficult to use in assessment of treatment efficacy and monitoring, as it would in theory provide a delayed treatment response and show a blunted concentration. Despite this, a delayed decrease or continued release of GFAP is seen in patients with unfavorable outcome (53, 55–57). Patients with mass lesions appear to have higher levels of GFAP in serum as compared to more diffuse injuries (12, 58), especially in combination with lower levels of UCH-L1 (used in a glial:neuronal ratio) (59). While GFAP has been seen to increase in patients with extracranial trauma and without brain injury (60), reports of serial sampling in multitrauma populations are scarce (108), but as the protein is so much more brain specific as compared to S100B (Table S1 in Supplementary Material; Table 6) (41), available data suggest that extracranial contribution over time to be relatively low. In summary, GFAP seems to have longer t1/2 half-life than S100B, of about 24–48 h, which might prove beneficial for screening purposes if a patient is sampled late after ictus, but might decrease accuracy to detect and separate novel lesions and monitor ongoing events.
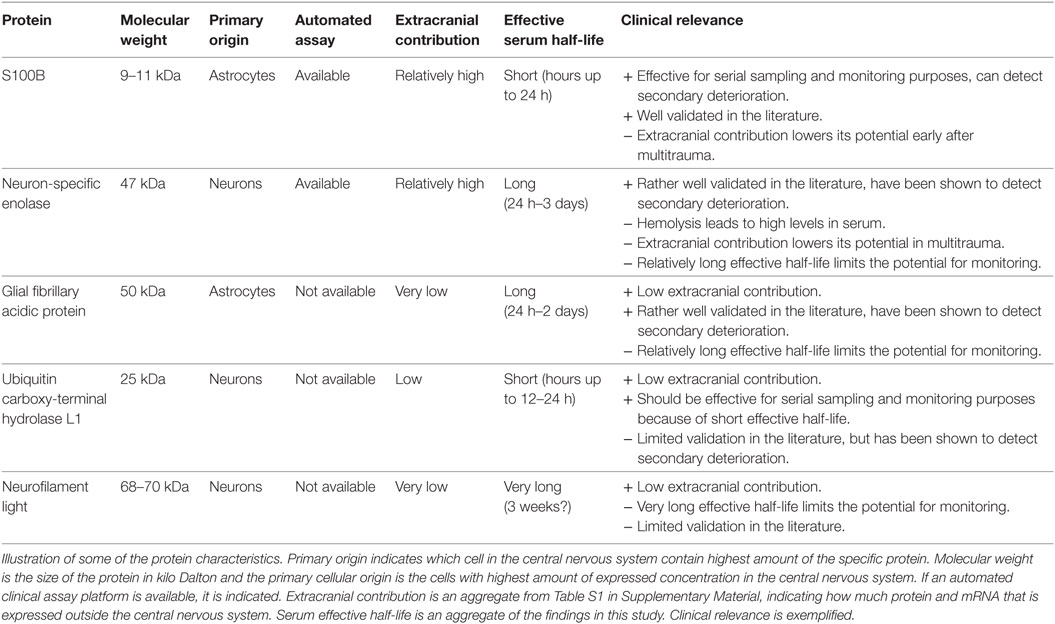
Table 6. Characteristics of the selected protein biomarkers.
Brophy et al. analyzed serum levels of UCH-L1 with a high sampling frequency and established its serum functional half-life to be in the vicinity of 7–9 h (115). They also noted it to differ between severe and mild injury. Moreover, similar to the other markers, they discovered some individual patients with secondary increases (29, 61). This decrease was slower in patients with more severe injuries and worse outcomes (29, 53), also analogous with the other biomarkers. Interestingly, and in contrast to GFAP, diffuse injury seems to lead to higher levels of UCH-L1 as compared to focal mass lesions (12). UCH-L1 is more brain specific than S100B (41), but data indicate that it is also significantly increased in patients with extracranial injuries (60). In aggregate, UCH-L1 appears to have a relatively short functional half-life, similar to that of S100B, but needs further studies to elucidate its temporal profile following trauma as well as more robust associations with extracranial injuries.
The protein NF-L is the least studied in a temporal context, presumably because no commercial assay is available at present. The two studies investigating this biomarker in TBI populations noted that serum levels of NF-L continually increased the first week(s) after injury (13, 34). There are no in vivo studies that have appropriately assessed the serum half-life of NF-L, but an in vitro report suggests that it may be as long as 3 weeks (62), which could be possible looking at available data. Surprisingly, it was found elevated even at up to a year in some patients (34), perhaps indicating ongoing pathology. Neurofilament heavy (NF-H) is another, similar, axonal protein that has been studied in TBI and shows similar trends with continually increasing serum levels the first days after trauma (63). A case series suggests that NF-L may aid in assessment of diffuse axonal injury (64), and a study indicates that it adds independent information in outcome prediction models, in addition to S100B (13). As reliable assays become more readily available, there might be a growing interest in this marker, which could reflect an ongoing neuroinflammatory pathology, distinctly different to the others studied here. However, considering its serum dynamics, it would probably provide little information on the rapid development of novel intracranial lesions the first week in the NICU but would instead be of greater interest in later, more chronic phases of TBI.
In Table 6, we present an aggregate of our findings on these markers. Our review finds the effective serum half-lives of these biomarkers to be similar in ranges to those suggested by a recently published narrative review of the field where, among others, S100B, NSE, GFAP, and UCH-L1 were included (65). In contrast to that narrative review, we have focused on the serum compartment, attempting to systematically interpret information on effective half-lives from all available studies. While it was impossible to conduct a proper meta-analysis, we summarized the available literature in histograms for S100B (Figure 2A), NSE (Figure 2B), GFAP (Figure 2C), and UCH-L1 (Figure 2D), where it is possible to see that S100B and UCH-L1 have the most amount of studies that indicate a shorter effective serum half-life while GFAP and NSE exhibit relatively longer serum t1/2 (Figure 4).
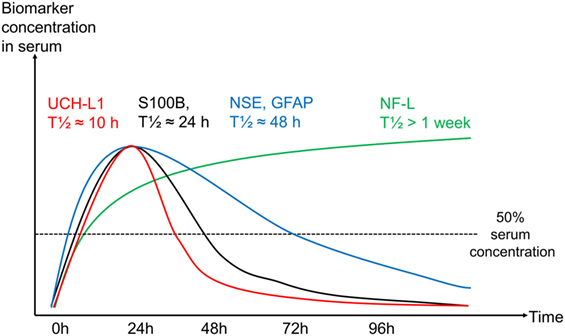
Figure 4. Protein kinetics for each protein in serum over time. Graph illustrating how the influence of an increasing effective half-life results in a serum sample in an uneventful traumatic brain injury (TBI) (without secondary deterioration) for ubiquitin carboxy-terminal hydrolase L1 (UCH-L1) (red), S100B (black), neuron-specific enolase (NSE)/glial fibrillary acidic protein (GFAP) (blue), and neurofilament light (NF-L) (green). Biomarker concentration in serum on y-axis and time in hours on x-axis. Note that these are estimates based on the knowledge of S100B kinetics in serum, current literature makes it difficult to illustrate more accurate trajectories over time for the other proteins.
Many factors could affect the contextual half-lives of the studied biomarkers, and we acknowledge that the serum effective half-lives provided here might still be inaccurate. While we excluded studies without structural imaging, we did not look at lesion progression as only one study properly reported this (9), something we believe will influence trajectories of serially sampled proteins. The association between lesion size and biomarker levels was also barely mentioned (66). Together, these conditions make it difficult to accurately generate a precise half-life due to the constant influx/efflux of the proteins to the serum compartment (20). Furthermore, some studies suggest peak times of biomarkers as related to time after trauma (73, 102, 112, 115). Currently, S100B is the only protein where attempts have been made to model the temporal contextual kinetics following injury (73), something that also needs to be performed for the others. We believe that all of these serum proteins, except for NF-L, peak relatively early in serum and any unexpected prolonged release might not be a natural progression but could indicate deterioration or ongoing damage in some way. Moreover, it is unknown to what extent these proteins are expressed after trauma, also potentially affecting levels. Additionally, extracranial injuries give rise to some of these proteins in serum as well, primarily NSE and S100B, resulting in altered serum dynamics (11, 48). While UCH-L1 and GFAP have been shown to be increased in serum of non-head injured patients as well (123), they are, together with NF-L, more brain specific (122). We show this in Table S1 in Supplementary Material, where we have gathered protein and mRNA expression (in tissues usually injured in multitrauma patients). In aggregate, extracranial contribution and injury progression need to be better assessed in future studies as it will affect contextual kinetics.
Several articles mentioned refer to the term “serum half-life” when trying to describe the temporal profiles following TBI. We believe that this description is inaccurate as we are not looking at protein decay in a single space; instead it is probably a combination of influx and efflux between bodily compartments with ongoing release from the injured brain, where actual clearance is one of many actors (20). Thus, we have used the term “effective serum half-life” to describe that concentration dynamics is presumably more accurate as this is not a process with constant decay (i.e., as is true in theory for a biological half-life).
We could not find any signs that younger patients should have a different temporal profile than adults for these proteins. Instead, and as can be seen in the tables, biomarker dynamics in serum appear to be correlated with injury severity. However and notably, pediatric populations were not nearly as frequently studied as adult TBI patients. The reference levels for healthy pediatric populations (especially the first year) of S100B and NSE have both been shown to be significantly higher than for adults (factor ×2–4) (124, 125). Nevertheless, during traumatic conditions, similar trajectories to adults are seen in pediatric populations, and serum dynamics are likely a marker of injury severity and progression not requiring separate reference levels per age group. In aggregate, age does not seem to play a major role in biomarker serum dynamics, but is not as well studied in pediatric populations as compared to adults.
The literature varies greatly in terms of the sampling frequency chosen. This may be problematic when attempting to determine the detailed kinetics. For many studies, the generally long sampling intervals chosen severely limit our knowledge of its early behavior. The choice of optimal sampling frequency to ensure faithful replication of a time series has received extensive investigation in information theory (126). In essence, the sampling frequency must be chosen to be at least twice the characteristic frequency of the signal. In other words, if changes are expected over a particular time period, then the sampling interval must be at most half of this and preferably more frequent still. Thus, we suggest that future prospective studies consider the following issues:
– Sampling frequency: It is best advised to perform a high initial sampling frequency to accurately map trajectories over time (proteins like S100B/UCH-L1 needs a higher frequency than NF-L). If early detection is the goal, then a tapered strategy may help identify peak with early frequent sampling.
– Relations to imaging: A high frequency of imaging will best aid association of biomarker trajectories with potential injury progression. Current imaging modalities in practice limit the frequency possible.
– Relations to other monitoring: High frequency multimodal monitoring (metabolism, oxygenation, intracranial pressure, etc.) may help associate biomarker trajectories with potential secondary insults/deterioration.
– TBI population: We suggest to identifying and studying TBI cohorts that are clinically and pragmatically definable such as NICU TBI patients, thus aiming to understand a biomarker in the context of the population it is expected to be clinically used in.
– Blinding: Serum biomarkers should be analyzed in retrospect or blinded as to not influence treatment strategies in a study setting.
– Analysis method: If possible, use a well validated assay, preferably with industrial-level calibration.
Readily available and reliable assays are crucial if protein biomarkers are to find routine clinical application. To date, automated assays with industrial calibrations are only available for S100B and NSE, and this makes it possible to provide reliable analyses in less than 20 min from sampling. Until this is widespread, it will be difficult for the other proteins to reach everyday use as these assays (i.e., ELISAs) take around 6 h or more to run. Moreover, without proper automatic assays with regular, standardized calibrations, there is a risk for greater inter- and intravariability between samples and studies, as has been seen between ELISA methods for S100B (67). Actually, we noticed that several studies that did use ELISA for NSE and S100B showed a different release pattern after trauma with consisting higher levels over time, as compared to the automated assays, resulting in longer serum half-lives (66, 68, 69). This is worrying as it may imply that the assays (and thus the studies) are not as comparable as has been suggested, presumably due to different antibodies used or different lower levels of detection, stressing the need for standardized testing in the field. Likely, while we did not particularly focus on the exact levels but on the temporal profiles, they would also be affected by this.
Limitations
We aimed to perform a meta-analysis of the data collected but realized that this was not possible primarily due to the use of different assays, differences in sampling time and heterogeneous patient populations. Instead, we have listed estimates of serum half-lives by assessing graphs, tables, and data sets from previous studies, which we believe generates the best possible current estimates of the effective serum half-lives of these proteins after TBI.
Studies of S100B and NSE are more frequent than studies analyzing UCH-L1 and NF-L. Results concerning the proteins with little data should be interpreted with more caution. In the case of NF-L, only two studies were available and the uncertainty is large here. Indicative of this is that in contrast to the findings on NF-L, NF-H has been found to have a short half-life in mild TBI t1/2 (48–72 h) (127). As these two components may have similar half-lives and as no mild TBI study is available for NF-L, it is possible that NF-L has a shorter t1/2 in this population as well.
It is possible that several papers coming from the same research centers contain, to some extent, the same patients several times. We have not been able to adjust for this possibility. We mention all studies in the tables but focus on the largest patient cohort from each group in the Section “Discussion.”
While we have acknowledged a difference in sampling frequency between basically all studies, one further issue is that a majority of studies report sampling since admission, not from the actual trauma time. As the dynamics for a protein such as S100B differs substantially in time the first 24 h (38), having the exact trauma time reported is essential to generate adequate models of biomarker release.
Conclusion
It is increasingly apparent that the dynamic behavior of serum TBI biomarkers varies greatly and an appreciation of this is critical for their interpretation as markers of tissue fate. The initial intracranial injury, potential extracranial trauma as well as injury progression and the occurrence of secondary injuries will influence the biomarker temporal profile. Unfortunately, while serial sampling is common in studies, few adequately comment on the temporal profiles of the analyzed proteins and even less address what sampling frequency is needed to capture information content. From a clinical perspective, and with the aim of using biomarkers as ongoing monitors of TBI patients, proteins with shorter serum availability such as S100B and UCH-L1 may be advisable as compared to proteins such as NSE, GFAP, and NF-L, as the longer peak times and half-times may lag detection of secondary harmful events. Moreover, brain specificity of the proteins should be taken into account and the need for fast, reliable assays is the definite current rate-limiting step in research that may lead biomarkers to clinical use. Further prospective research on the contextual kinetics of protein biomarkers is urgently warranted if their full diagnostic potential is to be realized.
Author Contributions
ET, DN, AE, FZ, AB, B-MB, AH, SM, and DM designed and planned the study; drafted the manuscript which all authors read and approved. ET conducted the systematic review with the help from FZ.
Conflict of Interest Statement
The authors declare that the research was conducted in the absence of any commercial or financial relationships that could be construed as a potential conflict of interest.
Funding
The following funding should be acknowledged: ET: Swedish Society of Medicine (Grant no. SLS-587221). FZ: Cambridge Commonwealth Trust Scholarship, the Royal College of Surgeons of Canada—Harry S. Morton Travelling Fellowship in Surgery, the University of Manitoba Clinician Investigator Program, R. Samuel McLaughlin Research and Education Award, the Manitoba Medical Service Foundation, and the University of Manitoba Faculty of Medicine Dean’s Fellowship Fund. AB: Hungarian Brain Research Program—Grant No. KTIA_13_NAP-A- II/8. DM: National Institute for Healthcare Research (NIHR, UK) through the Acute Brain Injury and Repair theme of the Cambridge NIHR Biomedical Research Centre, an NIHR Senior Investigator Award to DM. The authors were also supported by a European Union Framework Program 7 grant (CENTER-TBI; Grant Agreement No. 602150). AH: Medical Research Council, Cambridge Biomedical Research Centre, Royal College of Surgeons of England. The funders had no role in study design, data collection and analysis, decision to publish, or preparation of the manuscript.
Supplementary Material
The Supplementary Material for this article can be found online at http://journal.frontiersin.org/article/10.3389/fneur.2017.00300/full#supplementary-material.
References
1. Jennett B. Epidemiology of head injury. J Neurol Neurosurg Psychiatry (1996) 60:362–9. doi:10.1136/jnnp.60.4.362
2. Tagliaferri F, Compagnone C, Korsic M, Servadei F, Kraus J. A systematic review of brain injury epidemiology in Europe. Acta Neurochir (Wien) (2006) 148:255–68. doi:10.1007/s00701-005-0651-y
3. Roozenbeek B, Maas AI, Menon DK. Changing patterns in the epidemiology of traumatic brain injury. Nat Rev Neurol (2013) 9:231–6. doi:10.1038/nrneurol.2013.22
4. Maas AI, Stocchetti N, Bullock R. Moderate and severe traumatic brain injury in adults. Lancet Neurol (2008) 7:728–41. doi:10.1016/S1474-4422(08)70164-9
5. Masel BE, DeWitt DS. Traumatic brain injury: a disease process, not an event. J Neurotrauma (2010) 27:1529–40. doi:10.1089/neu.2010.1358
6. Hinkle DA, Baldwin SA, Scheff SW, Wise PM. GFAP and S100beta expression in the cortex and hippocampus in response to mild cortical contusion. J Neurotrauma (1997) 14:729–38. doi:10.1089/neu.1997.14.729
7. Raabe A, Kopetsch O, Woszczyk A, Lang J, Gerlach R, Zimmermann M, et al. S-100B protein as a serum marker of secondary neurological complications in neurocritical care patients. Neurol Res (2004) 26:440–5. doi:10.1179/016164104225015958
8. Thelin EP, Nelson DW, Bellander BM. Secondary peaks of S100B in serum relate to subsequent radiological pathology in traumatic brain injury. Neurocrit Care (2014) 20:217–29. doi:10.1007/s12028-013-9916-0
9. Thelin EP, Johannesson L, Nelson D, Bellander BM. S100B is an important outcome predictor in traumatic brain injury. J Neurotrauma (2013) 30:519–28. doi:10.1089/neu.2012.2553
10. Donato R, Sorci G, Riuzzi F, Arcuri C, Bianchi R, Brozzi F, et al. S100B’s double life: intracellular regulator and extracellular signal. Biochim Biophys Acta (2009) 1793:1008–22. doi:10.1016/j.bbamcr.2008.11.009
11. Thelin EP, Jeppsson E, Frostell A, Svensson M, Mondello S, Bellander BM, et al. Utility of neuron-specific enolase in traumatic brain injury; relations to S100B levels, outcome, and extracranial injury severity. Crit Care (2016) 20:285. doi:10.1186/s13054-016-1450-y
12. Mondello S, Papa L, Buki A, Bullock MR, Czeiter E, Tortella FC, et al. Neuronal and glial markers are differently associated with computed tomography findings and outcome in patients with severe traumatic brain injury: a case control study. Crit Care (2011) 15:R156. doi:10.1186/cc10286
13. Al Nimer F, Thelin E, Nystrom H, Dring AM, Svenningsson A, Piehl F, et al. Comparative assessment of the prognostic value of biomarkers in traumatic brain injury reveals an independent role for serum levels of neurofilament light. PLoS One (2015) 10:e0132177. doi:10.1371/journal.pone.0132177
14. Undén J, Ingebrigtsen T, Romner B; Scandinavian Neurotrauma Committee (SNC). Scandinavian guidelines for initial management of minimal, mild and moderate head injuries in adults: an evidence and consensus-based update. BMC Med (2013) 11:50. doi:10.1186/1741-7015-11-50
15. Jonsson H, Johnsson P, Hoglund P, Alling C, Blomquist S. Elimination of S100B and renal function after cardiac surgery. J Cardiothorac Vasc Anesth (2000) 14:698–701. doi:10.1053/jcan.2000.18444
16. Undén J, Romner B. Can low serum levels of S100B predict normal CT findings after minor head injury in adults?: an evidence-based review and meta-analysis. J Head Trauma Rehabil (2010) 25:228–40. doi:10.1097/HTR.0b013e3181e57e22
17. Kanner AA, Marchi N, Fazio V, Mayberg MR, Koltz MT, Siomin V, et al. Serum S100beta: a noninvasive marker of blood-brain barrier function and brain lesions. Cancer (2003) 97:2806–13. doi:10.1002/cncr.11409
18. Kleindienst A, Schmidt C, Parsch H, Emtmann I, Xu Y, Buchfelder M. The passage of S100B from brain to blood is not specifically related to the blood-brain barrier integrity. Cardiovasc Psychiatry Neurol (2010) 2010:801295. doi:10.1155/2010/801295
19. Plog BA, Dashnaw ML, Hitomi E, Peng W, Liao Y, Lou N, et al. Biomarkers of traumatic injury are transported from brain to blood via the glymphatic system. J Neurosci (2015) 35:518–26. doi:10.1523/JNEUROSCI.3742-14.2015
20. Thelin EP, Carpenter KL, Hutchinson PJ, Helmy A. Microdialysis monitoring in clinical traumatic brain injury and its role in neuroprotective drug development. AAPS J (2017) 19(2):367–76. doi:10.1208/s12248-016-0027-7
21. Goyal A, Failla MD, Niyonkuru C, Amin K, Fabio A, Berger RP, et al. S100b as a prognostic biomarker in outcome prediction for patients with severe traumatic brain injury. J Neurotrauma (2013) 30:946–57. doi:10.1089/neu.2012.2579
22. Dadas A, Washington J, Marchi N, Janigro D. Improving the clinical management of traumatic brain injury through the pharmacokinetic modeling of peripheral blood biomarkers. Fluids Barriers CNS (2016) 13:21. doi:10.1186/s12987-016-0045-y
23. Usui A, Kato K, Abe T, Murase M, Tanaka M, Takeuchi E. S-100ao protein in blood and urine during open-heart surgery. Clin Chem (1989) 35:1942–4.
24. Molina R, Navarro J, Filella X, Castel T, Ballesta AM. S-100 protein serum levels in patients with benign and malignant diseases: false-positive results related to liver and renal function. Tumour Biol (2002) 23:39–44. doi:10.1159/000048687
25. Gross S, Homan van der Heide JJ, van Son WJ, Gans RO, Foell D, Navis G, et al. Body mass index and creatinine clearance are associated with steady-state serum concentrations of the cell damage marker S100B in renal transplant recipients. Med Sci Monit (2010) 16:CR318–24.
26. Johnsson P, Blomquist S, Luhrs C, Malmkvist G, Alling C, Solem JO, et al. Neuron-specific enolase increases in plasma during and immediately after extracorporeal circulation. Ann Thorac Surg (2000) 69:750–4. doi:10.1016/S0003-4975(99)01393-4
27. Mercier E, Boutin A, Lauzier F, Fergusson DA, Simard JF, Zarychanski R, et al. Predictive value of S-100beta protein for prognosis in patients with moderate and severe traumatic brain injury: systematic review and meta-analysis. BMJ (2013) 346:f1757. doi:10.1136/bmj.f1757
28. Mercier E, Boutin A, Shemilt M, Lauzier F, Zarychanski R, Fergusson DA, et al. Predictive value of neuron-specific enolase for prognosis in patients with moderate or severe traumatic brain injury: a systematic review and meta-analysis. CMAJ Open (2016) 4:E371–82. doi:10.9778/cmajo.20150061
29. Dash PK, Zhao J, Hergenroeder G, Moore AN. Biomarkers for the diagnosis, prognosis, and evaluation of treatment efficacy for traumatic brain injury. Neurotherapeutics (2010) 7:100–14. doi:10.1016/j.nurt.2009.10.019
30. Maas AI, Menon DK, Steyerberg EW, Citerio G, Lecky F, Manley GT, et al. Collaborative European NeuroTrauma effectiveness research in traumatic brain injury (CENTER-TBI): a prospective longitudinal observational study. Neurosurgery (2015) 76:67–80. doi:10.1227/NEU.0000000000000575
31. Higgins JP, Green S. Cochrane Handbook for Systematic Reviews of Interventions. England: John Wiley & Sons Ltd (2008).
32. Panic N, Leoncini E, de Belvis G, Ricciardi W, Boccia S. Evaluation of the endorsement of the preferred reporting items for systematic reviews and meta-analysis (PRISMA) statement on the quality of published systematic review and meta-analyses. PLoS One (2013) 8:e83138. doi:10.1371/journal.pone.0083138
33. Teasdale G, Jennett B. Assessment and prognosis of coma after head injury. Acta Neurochir (Wien) (1976) 34:45–55. doi:10.1007/BF01405862
34. Baker AJ, Rhind SG, Morrison LJ, Black S, Crnko NT, Shek PN, et al. Resuscitation with hypertonic saline-dextran reduces serum biomarker levels and correlates with outcome in severe traumatic brain injury patients. J Neurotrauma (2009) 26:1227–40. doi:10.1089/neu.2008.0868
35. Chabok SY, Moghadam AD, Saneei Z, Amlashi FG, Leili EK, Amiri ZM. Neuron-specific enolase and S100BB as outcome predictors in severe diffuse axonal injury. J Trauma Acute Care Surg (2012) 72:1654–7. doi:10.1097/TA.0b013e318246887e
36. DeFazio MV, Rammo RA, Robles JR, Bramlett HM, Dietrich WD, Bullock MR. The potential utility of blood-derived biochemical markers as indicators of early clinical trends following severe traumatic brain injury. World Neurosurg (2014) 81:151–8. doi:10.1016/j.wneu.2013.01.015
37. Dimopoulou I, Korfias S, Dafni U, Anthi A, Psachoulia C, Jullien G, et al. Protein S-100b serum levels in trauma-induced brain death. Neurology (2003) 60:947–51. doi:10.1212/01.WNL.0000049931.77887.7F
38. Ghori KA, Harmon DC, Elashaal A, Butler M, Walsh F, O’Sullivan MG, et al. Effect of midazolam versus propofol sedation on markers of neurological injury and outcome after isolated severe head injury: a pilot study. Crit Care Resusc (2007) 9:166–71.
39. Jackson RG, Samra GS, Radcliffe J, Clark GH, Price CP. The early fall in levels of S-100 beta in traumatic brain injury. Clin Chem Lab Med (2000) 38:1165–7. doi:10.1515/CCLM.2000.179
40. Joseph B, Pandit V, Zangbar B, Kulvatunyou N, Khalil M, Tang A, et al. Secondary brain injury in trauma patients: the effects of remote ischemic conditioning. J Trauma Acute Care Surg (2015) 78:698–703. doi:10.1097/TA.0000000000000584
41. Korfias S, Stranjalis G, Boviatsis E, Psachoulia C, Jullien G, Gregson B, et al. Serum S-100B protein monitoring in patients with severe traumatic brain injury. Intensive Care Med (2007) 33:255–60. doi:10.1007/s00134-006-0463-4
42. Li ZM, Xiao YL, Zhu JX, Geng FY, Guo CJ, Chong ZL, et al. Recombinant human erythropoietin improves functional recovery in patients with severe traumatic brain injury: a randomized, double blind and controlled clinical trial. Clin Neurol Neurosurg (2016) 150:80–3. doi:10.1016/j.clineuro.2016.09.001
43. Murillo-Cabezas F, Munoz-Sanchez MA, Rincon-Ferrari MD, Martin-Rodriguez JF, Amaya-Villar R, Garcia-Gomez S, et al. The prognostic value of the temporal course of S100beta protein in post-acute severe brain injury: a prospective and observational study. Brain Inj (2010) 24:609–19. doi:10.3109/02699051003652823
44. Nylén K, Ost M, Csajbok LZ, Nilsson I, Hall C, Blennow K, et al. Serum levels of S100B, S100A1B and S100BB are all related to outcome after severe traumatic brain injury. Acta Neurochir (Wien) (2008) 150:221–7. doi:10.1007/s00701-007-1489-2
45. Olivecrona M, Rodling-Wahlstrom M, Naredi S, Koskinen LO. S-100B and neuron specific enolase are poor outcome predictors in severe traumatic brain injury treated by an intracranial pressure targeted therapy. J Neurol Neurosurg Psychiatry (2009) 80:1241–7. doi:10.1136/jnnp.2008.158196
46. Olivecrona Z, Koskinen LO. The release of S-100B and NSE in severe traumatic head injury is associated with APOE epsilon4. Acta Neurochir (Wien) (2012) 154:675–80. doi:10.1007/s00701-012-1292-6
47. Olivecrona Z, Bobinski L, Koskinen LO. Association of ICP, CPP, CT findings and S-100B and NSE in severe traumatic head injury. Prognostic value of the biomarkers. Brain Inj (2015) 29:446–54. doi:10.3109/02699052.2014.989403
48. Pelinka LE, Toegel E, Mauritz W, Redl H. Serum S 100 B: a marker of brain damage in traumatic brain injury with and without multiple trauma. Shock (2003) 19:195–200. doi:10.1097/00024382-200303000-00001
49. Pleines UE, Morganti-Kossmann MC, Rancan M, Joller H, Trentz O, Kossmann T. S-100 beta reflects the extent of injury and outcome, whereas neuronal specific enolase is a better indicator of neuroinflammation in patients with severe traumatic brain injury. J Neurotrauma (2001) 18:491–8. doi:10.1089/089771501300227297
50. Raabe A, Menon DK, Gupta S, Czosnyka M, Pickard JD. Jugular venous and arterial concentrations of serum S-100B protein in patients with severe head injury: a pilot study. J Neurol Neurosurg Psychiatry (1998) 65:930–2. doi:10.1136/jnnp.65.6.930
51. Raabe A, Seifert V. Fatal secondary increase in serum S-100B protein after severe head injury. Report of three cases. J Neurosurg (1999) 91:875–7. doi:10.3171/jns.1999.91.5.0875
52. Raheja A, Sinha S, Samson N, Bhoi S, Subramanian A, Sharma P, et al. Serum biomarkers as predictors of long-term outcome in severe traumatic brain injury: analysis from a randomized placebo-controlled Phase II clinical trial. J Neurosurg (2016) 125:631–41. doi:10.3171/2015.6.JNS15674
53. Rodriguez-Rodriguez A, Egea-Guerrero JJ, Leon-Justel A, Gordillo-Escobar E, Revuelto-Rey J, Vilches-Arenas A, et al. Role of S100B protein in urine and serum as an early predictor of mortality after severe traumatic brain injury in adults. Clin Chim Acta (2012) 414:228–33. doi:10.1016/j.cca.2012.09.025
54. Rodriguez-Rodriguez A, Egea-Guerrero JJ, Gordillo-Escobar E, Enamorado-Enamorado J, Hernandez-Garcia C, Ruiz de Azua-Lopez Z, et al. S100B and neuron-specific enolase as mortality predictors in patients with severe traumatic brain injury. Neurol Res (2016) 38:130–7. doi:10.1080/01616412.2016.1144410
55. Rothoerl RD, Woertgen C, Holzschuh M, Metz C, Brawanski A. Rapid evaluation of S-100 serum levels. Case report and comparison to previous results. Brain Inj (1999) 13:387–91. doi:10.1080/026990599121584
56. Shahim P, Gren M, Liman V, Andreasson U, Norgren N, Tegner Y, et al. Serum neurofilament light protein predicts clinical outcome in traumatic brain injury. Sci Rep (2016) 6:36791. doi:10.1038/srep36791
57. Shakeri M, Mahdkhah A, Panahi F. S100B protein as a post-traumatic biomarker for prediction of brain death in association with patient outcomes. Arch Trauma Res (2013) 2:76–80. doi:10.5812/atr.8549
58. Ucar T, Baykal A, Akyuz M, Dosemeci L, Toptas B. Comparison of serum and cerebrospinal fluid protein S-100b levels after severe head injury and their prognostic importance. J Trauma (2004) 57:95–8. doi:10.1097/01.TA.0000071352.95491.75
59. Undén J, Bellner J, Reinstrup P, Romner B. Serial S100B levels before, during and after cerebral herniation. Br J Neurosurg (2004) 18:277–80. doi:10.1080/02688690410001732742
60. Watt SE, Shores EA, Baguley IJ, Dorsch N, Fearnside MR. Protein S-100 and neuropsychological functioning following severe traumatic brain injury. Brain Inj (2006) 20:1007–17. doi:10.1080/02699050600909698
61. Yan EB, Satgunaseelan L, Paul E, Bye N, Nguyen P, Agyapomaa D, et al. Post-traumatic hypoxia is associated with prolonged cerebral cytokine production, higher serum biomarker levels, and poor outcome in patients with severe traumatic brain injury. J Neurotrauma (2014) 31:618–29. doi:10.1089/neu.2013.3087
62. Akhtar JI, Spear RM, Senac MO, Peterson BM, Diaz SM. Detection of traumatic brain injury with magnetic resonance imaging and S-100B protein in children, despite normal computed tomography of the brain. Pediatr Crit Care Med (2003) 4:322–6. doi:10.1097/01.PCC.0000075323.47797.B8
63. Enochsson L, Carlsson-Sanz S, van der Linden J. The influence of alcohol and time on the S-100B levels of patients with minor head injury. Eur J Neurol (2005) 12:445–8. doi:10.1111/j.1468-1331.2005.00996.x
64. Ingebrigtsen T, Romner B, Kongstad P, Langbakk B. Increased serum concentrations of protein S-100 after minor head injury: a biochemical serum marker with prognostic value? J Neurol Neurosurg Psychiatry (1995) 59:103–4. doi:10.1136/jnnp.59.1.103-a
65. Ingebrigtsen T, Romner B. Serial S-100 protein serum measurements related to early magnetic resonance imaging after minor head injury. Case report. J Neurosurg (1996) 85:945–8. doi:10.3171/jns.1996.85.5.0945
66. Woertgen C, Rothoerl RD, Holzschuh M, Metz C, Brawanski A. Comparison of serial S-100 and NSE serum measurements after severe head injury. Acta Neurochir (Wien) (1997) 139:1161–4. doi:10.1007/BF01410977
67. Berger RP, Adelson PD, Richichi R, Kochanek PM. Serum biomarkers after traumatic and hypoxemic brain injuries: insight into the biochemical response of the pediatric brain to inflicted brain injury. Dev Neurosci (2006) 28:327–35. doi:10.1159/000094158
68. Blyth BJ, Farhavar A, Gee C, Hawthorn B, He H, Nayak A, et al. Validation of serum markers for blood-brain barrier disruption in traumatic brain injury. J Neurotrauma (2009) 26:1497–507. doi:10.1089/neu.2008-0738
69. Buonora JE, Yarnell AM, Lazarus RC, Mousseau M, Latour LL, Rizoli SB, et al. Multivariate analysis of traumatic brain injury: development of an assessment score. Front Neurol (2015) 6:68. doi:10.3389/fneur.2015.00068
70. Chatfield DA, Zemlan FP, Day DJ, Menon DK. Discordant temporal patterns of S100beta and cleaved tau protein elevation after head injury: a pilot study. Br J Neurosurg (2002) 16:471–6. doi:10.1080/0268869021000030285
71. Di Battista AP, Buonora JE, Rhind SG, Hutchison MG, Baker AJ, Rizoli SB, et al. Blood biomarkers in moderate-to-severe traumatic brain injury: potential utility of a multi-marker approach in characterizing outcome. Front Neurol (2015) 6:110. doi:10.3389/fneur.2015.00110
72. Elting JW, de Jager AE, Teelken AW, Schaaf MJ, Maurits NM, van der Naalt J, et al. Comparison of serum S-100 protein levels following stroke and traumatic brain injury. J Neurol Sci (2000) 181:104–10. doi:10.1016/S0022-510X(00)00442-1
73. Ercole A, Thelin EP, Holst A, Bellander BM, Nelson DW. Kinetic modelling of serum S100b after traumatic brain injury. BMC Neurol (2016) 16:93. doi:10.1186/s12883-016-0614-3
74. Herrmann M, Curio N, Jost S, Wunderlich MT, Synowitz H, Wallesch CW. Protein S-100B and neuron specific enolase as early neurobiochemical markers of the severity of traumatic brain injury. Restor Neurol Neurosci (1999) 14:109–14.
75. Herrmann M, Jost S, Kutz S, Ebert AD, Kratz T, Wunderlich MT, et al. Temporal profile of release of neurobiochemical markers of brain damage after traumatic brain injury is associated with intracranial pathology as demonstrated in cranial computerized tomography. J Neurotrauma (2000) 17:113–22. doi:10.1089/neu.2000.17.113
76. Herrmann M, Curio N, Jost S, Grubich C, Ebert AD, Fork ML, et al. Release of biochemical markers of damage to neuronal and glial brain tissue is associated with short and long term neuropsychological outcome after traumatic brain injury. J Neurol Neurosurg Psychiatry (2001) 70:95–100. doi:10.1136/jnnp.70.1.95
77. Honda M, Tsuruta R, Kaneko T, Kasaoka S, Yagi T, Todani M, et al. Serum glial fibrillary acidic protein is a highly specific biomarker for traumatic brain injury in humans compared with S-100B and neuron-specific enolase. J Trauma (2010) 69:104–9. doi:10.1097/TA.0b013e3181bbd485
78. Kellermann I, Kleindienst A, Hore N, Buchfelder M, Brandner S. Early CSF and serum S100B concentrations for outcome prediction in traumatic brain injury and subarachnoid hemorrhage. Clin Neurol Neurosurg (2016) 145:79–83. doi:10.1016/j.clineuro.2016.04.005
79. Kleindienst A, Meissner S, Eyupoglu IY, Parsch H, Schmidt C, Buchfelder M. Dynamics of S100B release into serum and cerebrospinal fluid following acute brain injury. Acta Neurochir Suppl (2010) 106:247–50. doi:10.1007/978-3-211-98811-4_46
80. McKeating EG, Andrews PJ, Mascia L. Relationship of neuron specific enolase and protein S-100 concentrations in systemic and jugular venous serum to injury severity and outcome after traumatic brain injury. Acta Neurochir Suppl (1998) 71:117–9.
81. Mofid B, Soltani Z, Khaksari M, Shahrokhi N, Nakhaee N, Karamouzian S, et al. What are the progesterone-induced changes of the outcome and the serum markers of injury, oxidant activity and inflammation in diffuse axonal injury patients? Int Immunopharmacol (2016) 32:103–10. doi:10.1016/j.intimp.2016.01.015
82. Nirula R, Diaz-Arrastia R, Brasel K, Weigelt JA, Waxman K. Safety and efficacy of erythropoietin in traumatic brain injury patients: a pilot randomized trial. Crit Care Res Pract (2010) 2010:209848. doi:10.1155/2010/209848
83. Pelinka LE, Petto H, Kroepfl A, Schmidhammer R, Redl H. Serum procalcitonin and S100B are associated with mortality after traumatic brain injury. Eur J Trauma (2003) 29:316–23. doi:10.1007/s00068-003-1314-4
84. Pelinka LE, Kroepfl A, Leixnering M, Buchinger W, Raabe A, Redl H. GFAP versus S100B in serum after traumatic brain injury: relationship to brain damage and outcome. J Neurotrauma (2004) 21:1553–61. doi:10.1089/neu.2004.21.1553
85. Petzold A, Keir G, Lim D, Smith M, Thompson EJ. Cerebrospinal fluid (CSF) and serum S100B: release and wash-out pattern. Brain Res Bull (2003) 61:281–5. doi:10.1016/S0361-9230(03)00091-1
86. Petzold A, Green AJ, Keir G, Fairley S, Kitchen N, Smith M, et al. Role of serum S100B as an early predictor of high intracranial pressure and mortality in brain injury: a pilot study. Crit Care Med (2002) 30:2705–10. doi:10.1097/00003246-200212000-00015
87. Piazza O, Storti MP, Cotena S, Stoppa F, Perrotta D, Esposito G, et al. S100B is not a reliable prognostic index in paediatric TBI. Pediatr Neurosurg (2007) 43:258–64. doi:10.1159/000103304
88. Raabe A, Grolms C, Sorge O, Zimmermann M, Seifert V. Serum S-100B protein in severe head injury. Neurosurgery (1999) 45:477–83. doi:10.1097/00006123-199909000-00012
89. Raabe A, Seifert V. Protein S-100B as a serum marker of brain damage in severe head injury: preliminary results. Neurosurg Rev (2000) 23:136–8. doi:10.1007/PL00011944
90. Undén J, Astrand R, Waterloo K, Ingebrigtsen T, Bellner J, Reinstrup P, et al. Clinical significance of serum S100B levels in neurointensive care. Neurocrit Care (2007) 6:94–9. doi:10.1007/s12028-007-0005-0
91. Walder B, Robin X, Rebetez MM, Copin JC, Gasche Y, Sanchez JC, et al. The prognostic significance of the serum biomarker heart-fatty acidic binding protein in comparison with s100b in severe traumatic brain injury. J Neurotrauma (2013) 30:1631–7. doi:10.1089/neu.2012.2791
92. Welch RD, Ellis M, Lewis LM, Ayaz SI, Mika VH, Millis S, et al. Modeling the kinetics of serum glial fibrillary acidic protein, ubiquitin carboxyl-terminal hydrolase-L1, and S100B concentrations in patients with traumatic brain injury. J Neurotrauma (2017) 34(11):1957–71. doi:10.1089/neu.2016.4772
93. Zurek J, Fedora M. The usefulness of S100B, NSE, GFAP, NF-H, secretagogin and Hsp70 as a predictive biomarker of outcome in children with traumatic brain injury. Acta Neurochir (Wien) (2012) 154:93–103. doi:10.1007/s00701-011-1175-2
94. Vajtr D, Benada O, Kukacka J, Prusa R, Houstava L, Toupalik P, et al. Correlation of ultrastructural changes of endothelial cells and astrocytes occurring during blood brain barrier damage after traumatic brain injury with biochemical markers of BBB leakage and inflammatory response. Physiol Res (2009) 58:263–8.
95. Vajtr D, Benada O, Linzer P, Samal F, Springer D, Strejc P, et al. Immunohistochemistry and serum values of S-100B, glial fibrillary acidic protein, and hyperphosphorylated neurofilaments in brain injuries. Soud Lek (2012) 57:7–12.
96. Guzel A, Er U, Tatli M, Aluclu U, Ozkan U, Duzenli Y, et al. Serum neuron-specific enolase as a predictor of short-term outcome and its correlation with Glasgow Coma Scale in traumatic brain injury. Neurosurg Rev (2008) 31:439–44. doi:10.1007/s10143-008-0148-2
97. Shahrokhi N, Soltani Z, Khaksari M, Karamouzian S, Mofid B, Asadikaram G. The serum changes of neuron-specific enolase and intercellular adhesion molecule-1 in patients with diffuse axonal injury following progesterone administration: a randomized clinical trial. Arch Trauma Res (2016) 5:e37005. doi:10.5812/atr.37005
98. Skogseid IM, Nordby HK, Urdal P, Paus E, Lilleaas F. Increased serum creatine kinase BB and neuron specific enolase following head injury indicates brain damage. Acta Neurochir (Wien) (1992) 115:106–11. doi:10.1007/BF01406367
99. Dauberschmidt R, Marangos PJ, Zinsmeyer J, Bender V, Klages G, Gross J. Severe head trauma and the changes of concentration of neuron-specific enolase in plasma and in cerebrospinal fluid. Clin Chim Acta (1983) 131:165–70. doi:10.1016/0009-8981(83)90085-2
100. Ross SA, Cunningham RT, Johnston CF, Rowlands BJ. Neuron-specific enolase as an aid to outcome prediction in head injury. Br J Neurosurg (1996) 10:471–6. doi:10.1080/02688699647104
101. Zhao L, Wang W, Zhong J, Li Y, Cheng Y, Su Z, et al. The effects of magnesium sulfate therapy after severe diffuse axonal injury. Ther Clin Risk Manag (2016) 12:1481–6. doi:10.2147/TCRM.S109482
102. Beers SR, Berger RP, Adelson PD. Neurocognitive outcome and serum biomarkers in inflicted versus non-inflicted traumatic brain injury in young children. J Neurotrauma (2007) 24:97–105. doi:10.1089/neu.2006.0055
103. Bogoslovsky T, Wilson D, Chen Y, Hanlon D, Gill J, Jeromin A, et al. Increases of plasma levels of glial fibrillary acidic protein, tau, and amyloid beta up to 90 days after traumatic brain injury. J Neurotrauma (2017) 34:66–73. doi:10.1089/neu.2015.4333
104. Lei J, Gao G, Feng J, Jin Y, Wang C, Mao Q, et al. Glial fibrillary acidic protein as a biomarker in severe traumatic brain injury patients: a prospective cohort study. Crit Care (2015) 19:362. doi:10.1186/s13054-015-1081-8
105. Lumpkins KM, Bochicchio GV, Keledjian K, Simard JM, McCunn M, Scalea T. Glial fibrillary acidic protein is highly correlated with brain injury. J Trauma (2008) 65:778–82. doi:10.1097/TA.0b013e318185db2d
106. Missler U, Wiesmann M, Wittmann G, Magerkurth O, Hagenstrom H. Measurement of glial fibrillary acidic protein in human blood: analytical method and preliminary clinical results. Clin Chem (1999) 45:138–41.
107. Nylén K, Ost M, Csajbok LZ, Nilsson I, Blennow K, Nellgard B, et al. Increased serum-GFAP in patients with severe traumatic brain injury is related to outcome. J Neurol Sci (2006) 240:85–91. doi:10.1016/j.jns.2005.09.007
108. Pelinka LE, Kroepfl A, Schmidhammer R, Krenn M, Buchinger W, Redl H, et al. Glial fibrillary acidic protein in serum after traumatic brain injury and multiple trauma. J Trauma (2004) 57:1006–12. doi:10.1097/01.TA.0000108998.48026.C3
109. Posti JP, Takala RS, Runtti H, Newcombe VF, Outtrim J, Katila AJ, et al. The levels of glial fibrillary acidic protein and ubiquitin C-terminal hydrolase-L1 during the first week after a traumatic brain injury: correlations with clinical and imaging findings. Neurosurgery (2016) 79(3):456–64. doi:10.1227/NEU.0000000000001226
110. Takala RS, Posti JP, Runtti H, Newcombe VF, Outtrim J, Katila AJ, et al. Glial fibrillary acidic protein and ubiquitin C-terminal hydrolase-L1 as outcome predictors in traumatic brain injury. World Neurosurg (2016) 87:8–20. doi:10.1016/j.wneu.2015.10.066
111. Kou Z, Gattu R, Kobeissy F, Welch RD, O’Neil BJ, Woodard JL, et al. Combining biochemical and imaging markers to improve diagnosis and characterization of mild traumatic brain injury in the acute setting: results from a pilot study. PLoS One (2013) 8:e80296. doi:10.1371/journal.pone.0080296
112. Papa L, Brophy GM, Welch RD, Lewis LM, Braga CF, Tan CN, et al. Time course and diagnostic accuracy of glial and neuronal blood biomarkers GFAP and UCH-L1 in a large cohort of trauma patients with and without mild traumatic brain injury. JAMA Neurol (2016) 73(5):551–60. doi:10.1001/jamaneurol.2016.0039
113. Fraser DD, Close TE, Rose KL, Ward R, Mehl M, Farrell C, et al. Severe traumatic brain injury in children elevates glial fibrillary acidic protein in cerebrospinal fluid and serum. Pediatr Crit Care Med (2011) 12:319–24. doi:10.1097/PCC.0b013e3181e8b32d
114. Zurek J, Fedora M. Dynamics of glial fibrillary acidic protein during traumatic brain injury in children. J Trauma (2011) 71:854–9. doi:10.1097/TA.0b013e3182140c8c
115. Brophy GM, Mondello S, Papa L, Robicsek SA, Gabrielli A, Tepas J III, et al. Biokinetic analysis of ubiquitin C-terminal hydrolase-L1 (UCH-L1) in severe traumatic brain injury patient biofluids. J Neurotrauma (2011) 28:861–70. doi:10.1089/neu.2010.1564
116. Mondello S, Linnet A, Buki A, Robicsek S, Gabrielli A, Tepas J, et al. Clinical utility of serum levels of ubiquitin C-terminal hydrolase as a biomarker for severe traumatic brain injury. Neurosurgery (2012) 70:666–75. doi:10.1227/NEU.0b013e318236a809
117. Blyth BJ, Farahvar A, He H, Nayak A, Yang C, Shaw G, et al. Elevated serum ubiquitin carboxy-terminal hydrolase L1 is associated with abnormal blood-brain barrier function after traumatic brain injury. J Neurotrauma (2011) 28:2453–62. doi:10.1089/neu.2010.1653
118. Ahmad O, Wardlaw J, Whiteley WN. Correlation of levels of neuronal and glial markers with radiological measures of infarct volume in ischaemic stroke: a systematic review. Cerebrovasc Dis (2012) 33:47–54. doi:10.1159/000332810
119. Shinozaki K, Oda S, Sadahiro T, Nakamura M, Hirayama Y, Abe R, et al. S-100B and neuron-specific enolase as predictors of neurological outcome in patients after cardiac arrest and return of spontaneous circulation: a systematic review. Crit Care (2009) 13:R121. doi:10.1186/cc7973
120. Townend W, Dibble C, Abid K, Vail A, Sherwood R, Lecky F. Rapid elimination of protein S-100B from serum after minor head trauma. J Neurotrauma (2006) 23:149–55. doi:10.1089/neu.2006.23.149
121. Haimoto H, Hosoda S, Kato K. Differential distribution of immunoreactive S100-alpha and S100-beta proteins in normal nonnervous human tissues. Lab Invest (1987) 57:489–98.
122. Sjostedt E, Fagerberg L, Hallstrom BM, Haggmark A, Mitsios N, Nilsson P, et al. Defining the human brain proteome using transcriptomics and antibody-based profiling with a focus on the cerebral cortex. PLoS One (2015) 10:e0130028. doi:10.1371/journal.pone.0130028
123. Posti JP, Hossain I, Takala RS, Liedes H, Newcombe V, Outtrim J, et al. Glial fibrillary acidic protein and ubiquitin C-terminal hydrolase-L1 are not specific biomarkers for mild CT-negative traumatic brain injury. J Neurotrauma (2017) 34(7):1427–38. doi:10.1089/neu.2016.4442
124. Abbasoglu A, Sarialioglu F, Yazici N, Bayraktar N, Haberal A, Erbay A. Serum neuron-specific enolase levels in preterm and term newborns and in infants 1-3 months of age. Pediatr Neonatol (2015) 56:114–9. doi:10.1016/j.pedneo.2014.07.005
125. Bouvier D, Fournier M, Dauphin JB, Amat F, Ughetto S, Labbe A, et al. Serum S100B determination in the management of pediatric mild traumatic brain injury. Clin Chem (2012) 58:1116–22. doi:10.1373/clinchem.2011.180828
Keywords: S100B, neuron-specific enolase, glial fibrillary acidic protein, ubiquitin carboxy-terminal hydrolase L1, neurofilament light, serum, biomarkers, traumatic brain injury
Citation: Thelin EP, Zeiler FA, Ercole A, Mondello S, Büki A, Bellander B-M, Helmy A, Menon DK and Nelson DW (2017) Serial Sampling of Serum Protein Biomarkers for Monitoring Human Traumatic Brain Injury Dynamics: A Systematic Review. Front. Neurol. 8:300. doi: 10.3389/fneur.2017.00300
Received: 30 April 2017; Accepted: 12 June 2017;
Published: 03 July 2017
Edited by:
Mattias K. Sköld, Uppsala University, SwedenReviewed by:
Linda Noble, University of California, San Francisco, United StatesAndrew K. Ottens, Virginia Commonwealth University, United States
Copyright: © 2017 Thelin, Zeiler, Ercole, Mondello, Büki, Bellander, Helmy, Menon and Nelson. This is an open-access article distributed under the terms of the Creative Commons Attribution License (CC BY). The use, distribution or reproduction in other forums is permitted, provided the original author(s) or licensor are credited and that the original publication in this journal is cited, in accordance with accepted academic practice. No use, distribution or reproduction is permitted which does not comply with these terms.
*Correspondence: Eric Peter Thelin, eric.thelin@ki.se