 Gloria C. Chiang
 Ilhami Kovanlikaya
 Changho Choi2
 Rohan Ramakrishna
 Rajiv Magge
 Dikoma C. Shungu
- 1Department of Neuroradiology, Weill Cornell Medical College, New York, NY, United States
- 2Radiology, Advanced Imaging Research Center, University of Texas Southwestern Medical Center, Dallas, TX, United States
- 3Department of Neurological Surgery, Weill Cornell Medical College, New York, NY, United States
- 4Department of Neurology, Weill Cornell Medical College, New York, NY, United States
Advances in metabolic imaging techniques have allowed for more precise characterization of gliomas, particularly as it relates to tumor recurrence or pseudoprogression. Furthermore, the emerging field of radiogenomics where radiographic features are systemically correlated with molecular markers has the potential to achieve the holy grail of neuro-oncologic neuro-radiology, namely molecular diagnosis without requiring tissue specimens. In this section, we will review the utility of metabolic imaging and discuss the current state of the art related to the radiogenomics of glioblastoma.
Introduction
The role of neuro-radiology in the management of glioma has shown a stepwise evolution over time. As the field of neuro-oncology has progressed, neuro-radiology has also made significant strides. A significant advance in the last decade has been the emergence of imaging modalities that help distinguish tumor from treatment effect. Moreover, the emerging field of radiogenomics wherein imaging features are correlated with genomic attributes of disease promises to be a significant boon for patients. Such data could serve as reliable biomarkers of disease where treating physicians could use the information to guide treatments in the absence of new pathologic specimens. In this review, we discuss metabolic imaging and radiogenomics and assess the future of these modalities, respectively.
Magnetic Resonance Spectroscopy
Proton magnetic resonance spectroscopy is a non-invasive technique that enables measurement of levels of brain metabolites. N-acetylaspartate (NAA) is widely used as a marker of neuronal integrity that is decreased in tumors. Total choline (tCho) is considered a marker of neoplastic proliferation and is important in cell membrane biosynthesis and turnover. Total creatine (tCr) is an energy metabolite that may vary based on tumor type and grade. Lactate is the end-product of glycolytic metabolism and is often increased in high-grade gliomas. Finally, measurable lipid, specifically triglycerides, is considered a marker of necrosis. Single-voxel MRS methods have been used to compare levels of these metabolites in the tumor and in adjacent or contralateral normal brain. Also available are 2-dimensional multi-slice (1) and 3-dimensional (2) multi-voxel spectroscopic imaging techniques (Figure 1), which have been used to address tumor heterogeneity, by examining different levels of these metabolites in different portions of the tumor and the surrounding brain.
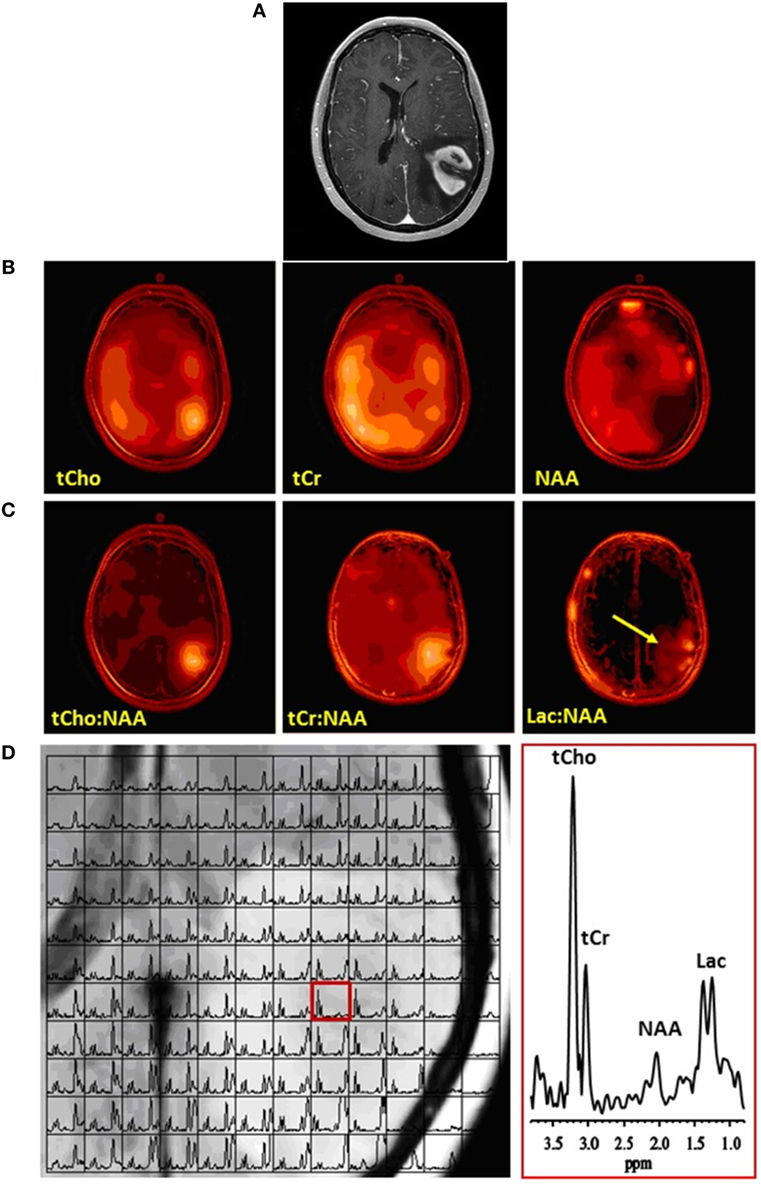
Figure 1. Multivoxel MRS of a glioblastoma. (A) Contrast-enhanced axial MR image demonstrating an enhancing mass in the left parietal lobe. (B) Corresponding multivoxel or spectroscopic imaging data displayed as color maps that show the spatial distributions of (left-to-right) total choline (tCho), total creatine (tCr), and N-acetylaspartate (NAA). Note marked elevation of tCho and decrease of NAA at the location of the tumor. (C) The same spectroscopic imaging data displayed as color maps of metabolite ratios: (left-to-right) tCho:NAA, tCr:NAA, and lactate or Lac:NAA. Because NAA decreased while tCho and Lac increased and tCr did not change appreciably, the maps of metabolite ratios to NAA result in enhancement and better definition of metabolite signals at the location of the tumor. Arrow on Lac:NAA map shows Lac to extend beyond the tumor margins. (D) (Left) Grid plot of the multivoxel data overlaid on the corresponding MR image of the tumor, and (right) a spectrum in a single voxel extracted from the multivoxel data at the location of the tumor (red box on left panel), showing clearly elevated tCho and Lac and decreased NAA resonances. No copyright permissions were required for use of these images.
Both single-voxel and multi-voxel MRS have been widely used for grading gliomas preoperatively. Commonly, ratios of metabolite peak areas are reported, with tumoral regions demonstrating higher tCho:NAA and tCho:tCr ratios, as well as lower NAA:tCr ratios, compared to non-tumoral regions. A meta-analysis of 30 studies, which included studies using both single- and multi-voxel MRS at 1.5 and 3.0 T, reported a pooled sensitivity and specificity of 80% (range 67–100%) and 76% (range 63–100%) for Cho:NAA, 75% (range 49–100%) and 60% (range 3–100%) for tCho:tCr, and 71% (range 30–100%) and 70% (range 40–100%) for NAA:tCr (3). Overall accuracy in differentiating high- and low-grade gliomas was greatest with the tCho:NAA, with an area under the curve of 0.87. Another study that evaluated molar or “absolute” metabolite concentrations rather than peak area ratios found that a maximum tCho concentration cutoff of 2.02 mmol/L resulted in a sensitivity of 86% and specificity of 78%, and a mean tCho concentration cutoff of 1.52 mmol/L resulted in a sensitivity of 78% and specificity of 63% (4).
There are several limitations of MRS. First, MRS requires relatively long scan times, particularly for multivoxel MRS, due to the millimolar-range concentration of the metabolites and the limited detection sensitivity of the technique. Second, MRS requires additional post-processing time and expertise for multi-voxel and several specialized single-voxel techniques. Finally, voxel placement is user-dependent and requires avoiding contamination of metabolites of interest with lipid signal from the calvarial marrow, particularly at the skull base, and soft tissues of the scalp.
The 1H MRS technique is also useful in differentiating between recurrent tumor and radiation necrosis in posttreatment glioma surveillance. As in the pretreatment setting, recurrent tumors demonstrate higher tCho:NAA and tCho:tCr, as well as lower NAA:tCr, compared to radiation necrosis (5–8). Sensitivity ranges from 36 to 94%, specificity 55–100% (5, 8–14), with accuracy as high as 97% (7, 8). A systematic review of 17 prior studies found a weighted average sensitivity of 86% and specificity of 80% (9). Another study reported the added utility of the tCho:tCr peak area using multivoxel MRS, resulting in an area-under-the-curve of 0.91, sensitivity 96%, specificity 83%, and the tCho:NAA peak-height (area-under-the-curve 0.91, sensitivity 91%, specificity 83%), which performed better than single-voxel MRS (10).
Recent literature has focused on the importance of isocitrate dehydrogenase (IDH) mutations in glioma prognostication (11, 12). Gliomas that harbor an IDH mutation accumulate the oncometabolite, R-2-hydroxyglutarate (2HG), which can be detected by 1H MRS (Figure 2) (13). A recent longitudinal study in 136 glioma patients showed that 2HG MRS provides a noninvasive means of monitoring IDH-mutated tumor cells during disease progression and treatment (14). In a prospective longitudinal cohort of 89 patients (15), 2HG MRS was found to have a high test–retest correlation of 0.98 and had a sensitivity of 100% and specificity of 88% using a threshold of 1 mmol/L. A study using a similar cutoff of 1.489 mmol/L for 2HG MRS found a sensitivity of 100% and specificity of 72%, with higher concentrations predicting better survival (16). The use of 2HG MRS in the preoperative setting may enable a diagnosis of IDH mutant glioma more rapidly and practically than genetic testing and may thus serve as a biomarker for selecting patients who may be ideal candidates for neoadjuvant or adjuvant IDH-inhibitor trials. This technique could also serve as a noninvasive marker for monitoring tumor volume changes throughout the course of the trials, complementing conventional MR imaging with highly specific information on the status of tumor cells.
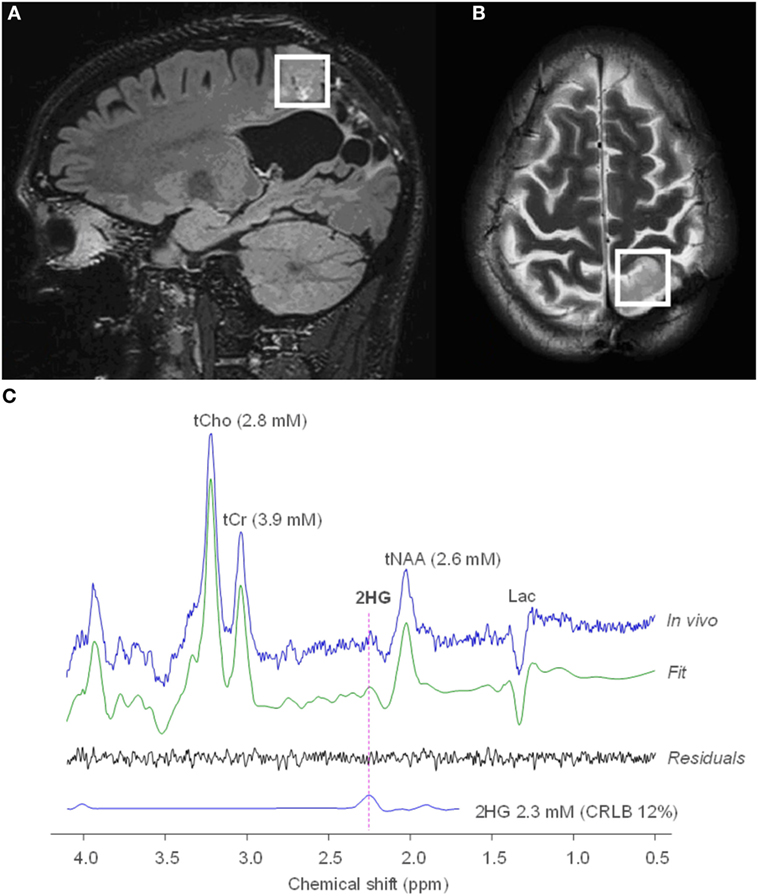
Figure 2. MRS of R-2-hydroxyglutarate (2HG) in an oligodendroglioma. Sagittal 3D T2 FLAIR (A) and axial T2-weighted (B) imaging shows a T2-hyperintense mass in the left parietal lobe. Single voxel MRS in the tumoral region demonstrates elevated 2HG concentration (C), compatible with an isocitrate dehydrogenase-mutated glioma. No copyright permissions were required for use of these images.
Finally, alterations in tumor metabolism are being exploited for therapeutic approaches. For example, a ketogenic diet has been reported as a potential metabolic therapy for gliomas, since tumor cells may lack the flexibility to use ketone bodies during glucose restriction whereas normal brain cells can. MRS may thus detect elevated levels of ketone bodies in the brain, either due to increased uptake of ketone bodies in the brain or decreased utilization by tumor cells (17). Furthermore, increased expression of lactate dehydrogenase A has been described in glioblastoma, resulting in increased production of lactate, termed the Warburg effect (18). Using 13C MRS and hyperpolarization of 13C-labeled pyruvate, we can now monitor conversion to 13C-labeled lactate in real time. An increase in the hyperpolarized lactate-to-pyruvate ratio has been shown in murine models of glioblastoma, and a decrease in this ratio has been shown to follow treatment with inhibitors of the phosphoinositide 3-kinase/mammalian target of rapamycin (PI3K/mTOR) and temozolomide (19–22). As a first-in-man study in a small cohort of prostate cancer patients demonstrated the safety and feasibility of using hyperpolarized 13C MRS in cancer surveillance (23), more clinical trials in gliomas will likely be underway.
The role of MRS in glioma management has transitioned from identifying a classic tumor signature, i.e., an elevated choline-to-NAA ratio, to identifying specific oncometabolites, such as 2HG in IDH-mutated gliomas. As future glioma therapies target specific cancer metabolic pathways, incorporating the imaging specificity afforded by hyperpolarized 13C MRS into routine multimodal imaging surveillance will be of utmost importance.
Positron Emission Tomography (PET)
2-(18F) fluoro-2-deoxy-d-glucose (FDG) PET has been widely used in the imaging of brain tumors. As a glucose analog, FDG is actively transported into the cell and phosphorylated by hexokinase in the glycolytic pathway. As a result, the FDG is trapped within the cell and can be imaged with uptake on PET being a proxy for glucose utilization and metabolic activity. High-grade brain tumors, being metabolically active, can demonstrate FDG uptake that is greater than normal surrounding brain regions, providing a means for non-invasive tumor diagnosis and monitoring. The commonly used metric to assess metabolic activity is the standardized uptake value (SUV), a ratio of the concentration of radioactivity in tissue to the injected dose per kilogram of the patient’s body weight. The SUV within a region-of-interest placed over the tumor can then be compared to a reference region, providing a semiquantitative measure of metabolic activity; either normal-appearing white matter or gray matter is typically used as a reference region.
This difference in metabolic activity has been widely utilized in the pretreatment setting to differentiate low and high-grade gliomas. Quantitatively, an SUV ratio of tumor to gray matter of greater than 0.6–0.7 and an SUV ratio of tumor to white matter of greater than 1.2–1.5 were suggestive of high-grade tumors (24–26). Posttreatment, the primary role of FDG-PET is to differentiate metabolically active tumor from treatment-related changes, such as radiation necrosis. As with pretreatment glioma grading, a visual rating scale, such as the Schifter metabolic grading scale (27), is commonly used to compare FDG uptake within a new or enlarging enhancing mass and normal white or gray matter. Although this grading scale can be easily and rapidly used in clinical practice, without the requirement of advanced and often time-consuming postprocessing, its reproducibility and accuracy have been questioned, with reported sensitivities ranging from 75 to 86% and specificities ranging from 22 to 95% (28–33). Furthermore, a meta-analysis of 26 studies reported a pooled sensitivity of 77% and specificity of 78% (34). Quantitative approaches for differentiating tumor from treatment-related changes have also been reported, with sensitivities ranging from 50 to 100% and specificities ranging from 65 to 100% (24, 31, 35–41). Reported optimal SUV cutoff ratios have ranged from 0.5 to 1.05 using normal gray matter as a reference region, 1.3 to 1.5 using normal white matter as a reference, and 1.2 to 1.35 using a mirror-image location as a reference. Finding more specific PET tracers to differentiate tumor from treatment-related changes is an area of active research.
In addition to grading gliomas and differentiating tumor from radiation necrosis, metabolic activity on FDG-PET has also been found to be prognostic. In a large cohort of 331 patients with low- and high-grade gliomas, Padma et al. (42) found that a metabolic grading scale accurately predicted overall survival. In a study of patients about to undergo treatment with bevacizumab and irinotecan for recurrent high-grade glioma, the maximum tumor SUV and the ratio of tumor SUV to contralateral normal cortex were both predictive of progression-free survival and overall survival on pretreatment FDG-PET (35). Posttreatment, both FDG-PET uptake (43, 44) and metabolic tumor volumes (45) have been reported to be prognostic. Further work may identify meaningful ways of combining FDG-PET and MR imaging variables with genetic/molecular markers for improved prognostication among patients with brain tumors.
Due to the lack of specificity of FDG-PET, particularly in the posttreatment setting, newer PET agents have been developed and reported. For example, amino acid analogs have been studied, since they are taken up at greater rates by amino acid transporters in tumors compared to non-tumor tissue. One of the earliest amino acid tracers reported in brain tumor imaging was l-methyl-11C-methionine (11C-MET). Pirotte et al. (46) found that 11C-MET PET was more accurate than FDG-PET in guiding tumor biopsies. 11C-MET PET was also reported to differentiate between low- and high-grade gliomas (24, 47, 48), differentiate grade 2 and grade 3 gliomas (49), correlate with proliferation (48) and vascularity (47), predict progression-free survival (49), and differentiate between recurrent tumor and radiation necrosis (50–52). However, a meta-analysis found that 11C-MET PET in the posttreatment setting remained less accurate than MR perfusion (53), with false positives seen with inflammation, necrosis, and hematomas (47, 48, 51). Due to the short half-life of 11C-MET, fluorinated amino acid analogs, i.e., O-2-18F-fluoroethyl-l-tyrosine and 3,4-dihydroxy-6-18F-fluoro-l-phenylalanine were developed and used in tumor imaging. Both the pretreatment sensitivity and specificity for detecting tumor have been reported to be 88%, with accuracy increasing to 97% with the addition of MR spectroscopy (54). Similarly, 18F-FET time–activity curves were reported to be only 67% accurate in differentiating low- and high-grade tumors, reaching 100% specificity after combination with ADC histogram analysis (55).
Posttreatment (18), F-FET has been found to be more sensitive and specific than conventional MRI in differentiating recurrent tumor from radiation necrosis, with sensitivities of 100% and specificities of 93–100% (56, 57). Tumor-to-brain ratios and textural features of 18F-FET have also been reported to differentiate pseudoprogression from true tumor progression, even more than 3 months after completion of radiochemotherapy (18, 58, 59). F-FDOPA PET can similarly detect tumor with higher sensitivity and specificity than FDG-PET, as well as differentiate tumor from radiation necrosis (60, 61). However, it has limited utility in differentiating low- and high-grade tumors (60). More recently, trans-1-amino-2-[18F]-fluorocyclobutane-carboxylic acid (18F-FACBC) has been reported to have a higher maximum SUV and tumor-to-background ratio than 11C-MET and 18F-FET (62). Finally, PET imaging with the radiotracer, alpha-[(11)C]-methyl-l-tryptophan, was reported to predict the location of subsequent tumor progression (63) and sites of radiation failure when used in treatment planning (64, 65). Prospective trials are ongoing to determine if adding amino-acid PET to MRI guidance for treatment planning improves progression-free survival in recurrent glioblastoma (66). These amino acid PET tracers remain investigational and more studies need to be done to determine whether they should be integrated into routine clinical practice.
Finally, several additional investigational PET tracers warrant discussion. The first, 3′-deoxy-3′[18F]-fluorothymidine accumulates within the cell after phosphorylation by thymidine kinase and is a marker of cell proliferation and DNA synthesis. As might be expected, 18F-FLT PET has been found to better differentiate between low- and high-grade gliomas (67, 68) than MR perfusion or MRS (68), and it demonstrates a stronger correlation with markers of proliferation, tumor progression, and overall survival than FDG-PET (67). However, there is less overall uptake than FDG-PET (67). Second, PET imaging using the tracer, 18F-fluoromisonidazole, has been reported as a quantitative measure of tumor hypoxia in glioblastomas, which may accelerate angiogenesis and shorten survival (69). Finally, specific PET tracers provide a non-invasive means of monitoring specific proteins important in tumor angiogenesis and invasion. Examples include 68gallium-labeled tracers targeting prostate-specific membrane antigen (18, 70), F-2-fluoropropionyl-labeled PEGylated dimeric arginine-glycine–aspartic acid (RGD) peptide targeting integrin αvβ3 (71), and 89Zr-labeled p-isothiocyanatobenzyl-desferrioxamine, targeting membrane-type 1 matrix metalloproteinase, important for tumor invasion (72).
Several limitations to PET imaging of gliomas should be addressed. Practically, the added cost, time, and radiation exposure of PET are hindrances for the routine addition of PET to MR imaging surveillance of gliomas. Furthermore, besides FDG, these PET tracers remain investigational and require access to radiochemistry laboratories and a cyclotron for 11C-compounds. Finally, PET imaging is limited by suboptimal spatial resolution; FDG uptake can be difficult to discern adjacent to areas of normal metabolically active cortex, and 18F-FDOPA can be difficult to discern adjacent to the basal ganglia. Indeed, one study comparing FDG-PET and MR perfusion found that FDG PET was less accurate in differentiating tumor from treatment-related changes (73). The advent of simultaneous PET-MRI scanners addresses some of these issues by reducing radiation exposure compared to a PET-CT, reducing imaging time by simultaneously acquiring the PET and MRI, and improving anatomical resolution for precise localization of metabolic uptake (Figures 3 and 4). Future studies will determine whether simultaneous PET-MRI significantly increases accuracy and changes management in the setting of brain tumor imaging. Until this added accuracy is demonstrated, FDG-PET will likely serve as a problem-solving tool when MR perfusion and spectroscopy are equivocal.
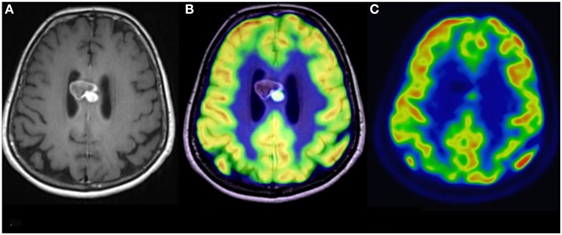
Figure 3. Simultaneous fluoro-2-deoxy-d-glucose (FDG) positron emission tomography (PET)-MRI of a glioblastoma. (A) Contrast-enhanced axial MR image demonstrating a heterogeneously enhancing mass in the corpus callosum. (B) Co-registered PET-MR image accurately demonstrating that the focus of elevated FDG avidity corresponds to the solidly enhancing component. (C) FDG PET image, without co-registration with MRI, demonstrates a focus of elevated FDG-avidity. No copyright permissions were required for use of these images.
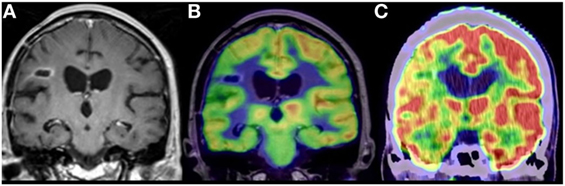
Figure 4. Anaplastic astrocytoma, status post surgery, radiation, and chemotherapy. (A) Contrast-enhanced coronal MR image demonstrating nodular enhancement about a right frontal operculum cavity. (B) Simultaneous co-registered positron emission tomography (PET)-MR image accurately demonstrating that the area of nodular enhancement has no associated elevated fluoro-2-deoxy-d-glucose (FDG) avidity. (C) Coronal image from a fused FDG PET-CT demonstrating no elevated FDG avidity in the region of nodular enhancement, although the anatomical resolution is limited compared to the PET-MR. No copyright permissions were required for use of these images.
Radiogenomics
Classically, the field of radiology has been primarily focused on correlating imaging and histopathological findings. However, oncologic diagnosis is quickly moving beyond traditional morphological approaches to molecular stratification; the traditional radiological–pathological correlation paradigm alone is no longer sufficient (74). In addition, while still the gold standard, numerous studies have shown that the histopathological classification of diffuse gliomas is prone to high inter-observer variation, correlates inconsistently with genetic markers, and imperfectly predicts clinical outcomes (75, 76).
Radiogenomics is a promising new paradigm to bring clinical imaging into the molecular and genomics era, by identifying relationships between imaging features (imaging phenotypes) and molecular markers (Figure 5). The imaging and molecular data can then be integrated with clinical outcomes, such as overall survival, time to progression, or response to a particular drug therapy. Although imaging data cannot substitute for histopathologic findings, extracted quantitative imaging parameters from standard-of-care images, if correlated with genomic information, are able to highlight underlying physiologic, even subcellular processes (77). Imaging phenotypes of GBM obtained from routine clinical MRI studies can, therefore, be correlated with specific gene and microRNA expression signatures, serving as non-invasive surrogate markers of malignant genomic events and providing important information regarding diagnosis, prognosis, and optimal treatment (74, 78–81).
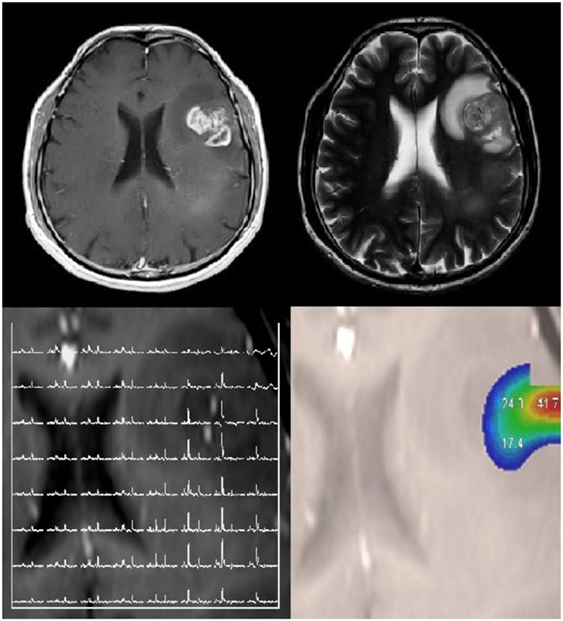
Figure 5. Radiogenomics involves correlating molecular alterations in tumors with conventional and advanced imaging findings. A patient with a left frontal glioblastoma, which was isocitrate dehydrogenase wild type, EGFR amplified, with phosphatase and tensin homolog loss, and a mutated TERT promoter. This lesion is shown on T1-weighted contrast-enhanced and T2-weighted images. Multivoxel MR spectroscopy and choline-to-N-acetylaspartate color maps are also shown. No copyright permissions were required for use of these images.
Understanding inter- and intra-tumoral heterogeneity in GBM is also important because both likely contribute to treatment failure (82, 83). Radiogenomics can potentially help tailor treatment strategy against intra-tumoral heterogeneity, which contributes to a tumor’s regional variations in metabolism, vasculature, oxygenation, and gene expression.
To date, several explorative studies in the field of radiogenomics have demonstrated the relationship between non-invasive imaging features such as contrast enhancement, invasiveness, location, volume, diffusion, and corresponding molecular characteristics.
In 2008, Diehn et al. first reported associations between GBM MR imaging, molecular phenotypes derived from DNA microarray analysis, and survival. Genes implicated in angiogenesis and tumor hypoxia, particularly vascular endothelial growth factor, were associated with the degree of contrast enhancement, and a high ratio of contrast enhancing tumor to necrosis correlated with epidermal growth factor receptor overexpression (84).
Promoter methylation of the DNA repair gene O6-methylguanine-DNA-methyltransferase (MGMT) is associated with improved survival following radiotherapy and chemotherapy in GBM patients. Levner and colleagues reported that texture analysis features extracted from conventional MRIs, including gray level patterns, pixel interrelationships, and spectral patterns, were predictive of MGMT methylation status. Using these features obtained from 59 patients, they were able to achieve an average accuracy of greater than 87% in predicting MGMT methylation status (85). A similar study from Drabycz et al. compared visual assessment to computer-derived texture analysis for prediction of MGMT methylation status and found that ring enhancement is significantly associated with an unmethylated MGMT promoter. The authors also reported that there were significant differences between methylated and unmethylated tumors in the T2-weighted images when analyzing tumor ROIs, however, not in entire tumor volumes. Spectral texture features extracted from T2-weighted images were more specific markers of methylation status than visual identification of ring-enhancement (65 versus 39%) but at a loss of sensitivity (79 versus 93% for spectral and visual textural features, respectively) (86). Additional discoveries have been made regarding genomic correlates of necrosis and tumor location. For example, Iliadis et al. reported that MGMT-methylated tumors had less preoperative tumor necrosis and improved progression-free survival (87). Ellingson et al. demonstrated an association between tumor location and the genetic profile of tumor precursor cells; for example, MGMT promoter methylated tumors were located more frequently in the left temporal lobe. The authors also observed that MGMT unmethylated GBMs were smaller in volume on T1-contrast enhanced and T2-FLAIR images than MGMT-methylated GBMs (88).
Transcriptomics is another area where imaging and genomic studies may overlap. Transcriptomics is the study of the complete set of RNAs (transcriptome) encoded by the genome of a specific cell at a specific time or under a specific set of conditions. Comparison of transcriptomes allows the identification of genes that are differentially expressed in distinct cell populations or in response to different treatments. Previous studies have identified four unique GBM transcriptomal subtypes named proneural, neural, classical and mesenchymal. Tumors with the proneural gene expression subtype, those with an isocitrate dehydrogenase-1 mutation, and tumors lacking the loss of the phosphatase and tensin homolog (PTEN) mutation have been reported to occur most frequently in the frontal lobe (88). In a study of mesenchymal GBM, Naeini et al. found that the ratio of volume of T2 hyperintensity to contrast enhancement and central necrosis was significantly lower in this subtype (89).
In another example of the value of transcriptomics, You et al. investigated leptomeningeal dissemination in GBMs, hoping to clarify underlying molecular profiles contributing to this disease phenotype. They performed integrative analysis of whole transcriptome sequencing (RNA-Seq) gene expression patterns in GBMs with leptomeningeal involvement on imaging. They found that SPOCK1, EHD2, SLC2A3, and ANXA11 were all more highly expressed with leptomeningeal dissemination compared to a control group without leptomeningeal spread. Among these genes, SPOCK1 activates PI3K/Akt signaling to block apoptosis and promote proliferation and metastasis (90).
In 2011, the NCI launched the Cancer Genome Atlas (TCGA) project to further efforts to incorporate molecular markers into the clinical care of GBM patients. One of the earliest large-scale studies using data from the TCGA was performed by Zinn et al., who correlated T2 FLAIR tumor volume with 13,628 genes and 55 microRNAs. The authors found that tumors with high T2 FLAIR volume were enriched with genes and microRNAs involved in cellular migration and invasion; specifically, the Periostin gene and miR-219 were believed to promote mesenchymal transition and invasion. In their cohort, patients with high levels of Periostin expression had decreased survival and more rapid disease progression (81). Another TCGA study found that lower-grade gliomas with an IDH mutation and 1p/19q codeletion had the most favorable clinical outcomes and were often localized to the frontal lobes. Nearly all lower-grade gliomas with IDH mutations and no 1p/19q codeletion had mutations in TP53 and ATRX. Furthermore, the lower grade gliomas without an IDH mutation had genomic aberrations and clinical behavior that were strikingly similar to those found in primary glioblastoma (11). Zinn et al. also used TCGA data from 35 patients, correlating ADC values with genomic profiles. Tumors were grouped based on high and low ADC in a ROI placed on a nonenhancing area of T2 FLAIR hyperintensity within 1 cm of tumor-enhancement borders. They found that the low ADC group had upregulation of BMI1 and Cyclin D1 and downregulations of YAP1 and E2F3 (91). BMI1 is a known regulator of stem-like states in cancer cells and is associated with migration, invasion, and poor prognosis (91, 92). Separately, Gutman et al. demonstrated that volumetric measures could predict GBM mutations such as TP53, NF1, EGFR, RB1, and platelet-derived growth factor receptor alpha (PDGFRA) (93).
Another group evaluated correlations between DSC MR Perfusion and SWI and key molecular characteristics in 152 patients with newly diagnosed GBM. Imaging features, including tumor volumes, volume ratios, apparent diffusion coefficients, cerebral blood flow, cerebral blood volume, and intratumoral susceptibility, were correlated with DNA methylation subgroups, MGMT promoter methylation status, and hallmark copy number variations (EGFR, PDGFRA, MDM4, and CDK4 amplification; PTEN, CDKN2A, NF1, and RB1 loss). After evaluating univariate associations they also implemented machine learning–based classification models. They found that there was no tumor location predilection for any of the assessed molecular parameters. Increased relative cerebral blood volume and cerebral blood flow within enhancing tumor were associated with EGFR amplification and CDKN2A loss. However, no single imaging parameter was able to predict key molecular features with high accuracy, limiting the clinical utility of these techniques at this time (94). Interestingly, Colen et al. reported sex-specific molecular profiles of cell death in GBM. They found that female patients showed significantly lower volumes of necrosis on MRI than male patients, but had significantly shorter survival. They suggested that cell death in female patients with GBM is associated with oncogenes such as MYC, while cell death in male patients is associated with TP53 activity (95).
The visually accessible Rembrandt images (VASARI) is a newer resource hoping to engender robust and reproducible MRI reads by validating data obtained from different sites. The VASARI scoring system includes 30 semantic descriptors of imaging features of brain tumors clustered by categories pertaining to lesion location, morphology of the lesion substance, morphology of the lesion margin, alterations in the vicinity of the lesion, and extent of tumor resection. This type of work is critical to standardize imaging descriptions of pathology, especially in the development of future natural image processing software. Using the VASARI scoring system, Colen et al. showed that GBM patients with specific invasive imaging signatures such as ependymal involvement, invasion of deep white matter tracts, and tumor extension across the midline had significantly decreased overall survival as well as increased MYC oncogene activation and inhibition of NFKBIA (96).
Conclusion
Metabolic imaging such as spectroscopy and PET remain valuable tools whose information can guide clinical decision making. However, each suffer from drawbacks as discussed above and future work aimed at improving their sensitivity and specificity will enable better patient care. In particular, metabolic imaging that can herald impending malignant degeneration of lower grade tumors would be of incalculable value. Similarly, radiogenomics has remarkable potential to accelerate precision medicine, but it is still early in its evolution. Optimum protocols for image acquisition and reconstruction must be identified and standardized, and robust segmentation algorithms that require minimal operator input need to be developed. Furthermore, informatics databases must be generated that incorporate imaging features with medical and genetic data (82, 97). Machine learning algorithms will help evaluate the enormous amount of data originating from the addition of advanced imaging techniques such as diffusion, DCE/DSC MR Perfusion, and MRS (especially 2-HG). Also necessary will be the precise correlation of tumor biopsy sites with corresponding imaging voxels (91). Finally, statistical methods and study designs for ongoing radiogenomic studies may need to be standardized to allow maximal progress (98). Further clinical investigation with larger sample sizes from multiple centers will help test and validate new techniques in this exciting field (74).
Author Contributions
CC and DS contributed to the MR spectroscopy portion of the manuscript. RR and RM contributed to the overall concept and writing of the manuscript.
Conflict of Interest Statement
The authors declare that the research was conducted in the absence of any commercial or financial relationships that could be construed as a potential conflict of interest.
References
1. Balmaceda C, Critchell D, Mao X, Cheung K, Pannullo S, DeLaPaz RL, et al. Multisection 1H magnetic resonance spectroscopic imaging assessment of glioma response to chemotherapy. J Neurooncol (2006) 76(2):185–91. doi:10.1007/s11060-005-5261-2
2. Vigneron D, Bollen A, McDermott M, Wald L, Day M, Moyher-Noworolski S, et al. Three-dimensional magnetic resonance spectroscopic imaging of histologically confirmed brain tumors. Magn Reson Imaging (2001) 19(1):89–101. doi:10.1016/S0730-725X(01)00225-9
3. Wang Q, Zhang H, Zhang J, Wu C, Zhu W, Li F, et al. The diagnostic performance of magnetic resonance spectroscopy in differentiating high-from low-grade gliomas: a systematic review and meta-analysis. Eur Radiol (2016) 26(8):2670–84. doi:10.1007/s00330-015-4046-z
4. Senft C, Hattingen E, Pilatus U, Franz K, Schänzer A, Lanfermann H, et al. Diagnostic value of proton magnetic resonance spectroscopy in the noninvasive grading of solid gliomas: comparison of maximum and mean choline values. Neurosurgery (2009) 65(5):908–913; discussion 913. doi:10.1227/01.NEU.0000356982.82378.BA
5. Elias AE, Carlos RC, Smith EA, Frechtling D, George B, Maly P, et al. MR spectroscopy using normalized and non-normalized metabolite ratios for differentiating recurrent brain tumor from radiation injury. Acad Radiol (2011) 18(9):1101–8. doi:10.1016/j.acra.2011.05.006
6. Smith EA, Carlos RC, Junck LR, Tsien CI, Elias A, Sundgren PC. Developing a clinical decision model: MR spectroscopy to differentiate between recurrent tumor and radiation change in patients with new contrast-enhancing lesions. AJR Am J Roentgenol (2009) 192(2):W45–52. doi:10.2214/AJR.07.3934
7. Weybright P, Sundgren PC, Maly P, Hassan DG, Nan B, Rohrer S, et al. Differentiation between brain tumor recurrence and radiation injury using MR spectroscopy. AJR Am J Roentgenol (2005) 185(6):1471–6. doi:10.2214/AJR.04.0933
8. Zeng QS, Li CF, Zhang K, Liu H, Kang XS, Zhen JH. Multivoxel 3D proton MR spectroscopy in the distinction of recurrent glioma from radiation injury. J Neurooncol (2007) 84(1):63–9. doi:10.1007/s11060-007-9341-3
9. Shah AH, Snelling B, Bregy A, Patel PR, Tememe D, Bhatia R, et al. Discriminating radiation necrosis from tumor progression in gliomas: a systematic review what is the best imaging modality? J Neurooncol (2013) 112(2):141–52. doi:10.1007/s11060-013-1059-9
10. Fink JR, Carr RB, Matsusue E, Iyer RS, Rockhill JK, Haynor DR, et al. Comparison of 3 Tesla proton MR spectroscopy, MR perfusion and MR diffusion for distinguishing glioma recurrence from posttreatment effects. J Magn Reson Imaging (2012) 35(1):56–63. doi:10.1002/jmri.22801
11. Cancer Genome Atlas Research Network, Brat DJ, Verhaak RG, Aldape KD, Yung WK, Salama SR, et al. Comprehensive, integrative genomic analysis of diffuse lower-grade gliomas. N Engl J Med (2015) 372(26):2481–98. doi:10.1056/NEJMoa1402121
12. Eckel-Passow JE, Lachance DH, Molinaro AM, Walsh KM, Decker PA, Sicotte H, et al. Glioma groups based on 1p/19q, IDH, and TERT promoter mutations in tumors. N Engl J Med (2015) 372(26):2499–508. doi:10.1056/NEJMoa1407279
13. Choi C, Ganji SK, DeBerardinis RJ, Hatanpaa KJ, Rakheja D, Kovacs Z, et al. 2-Hydroxyglutarate detection by magnetic resonance spectroscopy in IDH-mutated patients with gliomas. Nat Med (2012) 18(4):624–9. doi:10.1038/nm.2682
14. Choi C, Raisanen JM, Ganji SK, Zhang S, McNeil SS, An Z, et al. Prospective longitudinal analysis of 2-hydroxyglutarate magnetic resonance spectroscopy identifies broad clinical utility for the management of patients with IDH-mutant glioma. J Clin Oncol (2016) 34(33):4030–9. doi:10.1200/JCO.2016.67.1222
15. de la Fuente MI, Young RJ, Rubel J, Rosenblum M, Tisnado J, Briggs S, et al. Integration of 2-hydroxyglutarate-proton magnetic resonance spectroscopy into clinical practice for disease monitoring in isocitrate dehydrogenase-mutant glioma. Neuro Oncol (2016) 18(2):283–90. doi:10.1093/neuonc/nov307
16. Natsumeda M, Igarashi H, Nomura T, Ogura R, Tsukamoto Y, Kobayashi T, et al. Accumulation of 2-hydroxyglutarate in gliomas correlates with survival: a study by 3.0-Tesla magnetic resonance spectroscopy. Acta Neuropathol Commun (2014) 2:158. doi:10.1186/s40478-014-0158-y
17. Artzi M, Liberman G, Vaisman N, Bokstein F, Vitinshtein F, Aizenstein O, et al. Changes in cerebral metabolism during ketogenic diet in patients with primary brain tumors: 1H-MRS study. J Neurooncol (2017) 132(2):267–75. doi:10.1007/s11060-016-2364-x
18. Warburg O. On the origin of cancer cells. Science (1956) 123(3191):309–14. doi:10.1126/science.123.3191.309
19. Chaumeil MM, Ozawa T, Park I, Scott K, James CD, Nelson SJ, et al. Hyperpolarized 13C MR spectroscopic imaging can be used to monitor Everolimus treatment in vivo in an orthotopic rodent model of glioblastoma. Neuroimage (2012) 59(1):193–201. doi:10.1016/j.neuroimage.2011.07.034
20. Park I, Bok R, Ozawa T, Phillips JJ, James CD, Vigneron DB, et al. Detection of early response to temozolomide treatment in brain tumors using hyperpolarized 13C MR metabolic imaging. J Magn Res Imaging (2011) 33(6):1284–90. doi:10.1002/jmri.22563
21. Park I, Mukherjee J, Ito M, Chaumeil MM, Jalbert LE, Gaensler K, et al. Changes in pyruvate metabolism detected by magnetic resonance imaging are linked to DNA damage and serve as a sensor of temozolomide response in glioblastoma cells. Cancer Res (2014) 74(23):7115–24. doi:10.1158/0008-5472.CAN-14-0849
22. Venkatesh HS, Chaumeil MM, Ward CS, Haas-Kogan DA, James CD, Ronen SM. Reduced phosphocholine and hyperpolarized lactate provide magnetic resonance biomarkers of PI3K/Akt/mTOR inhibition in glioblastoma. Neuro Oncol (2012) 14(3):315–25. doi:10.1093/neuonc/nor209
23. Nelson SJ, Kurhanewicz J, Vigneron DB, Larson PE, Harzstark AL, Ferrone M, et al. Metabolic imaging of patients with prostate cancer using hyperpolarized [1-13C]pyruvate. Sci Transl Med (2013) 5(198):198ra108. doi:10.1126/scitranslmed.3006070
24. Borbely K, Nyary I, Toth M, Ericson K, Gulyas B. Optimization of semi-quantification in metabolic PET studies with 18F-fluorodeoxyglucose and 11C-methionine in the determination of malignancy of gliomas. J Neurol Sci (2006) 246(1–2):85–94. doi:10.1016/j.jns.2006.02.015
25. Delbeke D, Meyerowitz C, Lapidus RL, Maciunas RJ, Jennings MT, Moots PL, et al. Optimal cutoff levels of F-18 fluorodeoxyglucose uptake in the differentiation of low-grade from high-grade brain tumors with PET. Radiology (1995) 195(1):47–52. doi:10.1148/radiology.195.1.7892494
26. Meyer PT, Schreckenberger M, Spetzger U, Meyer GF, Sabri O, Setani KS, et al. Comparison of visual and ROI-based brain tumour grading using 18F-FDG PET: ROC analyses. Eur J Nucl Med (2001) 28(2):165–74. doi:10.1007/s002590000428
27. Schifter T, Hoffman JM, Hanson MW, Boyko OB, Beam C, Paine S, et al. Serial FDG-PET studies in the prediction of survival in patients with primary brain tumors. J Comput Assist Tomogr (1993) 17(4):509–61. doi:10.1097/00004728-199307000-00001
28. Chao ST, Suh JH, Raja S, Lee SY, Barnett G. The sensitivity and specificity of FDG PET in distinguishing recurrent brain tumor from radionecrosis in patients treated with stereotactic radiosurgery. Int J Cancer (2001) 96(3):191–7. doi:10.1002/ijc.1016
29. Gomez-Rio M, Rodriguez-Fernandez A, Ramos-Font C, Lopez-Ramirez E, Llamas-Elvira JM. Diagnostic accuracy of 201Thallium-SPECT and 18F-FDG-PET in the clinical assessment of glioma recurrence. Eur J Nucl Med Mol Imaging (2008) 35(5):966–75. doi:10.1007/s00259-007-0661-5
30. Janus TJ, Kim EE, Tilbury R, Bruner JM, Yung WK. Use of [18F]fluorodeoxyglucose positron emission tomography in patients with primary malignant brain tumors. Ann Neurol (1993) 33(5):540–8. doi:10.1002/ana.410330520
31. Ozsunar Y, Mullins ME, Kwong K, Hochberg FH, Ament C, Schaefer PW, et al. Glioma recurrence versus radiation necrosis? A pilot comparison of arterial spin-labeled, dynamic susceptibility contrast enhanced MRI, and FDG-PET imaging. Acad Radiol (2010) 17(3):282–90. doi:10.1016/j.acra.2009.10.024
32. Ricci PE, Karis JP, Heiserman JE, Fram EK, Bice AN, Drayer BP. Differentiating recurrent tumor from radiation necrosis: time for re-evaluation of positron emission tomography? AJNR Am J Neuroradiol (1998) 19(3):407–13.
33. Valk PE, Budinger TF, Levin VA, Silver P, Gutin PH, Doyle WK. PET of malignant cerebral tumors after interstitial brachytherapy. Demonstration of metabolic activity and correlation with clinical outcome. J Neurosurg (1988) 69(6):830–8. doi:10.3171/jns.1988.69.6.0830
34. Nihashi T, Dahabreh IJ, Terasawa T. Diagnostic accuracy of PET for recurrent glioma diagnosis: a meta-analysis. AJNR Am J Neuroradiol (2013) 34(5):S941–911. doi:10.3174/ajnr.A3324
35. Colavolpe C, Chinot O, Metellus P, Mancini J, Barrie M, Bequet-Boucard C, et al. FDG-PET predicts survival in recurrent high-grade gliomas treated with bevacizumab and irinotecan. Neuro Oncol (2012) 14(5):649–57. doi:10.1093/neuonc/nos012
36. Di Chiro G, Oldfield E, Wright DC, De Michele D, Katz DA, Patronas NJ, et al. Cerebral necrosis after radiotherapy and/or intraarterial chemotherapy for brain tumors: PET and neuropathologic studies. AJR Am J Roentgenol (1988) 150(1):189–97. doi:10.2214/ajr.150.1.189
37. Kim EE, Chung SK, Haynie TP, Kim CG, Cho BJ, Podoloff DA, et al. Differentiation of residual or recurrent tumors from post-treatment changes with F-18 FDG PET. Radiographics (1992) 12(2):269–79. doi:10.1148/radiographics.12.2.1561416
38. Kim YH, Oh SW, Lim YJ, Park CK, Lee SH, Kang KW, et al. Differentiating radiation necrosis from tumor recurrence in high-grade gliomas: assessing the efficacy of 18F-FDG PET, 11C-methionine PET and perfusion MRI. Clin Neurol Neurosurg (2010) 112(9):758–65. doi:10.1016/j.clineuro.2010.06.005
39. Li DL, Xu YK, Wang QS, Wu HB, Li HS. 11C-methionine and 18F-fluorodeoxyglucose positron emission tomography/CT in the evaluation of patients with suspected primary and residual/recurrent gliomas. Chin Med J (Engl) (2012) 125(1):91–6.
40. Van Laere K, Ceyssens S, Van Calenbergh F, de Groot T, Menten J, Flamen P, et al. Direct comparison of 18F-FDG and 11C-methionine PET in suspected recurrence of glioma: sensitivity, inter-observer variability and prognostic value. Eur J Nucl Med Mol Imaging (2005) 32(1):39–51. doi:10.1007/s00259-004-1564-3
41. Xiangsong Z, Weian C. Differentiation of recurrent astrocytoma from radiation necrosis: a pilot study with 13N-NH3 PET. J Neurooncol (2007) 82(3):305–11. doi:10.1007/s11060-006-9286-y
42. Padma MV, Said S, Jacobs M, Hwang DR, Dunigan K, Satter M, et al. Prediction of pathology and survival by FDG PET in gliomas. J Neurooncol (2003) 64(3):227–37. doi:10.1023/A:1025665820001
43. Holzer T, Herholz K, Jeske J, Heiss WD. FDG-PET as a prognostic indicator in radiochemotherapy of glioblastoma. J Comput Assist Tomogr (1993) 17(5):681–7. doi:10.1097/00004728-199309000-00002
44. Santra A, Kumar R, Sharma P, Bal C, Julka PK, Malhotra A. F-18 FDG PET-CT for predicting survival in patients with recurrent glioma: a prospective study. Neuroradiology (2011) 53(12):1017–24. doi:10.1007/s00234-011-0898-3
45. Chiang GC, Galla N, Ferraro R, Kovanlikaya I. The added prognostic value of metabolic tumor size on FDG-PET at first suspected recurrence of glioblastoma multiforme. J Neuroimaging (2017) 27(2):243–7. doi:10.1111/jon.12386
46. Pirotte B, Goldman S, Massager N, David P, Wikler D, Vandesteene A, et al. Comparison of 18F-FDG and 11C-methionine for PET-guided stereotactic brain biopsy of gliomas. J Nucl Med (2004) 45(8):1293–8.
47. Sadeghi N, Salmon I, Tang BN, Denolin V, Levivier M, Wikler D, et al. Correlation between dynamic susceptibility contrast perfusion MRI and methionine metabolism in brain gliomas: preliminary results. J Magn Reson Imaging (2006) 24(5):989–94. doi:10.1002/jmri.20757
48. Sato N, Suzuki M, Kuwata N, Kuroda K, Wada T, Beppu T, et al. Evaluation of the malignancy of glioma using 11C-methionine positron emission tomography and proliferating cell nuclear antigen staining. Neurosurg Rev (1999) 22(4):210–4. doi:10.1007/s101430050018
49. Takano K, Kinoshita M, Arita H, Okita Y, Chiba Y, Kagawa N, et al. Diagnostic and prognostic value of 11C-methionine PET for nonenhancing gliomas. AJNR Am J Neuroradiol (2016) 37(1):44–50. doi:10.3174/ajnr.A4460
50. Terakawa Y, Tsuyuguchi N, Iwai Y, Yamanaka K, Higashiyama S, Takami T, et al. Diagnostic accuracy of 11C-methionine PET for differentiation of recurrent brain tumors from radiation necrosis after radiotherapy. J Nucl Med (2008) 49(5):694–9. doi:10.2967/jnumed.107.048082
51. Tsuyuguchi N, Takami T, Sunada I, Iwai Y, Yamanaka K, Tanaka K, et al. Methionine positron emission tomography for differentiation of recurrent brain tumor and radiation necrosis after stereotactic radiosurgery – in malignant glioma. Ann Nucl Med (2004) 18(4):291–6. doi:10.1007/BF02984466
52. Yamane T, Sakamoto S, Senda M. Clinical impact of (11)C-methionine PET on expected management of patients with brain neoplasm. Eur J Nucl MedMol Imaging (2010) 37(4):685–90. doi:10.1007/s00259-009-1302-y
53. Deng SM, Zhang B, Wu YW, Zhang W, Chen YY. Detection of glioma recurrence by (1)(1)C-methionine positron emission tomography and dynamic susceptibility contrast-enhanced magnetic resonance imaging: a meta-analysis. Nucl Med Commun (2013) 34(8):758–66. doi:10.1097/MNM.0b013e328361f598
54. Floeth FW, Pauleit D, Wittsack HJ, Langen KJ, Reifenberger G, Hamacher K, et al. Multimodal metabolic imaging of cerebral gliomas: positron emission tomography with [18F]fluoroethyl-L-tyrosine and magnetic resonance spectroscopy. J Neurosurg (2005) 102(2):318–27. doi:10.3171/jns.2005.102.2.0318
55. Dunet V, Maeder P, Nicod-Lalonde M, Lhermitte B, Pollo C, Bloch J, et al. Combination of MRI and dynamic FET PET for initial glioma grading. Nuklearmedizin (2014) 53(4):155–61. doi:10.3413/Nukmed-0650-14-03
56. Popperl G, Gotz C, Rachinger W, Gildehaus FJ, Tonn JC, Tatsch K. Value of O-(2-[18F]fluoroethyl)- L-tyrosine PET for the diagnosis of recurrent glioma. Eur J Nucl Med Mol Imaging (2004) 31(11):1464–70. doi:10.1007/s00259-004-1590-1
57. Rachinger W, Goetz C, Popperl G, Glidehaus FJ, Kreth FW, Holtmannspotter M, et al. Positron emission tomography with O-(2-[18F]fluoroethyl)-l-tyrosine versus magnetic resonance imaging in the diagnosis of recurrent gliomas. Neurosurgery (2005) 57(3):505–11; discussion 505–11. doi:10.1227/01.NEU.0000171642.49553.B0
58. Kebir S, Fimmers R, Galldiks N, Schäfer N, Mack F, Schaub C, et al. Late pseudoprogression in glioblastoma: diagnostic value of dynamic O-(2-[18F]fluoroethyl)-L-tyrosine PET. Clin Cancer Res (2016) 22(9):2190–6. doi:10.1158/1078-0432.CCR-15-1334
59. Kebir S, Khurshid Z, Gaertner FC, Essler M, Hattingen E, Fimmers R, et al. Unsupervised consensus cluster analysis of [18F]-fluoroethyl-L-tyrosine positron emission tomography identified textural features for the diagnosis of pseudoprogression in high-grade glioma. Oncotarget (2017) 8(5):8294–304. doi:10.18632/oncotarget.14166
60. Chen W, Silverman DH, Delaloye S, Czernin J, Kamdar N, Pope W, et al. 18F-FDOPA PET imaging of brain tumors: comparison study with 18F-FDG PET and evaluation of diagnostic accuracy. J Nucl Med (2006) 47(6):904–11.
61. Ledezma CJ, Chen W, Sai V, Freitas B, Cloughesy T, Czernin J, et al. 18F-FDOPA PET/MRI fusion in patients with primary/recurrent gliomas: initial experience. Eur J Radiol (2009) 71(2):242–8. doi:10.1016/j.ejrad.2008.04.018
62. Bogsrud T, Loendalen A, Brandal P, Saxhaug C, Bach-Gansmo T. 18F-fluciclovine (FACBC) PET/CT in residual or recurrent gliomas. J Nucl Med (2016) 57(2):1512.
63. Bosnyak E, Kamson DO, Robinette NL, Barger GR, Mittal S, Juhasz C. Tryptophan PET predicts spatial and temporal patterns of post-treatment glioblastoma progression detected by contrast-enhanced MRI. J Neurooncol (2016) 126(2):317–25. doi:10.1007/s11060-015-1970-3
64. Harat M, Malkowski B, Makarewicz R. Pre-irradiation tumour volumes defined by MRI and dual time-point FET-PET for the prediction of glioblastoma multiforme recurrence: a prospective study. Radiother Oncol (2016) 120(2):241–7. doi:10.1016/j.radonc.2016.06.004
65. Lundemann M, Costa JC, Law I, Engelholm SA, Muhic A, Poulsen HS, et al. Patterns of failure for patients with glioblastoma following O-(2-[18F]fluoroethyl)-L-tyrosine PET- and MRI-guided radiotherapy. Radiother Oncol (2017) 122(3):380–6. doi:10.1016/j.radonc.2017.01.002
66. Oehlke O, Mix M, Graf E, Schimek-Jasch T, Nestle U, Götz I, et al. Amino-acid PET versus MRI guided re-irradiation in patients with recurrent glioblastoma multiforme (GLIAA) – protocol of a randomized phase II trial (NOA 10/ARO 2013-1). BMC Cancer (2016) 16(1):769. doi:10.1186/s12885-016-2806-z
67. Chen W, Cloughesy T, Kamdar N, Satyamurthy N, Bergsneider M, Liau L, et al. Imaging proliferation in brain tumors with 18F-FLT PET: comparison with 18F-FDG. J Nucl Med (2005) 46(6):945–52.
68. Collet S, Valable S, Constans JM, Lechapt-Zalcman E, Roussel S, Delcroix N, et al. [(18)F]-fluoro-L-thymidine PET and advanced MRI for preoperative grading of gliomas. Neuroimage Clin (2015) 8:448–54. doi:10.1016/j.nicl.2015.05.012
69. Gerstner ER, Zhang Z, Fink JR, Muzi M, Hanna L, Greco E, et al. ACRIN 6684: assessment of tumor hypoxia in newly diagnosed glioblastoma using 18F-FMISO PET and MRI. Clin Cancer Res (2016) 22(20):5079–86. doi:10.1158/1078-0432.CCR-15-2529
70. Schwenck J, Tabatabai G, Skardelly M, Reischl G, Beschorner R, Pichler B, et al. In vivo visualization of prostate-specific membrane antigen in glioblastoma. Eur J Nucl Med Mol Imaging (2015) 42(1):170–1. doi:10.1007/s00259-014-2921-5
71. Iagaru A, Mosci C, Mittra E, Zaharchuk G, Fischbein N, Harsh G, et al. Glioblastoma multiforme recurrence: an exploratory study of (18)F FPPRGD2 PET/CT. Radiology (2015) 277(2):497–506. doi:10.1148/radiol.2015141550
72. de Lucas AG, Schuhmacher AJ, Oteo M, Romero E, Cámara JA, de Martino A, et al. Targeting MT1-MMP as an immunopet-based strategy for imaging gliomas. PLoS One (2016) 11(7):e0158634. doi:10.1371/journal.pone.0158634
73. Hatzoglou V, Yang TJ, Omuro A, Gavrilovic I, Ulaner G, Rubel J, et al. A prospective trial of dynamic contrast-enhanced MRI perfusion and fluorine-18 FDG PET-CT in differentiating brain tumor progression from radiation injury after cranial irradiation. Neuro Oncol (2016) 18(6):873–80. doi:10.1093/neuonc/nov301
74. Kuo MD, Jamshidi N. Behind the numbers: decoding molecular phenotypes with radiogenomics – guiding principles and technical considerations. Radiology (2014) 270(2):320–5. doi:10.1148/radiol.13132195
75. Zhang CM, Brat DJ. Genomic profiling of lower-grade gliomas uncovers cohesive disease groups: implications for diagnosis and treatment. Chin J Cancer (2016) 35:12. doi:10.1186/s40880-015-0071-1
76. van den Bent MJ. Interobserver variation of the histopathological diagnosis in clinical trials on glioma: a clinician’s perspective. Acta Neuropathol (2010) 120(3):297–304. doi:10.1007/s00401-010-0725-7
77. Kotrotsou A, Zinn PO, Colen RR. Radiomics in brain tumors: an emerging technique for characterization of tumor environment. Magn Reson Imaging Clin N Am (2016) 24(4):719–29. doi:10.1016/j.mric.2016.06.006
78. Pope WB. Genomics of brain tumor imaging. Neuroimaging Clin N Am (2015) 25(1):105–19. doi:10.1016/j.nic.2014.09.006
79. Ellingson BM. Radiogenomics and imaging phenotypes in glioblastoma: novel observations and correlation with molecular characteristics. Curr Neurol Neurosci Rep (2015) 15(1):506. doi:10.1007/s11910-014-0506-0
80. Gevaert O, Mitchell LA, Achrol AS, Xu J, Echegaray S, Steinberg GK, et al. Glioblastoma multiforme: exploratory radiogenomic analysis by using quantitative image features. Radiology (2014) 273(1):168–74. doi:10.1148/radiol.14131731
81. Zinn PO, Mahajan B, Sathyan P, Singh SK, Majumder S, Jolesz FA, et al. Radiogenomic mapping of edema/cellular invasion MRI-phenotypes in glioblastoma multiforme. PloS one (2011) 6(10):e25451. doi:10.1371/journal.pone.0025451
82. Sala E, Mema E, Himoto Y, Veeraraghavan H, Brenton JD, Snyder A, et al. Unravelling tumour heterogeneity using next-generation imaging: radiomics, radiogenomics, and habitat imaging. Clin Radiol (2017) 72(1):3–10. doi:10.1016/j.crad.2016.09.013
83. Sottoriva A, Spiteri I, Piccirillo SG, Touloumis A, Collins VP, Marioni JC, et al. Intratumor heterogeneity in human glioblastoma reflects cancer evolutionary dynamics. Proc Natl Acad Sci U S A (2013) 110(10):4009–14. doi:10.1073/pnas.1219747110
84. Diehn M, Nardini C, Wang DS, McGovern S, Jayaraman M, Liang Y, et al. Identification of noninvasive imaging surrogates for brain tumor gene-expression modules. Proc Natl Acad Sci U S A (2008) 105(13):5213–8. doi:10.1073/pnas.0801279105
85. Levner I, Drabycz S, Roldan G, De Robles P, Cairncross JG, Mitchell R. Predicting MGMT methylation status of glioblastomas from MRI texture. Med Image Comput Comput Assist Interv (2009) 12(Pt 2):522–30.
86. Drabycz S, Roldán G, de Robles P, Adler D, McIntyre JB, Magliocco AM, et al. An analysis of image texture, tumor location, and MGMT promoter methylation in glioblastoma using magnetic resonance imaging. Neuroimage (2010) 49(2):1398–405. doi:10.1016/j.neuroimage.2009.09.049
87. Iliadis G, Kotoula V, Chatzisotiriou A, Televantou D, Eleftheraki AG, Lambaki S, et al. Volumetric and MGMT parameters in glioblastoma patients: survival analysis. BMC Cancer (2012) 12:3. doi:10.1186/1471-2407-12-3
88. Ellingson BM, Lai A, Harris RJ, Selfridge JM, Yong WH, Das K, et al. Probabilistic radiographic atlas of glioblastoma phenotypes. AJNR Am J Neuroradiol (2013) 34(3):533–40. doi:10.3174/ajnr.A3253
89. Naeini KM, Pope WB, Cloughesy TF, Harris RJ, Lai A, Eskin A, et al. Identifying the mesenchymal molecular subtype of glioblastoma using quantitative volumetric analysis of anatomic magnetic resonance images. Neuro Oncol (2013) 15(5):626–34. doi:10.1093/neuonc/not008
90. You HJ, Park HY, Kim J, Lee IH, Seol HJ, Lee JI, et al. Integrative radiogenomic analysis for genomic signatures in glioblastomas presenting leptomeningeal dissemination. Medicine (Baltimore) (2016) 95(27):e4109. doi:10.1097/MD.0000000000004109
91. Zinn PO, Hatami M, Youssef E, Thomas GA, Luedi MM, Singh SK, et al. Diffusion weighted magnetic resonance imaging radiophenotypes and associated molecular pathways in glioblastoma. Neurosurgery (2016) 63(Suppl 1):127–35. doi:10.1227/NEU.0000000000001302
92. He Q, Liu Z, Zhao T, Zhao L, Zhou X, Wang A. Bmi1 drives stem-like properties and is associated with migration, invasion, and poor prognosis in tongue squamous cell carcinoma. Int J Biol Sci (2015) 11(1):1–10. doi:10.7150/ijbs.10405
93. Gutman DA, Dunn WD Jr, Grossmann P, Cooper LA, Holder CA, Ligon KL, et al. Somatic mutations associated with MRI-derived volumetric features in glioblastoma. Neuroradiology (2015) 57(12):1227–37. doi:10.1007/s00234-015-1576-7
94. Kickingereder P, Bonekamp D, Nowosielski M, Kratz A, Sill M, Burth S, et al. Radiogenomics of glioblastoma: machine learning-based classification of molecular characteristics by using multiparametric and multiregional MR imaging features. Radiology (2016) 281(3):907–18. doi:10.1148/radiol.2016161382
95. Colen RR, Wang J, Singh SK, Gutman DA, Zinn PO. Glioblastoma: imaging genomic mapping reveals sex-specific oncogenic associations of cell death. Radiology (2015) 275(1):215–27. doi:10.1148/radiol.14141800
96. Colen RR, Vangel M, Wang J, Gutman DA, Hwang SN, Wintermark M, et al. Imaging genomic mapping of an invasive MRI phenotype predicts patient outcome and metabolic dysfunction: a TCGA glioma phenotype research group project. BMC Med Genomics (2014) 7:30. doi:10.1186/1755-8794-7-30
97. Kumar V, Gu Y, Basu S, Berglund A, Eschrich SA, Schabath MB, et al. Radiomics: the process and the challenges. Magn Res Imaging (2012) 30(9):1234–48. doi:10.1016/j.mri.2012.06.010
Keywords: radiogenomics, glioma, magnetic resonance spectroscopy, positron-emission tomography, neurooncology, neuroradiology
Citation: Chiang GC, Kovanlikaya I, Choi C, Ramakrishna R, Magge R and Shungu DC (2018) Magnetic Resonance Spectroscopy, Positron Emission Tomography and Radiogenomics—Relevance to Glioma. Front. Neurol. 9:33. doi: 10.3389/fneur.2018.00033
Received: 12 September 2017; Accepted: 15 January 2018;
Published: 05 February 2018
Edited by:
Marcos Vinicius Calfat Maldaun, Hospital Sírio-Libanês, BrazilReviewed by:
Seunggu Jude Han, Oregon Health & Science University, United StatesLinda Xu, Stanford University Hospitals and Clinics, United States
Copyright: © 2018 Chiang, Kovanlikaya, Choi, Ramakrishna, Magge and Shungu. This is an open-access article distributed under the terms of the Creative Commons Attribution License (CC BY). The use, distribution or reproduction in other forums is permitted, provided the original author(s) and the copyright owner are credited and that the original publication in this journal is cited, in accordance with accepted academic practice. No use, distribution or reproduction is permitted which does not comply with these terms.
*Correspondence: Rohan Ramakrishna, ror9068@med.cornell.edu
†These authors have contributed equally to this work.