Location, location, location: alterations in the functional topography of face- but not object- or place-related cortex in adolescents with autism
1
Cognitive Neuroscience Laboratory, Department of Psychology, Center for the Neural Basis of Cognition, Carnegie Mellon University, Pittsburgh, PA, USA
2
Laboratory of Neurocognitive Development, Department of Psychiatry, Western Psychiatric Institute and Clinic, University of Pittsburgh School of Medicine, Pittsburgh, PA, USA
3
Department of Neurology, Western Psychiatric Institute and Clinic, University of Pittsburgh School of Medicine, Pittsburgh, PA, USA
In autism, impairments in face processing are a relatively recent discovery, but have quickly become a widely accepted aspect of the behavioral profile. Only a handful of studies have investigated potential atypicalities in autism in the development of the neural substrates mediating face processing. High-functioning individuals with autism (HFA) and matched typically developing (TD) controls watched dynamic movie vignettes of faces, common objects, buildings, and scenes of navigation while undergoing an fMRI scan. With these data, we mapped the functional topography of category-selective activation for faces bilaterally in the fusiform gyrus, occipital face area, and posterior superior temporal sulcus. Additionally, we mapped category-selective activation for objects in the lateral occipital area and for places in the parahippocampal place area in the two groups. Our findings do not indicate a generalized disruption in the development of the entire ventral visual pathway in autism. Instead, our results suggest that the functional topography of face-related cortex is selectively disrupted in autism and that this alteration is present in early adolescence. Furthermore, for those HFA adolescents who do exhibit face-selective activation, this activation tends to be located in traditionally object-related regions, which supports the hypothesis that perceptual processing of faces in autism may be more akin to the perceptual processing of common objects in TD individuals.
The recognition of faces may be among the most taxing perceptual challenges confronted by observers in their day-to-day life. Not only must the observer derive precise information about gaze direction, gender and affect of a face, but must also individuate the face perceptually from all other faces so that identity can be accurately assigned. Moreover, all of these computations must be done accurately and rapidly, notwithstanding the ambiguity of the input arising from the commonality of input features (i.e., all faces have two eyes, a nose and a mouth in the same spatial arrangement). The complexity of face processing is reflected by the finding that typically developing (TD) children do not exhibit mature recognition skills for facial identity (Carey and Diamond, 1977
; Mondloch et al., 2004
) or facial expressions (Herba and Phillips, 2004
) until early adolescence. This delayed developmental trajectory may be related to similarly late occurring changes in the emergence of the neural substrate that mediates face processing (Golarai et al., 2007
; Scherf et al., 2007
). An unfortunate consequence of this prolonged developmental trajectory for the behavioral and neural substrates supporting face processing may be the increased vulnerability to delay or disruption, particularly in individuals with neurodevelopmental disorders.
In one such disorder, autism, impairments in face processing are a relatively recent discovery, but have quickly become a widely accepted aspect of the behavioral profile (for summary see Behrmann et al., 2006b
; but see also Jemel et al., 2006
). These impairments in autism appear to impact many aspects of face processing, including difficulty remembering faces (Boucher and Lewis, 1992
; Scherf et al., 2008a
), processing facial expressions (Ashwin et al., 2007
; Humphreys et al., 2007
), and knowing which components of faces convey especially important communicative information (Joseph and Tanaka, 2003
). Although the overwhelming majority of the behavioral studies reporting atypical face processing in autism have been conducted with young children and adolescents, the majority of studies investigating abnormalities in the neural substrate of face processing have been conducted with adults. Many studies of adults with autism (Critchley et al., 2000
; Schultz et al., 2000
; Pierce et al., 2001
; Hall et al., 2003
; Hubl et al., 2003
; Ogai et al., 2003
; Piggot et al., 2004
; Wang et al., 2004
; Dalton et al., 2005
; Deeley et al., 2007
; Humphreys et al., 2008
), although not all (Hadjikhani et al., 2004
, 2007
; Pierce et al., 2004
; Bird et al., 2006
; Kleinhans et al., 2008
), have found hypoactivation in core face-related regions within the ventral visual pathway, including the ‘occipital face area’ (OFA), fusiform face area (FFA), and the posterior superior temporal sulcus (STS).
Only a handful of studies have investigated potential atypicalities in the development of the neural substrates of face processing in children with autism. Consistent with the adult studies, some of these developmental studies report face-related hypoactivation, particularly in the fusiform gyrus (FG), during a variety of face-processing tasks (Wang et al., 2004
; Dalton et al., 2005
; Grelotti et al., 2005
). Most recently, using a 1-back task while scanning with fMRI, Pierce and Redcay (2008)
reported a significant reduction in the number of face-selective voxels in the right and left FG and in the magnitude of face selectivity in the active voxels in the left FG in children with autism (mean age of 9.9 years), relative to TD controls, specifically when the children were observing an unfamiliar adult face. Similarly, Corbett and colleagues reported no suprathreshold face-related activation in the amygdala or FG during an emotion-matching task in young adolescents with autism, along with hypoactivation in the FG during a face identity-matching task in the same participants (Corbett et al., 2009
). In contrast, using a 1-back task and scanning with magnetocencephalography, Kylliäinen et al. (2006)
found that children with autism exhibited striking similarities, with only subtle differences from TD controls in overall signal latencies, amplitudes, topographies, and stimulus sensitivity when observing unfamiliar faces.
The goal of the current study was to investigate three lingering unanswered questions from this existing work, with a focus on adolescence as the critical developmental period of evaluation. Given the inconsistencies in the literature, our first goal was to determine whether there is atypical activation in face-related cortex in adolescents with autism. To achieve this goal, we tested a fairly homogenous population of high-functioning adolescents with autism (HFA) during naturalistic viewing conditions. Participants watched dynamic, real time movie vignettes of faces, common objects, buildings, and scenes of navigation while undergoing an fMRI scan. This task elicits more natural exploration of the visual environment than the static photographs used in previous developmental neuroimaging studies, which translates to greater category-selective activation in the ventral temporal lobe than more traditional tasks with static images (Avidan et al., 2005
).
Importantly, we targeted early adolescence (ages 11–14) as a critical time for evaluating the emergence of face-related activation in individuals with autism. We focused on this age range in light of recent findings indicating that in TD individuals, adolescence is an important period of neural plasticity when substantial reorganization occurs in the cortical and limbic networks (i.e., Nelson et al., 2005
), especially in terms of the fine-tuning and functional organization of face-related regions in the ventral temporal lobe (Scherf et al., 2007
). Also, adolescence is the time when nearly one-third to one-half of individuals with autism experience a deterioration of functioning (Bradley et al., 2004
). For example, perceptual development appears to be specifically vulnerable during early adolescence in autism (see Scherf et al., 2008a
,b
). Investigating the developmental profile of face-related cortex in autism during this important period will shed light on (1) perceptual and brain development particularly when symptoms often worsen, and (2) the design of targeted interventions to induce plasticity in the behavioral and neural substrates supporting face processing.
Our second goal was to evaluate whether the functional topography of the ventral visual pathway is altered for other visual classes in autism. The majority of existing studies, in both children and adults with autism, have focused on atypical activation in face-related cortex, and in the FG in particular. This has been an obvious first step, especially in light of the behavioral findings of face-processing impairments; however, there are hints in both the behavioral and neuroimaging work that objects may also be processed atypically, and perhaps precociously, in autism. For example, several studies have reported equivalent or even superior performance on building and common object recognition (Boucher and Lewis, 1992
; Hauck et al., 1998
; Trepagnier et al., 2002
; Teunisse and de Gelder, 2003
; Scherf et al., 2008a
), and faster early latency (100 ms) neural responses to common objects in right extrastriate cortex (Kylliäinen et al., 2006
) in children and adolescents with autism. However, one developmental neuroimaging study found smaller volumes of object-related activation in the right FG in children with autism (Pierce and Redcay, 2008
). At least two studies with adults have reported normal activation for objects in the lateral FG and lateral occipital area (Schultz et al., 2000
; Humphreys et al., 2008
) and for places in the parahippocampal place area (PPA) (Bird et al., 2006
; Humphreys et al., 2008
). However, there are no studies that systematically map out the functional organization in the ventral visual pathway for all three visual categories (faces, places, and objects) in children or adolescents with autism. This is particularly important to do given the findings of striking differences in early brain growth in key areas engaged in visual cognition and object processing, including frontal and temporal lobes and the amygdala (Carper and Courchesne, 2005
; Hazlett et al., 2005
). The effects of this early abnormal brain growth are also evident in adolescence (Hazlett et al., 2006
), particularly in the temporal lobes (Hardan et al., 2009
).
To address this issue, we mapped the functional topography of category-selective activation for faces bilaterally in the FG, but also in the OFA, and posterior STS, for objects in the lateral occipital area (LO), and for places in the PPA in the HFA and TD groups. We predicted that if face-related cortex is selectively disrupted in autism, we would observe specific atypicalities, and possibly hypoactivation in face-selective activation in the FG, OFA, and STS, without any group differences in object-related activation in the LO or place-related activation in the PPA. On the other hand, if the development of the topography of the entire ventral visual pathway is disrupted in autism, we expected to find group differences in the location, magnitude of category selectivity, and/or number of active voxels in all five (FG, OFA, STS, LO, PPA) regions. Either pattern has substantial implications for our understanding of the underlying mechanisms contributing to face-processing deficits in autism as well as for our attempts to ameliorate such deficits.
The third goal of the current work was to investigate a potential mechanism underlying any observed atypicalities in category-selective activation in the ventral visual pathway in autism. Although there is an emerging consensus that children and adults with autism exhibit hypoactivation in face-related cortex, there are few investigations of the mechanisms contributing to such hypoactivation. Some evidence suggests that atypical visual attention, gaze patterns, and/or motivation to attend to faces may be related to patterns of hypoactivation in the FG for faces (for review see Klin, 2008
). For example, although several groups have reported that individuals with autism spend less time looking at the eye region of faces (Klin et al., 2002
; Spezio et al., 2007
; Adolphs et al., 2008
), which may reflect atypical visual attention and perhaps motivation to attend to faces (Dawson et al., 2002
; Grelotti et al., 2002
), only one study suggests that this atypical fixation pattern in children with autism may be directly related to hypoactivation in the FG (Dalton et al., 2005
). Related, two studies in adults with autism reported normal face-related activation in the FG when participants were continuously cued to the eye region of a face with a central fixation cross (Hadjikhani et al., 2004
, 2007
; however, see Dapretto et al., 2006
; Humphreys et al., 2008
for contrary results). Another set of studies suggests that the potentially atypical visual attention and motivation to look at faces can be modulated by presenting images of personally familiar faces to adults and children with autism, which results in more normal patterns of face-related activation (hPierce et al., 2004
; Pierce and Redcay, 2008
; owever seeDalton et al., 2005
Study II for contrary results). Critically, it should be noted that the relation between purported atypicalities in the locus of fixations during face processing and cortical activation patterns in children with autism is quite controversial (see Boraston and Blakemore, 2007
).
We investigated an alternative mechanism for potential hypoactivation in category-selective activation in adolescents with autism. Based on findings of extensive individual variability in behavioral performance (e.g., Scherf et al., 2008a
,b
) and in the timecourse of activation in both the FG and LO in adults with autism (Humphreys et al., 2008
), we evaluated the role of within-group individual variability in the size, location, magnitude of category selectivity, and proportion of participants who exhibit identifiable category-selective activation in all five regions of interest (ROIs) bilaterally. This included evaluating individual variability within the ROIs identified in a voxelwise whole brain analysis for each group (HFA, TD) and within individually defined ROIs for each participant. We also investigated whether individual variability in the severity of behavioral symptoms in the HFA group was related to individual variability in any of the neural measures.
Participants
The participants included 10 high-functioning right-handed male adolescents with autism (mean age 12.2 years: range 10–14 years). The group mean IQ was in the average range (VIQ = 108, PIQ = 97, FSIQ = 102). Each participant with autism was yoked to a TD right-handed control participant based on age, sex, and Full Scale IQ. Table S1 in Supplementary Material illustrates the demographic and IQ information for each of the 10 autism and control participants. There were no differences between the groups in age, Verbal, Performance, or Full Scale IQ (all p > 0.13). Written informed consent was obtained from participants’ legal guardians, as well as written assent from the participants themselves, using procedures approved by the Internal Review Boards of the University of Pittsburgh and Carnegie Mellon University.
The diagnosis of autism was established using the Autism Diagnostic Interview-Revised (ADI-R) (Lord et al., 1994
), the Autism Diagnostic Observation Schedule-G (ADOS) (Lord et al., 2001
), and expert clinical diagnosis (Minshew, 1996
). The individuals with HFA, recruited from autism conferences and parent support groups, were medically healthy and had no identifiable genetic, metabolic, or infectious etiology for their disorder. Participants were also free of birth or traumatic brain injury, seizures, attention deficit disorder, and depression. Their personal and family health histories were evaluated in the initial screening interview and in the medical review portion of the ADI. IQ was determined for all participants using the Wechsler Abbreviated Scale of Intelligence.
Typically developing adolescents were recruited via advertisements given to them at school to take home to their parents. TD participants were included if they were in good physical health, free of regular medication usage, had good peer relationships as determined by parent or self-report and staff observations during the screening procedures, and did not exhibit behavioral symptoms that could be indicative of autism or any psychiatric diagnosis (as determined via a behavioral checklist completed by a parent).
Procedure
To maximize natural viewing conditions, participants freely viewed a silent, fluid concatenation of short movie vignettes, containing scenes of faces in various situations (e.g., walking through a crowd, in conversation), panoramic and close-up views of buildings, navigation through open fields, and miscellaneous common objects (e.g., kitchen utensils, musical instruments, desk items) in a blocked fMRI paradigm. The vignettes were organized into 32 randomized 15-s blocks containing stimuli from a single category (eight blocks per stimulus category). The task began with a 29-second blank screen followed by a 9-s block of abstract pattern stimuli and ended with a 21-s blank screen (see Figure S1 in Supplementary Material). This task has been used successfully to map category-selective activation in the ventral visual cortex in typical adults (Hasson et al., 2004
) and in adults with autism (Humphreys et al., 2008
) as well as in TD children and adolescents (Scherf et al., 2007
). It has three clear benefits for a developmental study comparing typical and clinical populations. First, it elicits more natural exploration of the visual environment than the static photographs used in previous developmental neuroimaging studies. Second, this task elicits greater category-selective activation in the ventral temporal lobe than more traditional tasks with static images (Avidan et al., 2005
). Third, since there are no specific task demands, group differences in behavioral performance are not a confound for different levels of functional activation. Also, a block, rather than an event-related paradigm was employed to provide a direct comparison with previous robust results with TD adolescents (Scherf et al., 2007
) and with high-functioning adults with autism (Humphreys et al., 2008
). It also provides stronger signals with better statistical power. The movie vignettes were displayed on a rear-projection screen located inside the MR scanner. Immediately prior to the scanning session, all participants were trained to lie still for 20 min in a mock scanner that simulated the noise and confinement of an actual MR scanner.
Data Acquisition
EPI BOLD images were acquired in 35 AC-PC aligned slices on a Siemens 3T Allegra scanner, covering most of the brain and all of the occipital and temporal lobes (TR = 3000 ms; TE = 35 ms; 64 × 64, 3 mm slice thickness, 3.203 × 3.203 mm in-plane resolution). Anatomical images were acquired using a three-dimensional volume magnetization prepared rapid gradient echo (3D-MPRAGE) pulse sequence with 192 one-mm, T1-weighted, straight sagittal slices.
Data Analyses
The data were analyzed using Brain Voyager QX (Brain Innovation, Maastricht, Netherlands). Preprocessing of functional images included 3D-motion correction, filtering out of low frequencies, and re-sampling the voxels to 1 mm3. Participants who moved more than 3.0 mm (1 voxel) were excluded from the analyses. Separate one-way ANOVAs on each of the six motion dimensions revealed no group differences in movement (F < 1). Thus, any group differences in the functional profile of the ventral visual pathway cannot be explained by motion differences across the groups.
For each participant, the timeseries images for each brain volume were analyzed for category differences in a fixed-factor GLM. Each of the categories was defined as a separate predictor and was modeled with a box-car function adjusted for the delay in hemodynamic response. The timeseries images were then spatially normalized into Talairach space. Although the brains of individuals with autism and typical individuals may differ in size, volumetric differences are minimized as IQ differences are reduced (for review see Stanfield et al., 2008
) and Talairach transformation of functional data is still widely used (e.g., Pierce and Redcay, 2008
). There was no spatial smoothing.
In both the group and individual level analyses, the timeseries images for each brain volume for each individual participant were used to define category selectivity. As in previous studies using this movie task, we adopted a conservative definition of category selectivity contrasting the averaged BOLD response amplitude (across blocks within a category) for each category to that of all the others (Hasson et al., 2004
; Avidan et al., 2005
; Scherf et al., 2007
; Humphreys et al., 2008
). For example, face-selective activation was defined by the weighted contrast [(faces − (objects + bui-ldings + navigation)]. Because scenes of buildings and navigation both drive PPA activation, place-selective activation was defined as [(buildings + navigation) − (faces)].
Identifying category selectivity within each group
Category selectivity was initially evaluated separately in each group by submitting the individual subject timeseries images to a whole brain voxelwise random effects GLM in which the category was a fixed factor and participant was a random factor. This GLM generates beta weights for each individual participant in each condition (i.e., visual category), which were then submitted to two-tailed t-tests in each voxel to determine the relative magnitude of category selectivity. The group level contrast maps (e.g., [(faces − (objects + buildings + navigation)]) were corrected for multiple comparisons using a Monte Carlo simulation. To achieve p < 0.05 significance, the simulation required a minimum of four contiguous 3 mm voxels with a t-value ≥2.3. These group level maps of the topography of category-selective activation for each group are shown in Figure 1
.
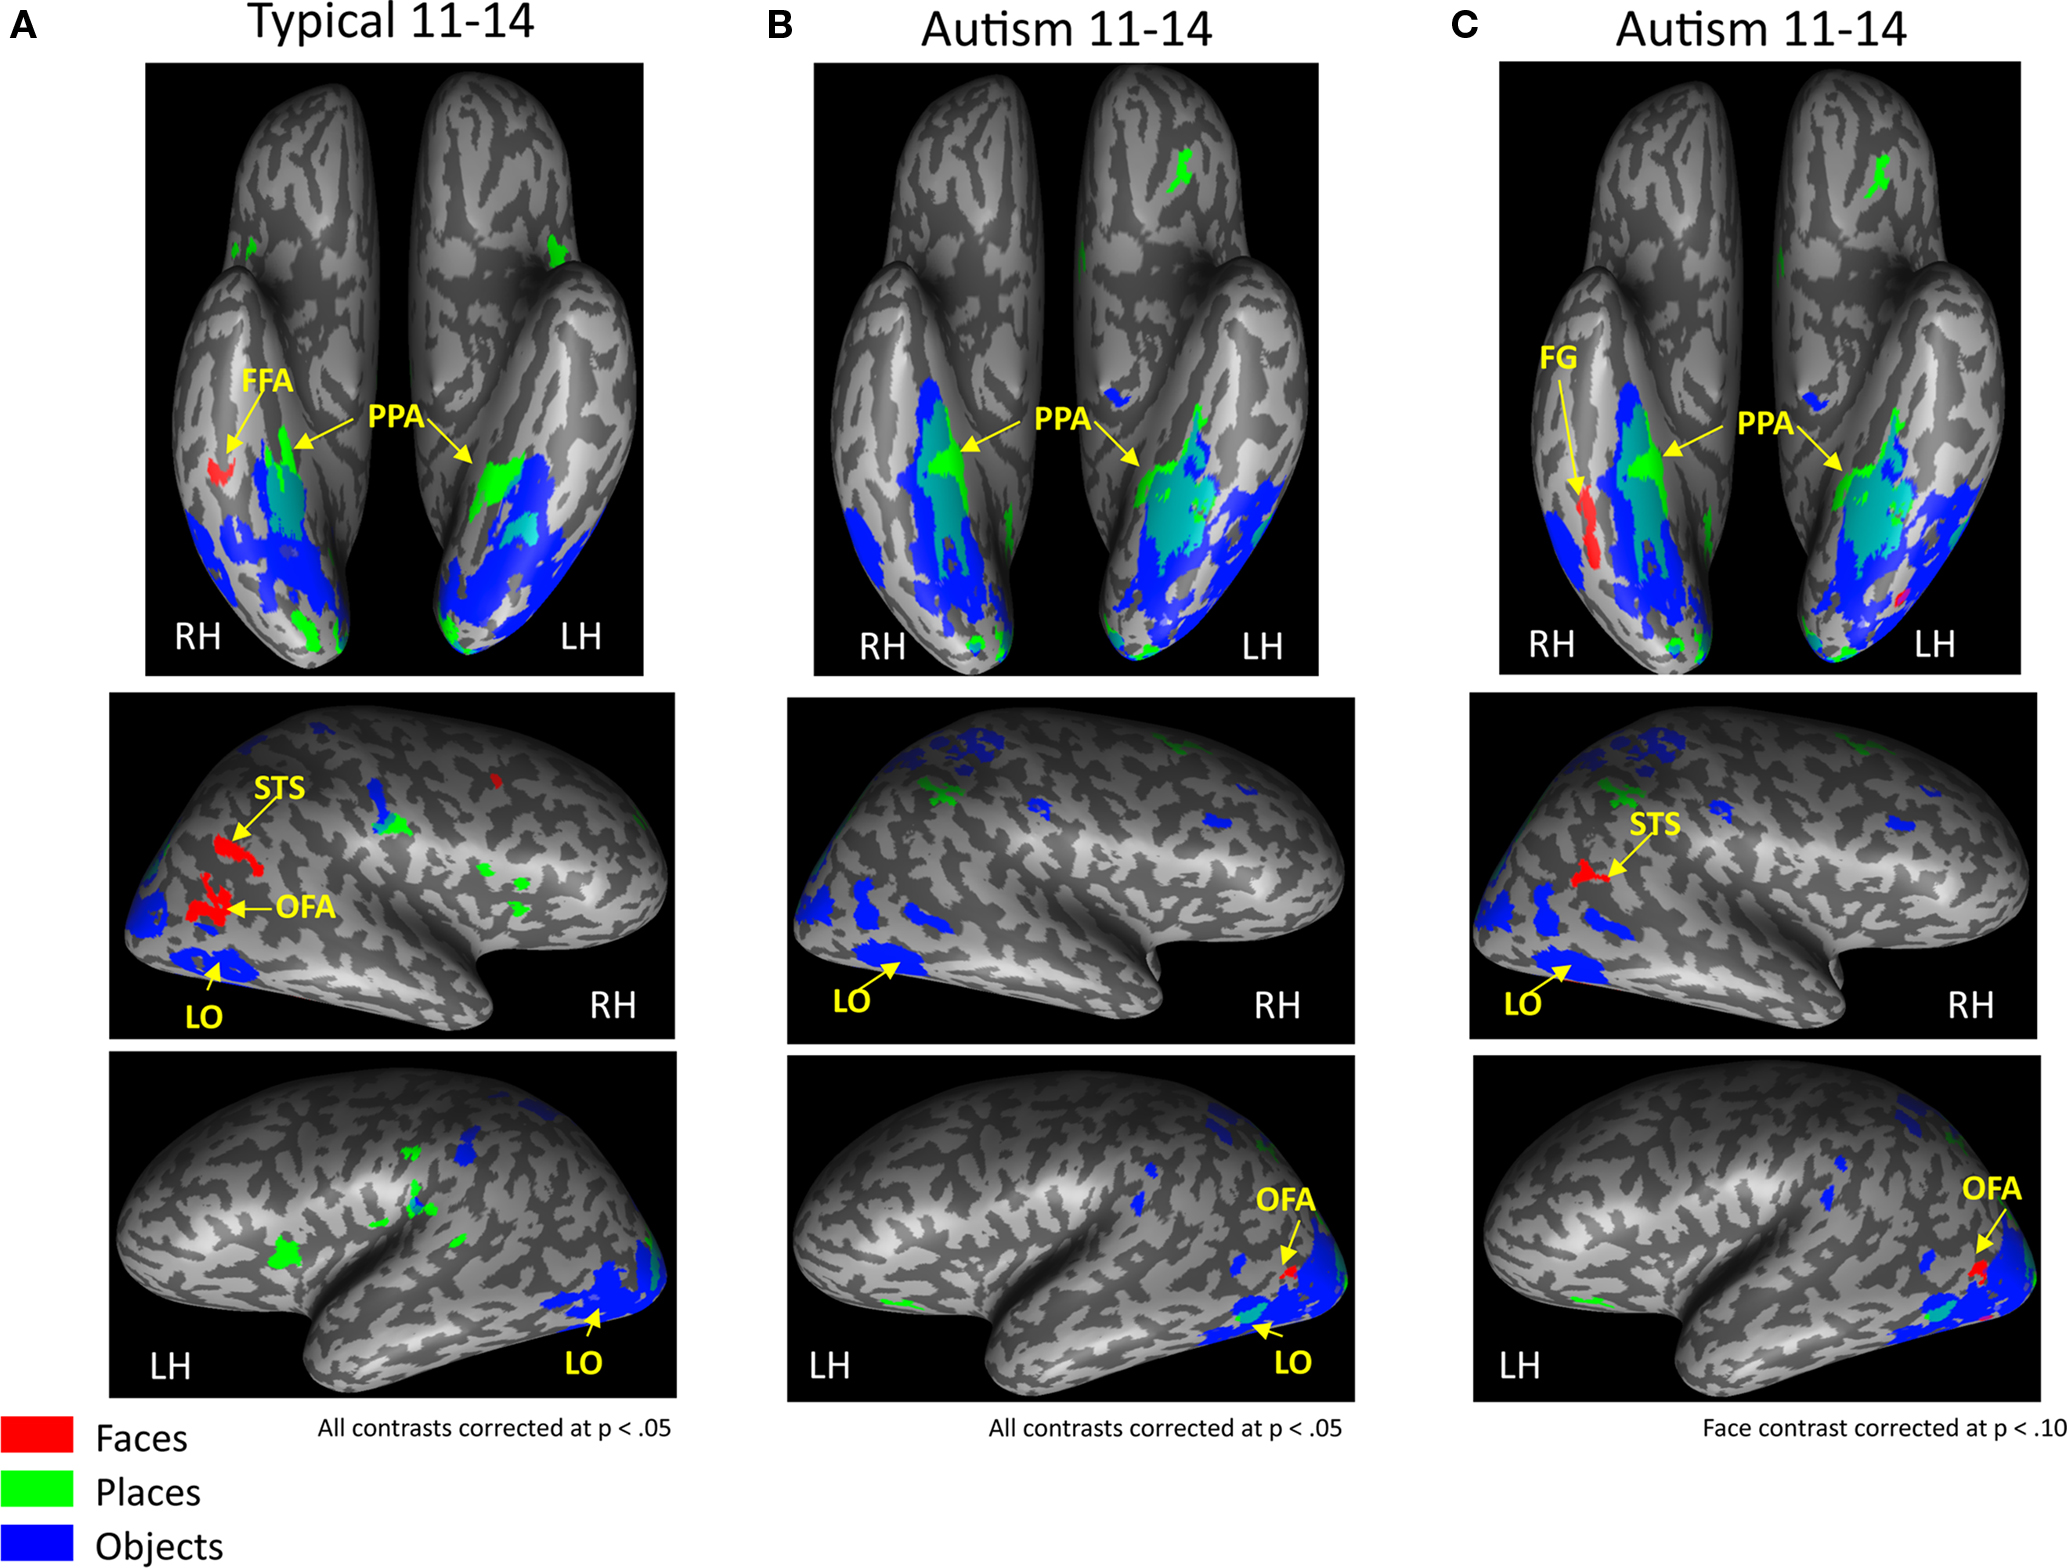
Figure 1. Category-selective topography within each group. Contrast maps for each object category from the group level random effects GLM showing average face-, object-, and place-related activation maps generated from the whole brain analyses for each group. Activation is mapped onto the ventral projection and the lateral hemispheres of a single representative inflated brain for the (A) typically developing adolescents and (B) adolescents with autism, when all contrasts are corrected at p < 0.05. Although there were small loci of face-selective activation in the right and left FG in the HFA group, these ROIs are so ventral that they do not project onto the inflated brain (see Table 1
for coordinates and size of ROIs) (C) To evaluate whether face-selective activation is present in more dorsal and/or anterior portions of the fusiform gyrus in the HFA adolescents as a group, the threshold on just the group level face contrast was reduced to a corrected p < 0.10. A larger face-selective ROI emerged in the right fusiform gyrus and the right STS. FFA, fusiform face area; FG, fusiform gyrus; OFA, occipital face area; STS, superior temporal sulcus; LO, lateral occipital object area; PPA, parahippocampal place area.
Evaluating group differences in target regions of interest
Group-defined ROIs. As a group, the TD adolescents represent the normal state of functional organization in the ventral temporal lobe for this developmental period. To evaluate potential alterations in this organization in HFA adolescents, the TD group-defined ROIs (Figure 1
A; right and left FFA, PPA, LO, and right OFA and right STS) provided the initial candidate regions for examining atypical activation patterns. This analysis uncovers the functional profile of activation in HFA adolescents in the ROIs that are category-selective in TD adolescents. To this end, we computed a ROI-based GLM separately in each TD-defined ROI (see Table 1
). This involved computing a random effects, two-factorial ANOVA across all participants on the timeseries data from the entire experiment within each ROI, with participant as the random factor, visual category as the within-subjects factor, and group as the between-subjects factor. This generated beta weights for all main conditions for each participant (faces, objects, buildings, navigational scenes), which were then submitted to a two-tailed t-test selectivity contrast [e.g., in the TD FFA: TD (faces − objects) versus HFA (faces − objects)] to evaluate group differences in the magnitude of selectivity within each ROI. Although the investigation of the profile of activation in the TD group within these ROIs is not independent from the selection of the ROIs (and we are fully aware of potential statistical biases when defining the ROI and then using the timeseries from the same voxels for the condition comparison), the important and independent contribution of this analysis is in evaluating how aberrant or similar the pattern of activation is within these TD-defined ROIs in the HFA group. To emphasize our focus on the analysis of the HFA group within these TD-defined ROIs, we computed the simple two-tailed t-test between visual categories (e.g. faces versus objects) within each ROI for the HFA group, whose timeseries are completely independent of those used to define the ROIs.
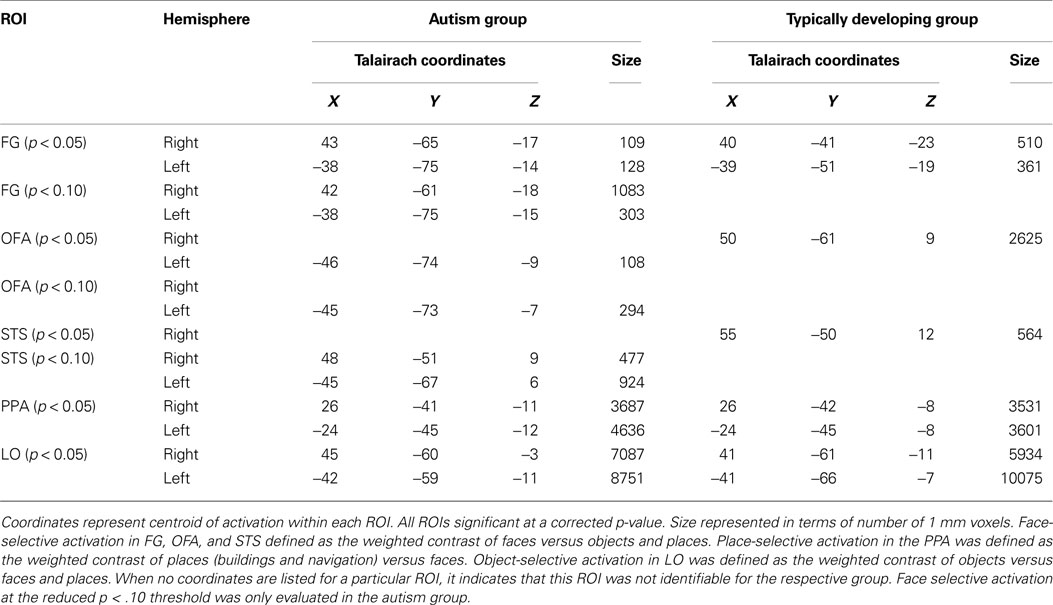
Table 1. Target regions of interest for face, place, and object-selective activation identifi ed in whole brain analysis within each group.
To evaluate the possibility that HFA adolescents exhibit category selectivity in different ROI locations compared to the TD adolescents, the same analyses described above were performed on the profile of activation for each group within the HFA group-defined ROIs. Again, we acknowledge that the investigation of the profile of activation in the HFA group within these ROIs is not independent from the selection of the ROIs. However, investigating potential differences in the profile of activation in the TD group within these HFA-defined ROIs is an independent analysis and provides meaningful information about the functioning of these regions in typical individuals. Again, to emphasize our focus on the analysis of the TD group within these HFA-defined ROIs, we computed the simple two-tailed t-test between visual categories (e.g. faces versus objects) within each ROI for the TD group, whose timeseries are completely independent of those used to define the ROIs.
Individually defined ROIs. To evaluate whether individual variability in the location, size, and/or magnitude of selectivity within the HFA group contributed to group differences in the functional organization within the ventral visual pathway, the functional profile of category-selective activation was determined in individually defined ROIs for each participant in each group. These ROIs were extracted from separate contrast maps (face, place, object-selective ROIs as defined above) in each participant that were corrected for multiple comparisons using the False Discovery Rate Procedure to ensure that fewer than 10% of the significantly active voxels were false positive activations (Genovese et al., 2002
). Composite maps were generated for each visual category (faces, places, objects) of each individual participant’s category-selective activation mapped onto a single inflated brain, illustrating the relative size and extent of overlap in each participant’s individually defined category-selective activation. To evaluate individual variability in the loci of these ROIs, following Müller et al. (2003)
, we calculated the distance in stereotactic space between the midpoint of each individually defined ROI and the midpoint of the appropriate group-defined ROI in each individual of the respective group. For example, the midpoint of the HFA group-defined face-selective right FG occurred at the coordinates (43, −65, −17). For HFA Participant 3, the midpoint of his individually defined face-selective right FG ROI occurred at the coordinates (41, −50, −15), resulting in a distance of 15.3 mm, calculated as follows:
This computation is roughly equivalent to calculating the geometric mean of the differences; however, it preserves the pooled distance in the original units (mm). To compare group differences in these scores, they were submitted to separate independent-samples t-tests for each ROI in each hemisphere and only individuals with definable ROIs were included in this analysis. This was only computed for the right and left FG, PPA, and LO ROIs. A similar analysis could not be computed in the OFA since only the TD group exhibited a definable right OFA and only the HFA group exhibited a definable left OFA.
To evaluate group differences in the magnitude of within-subject category-selective activation within each of these ROIs (FG, OFA, PPA, LO) in each hemisphere, separate ROI-based GLMs were conducted for each subject who exhibited identifiable category-selective activation in each ROI. This generated beta weights for all main conditions for each participant (faces, objects, buildings, navigational scenes), which were then submitted to separate repeated-measures ANOVAs with visual category as the within-subjects variable and group as the between-subjects variable. To evaluate the extent of the category-selective activation within these individually defined ROIs, the number of significantly active voxels was extracted for each ROI in each hemisphere and compared for group differences in separate two-tailed t-tests. If a participant had no identifiable category-selective activation, the mean beta weight for each condition from the appropriate group (TD, HFA) and ROI was submitted to the analysis of category selectivity and a value of 0 was entered in the analyses of the extent of activation, so that all participants contributed to the analysis. In all analyses (magnitude, extent, locus), there was equal variance across the two groups as determined by the Levene’s test of equality of variances.
Correlation analyses
To examine associations between patterns of brain activation and participant demographics in the autism group, Pearson correlation coefficients between the size (number of significantly active voxels) and category selectivity (difference in beta weights of respective visual categories in individual ROI GLMs) of each of the individually defined ROIs and ADOS and IQ scores were computed.
Category-Selective Topography within Each Age Group
Figure 1
shows the average face-, object-, and place-related activation maps generated from the whole brain analyses for each group projected onto the inflated cortical surface of a representative individual. Category selectivity was defined by the weighted contrast of the category of interest (e.g., faces) versus all other visual categories (e.g., objects, navigation, buildings). All regions of significant activity for each contrast in each group are reported in Table S2 in Supplementary Material, but the focus of the results described here is on patterns of significant activity in the target ROIs including the FFA, OFA, STS, LO, and PPA (see Table 1
).
Consistent with previous findings from this task, TD adolescents (Figure 1
A) exhibited significant face-related activation bilaterally in the FFA, and in the right OFA and STS. TD adolescents also activated bilaterally the medial portion of the FG and the ventral LO when viewing common objects and the PPA when viewing places.
HFA adolescents showed typical patterns of activation when viewing objects and places, with object-selective activation bilaterally in similar medial portions of the FG and the ventral LO and place-selective activation in the PPA (Figure 1
B). However, unlike TD adolescents, the only face-related region that the HFA adolescents activated as a group was a very posterior region of the FG bilaterally (right: 43, −65, −17; left: −38, −75, −14), which was so ventral that it did not project onto the inflated surface in Figure 1
B. The HFA adolescents also activated a portion of the left OFA (Talairach coordinates of the midpoint: −46, −74, −9), which was not present in the TD adolescents. To evaluate whether any face-selective activation is present in more dorsal and anterior portions of the FG in the HFA adolescents as a group, the threshold on the group level face contrast was reduced to a corrected p < 0.10 (Figure 1
C). At this reduced threshold, a larger face-selective ROI emerged only in the right FG (Talairach coordinates of the midpoint: 42, −61, −18; 1079 voxels). This appears to be a dorsal and anterior extension of the posterior FG activation that was significant at p < 0.05. However, the region is still more ventral and posterior than the TD FFA activation and only overlaps with the TD group ROI in a small portion of the most anterior part of the HFA ROI and posterior part of the TD ROI (Talairach coordinates of the midpoint: 40, −46, −22; 22 voxels). A region of right posterior STS face-selective activation also emerged at this more lax threshold in the HFA group (Talairach coordinates of the midpoint: 48, −51, 9; 477 voxels). No such face-selective regions emerged in the right OFA or the left STS even at this more lax threshold.
Group Differences in Target Regions of Interest
Figure 2
shows the cortical activation profiles for each group, as measured by the difference in relevant beta weights from the separate ROI GLMS contrasting category selectivity across groups within each ROI, in both the TD-defined (Figures 2
A–C) and HFA-defined (Figures 2
D–F) group level ROIs.
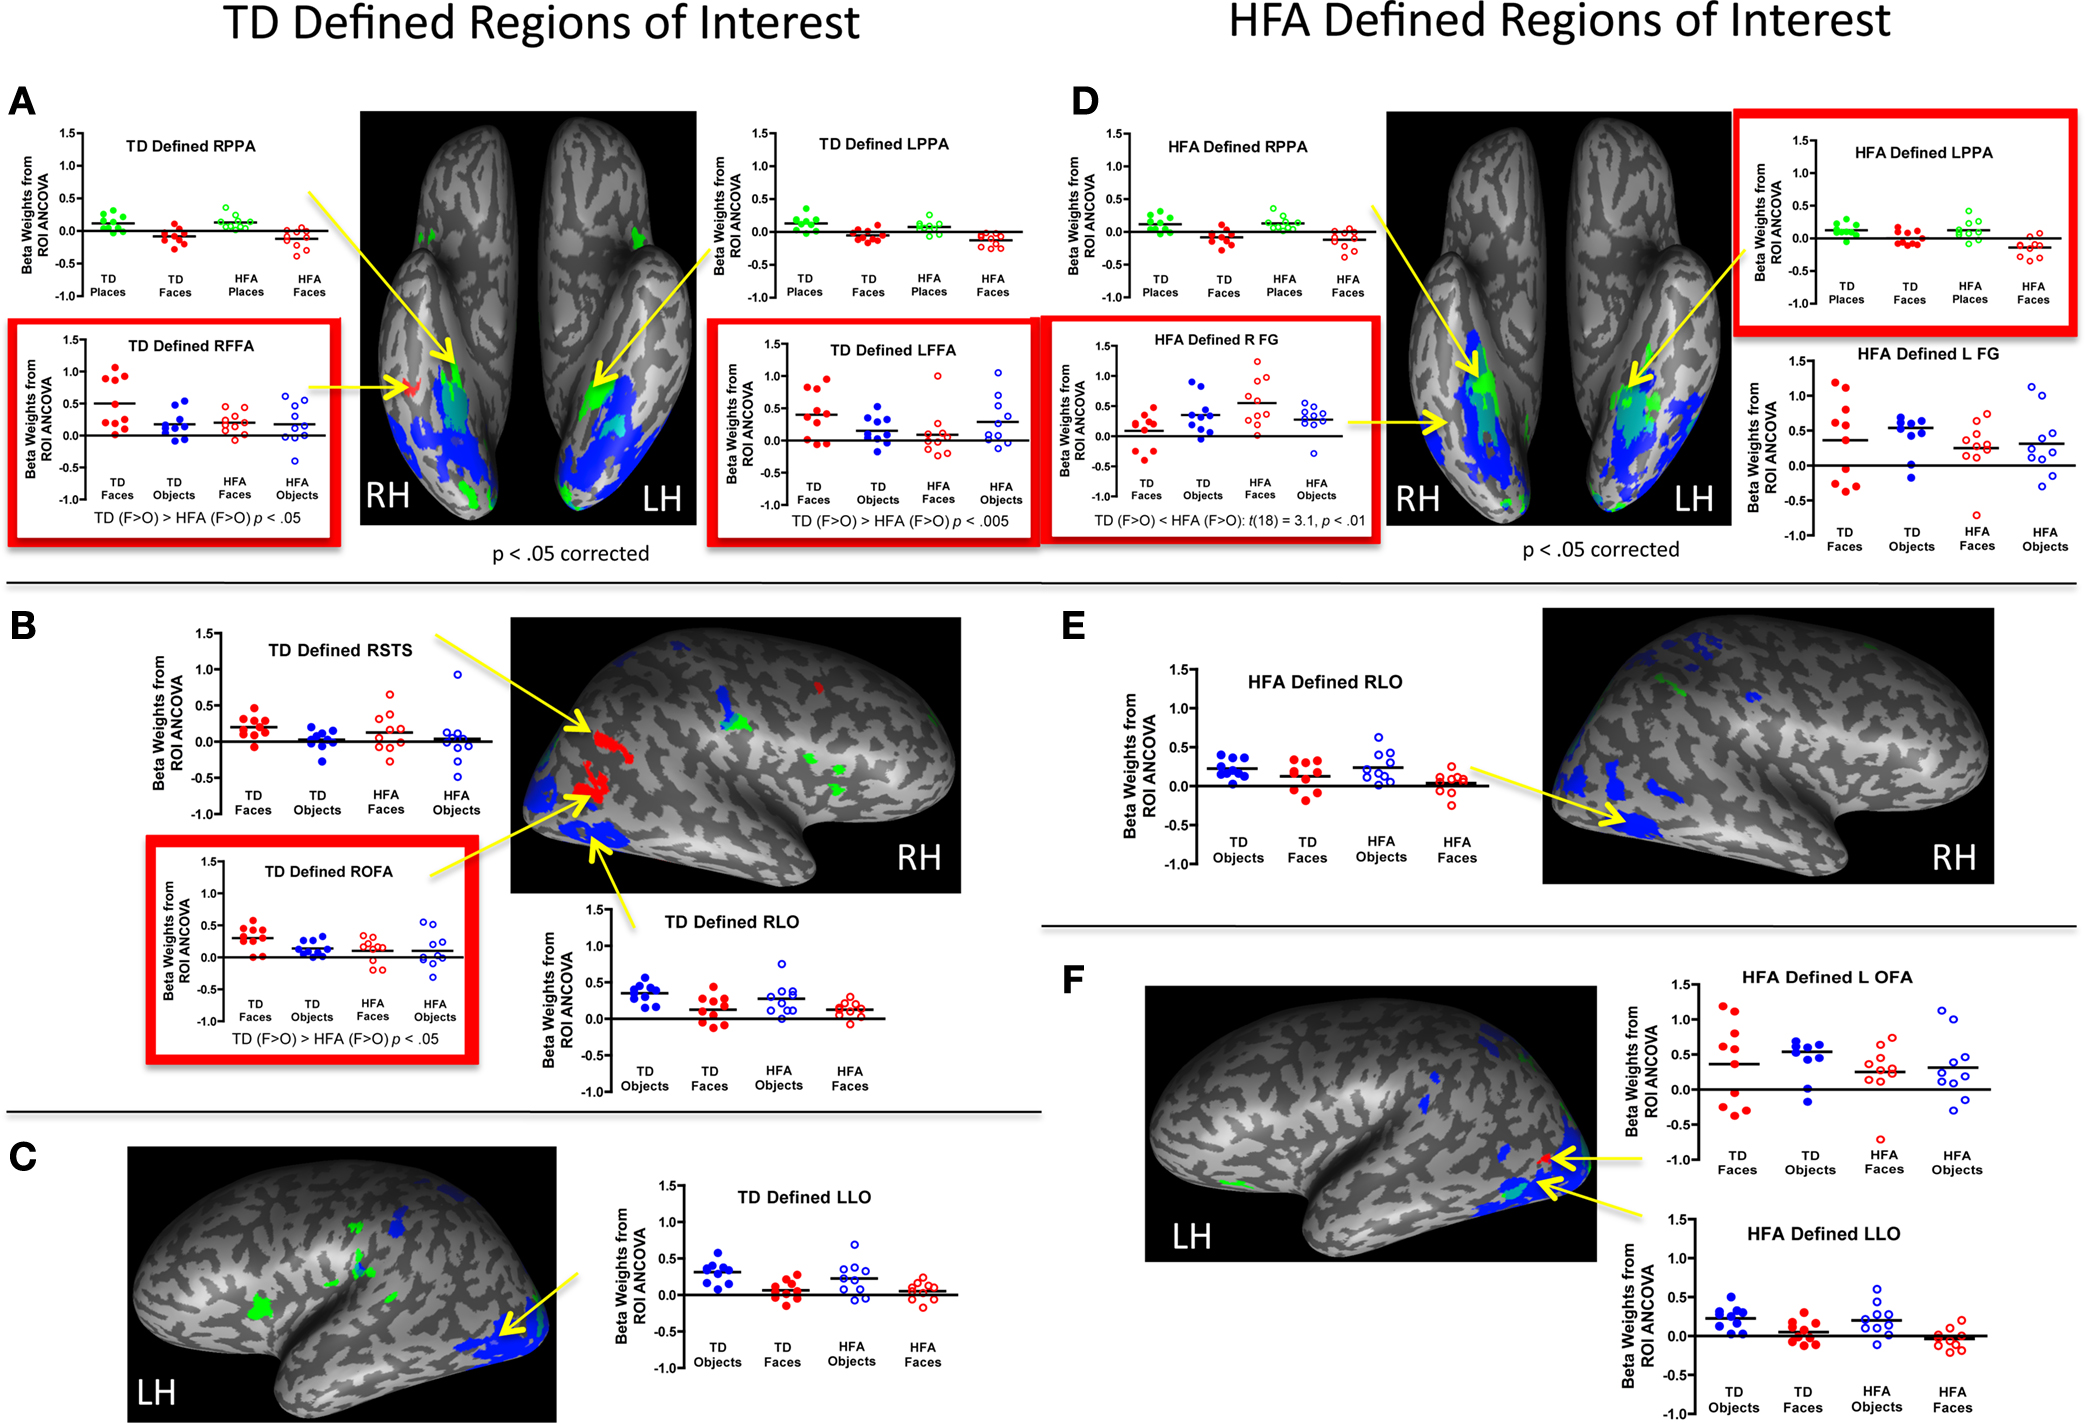
Figure 2. Group differences in profile of activation within target regions of interest (ROI). Group differences in the magnitude of category selectivity were directly evaluated within each of the target ROIs (FFA, OFA, STS, LO, PPA) identified in the typically developing (TD) adolescent group map (A–C) and also in the group map of the high-functioning adolescents with autism (HFA: (D–F)) at a corrected p < 0.05 threshold. Significant differences in beta weights derived from the ANOVA are outlined in red. There were no group differences in selectivity for objects in any of the object-selective ROIs, regardless of how they were defined (by the TD or HFA group). Similarly, in the TD-defined PPA ROIs, the groups were equally selective for places compared to faces. In the HFA-defined PPA ROIs, the HFA group exhibited more place-selectivity than did the TD group, which was related to lower beta values for faces, as opposed to higher beta values for places. The most prominent group differences were evident in the fusiform gyrus and OFA face-related ROIs, as defined by each group. In the right TD-defined FFA and OFA, HFA participants exhibited object, as opposed to face, selectivity. In the HFA-defined right fusiform gyrus, the TD group exhibited object, as opposed to face, selectivity. This set of findings represents a double dissociation such that face-related ROIs in the TD group were more object selective in the HFA group, whereas face-related ROIs in the HFA group were more object selective in the TD group.
Group-defined ROI analyses
TD-defined ROIs. To evaluate potential alterations in the normal state of functional organization in the ventral temporal lobe, the TD group-defined ROIs provided the initial candidate regions for examining atypical activation patterns in the HFA group. The HFA group exhibited comparable magnitude of category selectivity for places in the right and left TD-defined PPA (Figure 2
A) and for objects in the right and left TD-defined LO (Figures 2
B,C) as did the TD group [all t(18) ≤ 1.0]. However, within the face-selective ROIs, the HFA group exhibited less selectivity for faces compared to objects than did the TD group in the TD-defined right FFA, t(18) = 2.2, p < 0.05, left FFA, t(18) = 3.8, p < 0.005, and right OFA, t(18) = 2.1, p < 0.05 (see Figures 2
A,B). In fact, the HFA group failed to exhibit selectivity for either faces or objects in both the right FFA, t(9) = 0.3, p = ns, and OFA, t(9) = 0.1, p = ns. However, in the case of the left FFA, the HFA group exhibited more selectivity for objects than faces, t(9) = 3.4, p < 0.01. Interestingly, the groups showed equal selectivity for faces in the TD-defined right STS, t(18) = 0.5, p = ns.
HFA-defined ROIs. To evaluate the possibility that HFA adolescents exhibit category selectivity, and face selectivity in particular, in different ROI locations compared to the TD adolescents, similar analyses were performed on the profile of activation for each group within the HFA group-defined ROIs. Unlike in the TD-defined place-selective ROIs, the HFA group tended to exhibit more selectivity for buildings compared to faces in the HFA-defined right PPA, t(18) = 1.9, p = 0.10, and left PPA, t(18) = 2.8, p < 0.01, than did the TD group (Figure 2
D). However, there were no group differences [all t(18) ≤ 1.0] in category selectivity for objects bilaterally in the HFA-defined LO (Figures 2
E,F). Finally, in the HFA-defined face-selective ROIs (at the p < 0.05 corrected threshold), as expected the HFA group exhibited more activation to faces than to objects in the right and left FG, and in the left OFA. However, in the right FG, there was a significant difference between the groups in face selectivity, t(18) = 3.1, p < 0.01. (Figure 2
D). While the HFA group exhibited selectivity for faces in the ROI, the TD group exhibited selectivity for objects in this ROI, t(9) = 2.2, p = 0.05, presumably because of its posterior location. The groups did not differ in the magnitude of selectivity in the left FG, t(18) = 1.0, p = ns, or in the left OFA, t(18) = 1.2, p = ns. Interestingly, the TD group did exhibit more selectivity for objects than faces in the HFA-defined face-selective left OFA when it was defined at the reduced threshold (p < 0.10 corrected), t(18) = 2.4, p < 0.05.
In summary, the group-defined ROI analyses revealed an important double dissociation in face-selective regions in the FG. Those regions defined by the TD group were more object-selective in the HFA group, and the reverse was true for the face-selective ROIs defined by the HFA group, they were more object-selective in the TD group. There were no group differences in object-related ROIs defined by either group, and the place-selective ROIs were slightly more selective for places in the HFA group, but only in the HFA-defined PPA.
Individually defined ROI analyses
Face-related ROIs. To illustrate individual variability within the HFA and TD groups in the location and size/extent of face-related ROIs, composite maps were created that show face-related activation defined uniquely for each individual in the FG (Figures 3
A,B) and OFA (Figures 3
E,F). In the composite maps, each participant’s individually defined face-selective activation is shown in a unique color with the group-defined face-selective FG and OFA activation illustrated in white (see Table S3 in Supplementary Material for coordinates and size of individual ROIs). Ninety percent of the individuals in the TD group exhibited face-selective activation in the right FG, with 60% exhibiting face-selective activation in the TD group-defined right FFA ROI. In contrast, 70% of the individuals in the HFA group exhibited face-selective activation in the right FG, however, only 30% of the HFA individuals exhibited face-selective activation in the right FFA, as defined by the TD group. Similarly, 80% of the TD individuals exhibited face-selective activation in the right OFA, with 70% overlapping in the TD group-defined OFA ROI. Although 100% of the HFA participants exhibited face-selective activation in the right OFA, only 30% of these individuals exhibited overlapping activation in the OFA as defined by the TD group. These results indicate that 20% fewer individuals within the HFA group exhibited identifiable face-selective activation in the FG, even at the somewhat lenient statistical threshold of FDR q < 0.10, and 50% fewer exhibited such activation in the FFA region of the FG. Furthermore, when this face-selective activation can be identified, there is considerably more variability in the location of both the FG and OFA face-selective ROIs among the individuals with autism.
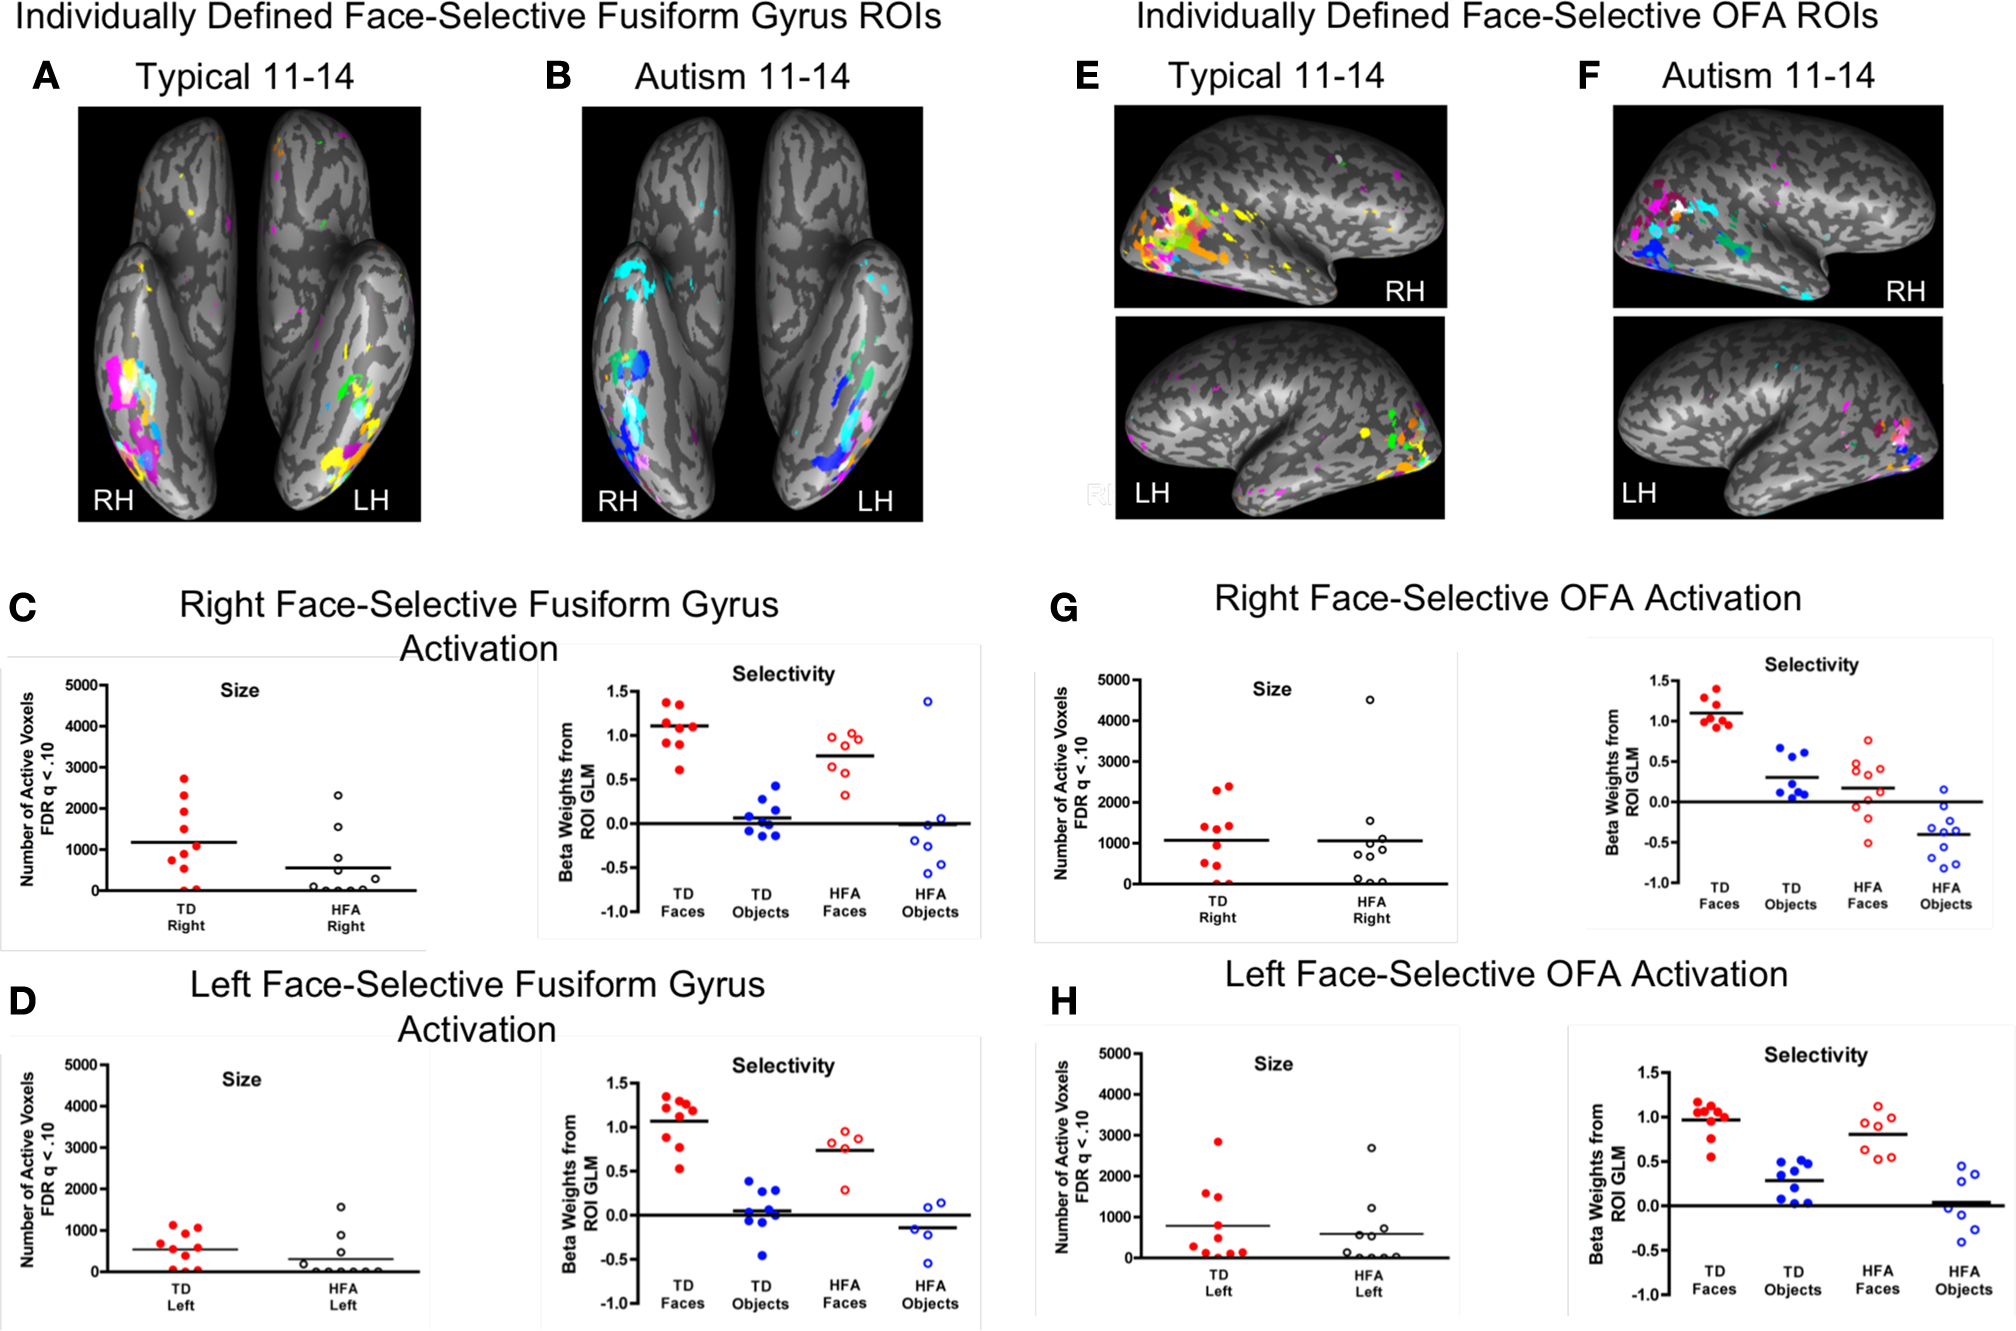
Figure 3. Individual subject variability in location, size, and magnitude of face-selective activation in the fusiform gyrus (A–D) and OFA (E–H). The individually defined face contrast map for each participant in each group, represented in a unique color, was thresholded using the FDR procedure (q < 0.10) and overlaid onto a single inflated brain. The respective group-defined ROIs are illustrated in white. (A) Ninety percent of the TD individuals exhibited face-selective activation in the right fusiform gyrus, with 60% in the TD group-defined right FFA ROI. (B) In contrast, 70% of the HFA exhibited face-selective activation in the right fusiform gyrus, however, only 30% exhibited face-selective activation in the right FFA, as defined by the TD group. (C,D) There were no group differences in the extent (total number of active voxels) or magnitude of face selectivity (difference in beta weights for faces and objects from the individual subject ROI GLMs) in the right or left face-related fusiform gyrus ROIs. (E) Eighty percent of the TD individuals exhibited face-selective activation in the right OFA, with 70% overlapping in the TD group-defined OFA ROI. (F) Although 100% of the HFA participants exhibited face-selective activation in the right OFA, only 30% exhibited overlapping activation in the OFA as defined by the TD group. (G,H) There were no group differences in the size or magnitude of face selectivity in the individually defined OFA ROIs, however, the TD individuals tended to exhibit more activation across both visual categories in the right and left OFA.
To quantitatively compare differences in variability in the loci of activation in these individually defined face-related regions, we computed the distance in stereotactic space between the midpoint of each individual ROI and the midpoint of the respective group ROI. As expected, individual spatial variability was higher in the HFA individuals than in the TD individuals in the right FG, t(14) = 2.9, p < 0.01, and in the left FG, t(12) = 2.9, p < 0.025. Figure 4
illustrates the mean distance in millimeters of the individually defined ROIs from the location of the respective group-defined ROI for both the HFA and TD groups.
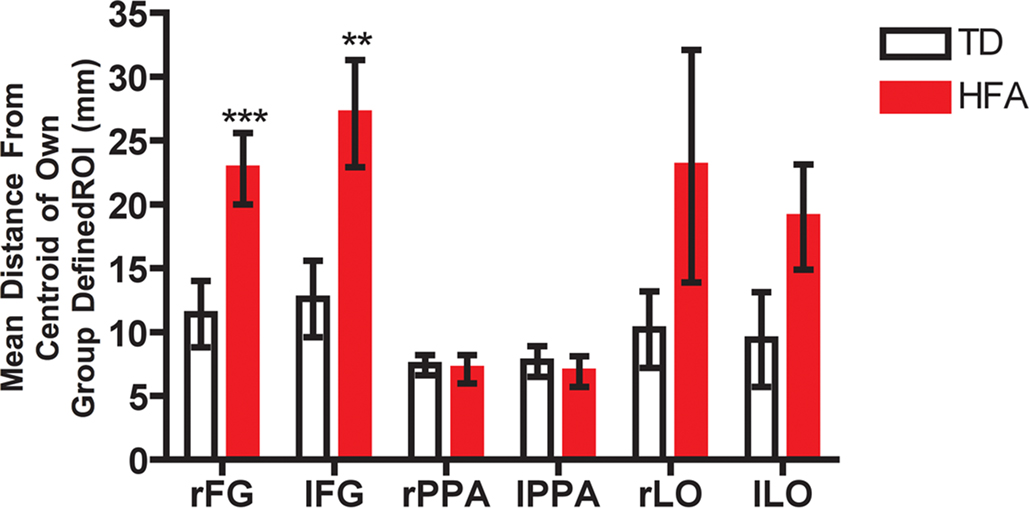
Figure 4. Inter-subject spatial variability in the centroid of activation in face-, place-, and object-related regions. The spatial distance from the respective group mean was computed in each individual participant in three-dimensional normalized space in each region separately. In the right and left fusiform gyrus (FG) the HFA group exhibited more variability than did the TD group in the locus of face-related activation; however, both groups exhibited similar spatial variability in the locus of place- and object-related activation. **p < 0.01, *p < 0.025.
Surprisingly, despite the increased variability in the locus of face-related activation in the HFA group, particularly in the FG, HFA individuals with identifiable face-related activation exhibited comparably sized ROIs as did the TD group (Figures 3
C–H). There were no group differences in extent of activation, as measured by the total number of face-selective voxels, in either the FG or the OFA in either hemisphere [all t(18) < 1.7].
Finally, the repeated-measures ANOVAs on the magnitude of face-selective activation, as measured by the difference in beta weights for faces and objects from the individual subject ROI GLMs in the respective regions, only revealed subtle group differences.
In the right FG, there was a main effect of visual category, F(1, 18) = 77.3, p < 0.001, with higher activation to faces compared to objects in both groups and a trend for a main effect of group, F(1, 18) = 77.3, p = 0.064, with the TD group showing more activation in the right FG than the HFA group across both visual categories. However, there was no visual category × group interaction, F(1, 18) = 1.7, p = ns, indicating that both groups showed comparable selectivity for faces compared to objects in spite of the generally lower level of activation in this region in the HFA group. Similarly, in the left FG, there were also main effects of visual category, F(1, 18) = 296.4, p < 0.001, with higher activation to faces compared to objects in both groups, and of group, F(1, 18) = 10.5, p < 0.01, with TD individuals exhibiting more activation across both faces and objects than the HFA group. However, as in the right FG there was no visual category × group interaction, F(1, 18) = 1.7, p = ns, indicating similar selectivity for faces in both groups. The same pattern of results emerged in the right and left OFA. There were main effects of visual category in both the right, F(1, 18) = 109.4, p < 0.001, and left, F(1, 18) = 291.7, p < 0.001, OFA ROIs with faces eliciting more activation than objects across both groups. There was a main effect of group in the left OFA, F(1, 18) = 5.9, p < 0.05, and a trend for the main effect of group in the right OFA, F(1, 18) = 3.4, p = 0.08, with TD individuals exhibiting more activation across both faces and objects than did the HFA group. However, there were no visual category × group interactions in either the right, F(1, 18) = 0.7, p = ns, or the left, F(1, 18) = 0.9, p = ns, OFA ROIs, indicating similar profiles of category selectivity for faces in both groups. There were too few individuals in each group to perform similar analyses in either the right or left STS.
Place-related ROIs. Figure 5
illustrates the composite maps of place-related activation defined uniquely for each individual within each group in the parahippocampal gyrus (Figures 5
A,B). Eighty percent of the individuals in the TD group exhibited place-selective activation in the right parahippocampal gyrus, with 50% exhibiting place-selective activation in the TD group-defined right PPA ROI. Similarly, 70% of the individuals in the HFA group exhibited place-selective activation in the right parahippocampal gyrus and all of these HFA individuals exhibited place-selective activation in the right PPA as defined by the TD group. In contrast, although 70% of the TD individuals exhibited place-selective activation in the left PPA, only 20% of individuals showed overlapping activation in the TD group-defined left PPA, whereas 70% of the HFA individuals exhibited place-selective activation in the left PPA and 60% of these individuals showed overlapping activation in the TD group-defined left PPA. Furthermore, there were no group differences in the individual variability of the locus of activation in either the right PPA, t(13) = 0.3, p = ns, or the left PPA, t(12) = 0.5, p = ns (see Figure 5
).
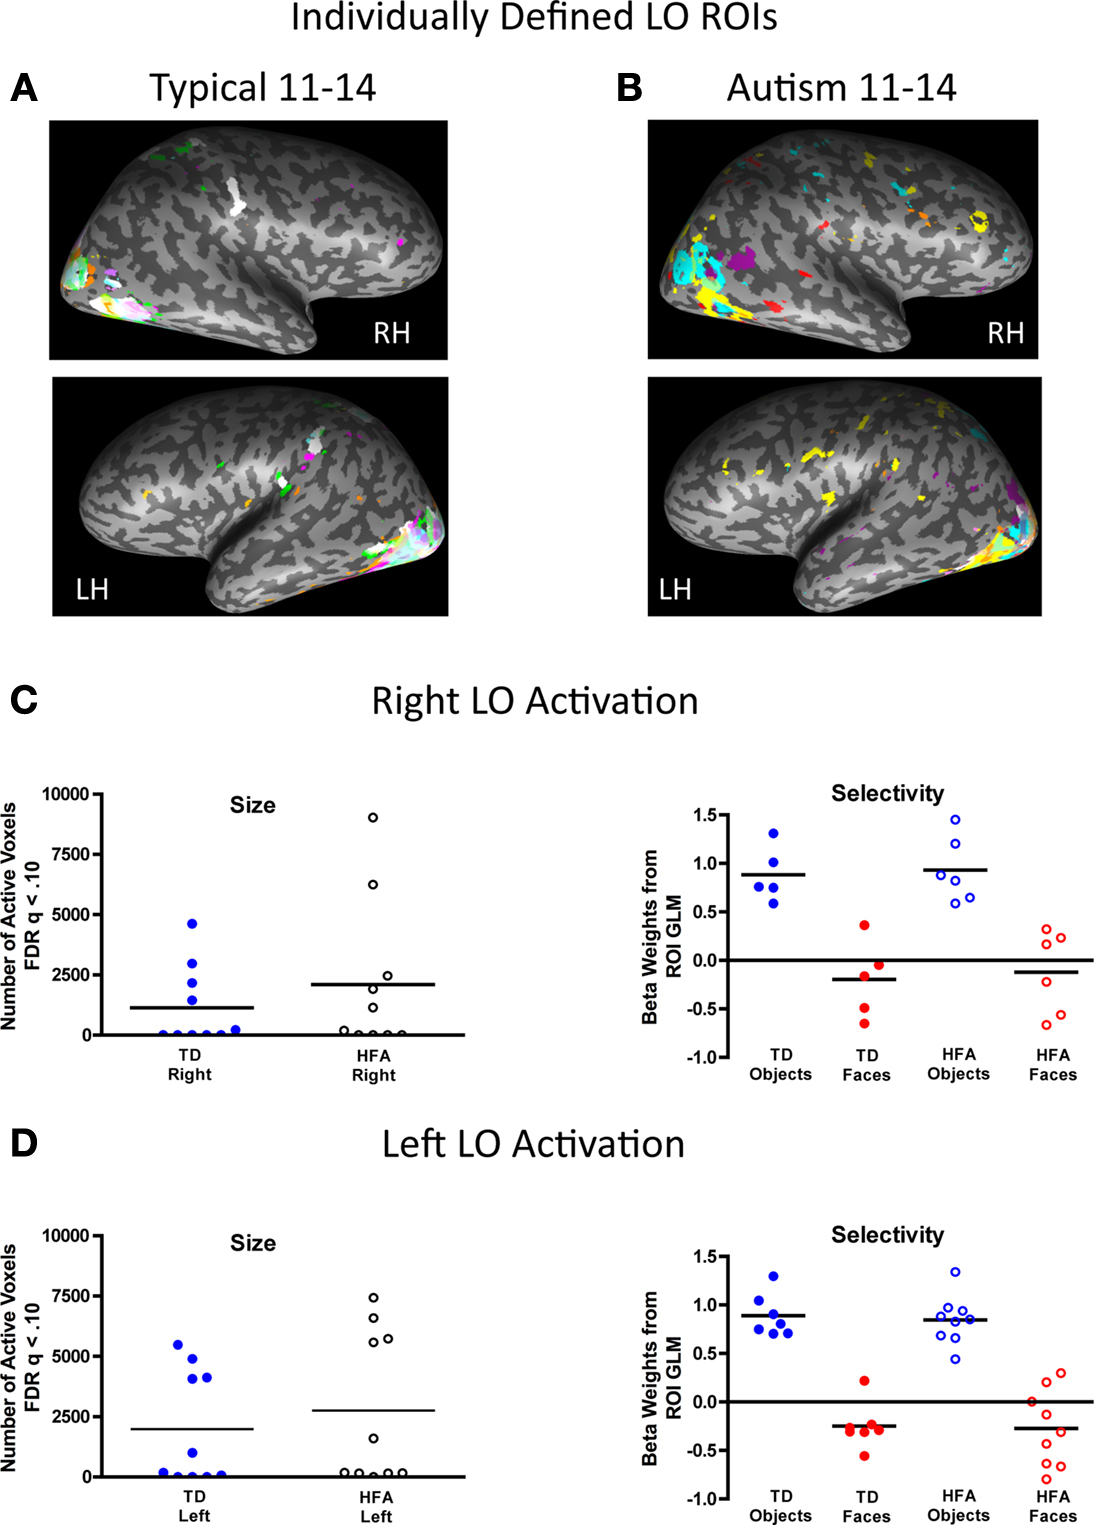
Figure 5. Inter-subject variability in location, size, and magnitude of place-selective activation in the parahippocampal place area (PPA). The individually defined place contrast map for each participant in each group, represented in a unique color, was thresholded using the FDR procedure (q < 0.10) and overlaid onto a single inflated brain. The respective group-defined ROIs are illustrated in white. There was high consistency in the location of place-selective activation across the groups. (A) Eighty percent of the TD individuals exhibited place-selective activation in the right PPA, with 50% in the TD group-defined right PPA ROI. (B) Similarly, 70% of the HFA individuals exhibited place-selective activation in the right PPA and all of these individuals exhibited place-selective activation in the right PPA as defined by the TD group. In contrast, although 70% of the TD individuals exhibited place-selective activation in the left PPA, only 20% of individuals showed overlapping activation in the TD group-defined left PPA, whereas 70% of the HFA individuals exhibited place-selective activation in the left PPA and 60% of these individuals showed overlapping activation in the TD group-defined left PPA. (C,D) There were no group differences in the extent (total number of active voxels) or magnitude of place-selectivity (difference in beta weights for places and faces from the individual subject ROI GLMs) in the right or left PPA ROIs.
Similarly, the extent and profile of activation in the individually defined PPA ROIs was also comparable across the groups. Figures 5
C,D show the extent, as measured by the total number of active voxels, and magnitude of place-selectivity, as measured by the difference in beta weights for places and faces from the individual subject ROI GLMs in the individually defined right and left PPA for each group. There were no group differences in the extent of place-selective activation in either the right or left PPA [all t(18) < 1.0]. Both groups exhibited strong category selectivity for places compared to faces bilaterally in the PPA as indicated by a main effect of visual category in the right, F(1, 18) = 514.9, p < 0.001, and left, F(1, 18) = 1138.6, p < 0.001, PPA. In the left PPA, there was a main effect of group, F(1, 18) = 19.2, p < 0.001, such that the TD individuals exhibited more activation across both visual categories compared to the HFA individuals. However, there was no such effect of group in the right PPA, F(1, 18) = 0.3, p = ns. Interestingly, although there was no interaction between visual category and group in the left PPA, F(1, 18) = 0.3, p = ns, indicating similar degrees of category selectivity for buildings compared to faces, there was a significant visual category × group interaction in the right PPA, F(1, 18) = 5.6, p < 0.05. Separate independent-samples two-tailed t-tests revealed that the difference in selectivity in the left PPA was driven by more negative responses to faces in the HFA than TD group, t(18) = 2.62, p < 0.025. The groups evinced comparable activation to buildings in the left PPA, t(18) = 0.6, p = ns.
Object-related ROIs. Figure 6
illustrates the composite maps of object-related activation defined uniquely for each individual within each group in the lateral occipital complex (Figures 6
A,B). Only 50% of the individuals in the TD group exhibited object-selective activation in the right LO, with 40% exhibiting object-selective activation in the TD group-defined right LO ROI. Similarly, 60% of the individuals in the HFA group exhibited object-selective activation in the right LO and all of these HFA individuals exhibited object-selective activation in the right LO as defined by the TD group. In the left LO, 70% of the TD individuals exhibited object-selective activation and all of these individuals showed overlapping activation in the TD group-defined left LO. Ninety percent of the HFA individuals exhibited object-selective activation in the left LO and 70% of these individuals showed overlapping activation in the TD group-defined left LO. Furthermore, there were no group differences in the individual variability of the locus of activation in either the right LO, t(9) = 1.2, p = ns, or the left LO t(14) = 1.7, p = ns (see Figure 6
).

Figure 6. Inter-subject variability in location, size, and magnitude of object-selective activation in the lateral occipital (LO). The individually defined object contrast map for each participant in each group, represented in a unique color, was thresholded using the FDR procedure (q < 0.10) and overlaid onto a single inflated brain. The respective group-defined ROIs are illustrated in white. There was high consistency in the location of object-selective activation across the groups, particularly in the left LO. (A) Fifty percent of the TD individuals exhibited object-selective activation in the right LO, with 40% in the TD group-defined right LO ROI, and 70% of the TD individuals exhibited object-selective activation in the left LO, all of whom showed overlapping activation in the TD group-defined left LO. (B) Similarly, 60% of the HFA individuals exhibited object-selective activation in the right LO and all of these individuals exhibited object-selective activation in the right LO, as defined by the TD group, and 90% of the HFA individuals exhibited object-selective activation in the left LO with 70% of these individuals showed overlapping activation in the TD group-defined left LO. (C,D) There were no group differences in the extent (total number of active voxels) or magnitude of object-selectivity (difference in beta weights for objects and faces from the individual subject ROI GLMs) in the right or left LO ROIs.
Similarly, the extent and profile of activation in the individually defined LO ROIs was also comparable across the groups. Figures 6
C,D show the extent and magnitude of object-selectivity, as measured by the difference in beta weights for objects and faces from the individual subject ROI GLMs in the respective regions, for the individually defined right and left LO in each group. There were no group differences in the extent of object-selective activation in either the right or left LO [all t(18) < 1.0]. Both groups exhibited strong category selectivity for objects compared to faces bilaterally in the LO as indicated by a main effect of visual category in the right, F(1, 18) = 598.6, p < 0.001, and left, F(1, 18) = 450.6, p < 0.001, LO ROIs. Unlike in the face- and place-related ROIs, there were no main effects of group or interactions between group and visual category in either the right of left LO, indicating a similar profile of category selectivity for objects compared to faces in the LO bilaterally in both groups.
Correlations
There were no significant correlations between any of the individually defined ROI measures and ADOS (social, communication, total tested separately) or IQ (VIQ, PIQ, FSIQ tested separately) scores in the autism group.
The goals of this study were to investigate alterations in the functional topography of category-selective cortical activation for faces, places, and objects in the ventral visual pathway in high-functioning adolescents with autism and to evaluate whether and how individual variability in the location, size, and magnitude of selectivity contribute to any observed atypicalities. The largest group differences were obtained in the patterns of face-selective activation, primarily in terms of the location of such activation within the network of core face-processing regions (FG, OFA, STS), but also in terms of the lack of face-selective activation in the expansive network of frontal regions that was observed in the TD adolescents (see Table S2 in Supplementary Material). HFA adolescents exhibited object-related activation bilaterally in the LO and place-related activation in the PPA in both the group and individually defined ROI analyses that was comparable to that of the TDs. The number of active voxels, location, and magnitude of category-selective activation was also similar in the HFA and TD groups for object-selective LO and place-selective PPA. Together, these findings indicate that atypicalities in the functional topography of the ventral visual pathway in autism are primarily related to the emergence of face-related cortex and are already evident in early adolescence. These findings lend further support to the notion that adolescence is a particularly vulnerable period of visuoperceptual development, particularly for face processing, in autism (see Scherf et al., 2008a
,b
).
Developmental Differences In Face-Selective Activation
Using dynamic, naturalistic, and rich stimuli, we found the classic pattern of hypoactivation of face-selective neural responses bilaterally in the FG during adolescence, a sensitive developmental period for the maturation of such regions in TD individuals. These findings are consistent with studies that reported similar hypoactivation in adults (Critchley et al., 2000
; Schultz et al., 2000
; Pierce et al., 2001
; Hall et al., 2003
; Hubl et al., 2003
; Ogai et al., 2003
; Piggot et al., 2004
; Wang et al., 2004
; Dalton et al., 2005
; Deeley et al., 2007
; Humphreys et al., 2008
) and in adolescents (Wang et al., 2004
; Dalton et al., 2005
; Grelotti et al., 2005
) with autism. Importantly, we also observed face-related hypoactivation in the OFA and STS, suggesting that the entire network of face-related regions in the ventral visual pathway is altered in autism. This finding was derived from the within-group whole brain analysis (Figure 1
). However, direct group comparisons across all participants (and within the HFA group independently) in the magnitude of face selectivity within the typical face-related ROIs (as defined by the TD group map), also indicate that HFA adolescents do not exhibit selectivity for faces in either the right or left FFA, or right OFA. Surprisingly, there were no group differences in the magnitude of category selectivity for faces in the TD-defined right STS.
It is important to acknowledge that despite our findings of hypoactivation in the right OFA and FFA region of the FG in the HFA adolescents, as a group they did exhibit face-selective activation in a small very ventral and posterior region of the right and left fusiform gyri at the standard statistical threshold. Furthermore, when the threshold was relaxed, the group-defined face-selective activation hinted at a shadow of the typical profile in the right FG and in the right STS. However, the midpoint of this face-related FG activation was extremely posterior and only exhibited a small amount of overlap with the TD group-defined FFA (approximately 22 voxels). Importantly, although this region was selective for faces in the HFA group, it was selective for objects in the TD group (see Figure 2
D).
Together, converging results from the group average maps and the analyses of differences in the profile of activation across individuals within these group-defined ROIs suggest that the difference between the HFA and TD groups is in the location of face-selective activation, particularly in the FG, the pre-eminent face-processing region. In the TD group, face-selective activation in the FG is centered on a region that corresponds to the “fusiform face area” (Puce et al., 1995
; Kanwisher et al., 1997
). This same region is not face-selective in the HFA group, nor is the typical right OFA region. Instead, face-selective activation in the HFA group is much more ventral and posterior and located in a region that is object-selective in the TD adolescents. Importantly, these FG face-selective regions in the HFA group in both hemispheres were more posterior and ventral than the range of FFA coordinates reported in a meta-analysis of a wide range of face processing neuroimaging studies in typical adults (Joseph, 2001
). However, the TD adolescent FFA ROIs were well within the range of coordinates reported in the same meta-analysis.
We recognize that the results derived from these group-defined analyses are not completely independent and unbiased; therefore, we recommend exercising caution in their interpretation. However, for the following reasons, we are re-assured that the pattern of results derived from these analyses is, in fact, real and bolsters our overall interpretation of group differences in face-related cortex. First, the pattern of results from the group-defined ROI analyses is robust and consistent with the results from the independently defined ROI analyses. Second, we do not find group differences in all regions of cortex where the ROI is defined by one or the other group (i.e. the group difference between TD and HFA individuals is only present in the face-related ROIs but in not in either the TD- or HFA-defined LO ROIs, or the TD-defined PPA ROIs). This result provides us with some confidence (although not totally foolproof on its own) that selecting the ROI from a single group and then using their timeseries necessarily leads to group differences. Third, the follow-up t-tests comparing the beta weights for visual categories (e.g. faces versus objects) within each ROI in the non-defined group (e.g., the HFA group when evaluating TD-defined ROIs), are completely independent of the timeseries data used to define the ROIs. As a result, we argue that our interpretations of differences in the location of face-selective activation are not likely to be related to artifactual differences, biases in the analyses, or in the extent of motion in the scanner since the groups were matched on motion parameters.
Our finding that adolescents with autism use object-related regions (as defined by the TD group) of the ventral visual pathway when processing faces is consistent with two previous studies of adults with autism (Schultz et al., 2000
; Humphreys et al., 2008
) and supports the hypothesis that perceptual processing of faces in autism may be more like perceptual processing of common objects in TD individuals. This hypothesis provides a specific explanation for the etiology of face-processing deficits in autism, namely that such deficits result from atypical perceptual processing more generally. Several hypotheses have been advanced to account for the differences in perceptual processing in autism with some researchers providing evidence for enhanced processing of local features (Mottron et al., 2006
) and others for reduced processing of global or holistic information (Behrmann et al., 2006b
; Happé and Frith, 2006
). On the basis of a more fundamental perceptual difficulty, individuals with autism may be limited in the ability to develop expertise with any class of visual objects that are perceptually homogenous, like faces (Behrmann et al., 2006a
,b
). By some accounts, fine-grained discrimination and representation of the configural properties of these stimuli is required to differentiate similar objects (Diamond and Carey, 1986
). A failure to encode the face in a typical fashion may hamper the ability of individuals with autism to master visuoperceptual expertise that is critical for face recognition. Such a failure would then require that they rely more on featural than on configural analyses. Several behavioral findings support the notion that children and adolescents with autism lack visual perceptual expertise for faces (Joseph and Tanaka, 2003
; Lahaie et al., 2006
), as well as other perceptually homogenous novel objects (Ashworth et al., 2008
; Scherf et al., 2008a
), and rely more on featural than configural analyses of these stimuli.
This last finding is particularly important for constraining interpretations about the aberrant functional topography of face-related activation in autism. Although the OFA, FFA, and STS are critical regions in the broader face-processing network, there is evidence that these regions are not exclusive to face processing. For example, in TD adults, the acquisition of visuoperceptual expertise for classes of perceptually homogenous novel objects (e.g., Greebles) and objects of expertise (e.g., cars, birds) produces increased activation in the FFA region (e.g., Gauthier et al., 1999
). This finding has lead to the hypothesis that the FFA does not mediate face perception per se, but, rather, serves the computational process of individuating perceptually similar exemplars within a visual class (Tar and Gauthier, 2000
). Based on these behavioral and neuroimaging findings, a plausible interpretation of the atypical face-related activation in autism is that it reflects a generalized deficit in visuoperceptual processing that interferes with the ability to develop expert configural processing. This deficit adversely impacts recognition of any within-class perceptually homogenous objects, and especially faces (Behrmann et al., 2006a
; Scherf et al., 2008a
).
Individual Variability in Face-Selective Activation in HFA Adolescents
We also evaluated whether and how individual variability in the location, size, and magnitude of selectivity contributes to alterations in the functional topography of the ventral visual pathway in autism. We addressed this question by investigating group differences in the profile of activation in the set of individually defined ROIs. Importantly, as in the group level analyses, there were no group differences in the size, location, or magnitude of category-selective activation in either the right or left LO or PPA. The only differences emerged in the analyses of the face-related ROIs.
In the autism group, face-related activation at the standard statistical threshold was smaller and more ventral and posterior than in the TD individuals. At a more lenient threshold, this group-defined face-selective activation extended to become larger and more dorsal and anterior, hinting at a shadow of the typical profile of activation. Surprisingly, 70% of the HFA individuals exhibited category-selective activation for faces in the right FG and 100% did so in the right OFA. In both regions, activation was generally weaker but was equally face-selective and of comparable size as the regions defined in the TD individuals. However, as was also revealed in the group-defined ROI analyses, the key difference between the TD and HFA groups was the location of the individually defined face-related ROIs. In fact, there was more spatial variability among HFA individuals in the locus of the individually defined face-selective regions than in TD individuals. These results indicate that in early adolescence, there is some degree of consistency in face-related activation in the right FG and OFA in autism, but the specific locus of activation within these regions is largely variable across individuals.
Note that the relatively greater individual variability in the location of face-selective activation in the HFA individuals is not likely to be related to more variability in brain volume among these participants. Although we did not analyze the structural images for morphometric differences, we are confident that any such differences were minimized by yolking the groups on IQ (see Stanfield et al., 2008
) and by normalizing the brain volumes. Furthermore, any such potential differences in brain volume did not affect the location of the place- or object-related activation across the groups. Unless there is evidence of selective abnormalities in the morphology of the lateral (and not medial) FG bilaterally, it is difficult to argue that differences in brain volume selectively influenced the location of face-selective activation.
This lack of consistency in the location of face-selective activation across HFA participants is likely a root cause for the findings of hypoactivation in the group average maps (Figure 1
B). Our results provide clear evidence that individual variability in the location of face-selective activation is a primary mechanism of the hypoactivation observed at the group level. The finding that abnormal individual variability in the location of functional activation contributes to reduced or abnormal recruitment of cortical circuits in autism has also been reported in the context of both simple finger tapping (Müller et al., 2001
) and more complex visuomotor learning paradigms (Müller et al., 2003
). In more related domains, there are reports that adults with autism exhibit idiosyncratic patterns of activation during face perception (Pierce et al., 2001
) and when watching a popular audio-visual movie (Hasson et al., 2009
). For example, Pierce and colleagues reported that in every autistic adult tested, faces maximally activated “aberrant and individual-specific neural sites” (with only one adult exhibiting maximal activation to faces in the FG). They interpreted these findings to suggest that individuals with autism “see” faces utilizing different neural systems than do typical individuals. Although our findings of atypical individual variability in the locus of activation of face-related regions are generally consistent with these previous studies, our results of comparable place- and object-related activation across HFA and TD adolescents suggest that this variability is not a general property of brain function in autism. Also, our findings that 70% of HFA adolescents exhibited face-selective activation within the FG that was of comparable extent and magnitude of category selectivity indicate that there may be more consistency than previously thought in the neural circuitry utilized to perceive faces in some individuals with autism.
We also note that a significant proportion of HFA participants did not have identifiable FG face-selective activation, particularly in the left hemisphere, suggesting that the hypoactivation of face-related cortex observed in the group level map may also be driven by an inability for some individuals with autism to develop populations of neurons that are relatively selective for faces. Of note, for those HFA participants who do evince face-selective activation in FG, it is of equal volume and selectivity as the same regions identified in the TD individuals.
This marked individual variability in the number of individuals with identifiable face-selective activation and in the location of such activation in the HFA participants leads to natural questions about whether and how demographic measures can predict such variability. Such predictability could have substantial implications for identifying individuals who might benefit from a behavioral intervention designed to improve face processing and/or more general visuoperceptual processing, such as configural processing. Unfortunately, neither symptom severity, as measured by subcomponents of the ADOS, nor IQ measures, predicted which of the HFA individuals demonstrated face-related activation in the FG, OFA, or STS. For example, the individual with the largest combined ADOS score (19), where the higher the score the more severe the autism characteristics, exhibited the largest volume of face-selective activation in the FG that largely overlapped with the TD group-defined FFA region. In contrast, the HFA participant with the lowest combined ADOS score (11) exhibited one of the smallest volumes of face-selective activation in the FG, which failed to overlap with the TD group-defined right FFA region.
Although we could not identify a relation between symptom severity and the profile of face-related activation in this study, caution should be used in interpreting these null results. The ADOS is a standard diagnostic tool in autism research and its goal is to provide standardized contexts in which to observe the social-communicative behavior of individuals across the life span in order to aid in the diagnosis of autism. As stated in the ADOS manual, “For this reason, it may not be a good measure of response to treatment or developmental gains especially in later modules (that are administered to adolescents and adults)” (Lord et al., 1994
). Future work including a more specific measure of symptom severity and/or a broader range of levels of functioning within the spectrum (PDD, Asperger’s, higher, and lower functioning individuals with autism) could reveal a more systematic relation between symptom severity and the degree of alteration to face-related activation.
Also, we used a passive viewing paradigm and did not employ a behavioral measure that could be used for evaluating potential atypicalities in brain-behavior correspondences in these adolescents with autism. Future studies investigating the relation between face-processing behavior and alterations in the functional organization of the ventral visual pathway in autism will be critical. Unfortunately, this has proven to be a difficult endeavor even in TD populations and very few studies have been able to report developmental changes in such brain-behavior correspondences (for review see Scherf et al., 2009
). Relating atypical developmental changes in face-processing behavior and functional brain organization in autism may require (1) the use of fine-grained tests of face-processing behavior that are sensitive enough to observe differences through adolescence, when face-related activation continues to change in TD individuals (e.g., Scherf et al., 2007
), and (2) an investigation of face-related regions beyond the “core” ventral visual regions to include regions in the extended face-processing network, including the amygdala, insula, anterior temporal lobe, and medial prefrontal regions (Gobbini and Haxby, 2007
).
Mechanisms of Altered Functional Topography for Face-Related Activation
We have emphasized the contribution of variability in the number of individuals with identifiable face-selective activation and in the location of such activation as factors contributing to the classic pattern of hypoactivation in face-related cortex in autism. Note that this interpretation highlights our finding that there is a subset of high-functioning adolescents with autism who do show face-selective activation in the FG, albeit in a traditionally object-related region. For these individuals, the magnitude of face selectivity is comparable to that observed in TD individuals as is the volume of these regions. This pattern of results is quite similar to those observed in younger TD children (ages 5–8 years), in whom activation in place and object areas is adult-like even in early childhood, whereas the development of the face-related regions (FFA, OFA, STS) is much more protracted, becoming more selective and responsive to faces with age, but not reaching adult-like activation until adolescence (Golarai et al., 2007
; Scherf et al., 2007
). In these same studies, approximately 80–85% of the children have identifiable face-selective activation in the FG, although the locus of such activation is quite variable and not centered on the FFA. One rather obvious possibility then, is that visual category-selective cortex in autism may reflect an early plateau in development, rather than deviance, with the category selectivity resembling that of younger TD children (for similar argument see Humphreys et al., 2008
).
Alternatively, a number of authors propose abnormalities of neural connectivity in autism (Frith, 2003
; Belmonte et al., 2004
; Courchesne and Pierce, 2005a
,b
; Rippon et al., 2007
), specifically under-connectivity between different functional regions (long-range) and over-connectivity at a more local level (short-range) (Markram et al., 2007
). Abnormalities in neural connectivity specifically related to the FG and other regions in the broad face-processing network (e.g., amygdala, STS, posterior cingulate) have been identified anatomically in post-mortem studies (Van Kooten et al., 2008
) and functionally in neuroimaging studies of adults with autism (Kleinhans et al., 2008
). Along with previous authors (e.g. Johnson et al., 2002
), we speculate that the longer a particular function takes to mature, the greater the cascading effects of differences in the development of neurons and synapses. This may explain how differences in face-related cortex are much more pronounced in autism than are those affecting the earlier maturing place- or object-related cortices. The refinement in selectivity of later-developing cortex may be impeded as a result of over-connectivity at a local level, giving rise to a face-processing system prone to crosstalk and noise, resulting in reduced functional specificity (see Rippon et al., 2007
). This framework would also predict that greater TD/autism group differences would be evident in other, later-developing brain functions. For example, we would expect to find greater differences on tasks that engage secondary and tertiary visual cortex compared to those relying on primary visual cortices (Hasson et al., 2009
). These predictions are also consistent with findings of greater divergence between the groups on tasks tapping frontal functions (e.g., Takarae et al., 2007
).
Alternative Explanations
An alternative hypothesis for the face-processing deficits in autism is that decreased motivation to attend to social stimuli limits the ability to gain expertise in face processing (Dawson et al., 2002
; Grelotti et al., 2002
). In support of this hypothesis, several groups have reported that individuals with autism spend less time looking at the eye region of faces (Klin et al., 2002
; Spezio et al., 2007
; Adolphs et al., 2008
), and one study suggests that this atypical fixation pattern may be related to aberrant activation in the FG (Dalton et al., 2005
). Based on these findings, one possible interpretation of the hypoactivation in face-related regions in our study is that the adolescents with autism were simply not looking at the faces, and therefore, were paying less attention to the faces. We did not collect eye-tracking data in this experiment and so cannot evaluate definitively this alternative explanation; however, it should be noted that the relation between purported atypicalities in the locus of fixations during face processing and cortical activation patterns in children with autism is controversial (see Boraston and Blakemore, 2007
). For example, one study of young adolescents with autism found no differences from TD controls in fixation patterns when observing facial expressions, despite finding impressive differences in the patterns of neural activation under these same conditions (Dapretto et al., 2006
). Also, at least one study in adults with autism found similar patterns of face-related hypoactivation in the FG when participants were required to fixate a central dot overlaid on the center of each stimulus and under free viewing conditions (Humphreys et al., 2008
). Additional studies evaluating the relation between fixation, BOLD activation patterns, and behavioral measures of attention to faces, particularly in a developmental context, are clearly necessary.
A second alternative explanation for our pattern of results is related to our use of unfamiliar faces in the movie task. Although this is consistent with the majority of previous studies reporting atypical face-related activation in autism, some evidence suggests that more normal patterns of activation can be observed, particularly in the FG, in children and adults with autism when they view personally familiar faces (Pierce et al., 2004
; Pierce and Redcay, 2008
). Importantly, in these studies the authors reported that both the magnitude of signal change in response to faces and the number of voxels exhibiting this signal change was more comparable to controls in the FG during observation of familiar faces. They did not investigate differences in the locus of such activation across the groups. Consistent with these previous findings, when we identified the face-selective activation in the FG for each participant, we also observed comparable volume and magnitude of face selectivity in the FG in the TD and HFA groups (see Figures 3
C–H), even under conditions in which they observed unfamiliar faces. Our central finding is that fewer of the HFA adolescents exhibit face-selective activation and when they do, there is more variability in the locus of such activation within the FG (and OFA). One way to reconcile these results is to suggest that, as in TD individuals, familiarity can modulate face-related activation in the FG in individuals with autism; however, given the differences in the locus of such activation, even familiar faces may be processed more like objects. Future behavioral and neuoimaging studies evaluating the computational mechanisms that individuals with autism use to process both familiar and unfamiliar faces are essential to evaluate this interpretation.
Conclusions
This is the first study to map the functional topography of category-selective activation for faces, places, and objects in the ventral visual pathway in high-functioning adolescents with autism and to evaluate whether and how individual variability in the location, size, and magnitude of selectivity contribute to such alterations in the topography. Our findings indicate that there is not a generalized disruption in the development of the functional topography of the entire ventral visual pathway in autism. Instead, our results suggest that the functional topography of face-related cortex is selectively disrupted in autism and that this alteration is already present in early adolescence, an important stage of cortical specialization for faces in TD adolescents. In particular, for HFA individuals who do exhibit face-selective activation, it tends to be located in traditionally object-related regions, which supports the hypothesis that the perceptual processing of faces in autism may be more like perceptual processing of common objects in TD individuals. Such alterations could result from direct pathology to regions within the face-processing network, like the FG (Van Kooten et al., 2008
), and/or to the structural and functional connections between such regions. Also, alterations in the visual experiences that individuals with autism have with faces as a result of social aversion and/or excessive focus on features may configure these regions in the face-processing network atypically.
The authors declare that the research was conducted in the absence of any commercial or financial relationships that could be construed as a potential conflict of interest.
The Supplementary Material for this article can be found online at http://www.frontiersin.org/neuroscience/humanneuroscience/paper/10.3389/fnhum.2010.00026/
The research reported in this paper was funded by NIH grants NICHD/NIDCD PO1/U19 HD35469-07 to Marlene Behrmann and Beatriz Luna, which is part of the NICHD/NIDCD Collaborative Programs of Excellence in Autism (PI: Nancy Minshew), NSF grant #SBE-0542013 to the Temporal Dynamics of Learning Center, an NSF Science of Learning Center, T32 HD049354 to Ron Dahl and Robert Noll, as well as a post-doctoral fellowship from the National Alliance for Autism Research to K. Suzanne Scherf and Beatriz Luna. We thank Dr. Kwan-Jin Jung, Scott Kurdilla, and Debbie Vizlay from the Brain Imaging Research Center at the McGowan Center in Pittsburgh for their help in acquiring the imaging data, Cecily Becker, Lauren Lorenzi, and Teresa Teslovich for assistance testing participants, and the staff at the Collaborative Program of Excellence in Autism for help recruiting participants. Finally, we are grateful to our study families for making this research possible.
Belmonte, M., Cook, E. H., Jr., Anderson, G., Rubenstein, J., Greenough, W., Beckel-Mitchener, A., Courchesne, E., Boulanger, L. M., Powell, S. B., Levitt, P. R., Perry, E. K., Jiang, Y. H., DeLorey, T. M., and Tierney, E. (2004). Autism as a disorder of neural information processing: directions for research and targets for therapy. Mol. Psychiatry 9, 646–663.
Critchley, H. D., Daly, E. M., Bullmore, E. T., Williams, S. C., Van Amelsvoort, T., Robertson, D. M., Rowe, A., Phillips, M., McAlonan, G., Howlin, P., and Murphy, D. G. (2000). The functional neuroanatomy of social behaviour: changes in cerebral blood flow when people with autistic disorder process facial expressions. Brain 123 (Pt 11), 2203–2212.
Deeley, Q., Daly, E. M., Surguladze, S., Page, L., Toal, F., Robertson, D., Curran, S., Giampietro, V., Seal, M., Brammer, M. J., Andrew, C., Murphy, K., Phillips, M. L., and Murphy, D. G. M. (2007). An event-related functional magnetic resonance imaging study of facial emotion processing in Asperger Syndrome. Biol. Psychiatry 62, 207–217.
Scherf, K. S., Behrmann, M., and Humphreys, K. (2009). Acquisition and disruption of category-specificity in the ventral visual stream: The case of late developing and vulnerable face-related cortex. In S. J. Dickinson, A. Leonardis, B. Schiele, and M. J. Tarr (eds.). Object Categorization: Computer and Human Vision Perspectives. Cambridge: Cambridge University Press.
Schultz, R. T., Gauthier, I., Klin, A., Fulbright, R. K., Anderson, A. W., Volkmar, F., Skudlarski, P., Lacadie, C., Cohen, D. J., and Gore, J. C. (2000). Abnormal ventral temporal cortical activity during face discrimination among individuals with autism and Asperger syndrome. Arch. Gen. Psychiatry 57, 331–340.