Category-specific visual responses: an intracranial study comparing gamma, beta, alpha, and ERP response selectivity
- 1 INSERM U82, Dynamique Cérébrale et Cognition, Centre Hospitalier Le Vinatier, Lyon, France
- 2 Department of Epilepsy, Grenoble University Hospital (Centre Hospital du Grenoble), Grenoble, France
- 3 Department of Functional Neurology and Epileptology, Neurological Hospital, Bron, France
- 4 Institute for Children and Adolescents with Epilepsy IDEE, University Hospitals of Lyon, Lyon, France
The specificity of neural responses to visual objects is a major topic in visual neuroscience. In humans, functional magnetic resonance imaging (fMRI) studies have identified several regions of the occipital and temporal lobe that appear specific to faces, letter strings, scenes, or tools. Direct electrophysiological recordings in the visual cortical areas of epileptic patients have largely confirmed this modular organization, using either single-neuron peri-stimulus time-histogram or intracerebral event-related potentials (iERP). In parallel, a new research stream has emerged using high-frequency gamma-band activity (50–150 Hz) (GBR) and low-frequency alpha/beta activity (8–24 Hz) (ABR) to map functional networks in humans. An obvious question is now whether the functional organization of the visual cortex revealed by fMRI, ERP, GBR, and ABR coincide. We used direct intracerebral recordings in 18 epileptic patients to directly compare GBR, ABR, and ERP elicited by the presentation of seven major visual object categories (faces, scenes, houses, consonants, pseudowords, tools, and animals), in relation to previous fMRI studies. Remarkably both GBR and iERP showed strong category-specificity that was in many cases sufficient to infer stimulus object category from the neural response at single-trial level. However, we also found a strong discrepancy between the selectivity of GBR, ABR, and ERP with less than 10% of spatial overlap between sites eliciting the same category-specificity. Overall, we found that selective neural responses to visual objects were broadly distributed in the brain with a prominent spatial cluster located in the posterior temporal cortex. Moreover, the different neural markers (GBR, ABR, and iERP) that elicit selectivity toward specific visual object categories present little spatial overlap suggesting that the information content of each marker can uniquely characterize high-level visual information in the brain.
Introduction
Several studies have shown that high-frequency neuronal activity in the brain is a marker of active information processing involved in perception, action, and cognition (Engel et al., 2001; Fell et al., 2001; Fries et al., 2001; Varela et al., 2001; Pesaran et al., 2002; Fries, 2009). Electroencephalography (EEG) and magnetoencephalography (MEG) have enabled observation of the behavior of this spectral signature in a variety of tasks, revealing its functional role not only in local neuronal processing but also in large-scale neuronal communication (Bauer et al., 2006). Other studies have turned to the high spatial resolution and high signal-to-noise ratio of intracerebral electroencephalography (iEEG) to describe fine amplitude modulations invisible to scalp EEG/MEG while preserving millisecond time resolution (Voytek et al., 2010). Recordings with these in cerebro implanted electrodes in humans have shown local broadband gamma activity modulated by visual perception (Lachaux et al., 2005; Canolty et al., 2006; Jacobs and Kahana, 2009), language processing (Canolty et al., 2006; Sahin et al., 2006; Jung et al., 2008; Lachaux et al., 2008; Mainy et al., 2008; Sahin et al., 2009), attention (Lachaux et al., 2005; Tallon-Baudry et al., 2005), and different types of memory (Sederberg et al., 2006, 2007; van Vugt et al., 2010).
Although spectral analysis has become a well-established technique in cognitive neuroscience, an important debate remains regarding whether low-amplitude GBR is more informative than high-amplitude intracerebral evoked response potentials (iERPs) as a neural marker of underlying mental processes. Reports often focus on either GBR or iERPs (Allison et al., 1994b; Halgren et al., 1994a,b, 1995a,b; McCarthy et al., 1999; Puce et al., 1999; Privman et al., 2007; Jacobs and Kahana, 2009) to reveal the high specificity of response to stimulation conditions, but recent studies combined both markers (Fisch et al., 2009; Engell and McCarthy, 2010). These markers show different stimulus response characteristics in terms of amplitude and latency, and it is still unknown whether they systematically reflect the same information processing. To investigate this issue, we decided to study the GBR patterns in relation to iERP and ABR amplitude in an experimental context requiring a high level of neuronal response specificity: visual object recognition.
Here we set out to examine neuronal activity involved in discriminating visual objects. We examined iEEG recordings from 18 epileptic patients while engaged in a simple visual detection task using stimuli from different visual object categories. We analyzed the data with the goal of revealing the multiple degrees of specialization elicited by different neuronal markers within a few hundred milliseconds after stimulus onset. The cerebral region that concentrated most specific neural responses was the posterior temporal cortex. Interestingly the GBR, iERP, and ABR that were selective for the same visual object showed very little spatial overlap across all recording sites.
Materials and Methods
Patients and Recordings
Eighteen patients (9 women, group mean age 35 ± 10 years) with drug-resistant partial epilepsy and candidates for surgery were considered in this study and recruited from Neurological Hospitals in Grenoble and Lyon. Because the location of the epileptic focus could not be identified using non-invasive methods; the patients underwent intracerebral recordings by means of stereotactically implanted multi-lead electrodes (SEEG). Recording sites were selected solely according to clinical indications, with no reference to the current experiment; however, enrolled patients were primarily those with electrodes sampling visual areas. All the patients had previously given their informed consent to participate in this experiment and research recordings were approved by the National French Science Ethical Committee (CPPRB). All had normal or corrected to normal vision.
Electrode Implantation
Eleven to 15 semi-rigid electrodes were implanted per patient in cortical areas which varied depending on the suspected origin of their seizures. Each electrode had a diameter of 0.8 mm and was comprised of 10 or 15 contacts of 2 mm length, depending on the target region, 1.5 mm apart (Dixi, Besançon, France). Therefore, various medial and lateral cortical areas were evaluated for each patient (see Figure 1B), the coordinates of each electrode contact with their stereotactic scheme was measured (in the Talairach coordinate system). The coordinates were used to anatomically localize the contacts using the proportional atlas of Talairach and Tournoux (Talairach et al., 1993), after a linear scale adjustment to correct size differences between the patient’s brain and the Talairach model. These locations were further confirmed by overlaying a post-implantation CT scan (showing contact sites) with a pre-implantation structural MRI with VOXIMR (IVS Solutions, Chemnitz, Germany), allowing direct visualization of contact sites relative to brain anatomy.
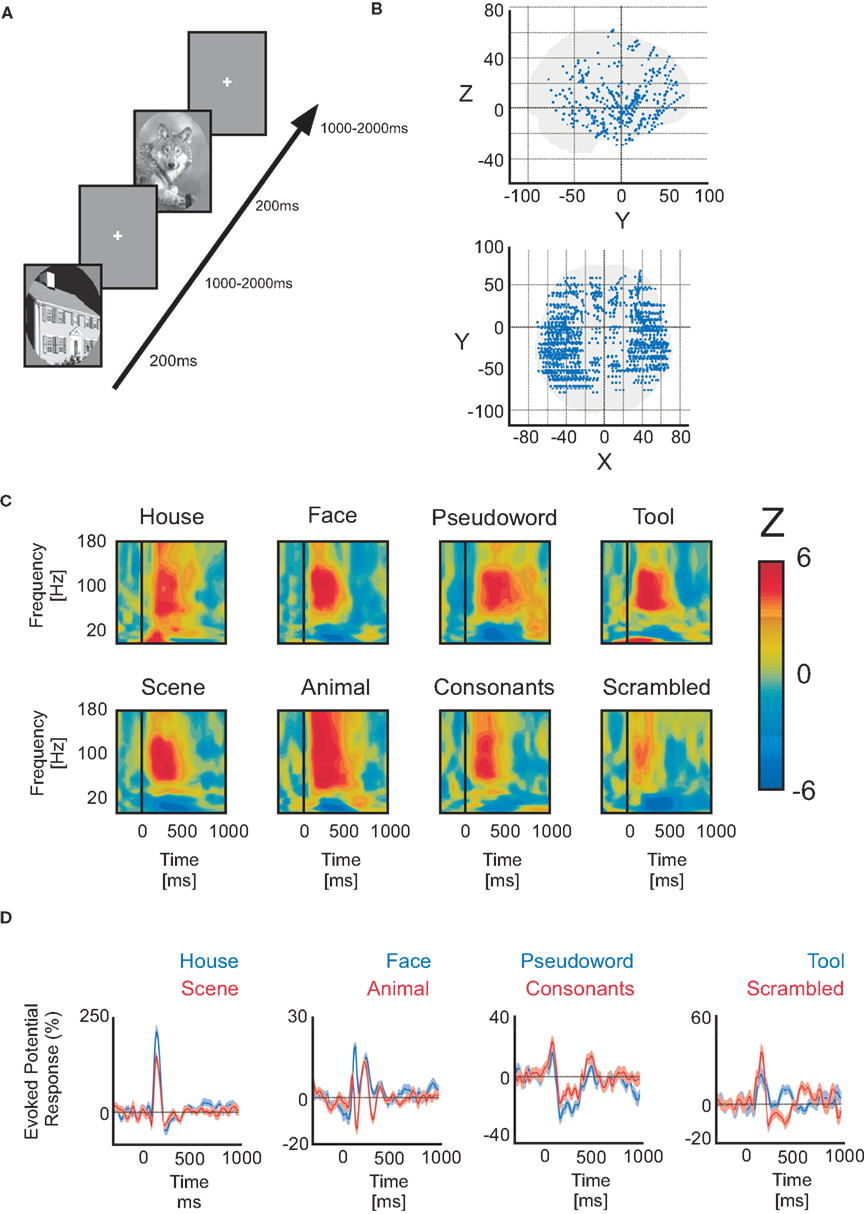
Figure 1. Paradigm, electrode implantation and neural responses. (A) Example of the visual detection paradigm. (B) Lateral view of general implantation scheme of all 18 patients. Red arrows indicate xyz axis reference. (C) Time–frequency representations of Wilcoxon Z-values (post-stimulus power vs baseline power) elicited by different complex stimuli. The values are masked by a significance threshold (not corrected). Each example pertains to a different patient. All gamma-band band responses within the 50–150 Hz interval are pronounced, while the low-frequency power interval is negative (vs baseline). (D) Examples of intracerebral evoked response potentials to different visual categories from different patients (paired conditions).
These patients voluntarily participated in a series of short experiments to identify local functional responses at the recorded sites. The results presented here were obtained from a test exploring visual recognition. All data were recorded using approximately 120 implanted depth electrode contacts per patient with a sampling rate of 512 Hz. Data were obtained in a total of 1760 recording sites, distributed as follows: temporal cortex (962 recording sites), frontal cortex (515), dorsal visual pathway, which includes parietal and motor cortices (220) and occipital cortex (42) (Figure 1B).
Stimuli and Task
The visual recognition task lasted about 15 min. Patients were instructed to press a button each time a picture of a fruit appeared on screen (visual oddball paradigm). Non-target stimuli consisted of pictures of objects of eight possible categories: houses, faces, animals, scenes, tools, pseudowords, consonant strings, and scrambled images. The latter were not included in this analysis. All stimuli had the same average luminance except for pseudowords and consonant strings which consisted of a white letter string on a black background. All categories were presented within an oval aperture (Figure 1A). Stimuli were presented for a duration of 200 ms every 1000–1200 ms in series of 5 pictures interleaved by 3-s pause periods during which patients could freely blink. Patients reported the detection of a target through a right-hand button press and were given feedback of their performance after each report. A 2-s delay was placed after each button press before presenting the follow-up stimulus in order to avoid mixing signals related to motor action with signals from stimulus presentation. Importantly, we only analyzed here the neural responses to all non-target stimuli that did not elicit a button press. Each visual category was presented 50 times during the whole experiment.
Data Analysis
The iERP estimated for all subjects was obtained by filtering the raw data between 1 and 25 Hz. We further analyzed the spectral signatures of the data in two steps. First we calculated the full time–frequency representations of the data to estimate the frequency intervals of interest that would then be used to estimate subsequently the instantaneous spectral response amplitude with the Hilbert Transform (Le Van Quyen et al., 2001; Bruns, 2004). To quantify signal power modulations across time and frequency we used standard time–frequency (TF) wavelet decomposition (Tallon-Baudry et al., 1996). The signal s(t) is convoluted with a complex Morlet wavelet w(t, f0), which has Gaussian shape in time (σt) and frequency (σf) around a central frequency f0 and defined by:  with σf = 1/2πσt and a normalization factor
  Throughout this study we used a wavelet family with cycle number set to 7 (i.e., f0/σf = 7). The square norm of the convolution results in a time-varying representation of spectral power, given by: P(t, f0) = |w(t, f0) × s(t)|2.
The investigated frequency range was 1–200 Hz. To estimate a gamma frequency range of interest of neural responses, we applied a matched-pairs Wilcoxon test for each time–frequency bin comparing power estimates after stimulus presentation to averaged baseline power between −300 and −100 ms. We used this interval to estimate instantaneous amplitude of the signal with the Hilbert transform, according to the following procedure: we band-pass filtered the entire recording dataset in consecutive non-overlapping frequency bands (for instance, 50–60, 60–70,…, 140–150 Hz to cover the gamma-band 50–150 Hz), and for each band we extracted the amplitude envelope using an Hilbert transform (thus applied to the entire recording session). For each frequency band, the envelope was then divided by its mean value over the entire recording session, channel-wise, and multiplied by 100 to be expressed in percentage of the mean amplitude of the session. This provided 10 amplitude time-series between 50 and 150 Hz (one for each frequency band) which were averaged together to obtain a single 10 min time-series of gamma amplitude (the duration of the task). Finally this amplitude was then epoched into data segments centered on each stimulus, between −300 and +1000 ms relative to stimulus onset, and then averaged together for each stimulus category.
For the alpha-beta band (ABR), the same procedure was applied to the 8–24 Hz interval (4 Hz wide consecutive frequency intervals). After all time–frequency analyses and data filtering operations, we downsampled all time-series to increase statistical power for comparisons applying corrections for multiple comparisons when testing for a difference between conditions through time. The final data precision was maintained at 16 ms per sample.
To display all responses within MNI brain space as in Figure 3, we plotted averaged activities from all categories for each electrode within a sphere volume. The color of each node codes for the averaged activity over all recording sites located within a 1.5 cm distance from the node. This allowed active electrode responses to appear on medial and lateral cortices of a topographical representation of the MNI brain. This visualization of the data served as a preliminary step to identify regions of interest or more precise analyses at the individual level.
Statistical Evaluations of Neural Response Specificity
Previous studies in animals and humans analyzed neuronal activity to complex visual stimuli and developed statistical strategies to demonstrate response specificity to visual stimuli of neuronal spiking, evoked potentials, and gamma-band activity (Allison et al., 1993, 1994a; Quiroga et al., 2005; Fisch et al., 2009; Liu et al., 2009). Our procedure was similar to the ones applied in these studies, i.e., identifying response specificity by comparing all neural responses to each other through a non-parametrical ANOVA-like statistical analysis (Friedman test), corrected for multiple comparisons when implying repeated tests over multidimensional data sets.
All statistical testing was done on instantaneous amplitude time-series obtained with the Hilbert transform. To statistically evaluate the specificity of neural markers, we proceeded in two steps. A first assessment of neural response from the instantaneous amplitude was obtained through the comparison of post-stimulus activity to its average baseline power level with a Wilcoxon signed-rank test for matched-pairs. We applied this test separately for each category across all recording sites and all time points between 0 and 1000 ms post-stimulus for each patient individually. All p-values were corrected for multiple comparisons across multiple dimensions (recording sites × time) with a false discovery rate (FDR) procedure (Genovese et al., 2002). After we evaluated this physiological response, we focused on functional responses of these recording sites. To assess this, we compared all categories that showed a prior physiological response (at least two categories) with a non-parametrical Friedman test followed by a Tukey–Kramer post hoc test to identify which categories differentiated. Prior to applying the post hoc test to each time bin, we corrected for multiple comparisons across time samples and number of recording sites. A subset of recording sites showed a physiological response to stimuli from a single category. These responses are also grouped within the final pool of recording sites eliciting functional responses.
For each recording site, we defined a response index (RI), defined as the number of visual object categories that elicited a response at that particular site (between 1 and 7). We also quantified the degree of selectivity of each electrode by estimating a selectivity index (SI). SI is derived from the number (N) of categories that elicit a response statistically different (as quantified by a Friedman statistical test) from all the other categories that also elicit a response. That is, N is the sum of the number of categories that are distinguishable at that recording site. To this value we added the RI of that recording site and then divided by the RI (SI = (N + RI)/RI). For example, for an electrode responding to three visual categories A, B, and C, SI is 1, if all categories are indistinguishable (SI = (0 + 0 + 0 + 3)/3) and SI is 2.3 if one of the three categories is different from the two other categories (SI = (2 + 1 + 1 + 3)/3). A is different from B and C (2), B is different from A (1), C is different from A (1) and there are three categories A, B, C (3); hence (2 + 1 + 1 + 3)/3.
To assess an index of neural marker readout we used a Receiver Operating Characteristics (ROC) binary classifier from signal detection theory (Green and Swets, 1966). This test has been used successfully in animal studies to operate single-neuron response readout (Britten et al., 1992; Romo et al., 2002) and to interpret response specificity in humans of iERP (Liu et al., 2009) as well as in non-invasive MEG spectral power signals (Donner et al., 2009; Wyart and Tallon-Baudry, 2009). We estimated the neural marker readout index, area under the curve (AUC) index for each time bin between condition pairs at single recording sites. The sites that we chose for illustrative purposes were chosen based on signal strength and pertained mainly to the temporal cluster that we identified in this study. To estimate statistical significance of this index we created a surrogate data set by permuting single-trial amplitude values from two conditions prior to estimating the index. We repeated this procedure 999 times to create a surrogate set and compared it to the original index. If the index was either bigger or smaller than the respective maximal and minimal value of the surrogate set then we considered the index to be significantly different at p < 0.001.
To quantify the degree of spatial clustering of neural responses within subgroups of individual recording sites we computed two values: the average position (AP) of the Talairach coordinates (simple gravity center of the cluster) and the average distance (AD), defined as the average distance separating pairs of recording sites within the subgroup. These values were statistically evaluated by comparing the AP and AD values with a randomly generated surrogate set of values (1000 permutations) as previously described for the readout index. We evaluated spatial clustering of responding recording sites in the left and right hemisphere separately.
Results
For each electrode and visual object category, time–frequency analyses revealed broadband high-frequency power increases between 50 and 150 Hz (Figure 1C). Low-frequency band power decreases were observed between 8 and 24 Hz. Figure 1C illustrates a few examples of GBR to different visual object categories from temporal lobe recording sites in different patients. These frequency ranges coincide with previous intracerebral observations by our group (Lachaux et al., 2005; Jerbi et al., 2009; Jung et al., 2010) and others (Crone et al., 2006) and will be used in this study to evaluate systematically spectral responses across recording sites within different patients. This initial identification of prominent spectral components allowed us to concentrate on a single spectral data estimate per time sample and per frequency band (alpha/beta and gamma) by calculating the Hilbert transform amplitude profile. All subsequent spectral activity referring to the GBR or the ABR are based on these instantaneous amplitude time-series.
Neurophysiological Responses
About 83.9% of all recording sites (1760) did not show statistically significant responses to stimulus presentation (Figure 2A). As shown in Figure 2A, among the remaining sites, 16.9% solely produced GBR, 2.7% only iERP, and 14.5% only ABR. Around 18.1% produced iERP and GBR, 19.1% produced GBR and ABR. In 16.3% of cases, all three markers coincided on the same electrode. Interestingly, iERP responses were mainly present at recording sites that also showed a GBR with or without an ABR (see Figure 1D for examples of iERP).
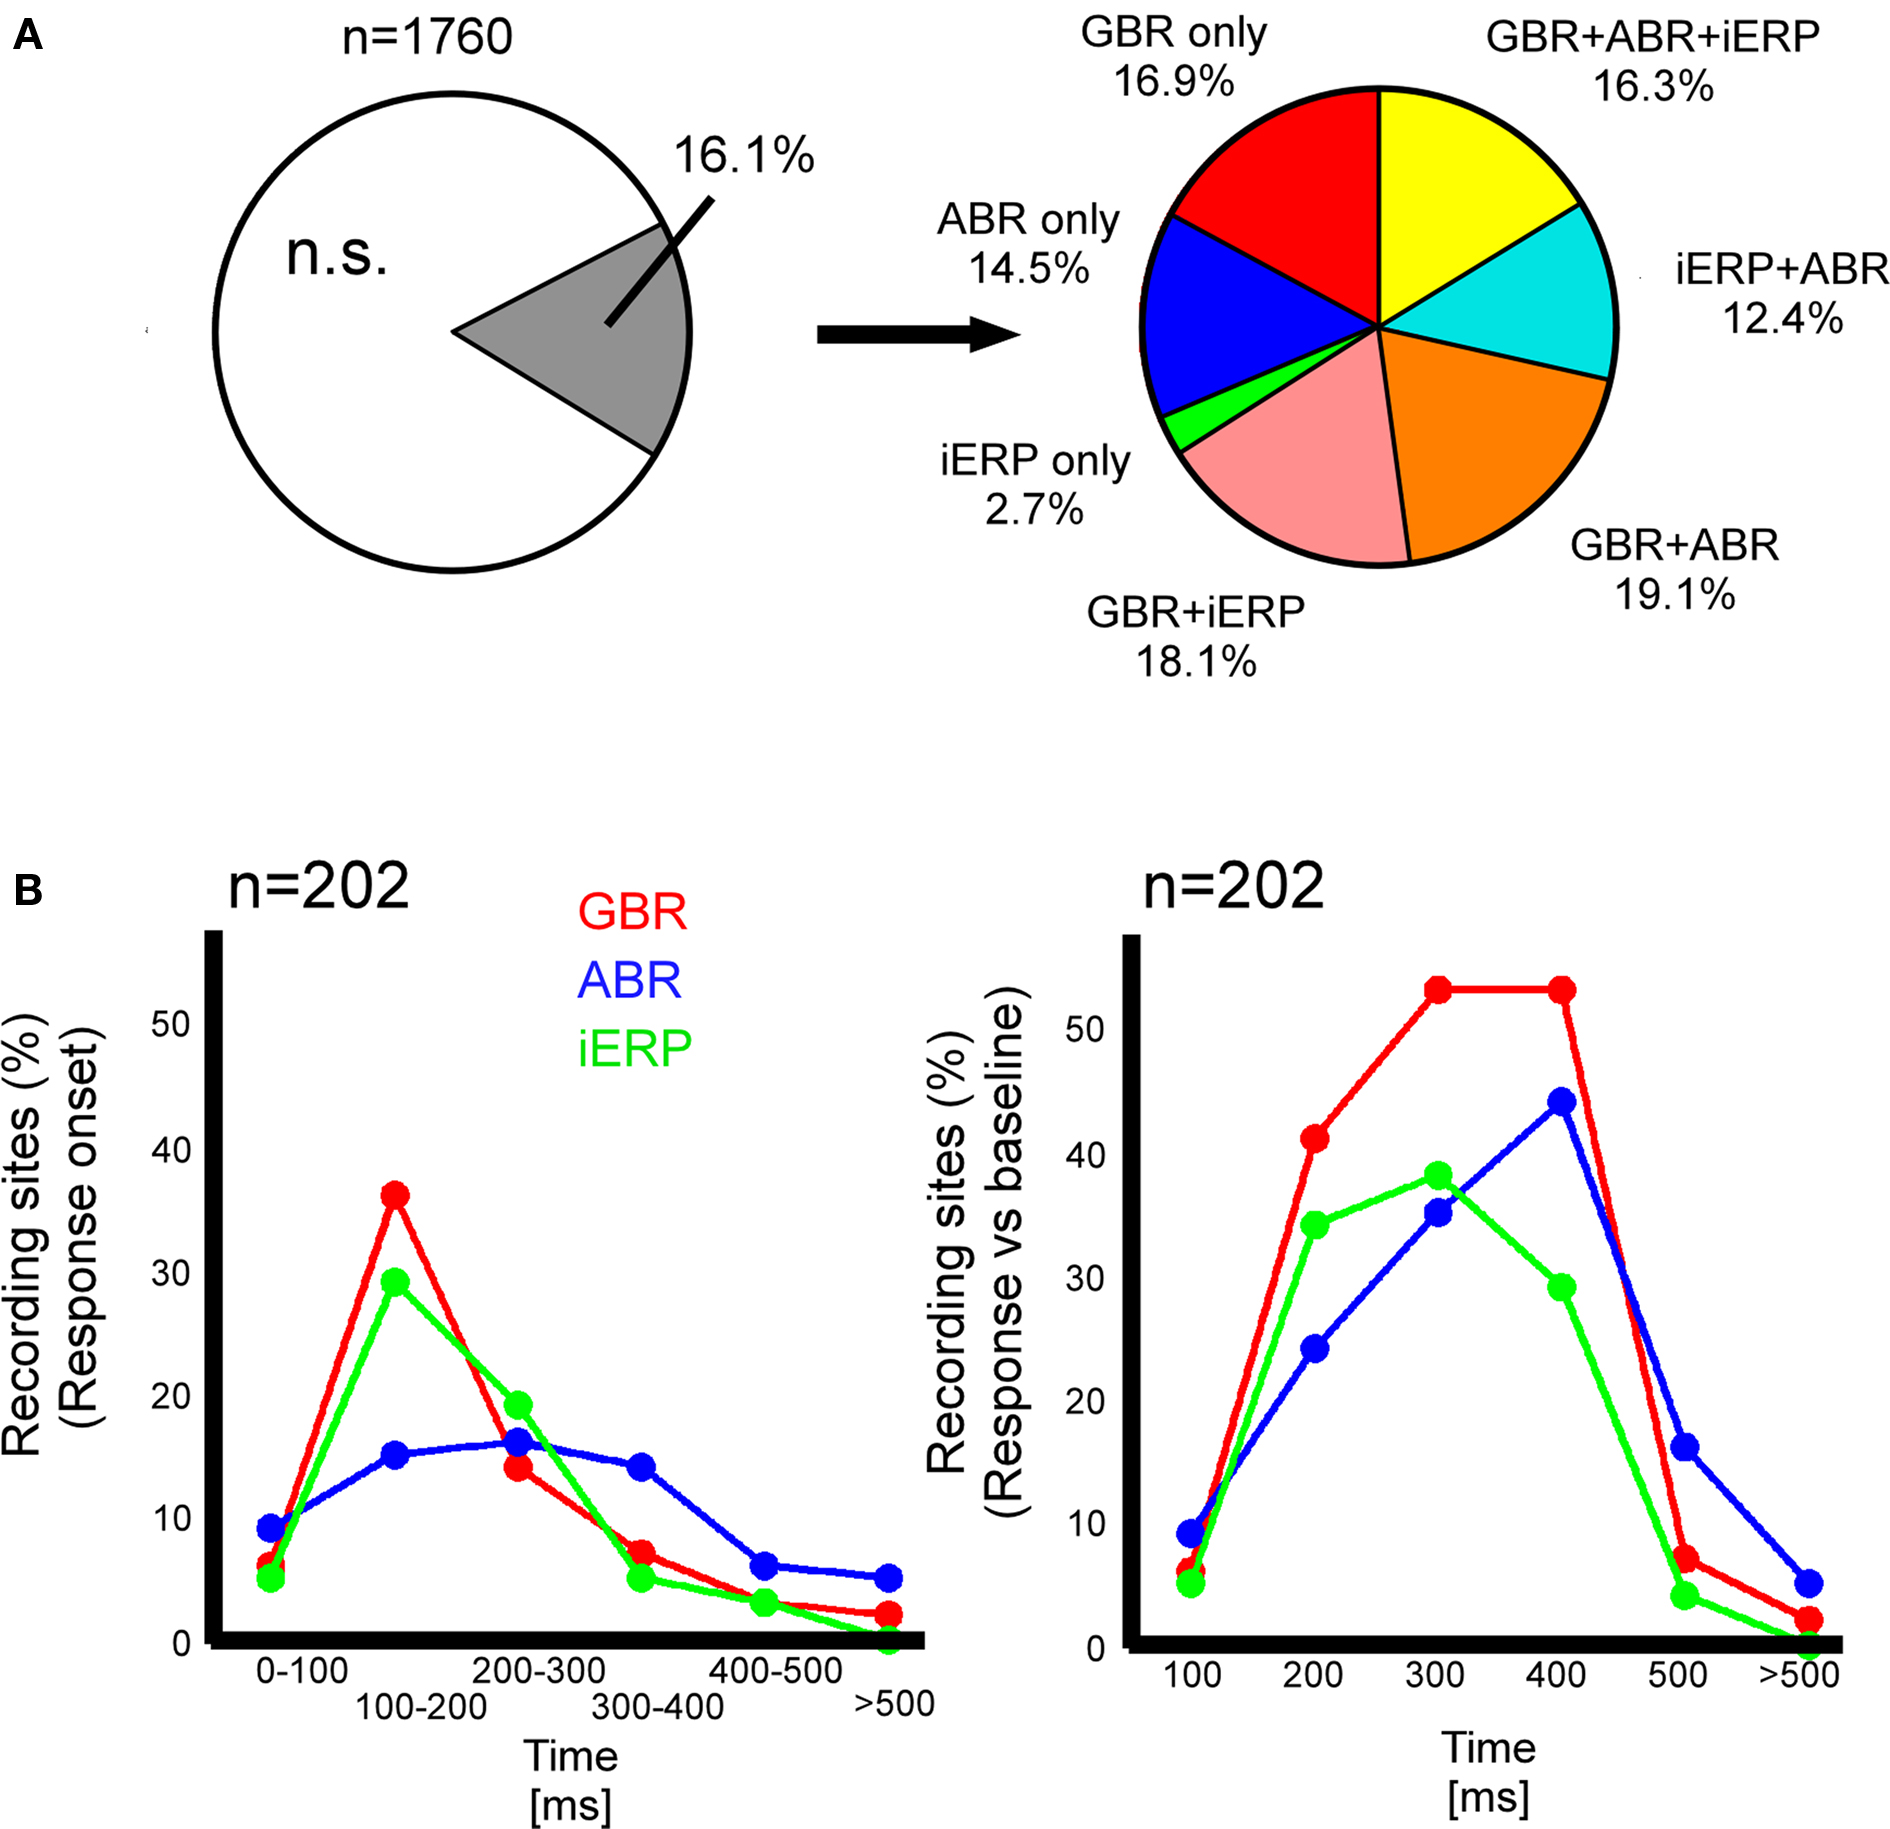
Figure 2. Neural responses type proportionality and neuronal activity dynamics in temporal cluster. (A) Left, proportion of recording sites that gave at least one response to a stimulus; right, proportion of gamma-band, iERP, and ABR within the total percentage of responsive recording sites. (B) Left, percent of recording sites in temporal cluster that start responding in different time-windows after stimulus presentation. Right, percent of recording sites in temporal cluster that are active between 0 and >500 ms.
We estimated a response index (RI) per electrode which indicated the number of visual object categories for which an electrode produced a statistically significant neurophysiological response. Figure 3A shows the spatial distribution of the RI for all recording sites with a RI from 1 to 7, for GBR, ABR, and iERP. We observe that recording sites responding to most visual object categories (RI 5–7) clustered within posterior temporal cortex for all three neural markers GBR, ABR, and iERP (left hemisphere: AP and AD p < 0.001; right hemisphere: AP p < 0.001, AD <0.001 for ABR only). Figure 3B bar-plot shows the number of responses to visual object categories per electrode elicited for each neural marker throughout all recording sites. Surprisingly, although the number of responding sites decreased with increasing RI overall, RI = 7 elicited more responses than RI = 3 for both GBR and ABR.
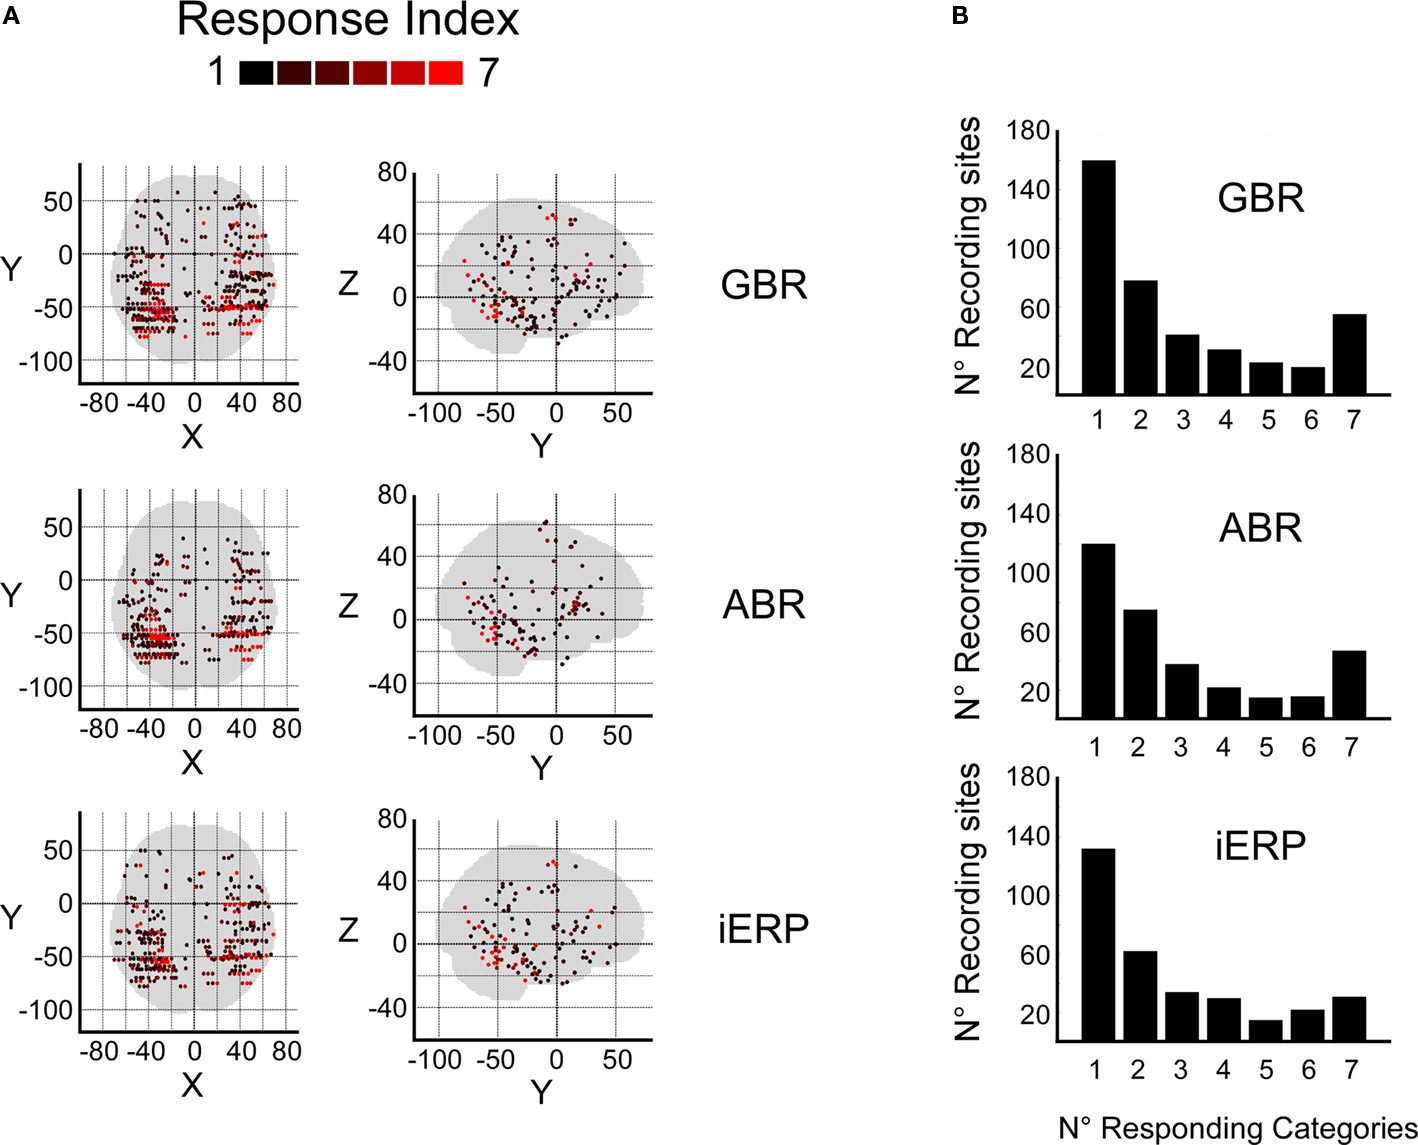
Figure 3. Response score spatial distributions and histograms. (A) Response index for GBR, ABR, and iERP are plotted according to their spatial location (Wilcoxon test, for all responses, p < 0.05). (B) Histograms show the number of electrode sites that elicit significant responses to visual stimuli.
We measured the time-course of neural activity for each neural marker at all recording sites within the posterior temporal cluster. GBR and iERP activated more recording sites than ABR in the cluster through time (Figure 2B). For both GBR and iERP the peak of activity onset (different from baseline level) emerged shortly after stimulus onset, i.e., within 100 and 200 ms (Figure 2A).
GBR dynamics across all patients were plotted on the MNI brain to obtain a global view (see Materials and Methods). Strongest GBR appeared most concentrated in posterior occipital-temporal cortex (medial and lateral cortices, including middle temporal gyrus, fusiform gyrus, middle occipital gyrus, and lateral occipital cortex) after 100 ms (Figure S1 in Supplementary Material) and increased in amplitude until 300 ms, declining in intensity after this latency. This allowed us to distinguish a limited spatial cluster covering medial and lateral cortices from left and right hemispheres. A smaller frontal cluster covering Brodmann areas 8 (frontal eye fields) and 6 also evolved in the same time-activation pattern, but we will only focus on the temporal cluster in this study.
Response Specificity at Single-Trial Level
In the temporal cluster, GBR, iERP, and ABR responded differently to visual object categories. Visual inspection of single-trial neural responses at individual recording sites revealed striking differences in sensitivity to visual categories between the different markers. To illustrate this response specificity to visual object category information in the gamma-band, Figure 4 and Figure S2 in Supplementary Material depict examples of single-trial responses at recording sites within the cluster. Each object category is represented by the amplitude time-course of 50 trials. We plotted the single-trial responses per category for GBR, ABR, and iERP at the same recording site in each example. Figure 4A shows a very specific GBR to faces in a fusiform gyrus, matched the localization of the fusiform face area (FFA) reported in another study (Grill-Spector et al., 2006) (Talairach coordinates: 41, −50, −8). All other object categories elicited very weak or no response. At this same electrode, a unique negative iERP to faces was observed, while all other object categories elicited a positive evoked response. Overall, ABR amplitude decreased in all visual object categories, with faces specifically inducing an earlier small amplitude. Figure 4B depicts responses measured in the fusiform face area in a second patient (Talairach coordinates: 42, −51, −16). Despite the location of this electrode, GBR was stronger and more specific to animals and tools, while only weak and occasional single-trial responses could be observed for faces, houses, and scenes. The GBR distinguished the response preference of several recording locations at the single-trial level across different patients (Figure S2 in Supplementary Material). Of note, the strongest GBR corresponded to iERP components in some cases, e.g., face stimuli (Figure 4A), but most examples show a local dissociation between these two neural markers.
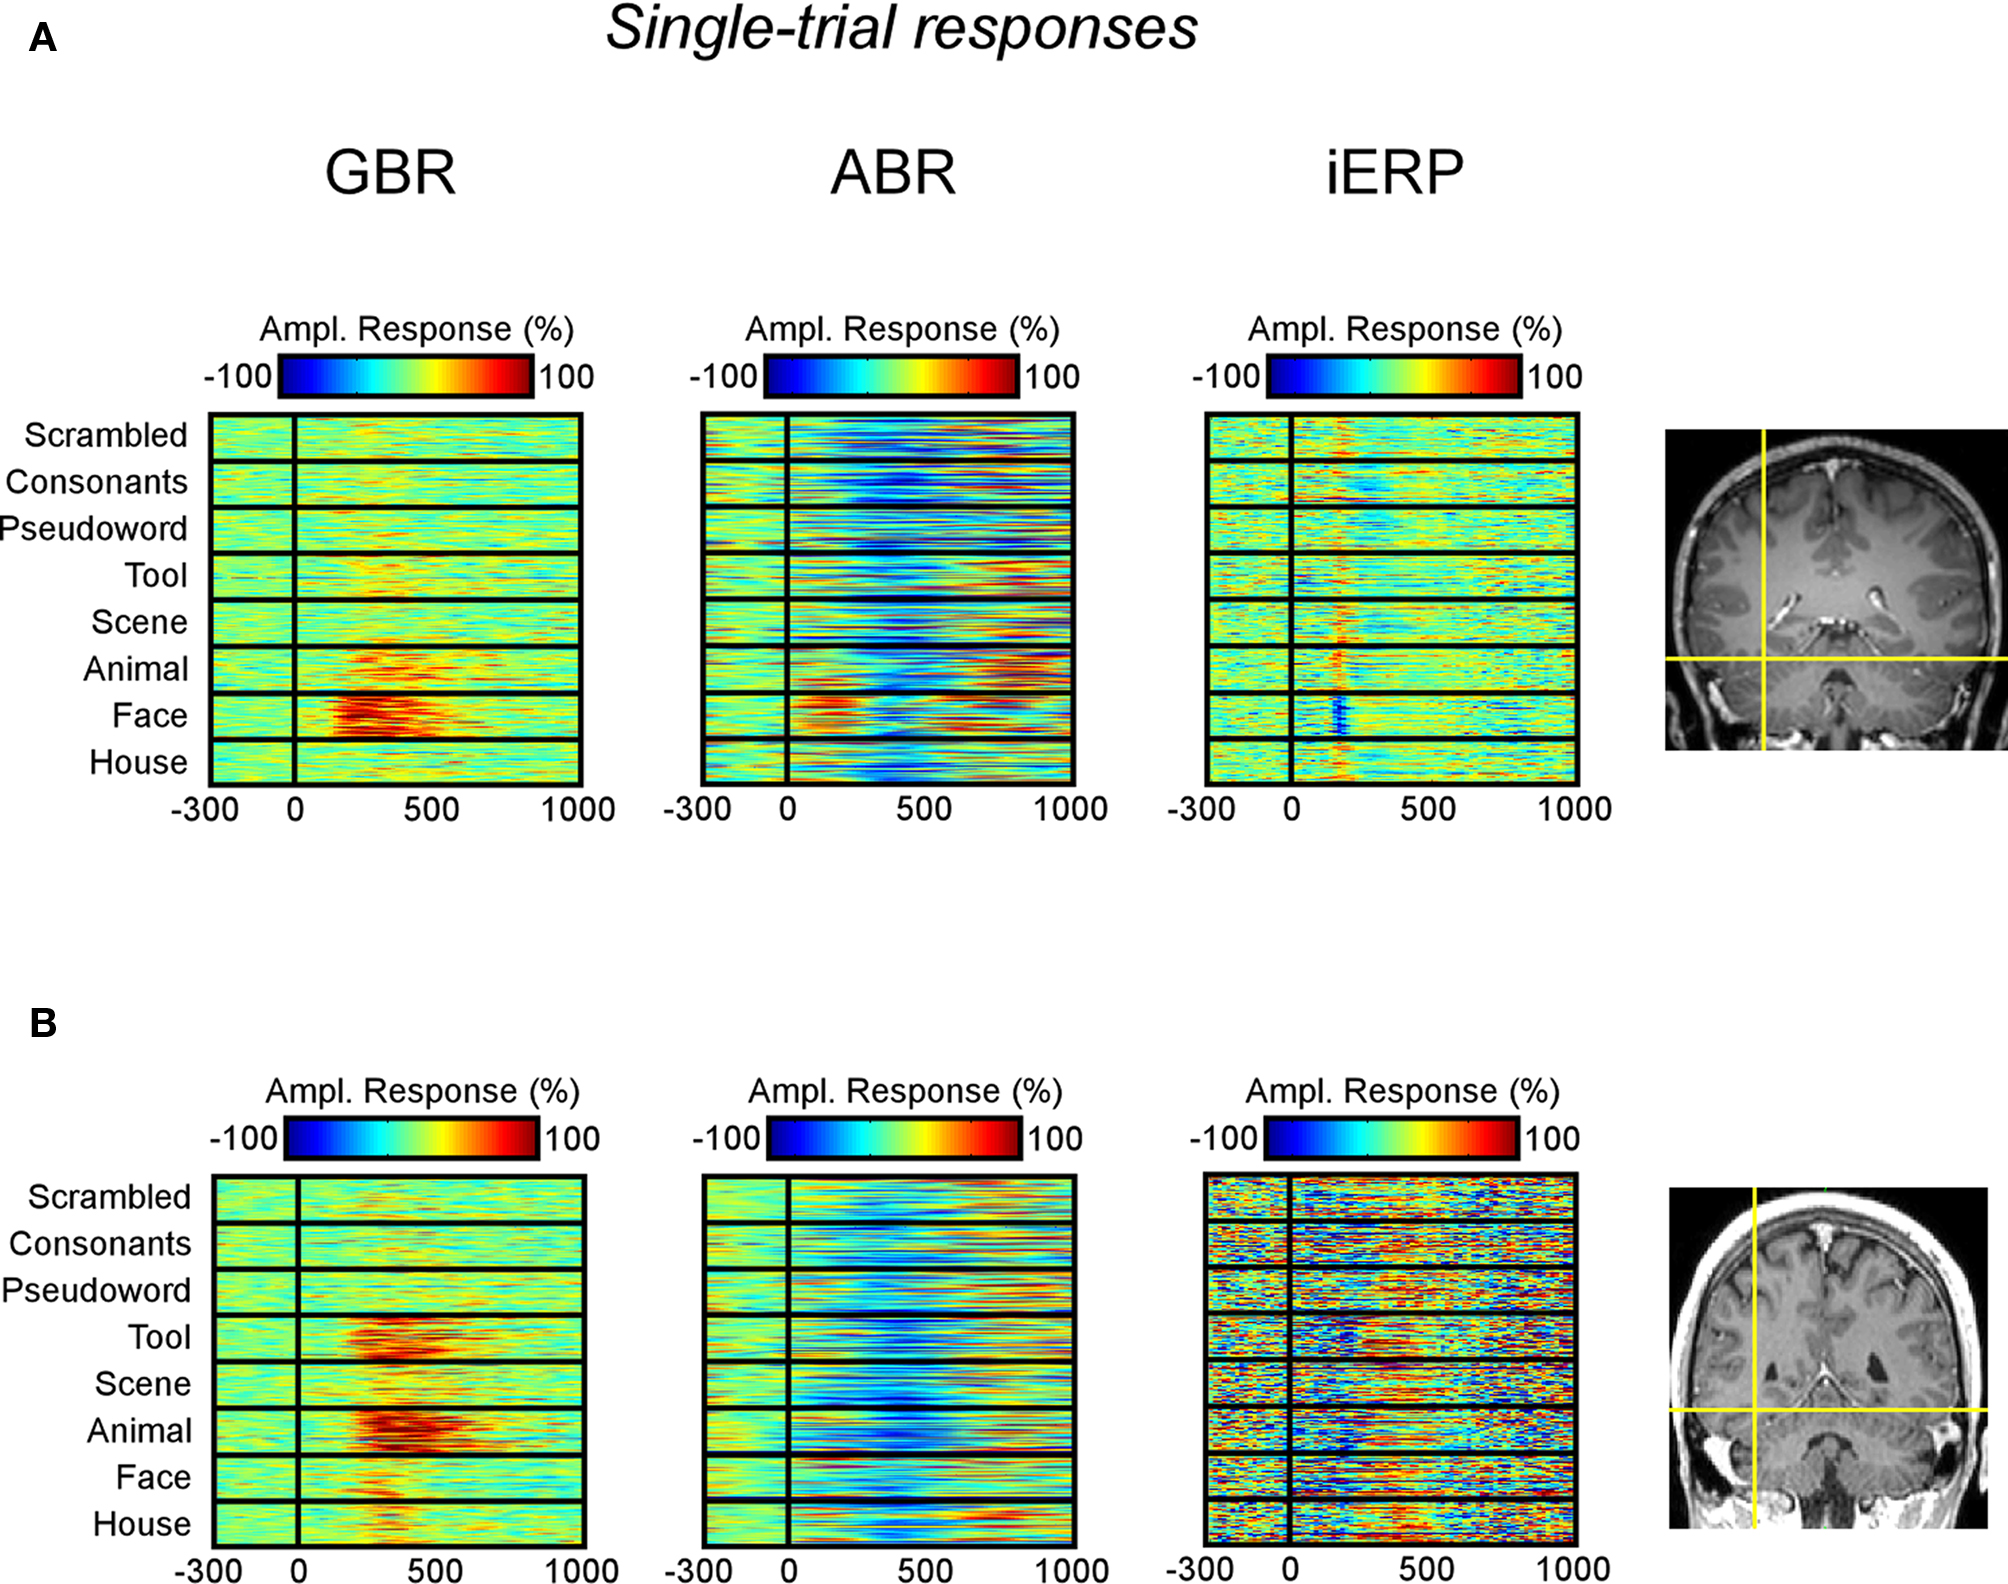
Figure 4. Examples of single-trial neural activity to visual categories in fusiform face area of two patients. (A) GBR, ABR band, and iERP responses are shown from left to right as percentage modulation with baseline level. The electrode (Talairach coordinates: 41, −50, −8) elicits a strong preference to face stimuli in the gamma-band as well as iERP. It does show very small GBR to other categories while the iERP is clear but undifferentiated to other stimuli. (B) Same display type as (A), the electrode (Talairach coordinates: 42, −51, −16) is more selective for tools and animals than for faces in the gamma-band. Note that most ABR responses are negative compared to baseline level. This observation is generalized across our recordings.
Figure 5 shows two examples of functional dissociations between GBR and iERP within the same object categories. In Figure S2A in Supplementary Material, GBR is present in most visual object categories, but is strongest for tools, while for iERP there is no clear single-trial component in any of these categories except for faces. A similar case is shown in Figure S2D in Supplementary Material where GBR is strong for scenes yet barely present for the corresponding iERP. Figure S5C in Supplementary Material shows that animals specifically elicit stronger gamma-band responses, while iERP responses are undifferentiated across all categories.
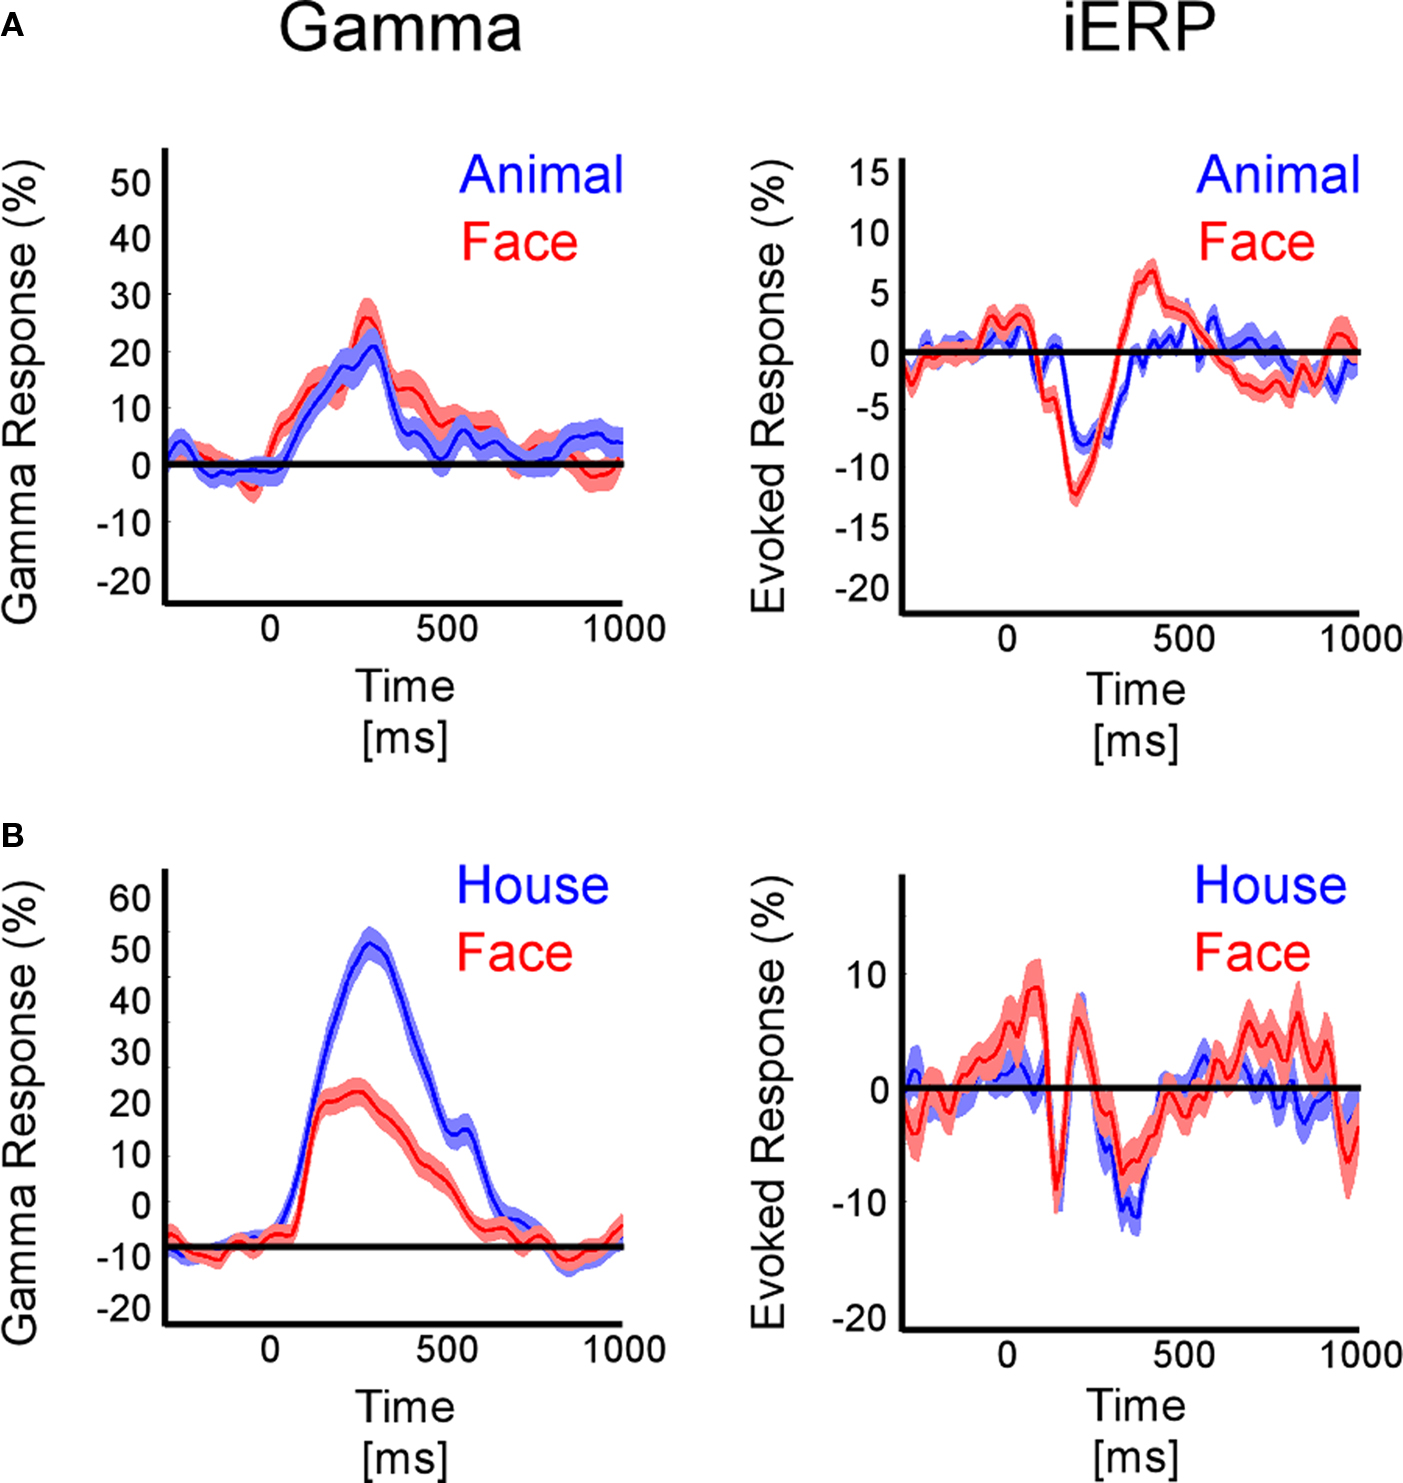
Figure 5. Local dissociations (temporal cortex) between GBR and iERP to represent category coding. (A) In one patient the iERP distinguishes faces from animals while GBR is the same for both type of stimuli. (B) In another patient GBR dissociates houses from faces, while iERP fails to do so. Shaded areas represent ±1 SEM
Spatial Distribution and Overlap of Selective Neural Responses
After illustrating specific GBR to visual objects at the single-trial level that strongly dissociate from other neural markers we now focus on the spatial distributions of these responses in this temporal cluster as well as the entire brain. To convey a global overview of the spatial distribution of selective responses to visual objects, we estimated a selectivity index (SI) for each recording site (see Materials and Methods). A high SI (>1) indicates that the neural response induced by various visual object categories are statistically different from one another significantly (Friedman test, p < 0.05). Figure 6 shows the spatial distribution of SI for GBR, ABR, and iERP. All recording sites which elicited a SI >1 for GBR, ABR, or iERP formed a statistically significant cluster within the posterior temporal cluster (for all neural markers, left and right hemisphere, AP and ADR: p < 0.001).
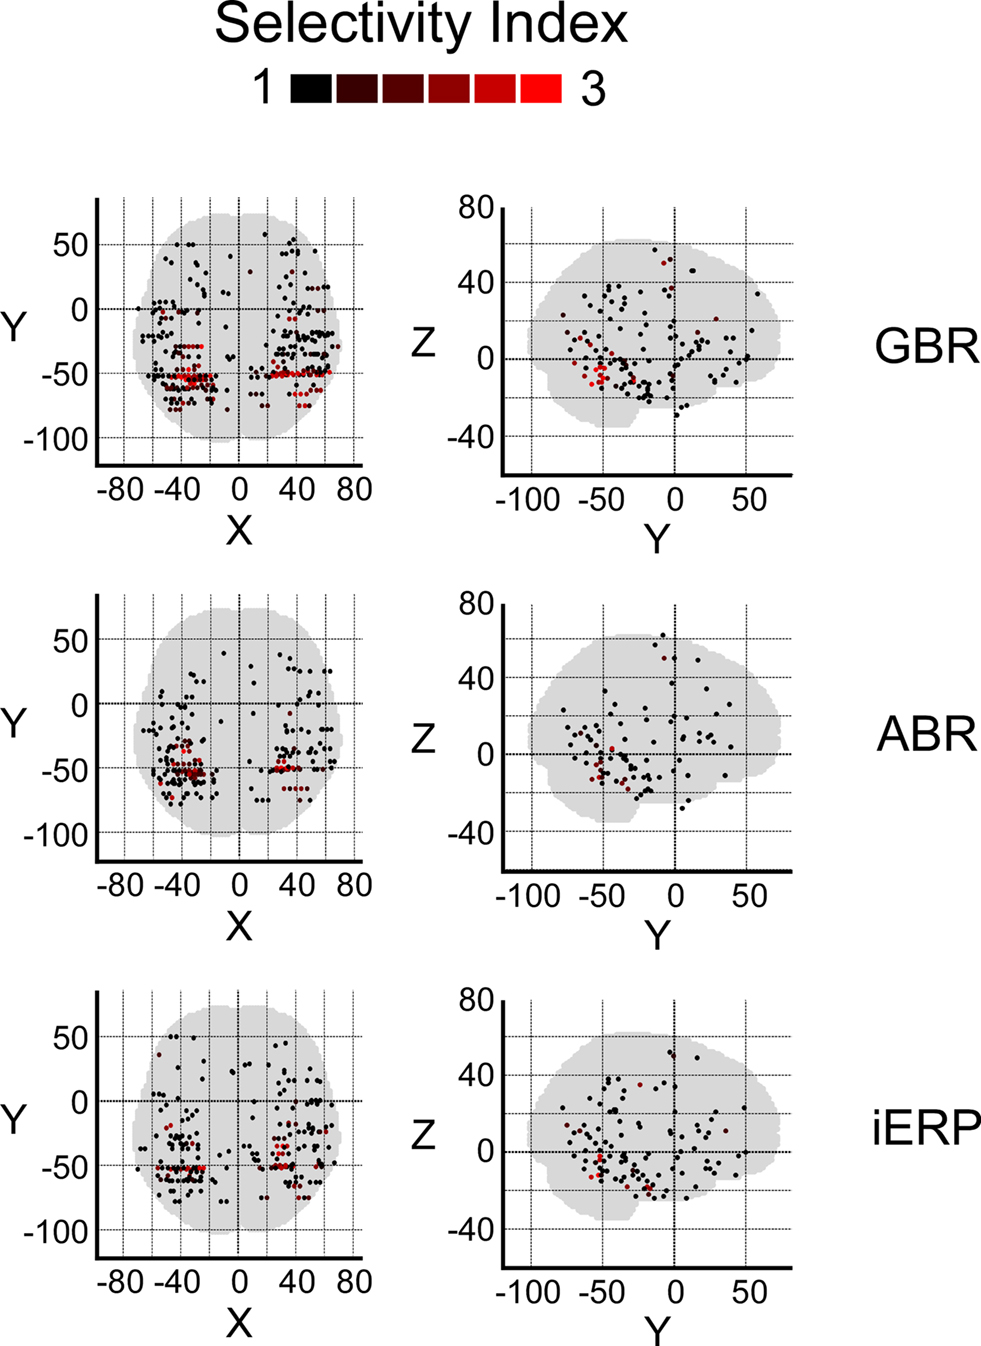
Figure 6. Spatial distribution of selectivity index for GBR, ABR, and iERP (Friedman test, for all responses: p < 0.05). Highest scores are clustered in posterior temporal cortex.
In order to measure the degree of overlap of response specificity between neural markers, we mapped all responses to categories that were significantly different from each other. The overlap was estimated as the proportion of responses at single recording sites showing the same difference between paired conditions. Percentage of overlap between neural markers was less than 6% in the temporal cluster and brain-wide. The spatial response specificity overlap between gamma-GBR and iERP was 2.9% in the cluster and 3.8% brain-wide, between GBR and ABR 4.4% in the cluster and 5.4% brain-wide, and between ABR responses and iERP 1% in the cluster and 2.7% brain-wide. This very low spatial overlap is visible on the global spatial map of these specific responses (Figure 7 and Figures S3–S8 in Supplementary Material).
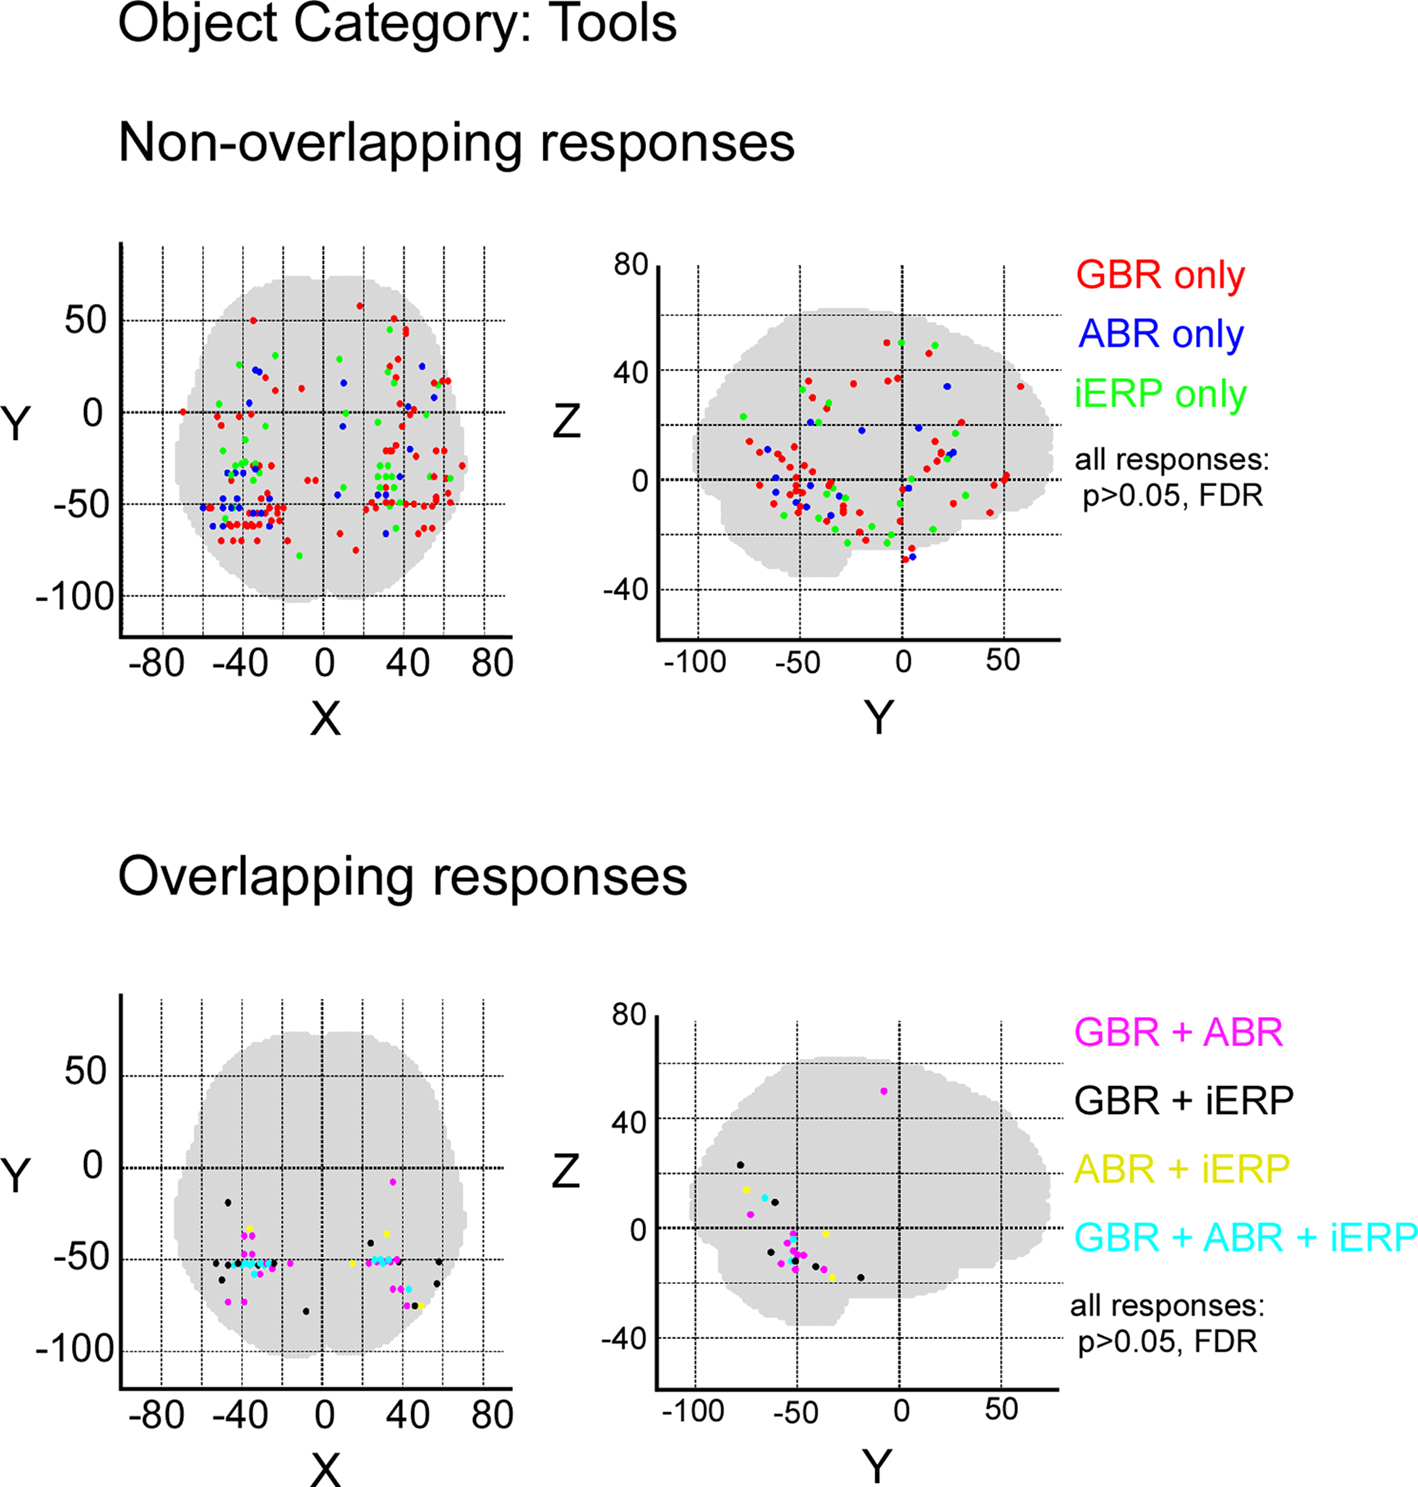
Figure 7. Spatial distribution of recording sites eliciting selective non-overlapping (upper) and overlapping (lower) responses between GBR, ABR, and iERP, for visual object category tools.
Although most specific responses group within the posterior temporal cluster (bilaterally), many specific responses were recorded from anterior temporal lobe and frontal cortices. No single anatomical region concentrated all specific responses to a single category. We did however locate stimulus preference within regions that described a preference for complex stimuli such as for example specific GBR to faces within the fusiform face area and selective responses to letter strings (pseudowords and consonants) in a region described by fMRI studies as the word-form area (Cohen et al., 2000) (Figure S9 in Supplementary Material). Moreover, unique GBR to pseudowords mapped mainly to recording sites within the left hemisphere, spread over the temporal lobe and within frontal Broca’s area (Figure S10 in Supplementary Material), implying the active involvement of regions specialized in word reading and processing.
High Fidelity Intracranial GBR
In the same line as previous studies that showed how neural responses can be evaluated regarding their capacity to accurately describe stimulation features or behavioral response value (Britten et al., 1992; Donner et al., 2007; Liu et al., 2009; Wyart and Tallon-Baudry, 2009), we examined whether the specific GBR and iERP responses were able to objectively distinguish visual object category information based on the amplitude level of neural signals. With a binary classification procedure based on signal detection theory (Green and Swets, 1974), we extracted for each time sample an index of signal strength (termed here AUC index) which was statistically compared to a surrogate data set (see Materials and Methods). In Figure 8 are shown various illustrative examples of AUC index curves for all three neural markers at different temporal recording sites chosen based on their signal strength and selectivity toward specific visual objects determined in previous analyses (Friedman test). Surrogate control data showed time curves all close to the 0.5 line, indicating that paired conditions were not separable based on objective readout of neural signal (data not shown). Figures 8A–D,F illustrate cases where the GBR were able to distinguish object category information from paired comparisons prior to 200 ms and even sometimes before 100 ms. In those cases, iERP elicited a significant separation between categories, later in time. Less frequently, ABR components showed the capacity to distinguish neural signals induced by different visual object categories. Figure 8E shows an example in which iERP elicited the strongest signal able to distinguish paired visual object categories, while GBR and ABR failed. Interestingly, in all cases in which both the GBR signal and the iERP were very selective with respect to category information content of paired stimuli, the duration of the gamma-band marker was longer than for iERP.
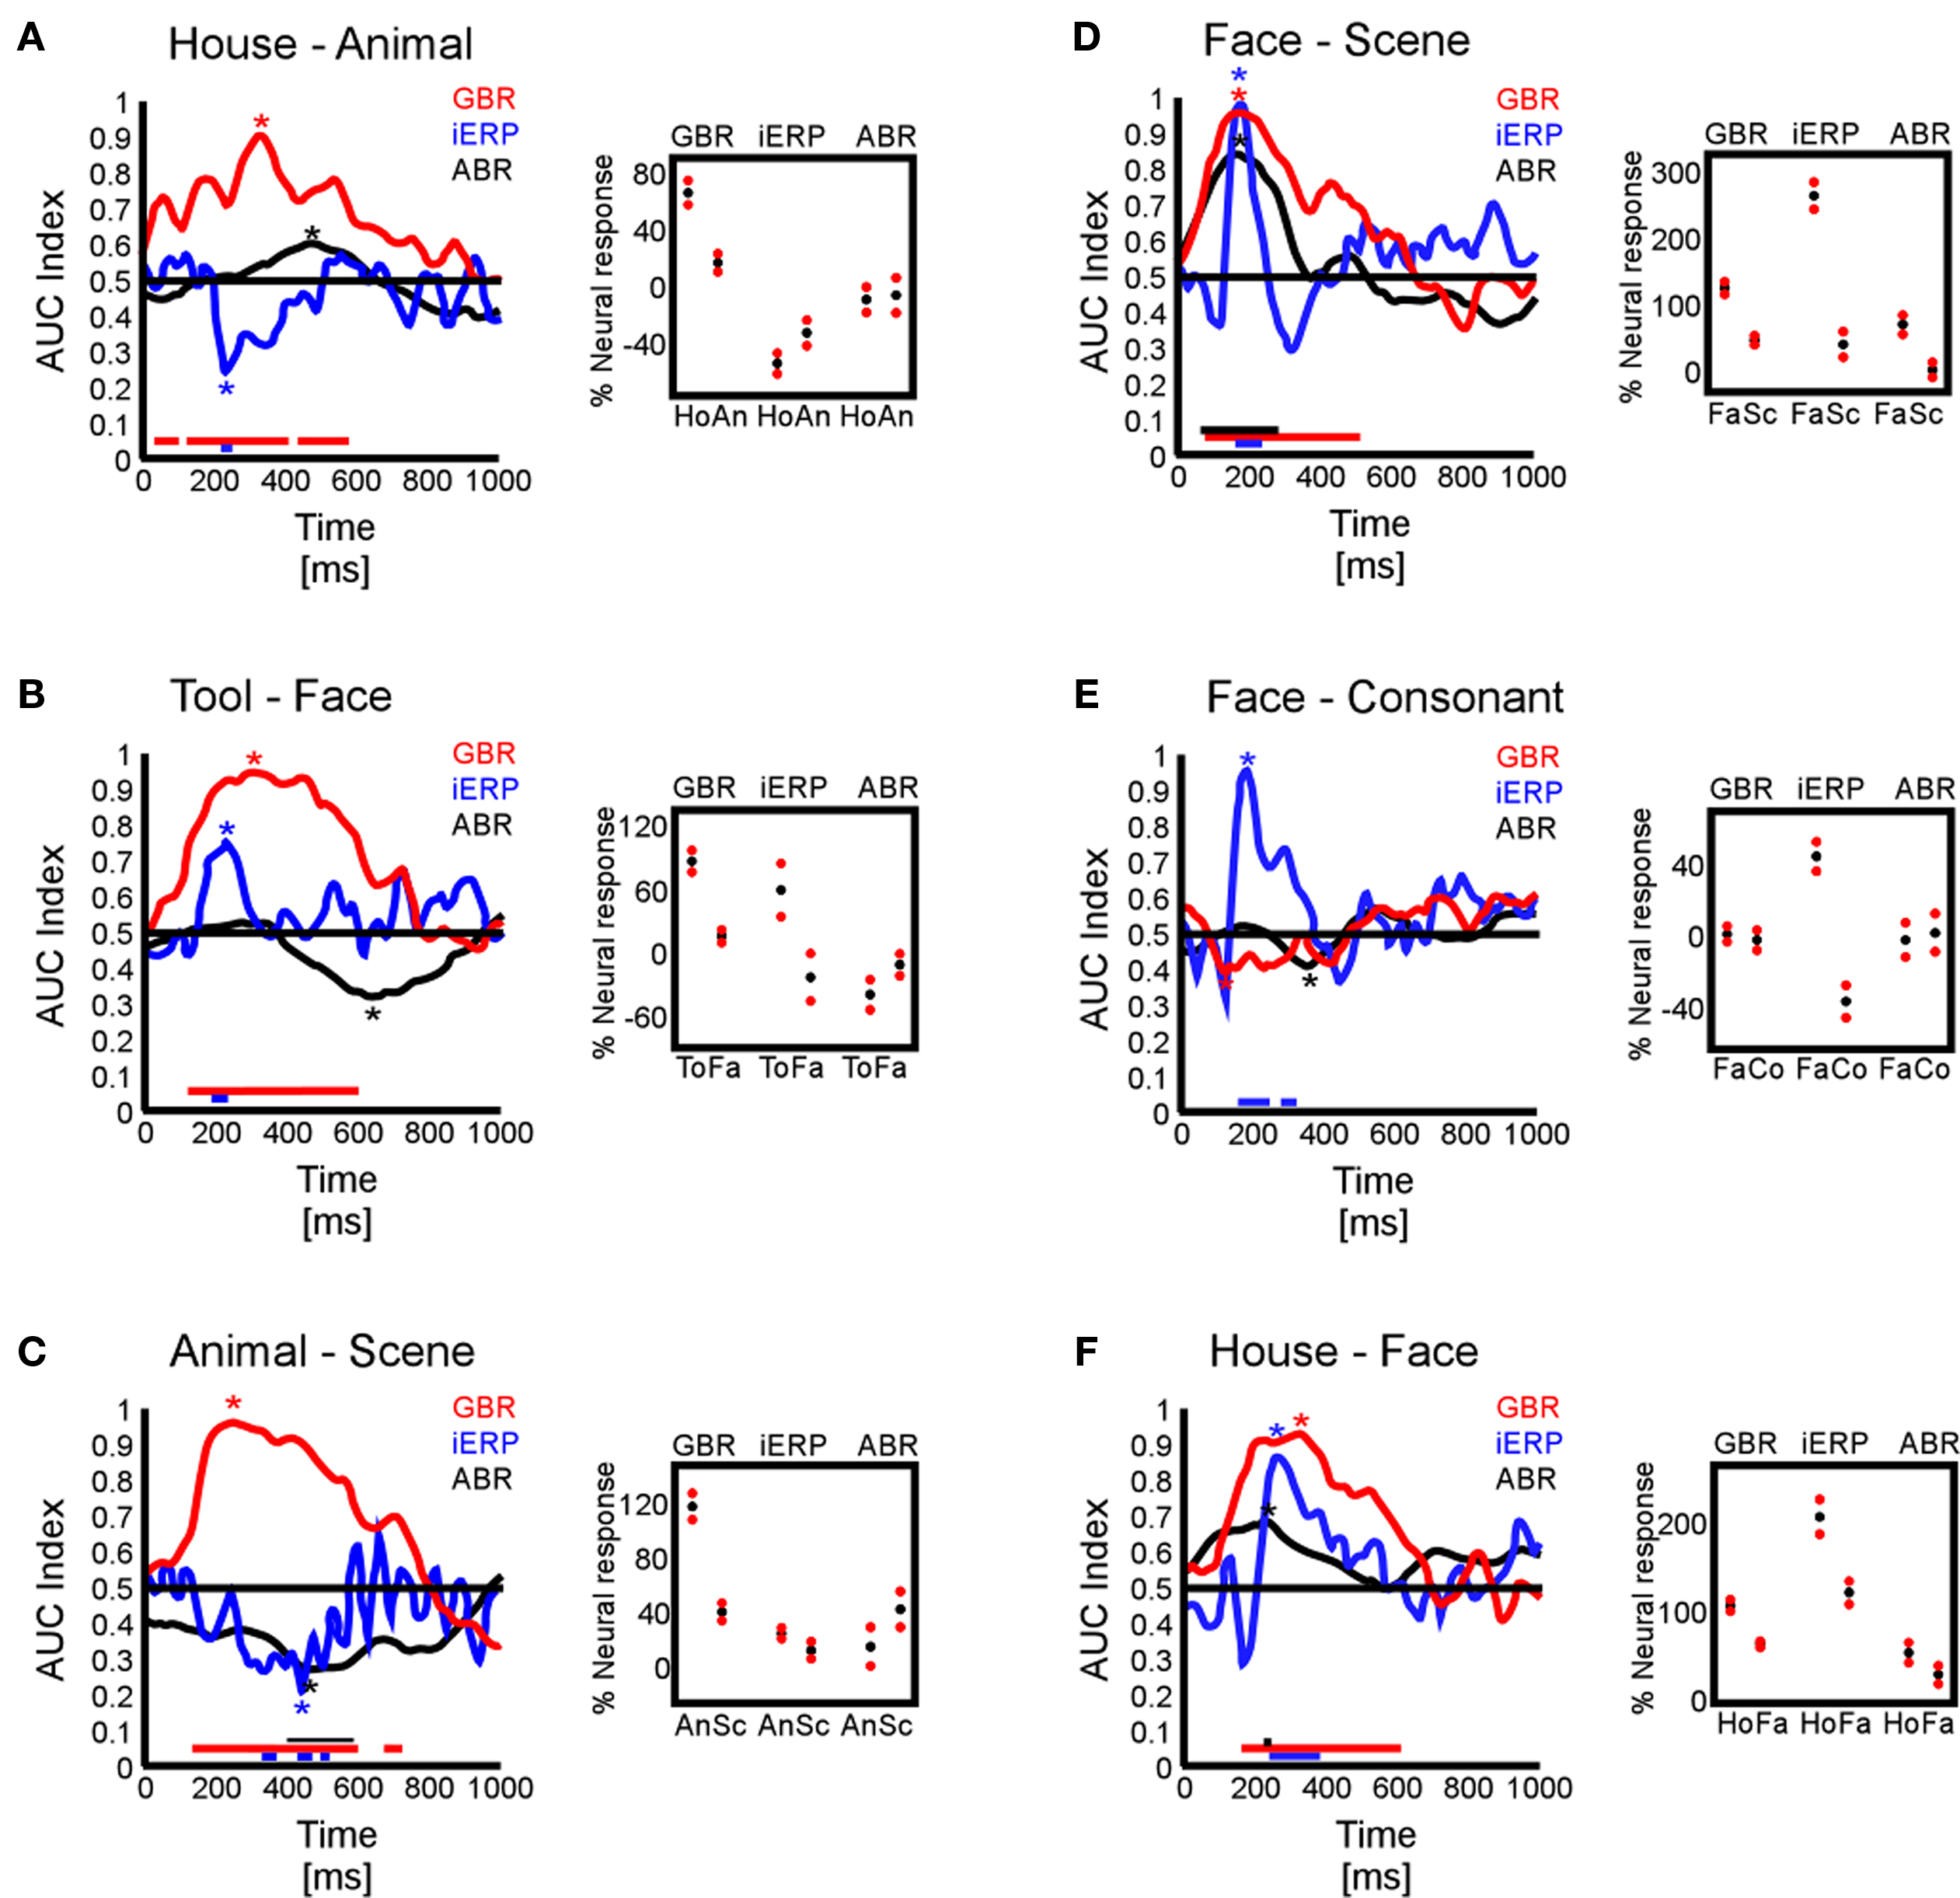
Figure 8. AUC index curves. (A–F) Six temporal recording sites illustrate the capacity of the three studied neural markers to sustain effective paired category readout. Left boxes represent AUC index curves through time. Right small boxes represent the average maximal absolute AUC indices extracted from each curve (star location) for each neural marker. The red dots represent 2 SEM around the average (black dots).
Responses in Frontal Cortex
Although our primary focus was on the temporal lobe, category-specific responses were also found in the frontal lobe and need to be mentioned. Most frontal responses showed a clear bias toward two types of visual objects: animals and tools (Figure 9A and Figures S3 and S5 in Supplementary Material). Most of these effects were visible either in the GBR or in the iERP, in separate sites. Figure 9 illustrates four examples of GBR at four different frontal recording sites within four different patients. Figure 9B exemplifies GBR to consonants, with more prolonged responses for pseudowords than for consonants. Such responses are likely to coincide with GBR associated with covert speech and grapheme-phoneme conversion (Mainy et al., 2007).
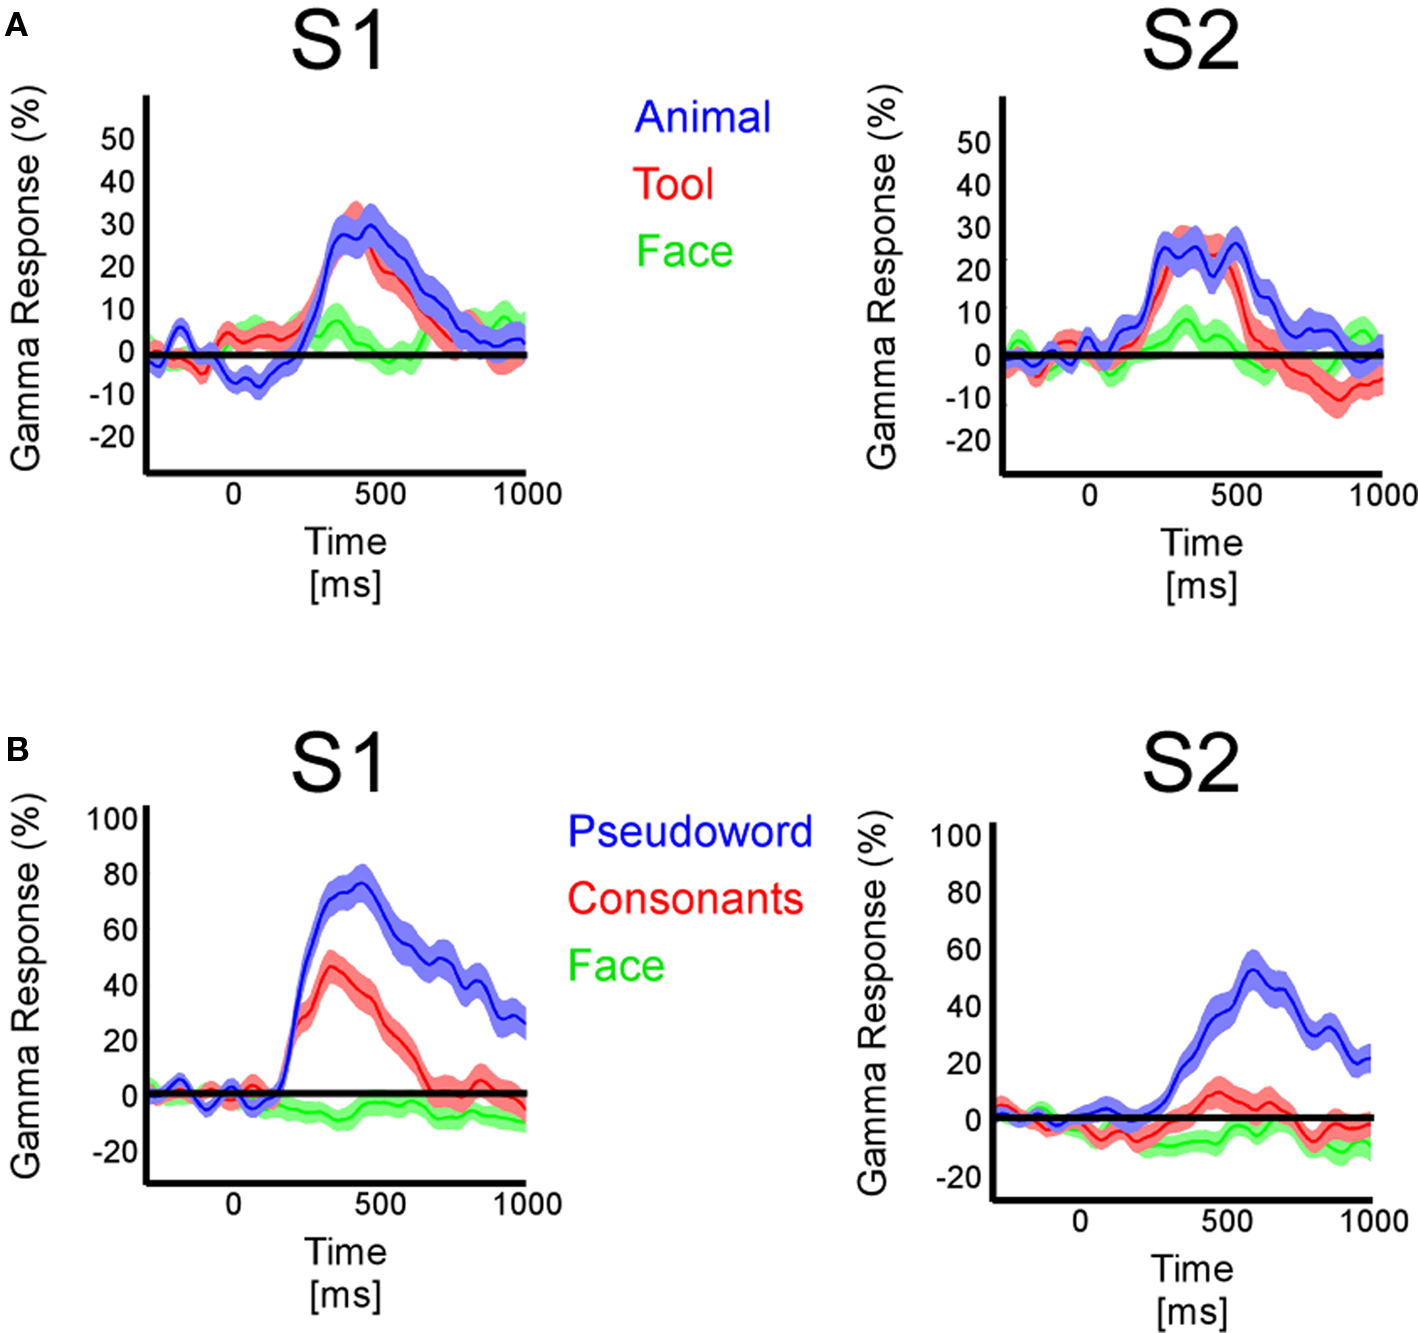
Figure 9. Average amplitude profiles from frontal recording sites in two subjects. (A) A selective response to animals and tools only is observed in these recording sites. (B) In some frontal regions both pseudowords and consonants elicit a unique response (left), sometimes only pseudowords elicit a response. No single response to only consonants has been observed throughout all recording sites in all patients. Shaded regions indicate ±1 SEM
Discussion
The aim of the present study was to achieve a global comparison between response selectivity of three neural markers (GBR, ABR, and iERP) to visual objects categories. We found that intracerebral broadband GBR (50–150 Hz) can reflect visual object category-specific neural coding within widespread regions, while presenting little overlap with other neural markers (ABR and iERP). Most surprising was the finding that sites producing more than one type of response rarely had the same category-specificity: the spatial overlap of the category-specific GBR with iERP or ABR showing the same stimulus selectivity was less than 10%. This discrepancy was visible at the single-trial level for all three markers. Highly reliable neural response readout procedure described visual stimuli content in large time-windows after a delay of ∼100 ms post-stimulus presentation. We have no direct explanation for the spread of the response specificities of these neural markers. However, we might suggest that varying degrees of synchrony within neuronal populations may explain these discrepancies as well differing spatial extends of activated neuronal networks.
It has been shown that single neurons in temporal and frontal cortical regions respond selectively to complex visual information (Desimone et al., 1984; Tanaka, 1996; Freedman et al., 2001; Quiroga et al., 2005), contrasting with neurons in sensory areas which code and respond primarily to low-level features of stimuli, e.g., contrast, size, color, and motion (Albright et al., 1984; Hubel and Livingstone, 1987). At a larger neuronal population scale, fast evoked responses have shown high specificity toward category information, revealing the capacity of neuronal groups to quickly extract invariant conceptual information from a wide variety of stimulus configurations (Allison et al., 1993, 1994a; Halgren et al., 1994a,b, 1995a,b; McCarthy et al., 1999; Puce et al., 1999; VanRullen and Thorpe, 2001; Liu et al., 2009). The particular case of evoked potential selectivity for face stimuli has been extensively investigated with intracranial recordings in humans (Allison et al., 1993, 1994a; Halgren et al., 1994a,b, 1995a,b; McCarthy et al., 1999; Puce et al., 1999; Liu et al., 2009). In our study, we identified similar face and pseudoword selective effects, within face and word-form selective areas (Cohen et al., 2000; Kanwisher and Yovel, 2006), in agreement with a previous intracerebral study(Lachaux et al., 2005). We report selective neural responses – GBR, ABR, as well as iERP – to visual object categories spatially distributed across cerebral cortex. This had been observed locally in a previous intracerebral study (Lachaux et al., 2005) but has been more rigorously and extensively identified in our study with a pool of 18 patients.
A recent study has shown that regional stimulus selectivity can be lower than expected if scrutinized with high spatial resolution fMRI (Grill-Spector et al., 2006). This study showed that subregions of the FFA additionally respond to faces amongst a large panorama of non-face stimuli. We observed similar results, for the first time with intracranial gamma-band responses in two patients with recording sites located in the FFA. Moreover, we report specific GBR related to character string processing (pseudowords and consonants) in left inferior temporal lobe. This is in agreement with previous findings on specific word processing activity detected in the word-form area (Cohen et al., 2000) in cerebro with iERP (Nobre et al., 1994; Nobre and McCarthy, 1995) and GBR (Mainy et al., 2008) as well as non-invasively with fMRI (Mechelli et al., 2003).
Many previous studies by our group and others reported human intracranial gamma-band selective stimulus-induced activity in higher-order visual brain regions and frontal regions that were in addition modulated by perceptual, attention, memory, and awareness processes (Crone et al., 1998; Lachaux et al., 2005, 2008; Canolty et al., 2006; Jensen et al., 2007; Jung et al., 2008; Mainy et al., 2008; Fisch et al., 2009; Gaillard et al., 2009; Jacobs and Kahana, 2009; van Vugt et al., 2010). In our study, we analyzed stimulus-induced neural activity which was not task-relevant and thus did not request the same attentional resources. We suggest that the stimulus-induced GBR observed within most regions, especially posterior temporal cortex, were partly generated by the bottom-up activation of local neural representation. However, we cannot dismiss the possibility of top-down effects of attention and perceptual awareness. Recent intracranial studies have shown that masked visual stimuli (either complex category or character strings) that were not consciously perceived by the patients elicited limited GBR (especially in frontal regions) as compared to unmasked stimuli which were fully perceived and actively matched to a target template (Fisch et al., 2009; Gaillard et al., 2009). A similar observation has been made concerning gamma-band modulation when the degree of attention on word reading is controlled (Jung et al., 2008). Interestingly, we observed overall more GBR for visual objects from category animals and tools, especially in frontal cortex. These effects might be caused by the natural saliency of these stimuli in capturing human attention in natural environment (Bar, 2004). The same argument applies to the sustained GBR to pseudowords, which might trigger enhanced attentional processing in order to engage active reading of the stimulus.
An ECoG study in patients (Jacobs and Kahana, 2009) revealed recently similar stimulus-specific GBR observable at single-trial and single subject level. These authors used single letter stimuli within a memory task and found that letter shape was able to elicit graded GBR, mainly in occipital lobe recordings. They report less specific responses in temporal lobe than we do. The level of processing requested by a stimulus may depend on its complexity and task-relevance, but also on the variety of their physical structures. This could explain why processing letter shape differences might request less high-level visual processing and thus less overall gamma-band activation as compared to experiments using stimuli from multiple visual object categories. Neural responses can differentiate stimuli to various degrees. This differentiation capacity of neural markers can be measured by evaluating differences between neural responses elicited by two or more groups of stimuli and grouped according to this classification. However, testing without a priori condition grouping criteria requires objective classification of neural signals based on amplitude readout methods. Many previous studies have used these techniques to read out fMRI signals during similar perceptual tasks (Kamitani and Tong, 2005; Kay et al., 2008; Haynes, 2009). Previous intracranial studies showed that this technique allowed very accurate separation of iERP signals pertaining to different categories (Hung et al., 2005; Liu et al., 2009). Other MEG studies in healthy subjects used this same technique to evaluate perceptual and behavioral content of beta and gamma responses (Donner et al., 2009; Wyart and Tallon-Baudry, 2009). Here we used this method to assess the high reliability of single-trial intracranial GBR amplitudes in describing information content from visual object stimuli.
Unlike narrow band gamma oscillations reported in various recent MEG studies (Hoogenboom et al., 2006, 2010; Vidal et al., 2006; Dalal et al., 2008, 2009; Wyart and Tallon-Baudry, 2008), intracranial gamma-band activity recorded here with stereotactically implanted depth electrodes in deep cortical layers is broadband signal extending between ∼50 and ∼150–200 Hz. Previous reports (Miller et al., 2009a,b) suggested that cerebral gamma activity induced by stimulation could be the result of a global increase of local neuronal population firing rate, and a recent intracranial study (Manning et al., 2009) showed that broadband gamma activity increase correlated with local increases of neuronal firing rate. Single-neuron recordings have shown that visual category information can be unambiguously and selectively represented by the firing rate of neurons in human medial temporal lobe (Kreiman et al., 2000). Intracranial gamma-band selective visual category responses might thus reflect these local neuronal population firing rates in response to neural representations. Despite their high level of specificity in conveying conceptual and meaningful information on stimuli, these neuronal populations may be part of a broad network operating with sparse neural representation coding along the lines of recent findings based on unit recordings in humans (Quiroga et al., 2008).
Conflict of Interest Statement
The authors declare that the research was conducted in the absence of any commercial or financial relationships that could be construed as a potential conflict of interest.
Acknowledgements
We thank all patients for their participation; the staff of the Grenoble Neurological Hospital epilepsy unit; Dominique Hoffmann, Patricia Boschetti, Carole Chatelard, Véronique Dorlin for their support. Funding was provided by the Ministère de l'Education Nationale et la Recherche (France), the Fondation pour la Recherche Médicale (FRM), Marie Curie Postdoctoral Fellowship from the European Commision and by the BrainSync FP7 European Project (Grant HEALTH-F2-2008-200728).
References
Albright, T. D., Desimone, R., and Gross, C. G. (1984). Columnar organization of directionally selective cells in visual area MT of the macaque. J. Neurophysiol. 51, 16–31.
Allison, T., Begleiter, A., McCarthy, G., Roessler, E., Nobre, A. C., and Spencer, D. D. (1993). Electrophysiological studies of color processing in human visual cortex. Electroencephalogr. Clin. Neurophysiol. 88, 343–355.
Allison, T., Ginter, H., McCarthy, G., Nobre, A. C., Puce, A., Luby, M., and Spencer, D. D. (1994a). Face recognition in human extrastriate cortex. J. Neurophysiol. 71, 821–825.
Allison, T., McCarthy, G., Nobre, A., Puce, A., and Belger, A. (1994b). Human extrastriate visual cortex and the perception of faces, words, numbers, and colors. Cereb. Cortex 4, 544–554.
Bauer, M., Oostenveld, R., Peeters, M., and Fries, P. (2006). Tactile spatial attention enhances gamma-band activity in somatosensory cortex and reduces low-frequency activity in parieto-occipital areas. J. Neurosci. 26, 490–501.
Britten, K. H., Shadlen, M. N., Newsome, W. T., and Movshon, J. A. (1992). The analysis of visual motion: a comparison of neuronal and psychophysical performance. J. Neurosci. 12, 4745–4765.
Bruns, A. (2004). Fourier-, Hilbert- and wavelet-based signal analysis: are they really different approaches? J. Neurosci. Methods 137, 321–332.
Canolty, R. T., Edwards, E., Dalal, S. S., Soltani, M., Nagarajan, S. S., Kirsch, H. E., Berger, M. S., Barbaro, N. M., and Knight, R. T. (2006). High gamma power is phase-locked to theta oscillations in human neocortex. Science 313, 1626–1628.
Cohen, L., Dehaene, S., Naccache, L., Lehericy, S., Dehaene-Lambertz, G., Henaff, M. A., and Michel, F. (2000). The visual word form area: spatial and temporal characterization of an initial stage of reading in normal subjects and posterior split-brain patients. Brain 123 (Pt 2), 291–307.
Crone, N. E., Miglioretti, D. L., Gordon, B., and Lesser, R. P. (1998). Functional mapping of human sensorimotor cortex with electrocorticographic spectral analysis. II. Event-related synchronization in the gamma band. Brain 121 (Pt 12), 2301–2315.
Crone, N. E., Sinai, A., and Korzeniewska, A. (2006). High-frequency gamma oscillations and human brain mapping with electrocorticography. Prog. Brain Res. 159, 275–295.
Dalal, S. S., Baillet, S., Adam, C., Ducorps, A., Schwartz, D., Jerbi, K., Bertrand, O., Garnero, L., Martinerie, J., and Lachaux, J. P. (2009). Simultaneous MEG and intracranial EEG recordings during attentive reading. Neuroimage 45, 1289–1304.
Dalal, S. S., Guggisberg, A. G., Edwards, E., Sekihara, K., Findlay, A. M., Canolty, R. T., Berger, M. S., Knight, R. T., Barbaro, N. M., Kirsch, H. E., and Nagarajan, S. S. (2008). Five-dimensional neuroimaging: localization of the time–frequency dynamics of cortical activity. Neuroimage 40, 1686–1700.
Desimone, R., Albright, T. D., Gross, C. G., and Bruce, C. (1984). Stimulus-selective properties of inferior temporal neurons in the macaque. J. Neurosci. 4, 2051–2062.
Donner, T. H., Siegel, M., Fries, P., and Engel, A. K. (2009). Buildup of choice-predictive activity in human motor cortex during perceptual decision making. Curr. Biol. 19, 1581–1585.
Donner, T. H., Siegel, M., Oostenveld, R., Fries, P., Bauer, M., and Engel, A. K. (2007). Population activity in the human dorsal pathway predicts the accuracy of visual motion detection. J. Neurophysiol. 98, 345–359.
Engel, A. K., Fries, P., and Singer, W. (2001). Dynamic predictions: oscillations and synchrony in top-down processing. Nat. Rev. Neurosci. 2, 704–716.
Engell, A. D., and McCarthy, G. (2010). Selective attention modulates face-specific induced gamma oscillations recorded from ventral occipitotemporal cortex. J. Neurosci. 30, 8780–8786.
Fell, J., Klaver, P., Lehnertz, K., Grunwald, T., Schaller, C., Elger, C. E., and Fernandez, G. (2001). Human memory formation is accompanied by rhinal-hippocampal coupling and decoupling. Nat. Neurosci. 4, 1259–1264.
Fisch, L., Privman, E., Ramot, M., Harel, M., Nir, Y., Kipervasser, S., Andelman, F., Neufeld, M. Y., Kramer, U., Fried, I., and Malach, R. (2009). Neural “ignition”: enhanced activation linked to perceptual awareness in human ventral stream visual cortex. Neuron 64, 562–574.
Freedman, D. J., Riesenhuber, M., Poggio, T., and Miller, E. K. (2001). Categorical representation of visual stimuli in the primate prefrontal cortex. Science 291, 312–316.
Fries, P. (2009). Neuronal gamma-band synchronization as a fundamental process in cortical computation. Annu. Rev. Neurosci. 32, 209–224.
Fries, P., Reynolds, J. H., Rorie, A. E., and Desimone, R. (2001). Modulation of oscillatory neuronal synchronization by selective visual attention. Science 291, 1560–1563.
Gaillard, R., Dehaene, S., Adam, C., Clemenceau, S., Hasboun, D., Baulac, M., Cohen, L., and Naccache, L. (2009). Converging intracranial markers of conscious access. PLoS Biol. 7, e61. doi: 10.1371/journal.pbio.1000061.
Genovese, C. R., Lazar, N. A., and Nichols, T. (2002). Thresholding of statistical maps in functional neuroimaging using the false discovery rate. Neuroimage 15, 870–878.
Green, D. M., and Swets, J. A. (1974). Signal Detection Theory and Psychophysics. Huntington, NY: R.E. Krieger Pub. Co.
Grill-Spector, K., Sayres, R., and Ress, D. (2006). High-resolution imaging reveals highly selective nonface clusters in the fusiform face area. Nat. Neurosci. 9, 1177–1185.
Halgren, E., Baudena, P., Clarke, J. M., Heit, G., Liegeois, C., Chauvel, P., Musolino, A. (1995a). Intracerebral potentials to rare target and distractor auditory and visual stimuli. I Superior temporal plane and parietal lobe. Electroencephalogr. Clin. Neurophysiol. 94, 191–220.
Halgren, E., Baudena, P., Clarke, J. M., Heit, G., Marinkovic, K., Devaux, B., Vignal, J. P., and Biraben, A. (1995b). Intracerebral potentials to rare target and distractor auditory and visual stimuli. II. Medial, lateral and posterior temporal lobe. Electroencephalogr. Clin. Neurophysiol. 94, 229–250.
Halgren, E., Baudena, P., Heit, G., Clarke, J. M., Marinkovic, K., Chauvel, P., and Clarke, M. (1994a). Spatio-temporal stages in face and word processing. 2. Depth-recorded potentials in the human frontal and Rolandic cortices. J. Physiol. Paris. 88, 51–80.
Halgren, E., Baudena, P., Heit, G., Clarke, J. M., Marinkovic, K., and Clarke, M. (1994b). Spatio-temporal stages in face and word processing. I. Depth-recorded potentials in the human occipital, temporal and parietal lobes [corrected]. J. Physiol. Paris 88, 1–50.
Haynes, J. D. (2009). Decoding visual consciousness from human brain signals. Trends Cogn. Sci. (Regul. Ed.) 13, 194–202.
Hoogenboom, N., Schoffelen, J. M., Oostenveld, R., and Fries, P. (2010). Visually induced gamma-band activity predicts speed of change detection in humans. Neuroimage 51, 1162–1167.
Hoogenboom, N., Schoffelen, J. M., Oostenveld, R., Parkes, L. M., and Fries, P. (2006). Localizing human visual gamma-band activity in frequency, time and space. Neuroimage 29, 764–773.
Hubel, D. H., and Livingstone, M. S. (1987). Segregation of form, color, and stereopsis in primate area 18. J. Neurosci. 7, 3378–3415.
Hung, C. P., Kreiman, G., Poggio, T., and DiCarlo, J. J. (2005). Fast readout of object identity from macaque inferior temporal cortex. Science 310, 863–866.
Jacobs, J., and Kahana, M. J. (2009). Neural representations of individual stimuli in humans revealed by gamma-band electrocorticographic activity. J. Neurosci. 29, 10203–10214.
Jensen, O., Kaiser, J., and Lachaux, J. P. (2007). Human gamma-frequency oscillations associated with attention and memory. Trends Neurosci. 30, 317–324.
Jerbi, K., Ossandon, T., Hamame, C. M., Senova, S., Dalal, S. S., Jung, J., Minotti, L., Bertrand, O., Berthoz, A., Kahane, P., and Lachaux, J. P. (2009). Task-related gamma-band dynamics from an intracerebral perspective: review and implications for surface EEG and MEG. Hum. Brain Mapp. 30, 1758–1771.
Jung, J., Jerbi, K., Ossandon, T., Ryvlin, P., Isnard, J., Bertrand, O., Guenot, M., Mauguiere, F., and Lachaux, J. P. (2010). Brain responses to success and failure: direct recordings from human cerebral cortex. Hum. Brain Mapp. 31, 1217–1232.
Jung, J., Mainy, N., Kahane, P., Minotti, L., Hoffmann, D., Bertrand, O., and Lachaux, J. P. (2008). The neural bases of attentive reading. Hum. Brain Mapp. 29, 1193–1206.
Kamitani, Y., and Tong, F. (2005). Decoding the visual and subjective contents of the human brain. Nat. Neurosci. 8, 679–685.
Kanwisher, N., and Yovel, G. (2006). The fusiform face area: a cortical region specialized for the perception of faces. Philos. Trans. R. Soc. Lond., B, Biol. Sci. 361, 2109–2128.
Kay, K. N., Naselaris, T., Prenger, R. J., and Gallant, J. L. (2008). Identifying natural images from human brain activity. Nature 452, 352–355.
Kreiman, G., Koch, C., and Fried, I. (2000). Category-specific visual responses of single neurons in the human medial temporal lobe. Nat. Neurosci. 3, 946–953.
Lachaux, J. P., George, N., Tallon-Baudry, C., Martinerie, J., Hugueville, L., Minotti, L., Kahane, P., and Renault, B. (2005). The many faces of the gamma band response to complex visual stimuli. Neuroimage 25, 491–501.
Lachaux, J. P., Jung, J., Mainy, N., Dreher, J. C., Bertrand, O., Baciu, M., Minotti, L., Hoffmann, D., and Kahane, P. (2008). Silence is golden: transient neural deactivation in the prefrontal cortex during attentive reading. Cereb. Cortex 18, 443–450.
Le Van Quyen, M., Foucher, J., Lachaux, J., Rodriguez, E., Lutz, A., Martinerie, J., and Varela, F. J. (2001). Comparison of Hilbert transform and wavelet methods for the analysis of neuronal synchrony. J. Neurosci. Methods 111, 83–98.
Liu, H., Agam, Y., Madsen, J. R., and Kreiman, G. (2009). Timing, timing, timing: fast decoding of object information from intracranial field potentials in human visual cortex. Neuron 62, 281–290.
Mainy, N., Jung, J., Baciu, M., Kahane, P., Schoendorff, B., Minotti, L., Hoffmann, D., Bertrand, O., and Lachaux, J. P. (2008). Cortical dynamics of word recognition. Hum. Brain Mapp. 29, 1215–1230.
Mainy, N., Kahane, P., Minotti, L., Hoffmann, D., Bertrand, O., and Lachaux, J. P. (2007). Neural correlates of consolidation in working memory. Hum. Brain Mapp. 28, 183–193.
Manning, J. R., Jacobs, J., Fried, I., and Kahana, M. J. (2009). Broadband shifts in local field potential power spectra are correlated with single-neuron spiking in humans. J. Neurosci. 29, 13613–13620.
McCarthy, G., Puce, A., Belger, A., and Allison, T. (1999). Electrophysiological studies of human face perception. II: Response properties of face-specific potentials generated in occipitotemporal cortex. Cereb. Cortex 9, 431–444.
Mechelli, A., Gorno-Tempini, M. L., and Price, C. J. (2003). Neuroimaging studies of word and pseudoword reading: consistencies, inconsistencies, and limitations. J. Cogn. Neurosci. 15, 260–271.
Miller, K. J., Sorensen, L. B., Ojemann, J. G., and den Nijs, M. (2009a). Power-law scaling in the brain surface electric potential. PLoS Comput. Biol. 5, e1000609. doi: 10.1371/journal.pcbi.1000609.
Miller, K. J., Zanos, S., Fetz, E. E., den Nijs, M., and Ojemann, J. G. (2009b). Decoupling the cortical power spectrum reveals real-time representation of individual finger movements in humans. J. Neurosci. 29, 3132–3137.
Nobre, A. C., Allison, T., and McCarthy, G. (1994). Word recognition in the human inferior temporal lobe. Nature 372, 260–263.
Nobre, A. C., and McCarthy, G. (1995). Language-related field potentials in the anterior-medial temporal lobe: II. Effects of word type and semantic priming. J. Neurosci. 15, 1090–1098.
Pesaran, B., Pezaris, J. S., Sahani, M., Mitra, P. P., and Andersen, R. A. (2002). Temporal structure in neuronal activity during working memory in macaque parietal cortex. Nat. Neurosci. 5, 805–811.
Privman, E., Nir, Y., Kramer, U., Kipervasser, S., Andelman, F., Neufeld, M. Y., Mukamel, R., Yeshurun, Y., Fried, I., and Malach, R. (2007). Enhanced category tuning revealed by intracranial electroencephalograms in high-order human visual areas. J. Neurosci. 27, 6234–6242.
Puce, A., Allison, T., and McCarthy, G. (1999). Electrophysiological studies of human face perception. III: Effects of top-down processing on face-specific potentials. Cereb. Cortex 9, 445–458.
Quiroga, R. Q., Kreiman, G., Koch, C., and Fried, I. (2008). Sparse but not ‘grandmother-cell’ coding in the medial temporal lobe. Trends Cogn. Sci. (Regul. Ed.) 12, 87–91.
Quiroga, R. Q., Reddy, L., Kreiman, G., Koch, C., and Fried, I. (2005). Invariant visual representation by single neurons in the human brain. Nature 435, 1102–1107.
Romo, R., Hernandez, A., Zainos, A., Lemus, L., and Brody, C. D. (2002). Neuronal correlates of decision-making in secondary somatosensory cortex. Nat. Neurosci. 5, 1217–1225.
Sahin, N. T., Pinker, S., Cash, S. S., Schomer, D., and Halgren, E. (2009). Sequential processing of lexical, grammatical, and phonological information within Broca’s area. Science 326, 445–449.
Sahin, N. T., Pinker, S., and Halgren, E. (2006). Abstract grammatical processing of nouns and verbs in Broca’s area: evidence from fMRI. Cortex 42, 540–562.
Sederberg, P. B., Gauthier, L. V., Terushkin, V., Miller, J. F., Barnathan, J. A., and Kahana, M. J. (2006). Oscillatory correlates of the primacy effect in episodic memory. Neuroimage 32, 1422–1431.
Sederberg, P. B., Schulze-Bonhage, A., Madsen, J. R., Bromfield, E. B., Litt, B., Brandt, A., and Kahana, M. J. (2007). Gamma oscillations distinguish true from false memories. Psychol. Sci. 18, 927–932.
Talairach, J., Tournoux, P., and Missir, O. (1993). Referentially Oriented Cerebral MRI Anatomy: An Atlas of Stereotaxic Anatomical Correlations for Gray and White Matter. Stuttgart; New York, NY: G. Thieme Verlag; Thieme Medical Publishers.
Tallon-Baudry, C., Bertrand, O., Delpuech, C., and Pernier, J. (1996). Stimulus specificity of phase-locked and non-phase-locked 40 Hz visual responses in human. J. Neurosci. 16, 4240–4249.
Tallon-Baudry, C., Bertrand, O., Henaff, M. A., Isnard, J., and Fischer, C. (2005). Attention modulates gamma-band oscillations differently in the human lateral occipital cortex and fusiform gyrus. Cereb. Cortex 15, 654–662.
van Vugt, M. K., Schulze-Bonhage, A., Litt, B., Brandt, A., and Kahana, M. J. (2010). Hippocampal gamma oscillations increase with memory load. J. Neurosci. 30, 2694–2699.
VanRullen, R., and Thorpe, S. J. (2001). The time course of visual processing: from early perception to decision-making. J. Cogn. Neurosci. 13, 454–461.
Varela, F., Lachaux, J. P., Rodriguez, E., and Martinerie, J. (2001). The brainweb: phase synchronization and large-scale integration. Nat. Rev. Neurosci. 2, 229–239.
Vidal, J. R., Chaumon, M., O’Regan, J. K., and Tallon-Baudry, C. (2006). Visual grouping and the focusing of attention induce gamma-band oscillations at different frequencies in human magnetoencephalogram signals. J. Cogn. Neurosci. 18, 1850–1862.
Voytek, B., Secundo, L., Bidet-Caulet, A., Scabini, D., Stiver, S. I., Gean, A. D., Manley, G. T., and Knight, R. T. (2010). Hemicraniectomy: a new model for human electrophysiology with high spatio-temporal resolution. J. Cogn. Neurosci. 22, 2491–2502.
Wyart, V., and Tallon-Baudry, C. (2008). Neural dissociation between visual awareness and spatial attention. J. Neurosci. 28, 2667–2679.
Keywords: visual perception, iEEG, gamma-band, visual object category, ERP, occipitotemporal cortex, faces, fusiform gyrus
Citation: Vidal JR, Ossandón T, Jerbi K, Dalal SS, Minotti L, Ryvlin P, Kahane P and Lachaux J-P (2010) Category-specific visual responses: an intracranial study comparing gamma, beta, alpha, and ERP response selectivity. Front. Hum. Neurosci. 4:195. doi: 10.3389/fnhum.2010.00195
Received: 31 May 2010;
Accepted: 28 September 2010;
Published online: 11 November 2010.
Edited by:
Thilo Womelsdorf, Robarts Research Institute London, CanadaReviewed by:
Bradley Voytek, University of California, Berkeley, USATimothy J. Buschman, Massachusetts Institute of Technology, USA
Copyright: © 2010 Vidal, Ossandón, Jerbi, Dalal, Minotti, Ryvlin, Kahane and Lachaux. This is an open-access article subject to an exclusive license agreement between the authors and the Frontiers Research Foundation, which permits unrestricted use, distribution, and reproduction in any medium, provided the original authors and source are credited.
*Correspondence: Juan R. Vidal, INSERM U821, Dynamique Cérébrale et Cognition, Centre Hospitalier Le Vinatier (Bât. 452), 95, Bd Pinel, 69675 Bron cedex, France. e-mail: juan.vidal@inserm.fr