Resting-state functional connectivity differences in premature children
- 1 The Mind Research Network, Albuquerque, NM, USA
- 2 Department of Pediatrics, University of New Mexico, Albuquerque, NM, USA
We examine the coherence in the spontaneous brain activity of sleeping children as measured by the blood oxygenation level dependent (BOLD) functional magnetic resonance imaging (fMRI) signals. The results are described in terms of resting-state networks (RSN) and their properties. More specifically, in this study we examine the effect of severe prematurity on the spatial location of the visual, temporal, motor, basal ganglia, and the default mode networks, the temporal response properties of each of these networks, and the functional connectivity between them. Our results suggest that the anatomical locations of the RSNs are well developed by 18 months of age and their spatial locations are not distinguishable between premature and term born infants at 18 months or at 36 months, with the exception of small spatial differences noted in the basal ganglia area and the visual cortex. The two major differences between term and pre-term children were present at 36 but not 18 months and include: (1) increased spectral energy in the low frequency range (0.01–0.06 Hz) for pre-term children in the basal ganglia component, and (2) stronger connectivity between RSNs in term children. We speculate that children born very prematurely are vulnerable to injury resulting in weaker connectivity between resting-state networks by 36 months of age. Further work is required to determine whether this could be a clinically useful tool to identify children at risk of developmental delay related to premature birth.
Introduction
Patterns of low frequency spontaneous correlations in large-scale brain regions in humans have been detected (Biswal et al., 1995 ) from blood oxygenation level dependent (BOLD) functional magnetic resonance imaging (fMRI) signals collected at rest. These correlations are used to obtain resting-state networks (RSNs), which may represent functional connectivity within the brain, and have been largely studied in adult populations (Buckner et al., 2008 ). Among these RSNs, a default mode network (DMN) has been identified which is characterized by a decrease in neuronal activation when the subject concentrates on an external task (Binder et al., 1999 ; Raichle et al., 2001 ). Differences in the functional connectivity of RSNs have been implicated in neurological disorders such as Schizophrenia (Garrity et al., 2007 ; Rotarska-Jagiela et al., 2010 ) and Alzheimer’s disease (Greicius et al., 2004 ; Sorg et al., 2007 ). In this paper we study the maturation of RSN functional connectivity during early human development in healthy term born children and in former premature children between 18 and 36 months of age.
Extremely low birth weight (ELBW) premature infants have a high risk of developmental delay. Almost half of the ELBW infants go on to develop moderate to severe cognitive intellectual impairment (Hack et al., 2004 ; Taylor et al., 2004 ; Vohr et al., 2004 ; Wilson-Costello et al., 2005 ) and even premature children with normal IQs are at high risk for school failure due to deficits in executive function (Vicari et al., 2004 ). The mechanisms underlying these deficits are often not well understood. While many ELBW children exhibit white matter (WM) injury on clinical MRI scans, not all do, and it often isn’t until later school age that cognitive deficits become evident (Anderson and Doyle, 2003 ). Because earlier treatment is generally more effective for neurocognitive problems associated with prematurity, a method of more accurately identifying those children at risk for developmental delay would be of tremendous clinical benefit.
Recent advances in neuroimaging offer an opportunity to better characterize the effects of prematurity on brain structure. High resolution imaging identifies regional brain volumes that may be more sensitive to the effects of prematurity than overall structure (Kesler et al., 2004 ; Thompson et al., 2007 ; Tzarouchi et al., 2009 ), and diffusion tensor imaging suggests that fractional anisotropy identifies WM abnormalities not apparent on standard MRI scans (Miller et al., 2002 ; Anjari et al., 2007 ). In a recent review of neuroimaging in prematurity, 16 studies using diffusion tensor imaging and 10 high resolution structural studies were identified (Ment et al., 2009 ). However the effect of prematurity on brain function has been less well studied. This report focuses on one aspect of brain function, resting-state networks that are related to functional networks and can be obtained in sleeping children.
Only several studies have examined the RSNs in infants. In two studies Fransson et al. have presented results on the presence of RSNs. In the first study (Fransson et al., 2007 ) 12 pre-term infants were imaged 41-weeks gestational age and in the second, 19 term unsedated infants (Fransson et al., 2009 ) were studied. In both these groups RSNs were found in the sensory cortices, parietal and temporal areas, and the prefrontal cortex. Another study (Gao et al., 2009 ) compared DMNs and their functional connectivity in neonates, 1-year-old and 2-year-old infants. They found the presence of an incomplete DMN in neonates, which was developed in 1-year olds and was similar to adults in 2-year olds. Recently longitudinal neural network development was studied in pre-term children (Smyser et al., 2010 ) from postmenstrual age of 26–40 weeks. They were able to find RSNs in various cortical regions and map their spatial growth longitudinally as a function of child’s age. Although the presence of RSNs have been demonstrated in infants as early as 42 weeks, no study has examined the effects of prematurity on the spatial and temporal properties of RSNs systematically. Our goal was to compare age and prematurity dependent RSN property differences and their functional network connectivity (FNC) (Jafri et al., 2008 ). Forty seven children participated in this study, where we compare differences in RSNs in premature (≤1500 g) and full-term children imaged at 18–22 months and 36–48 months of age.
Temporally coherent networks of low frequency spontaneous oscillations were found from BOLD data collected on sleeping children. We call these networks as RSNs to mean networks found when the subjects were not actively doing a specific task. This does not exclude the presence of these networks during a task as well.
Currently there are two main methods for doing rs-fcMRI analysis. The first method consisted of the seed based correlation approach in which few region of interest (ROI) time series are selected a priori and voxelwise cross-correlation is computed across the whole brain (Fox et al., 2005 ). The ROI approach is more suitable to study adult resting fMRI data as the ROI’s are well defined by many researchers and may not be completely evolved in a younger population (Fair et al., 2008 ). The second approach to identify RSNs uses independent component analysis (ICA). The advantage of ICA is that it is a model free data-driven approach that decomposes the data into linear mixtures of spatially independent and temporally coherent source signals/components. The applicability of the technique to resting fMRI data to extract RSNs has been demonstrated previously (Beckmann and Smith, 2004 ; Greicius et al., 2004 ; Calhoun and Adali, 2006 ; Damoiseaux et al., 2006 ). In this paper we use a ROI based rs-fcMRI analysis, where the ROIs are defined by the ICA spatial maps. Rather than define ROIs based on some atlas that may not be representative of functional units in infants, we treat ICA as a clustering algorithm to define regions with high within cluster correlations. We define functional ROIs based on the data itself. Although, the goals of both these methods is to identify functional connectivity, the network nodes and the time courses used for functional connectivity are different in the two methods. The ICA method defines a spatial map across the whole brain while the ROI based method uses locally defined clusters. The ICA method uses time courses associated with each ICA spatial map, while the ROI based method uses BOLD time response local to that specific ROI after removing effects of physiological noise. Thus there are significant differences between the two approaches and it is reassuring that the results of the two methods are similar.
Once the functional connectivity network is obtained graph-theoretic metrics can be used to study network properties (Bullmore and Sporns, 2009 ). These include parameters such as path-length, network clustering, modularity, and small-world topology. At least two recent papers discuss differences in network properties between children and adults (Fair et al., 2009 ; Supekar et al., 2009 ). An interesting finding was that development of children to adults was accompanied by a decrease in connectivity of short range connections and an increase in long-range connectivity. In this paper we do not discuss such differences in network metrics.
Materials and Methods
Participants
In this study we recruited very low birth weight premature infants (≤1500 g at birth) and full-term children at 18–22 months and 36–48 months of age. All of the subjects sustained normal development and had no abnormalities on neurologic examination or on standard MRI scan. The subjects were categorized into four groups: (a) 16 premature infants at 18 months (P18), (b) 13 premature infants at 36 months (P36), (c) 9 full-term infants at 18 months (F18), and (d) 9 full-term infants at 36 months (F36). All experiments were done on sleeping children. The term children were not sedated while some premature children were lightly sedated with 50 mg/kg chloral hydrate administered orally. Prior to scanning, written informed consent was obtained from the parents and the study was approved by Institutional Review Board of the University of New Mexico. Light chloral hydrate sedation (50 mg/kg orally) was used for 11 of 16 premature infants at 18 months and 9 of 13 premature infants at 36 months. The mean gestational age for pre-term 18-month-old children was 28.7 weeks (±1.38, range 26.3–30.5 weeks) and the mean gestational age for pre-term 36-month-old children was 29.9 weeks (±1.58, range 28–32 weeks).
Data Acquisition
Initially, a high resolution five-echo T1-weighted magnetization prepared rapid gradient-echo (MPRAGE) image was acquired on a 3T Siemens Trio scanner [TE = 1.64, 3.5, 5.36, 7.22, and 9.08 ms, TR = 2530 ms, flip angle = 7°, FOV = 256 mm, matrix size = 256 × 256, 1 mm3 isotropic voxel]. The resting-state data was collected from a gradient-echo echo-planar sequence [TE = 29 ms, TR = 2 s, FOV = 240 mm, matrix size = 64 × 64, 32 slices, thickness 4.45 mm]. Resting-state data was collected for 5 min 16 s resulting in 158 volumes of BOLD fMRI data per subject.
Data Analysis
The data was preprocessed using a mixture of free and commercial packages including SPM 1 , GIFT 2 , AFNI (Cox, 1996 ) and MATLAB (The Mathworks Inc). The first four volumes of the functional data were discarded to account for T1 equilibrium effects. The remaining 154 volumes of EPI data of each subject was first motion corrected (INRIA align) followed by slice time correction. The data was then de-spiked using AFNI. Each subject’s de-spiked EPI data was aligned to an infant’s template obtained from the subjects in our study. In order to compare the 18-month and the 36-month infants we pooled our data and obtained one common template. A two step procedure was used to reduce the effect of the adult template (Altaye et al., 2008 ). We first aligned all the infant T1 images to the adult MNI template. The mean of these infant T1 registered images was our study specific infant template. In the second step, the spatial normalization was repeated by registering each infant’s image to the infant template found in the first step. The spatially normalized images were resampled to 3 mm isotropic cubic voxels and then smoothed with a 6-mm Gaussian kernel. Finally each voxel’s time series within the brain tissue was normalized to a mean of 100.
All of the preprocessed data from both the age groups was analyzed together in a single group ICA framework as implemented in the GIFT package. A two step data reduction approach using principal component analysis (PCA) was taken prior to performing the ICA analysis. In the first step, 80 principal components were obtained from each individual subject data to retain most of the subject specific variance. Then each of the subject’s reduced data was concatenated in time and a second PCA was performed to retain 30 components. Recent extensive experiments on simulated and real fMRI data sets in our lab have shown that accounting for greater subject specific variance by retaining more components at the first PCA reduction step yields more reliable group and subject specific back reconstructed maps using GIFT package (Erhardt et al., 2010 ). Then Infomax ICA algorithm was used to obtain 30 independent components. The stability of the estimated components was ensured using 10 ICASSO (Himberg and Hyvarinen, 2003 ) iterations. Individual subject specific maps were subsequently obtained using the improved back reconstruction algorithm implemented in GIFT package.
Out of the 30 independent components, a set of 14 resting-state networks within the cortex were identified (Figure 1 ). These networks are listed in Table 1 . The remaining components corresponded to subject’s motion or were spatially confined to cerebrospinal fluid (CSF), and blood vessels. The independent component spatial maps obtained were first z-scored and one-sample random effects maps for the whole group were generated. Each subject’s reconstructed ICA time courses were orthogonalized with respect to their estimated motion parameters, and representative WM and CSF signals. CSF and WM regions were identified based on the infant template found earlier. Several small ROI’s were manually drawn in the CSF and WM regions of the template and the mean time signal in CSF and WM was calculated for each subject for use in orthogonalization. Spectral analysis was performed on these time courses. Subject specific time courses were variance normalized. Time course spectra were then determined using multi-taper spectral estimation 3 . In our data, the power spectrum had a peak at approximately 0.03 Hz and we compared for the differences in the power spectrum within the low frequency range (0.01–0.06 Hz) by averaging across this range for the four infant groups. The average spectral power was obtained in the low frequency range 0.01–0.06 Hz because it has been suggested in the literature that the cross-correlations between resting-state BOLD data is reflected in frequencies less than 0.1 Hz (Cordes et al., 2001 ).
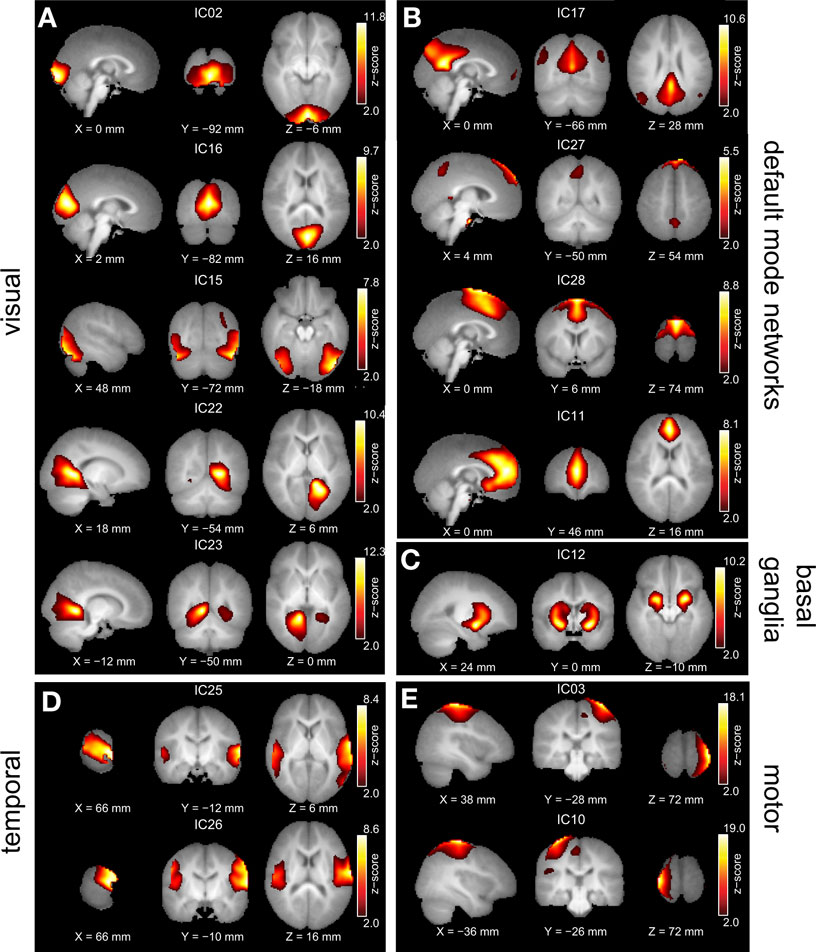
Figure 1. Group ICA estimated resting-state patterns grouped into: (A) Visual resting-state networks, (B) Default mode networks, (C) Basal ganglia, (D) Temporal networks, and (E) Motor networks. Group maps are z-scored and voxels above a z thresholded of 2 are displayed. The left hemisphere of the brain corresponds to the left side of the image.
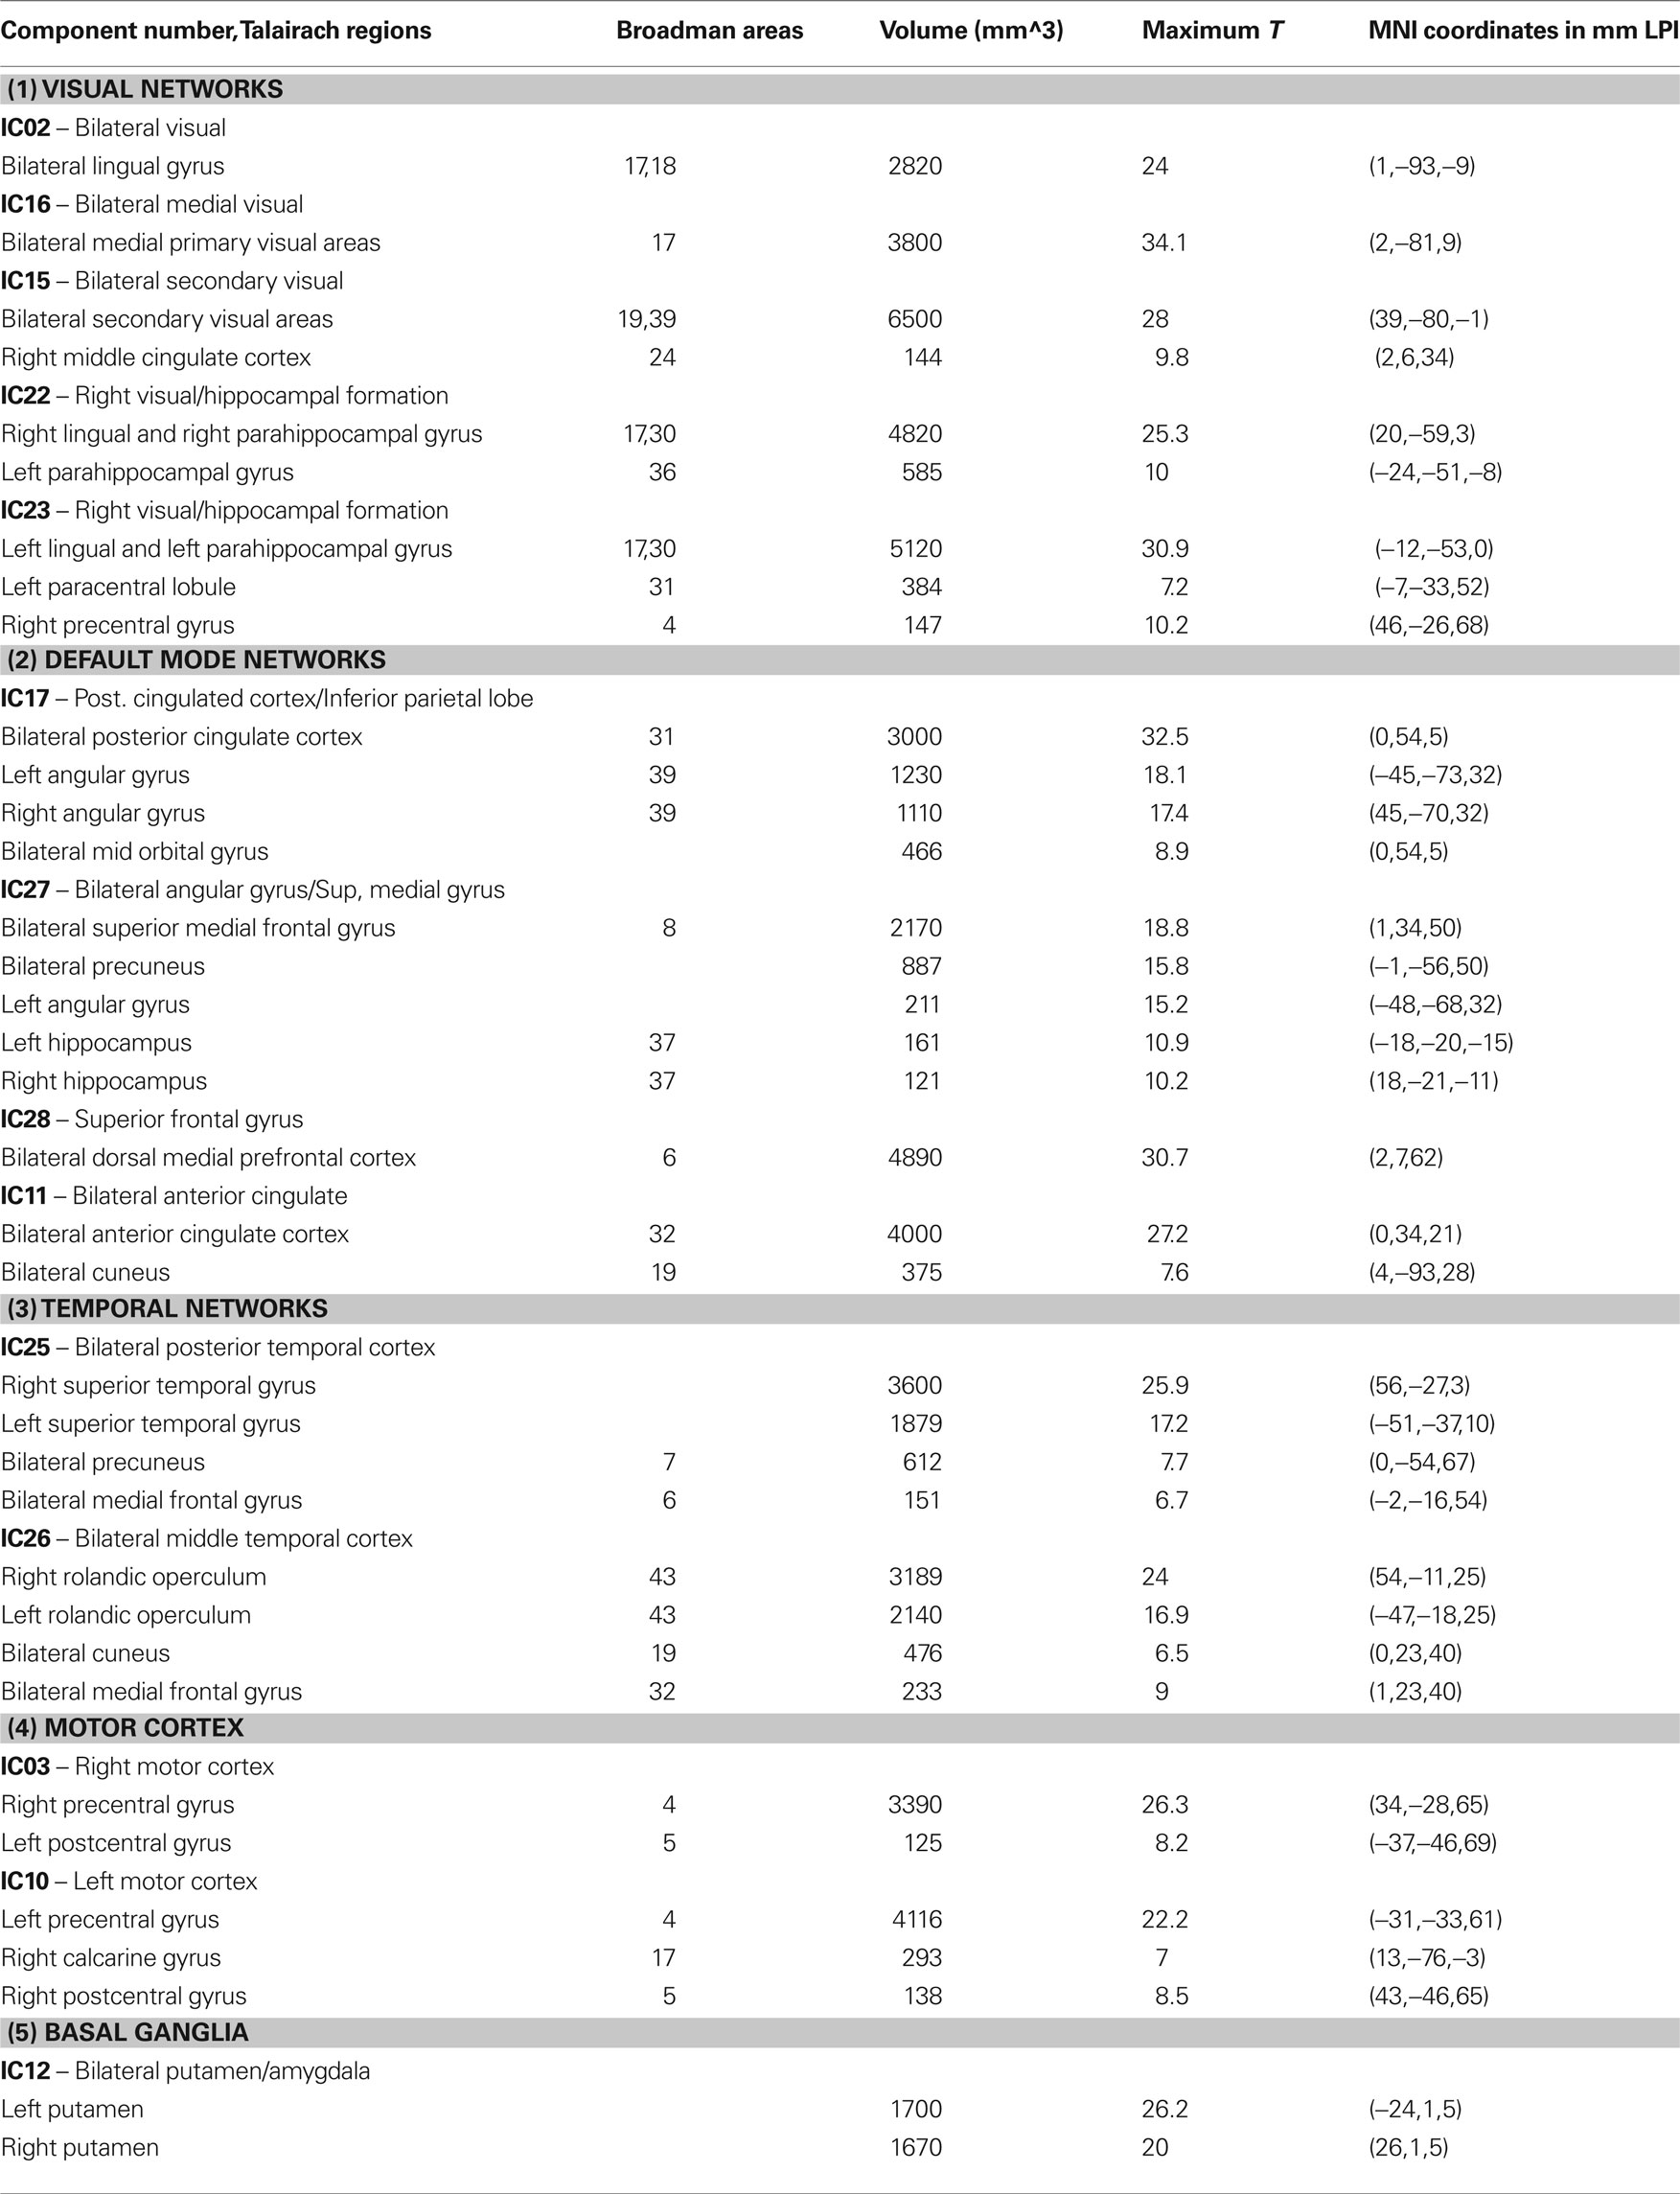
Table 1. Rresting-state networks obtained from group ICA. Clusters of at least 120 voxels at a threshold t > 5 are reported.
An increased power density at a frequency can be caused by higher within network connectivity at that frequency. In addition, higher power density at a frequency makes it easier to detect connectivity between networks associated with that frequency. The ICA time course has contributions from the whole brain weighted by the ICA spatial map. For simplicity we assume that there are only two voxels and two frequencies present. The ICA time course can then be expressed as  , where k indexes spatial location, and the signal has energy at two frequencies. The power spectrum has two peaks, one at ω0, with a height
  and another at 2ω0 with a height
  . If we further assume that amplitudes are all equal to one, then P1 = 1 + cos(α1−α2) and P2 = 1 + cos(β1−β2). cos(α1−α2) and cos(β1−β2) are the correlation coefficients between the signals at the two voxels, and at the two frequencies respectively. If α1−α2 = 0, then P1 = 2, and if β1−β2 = π, then P2 = 0. In other words, with equal contributions from different voxels, the total energy will be higher at a frequency where the contributions are coherent. This shows that a stronger within network connectivity at a frequency can lead to a higher power spectrum peak for that frequency. Unfortunately we cannot conclude the reverse. If the power spectrum has higher energy at some frequency, we cannot conclude that the within network correlations are higher at that frequency.
Another advantage of a signal with higher energy is that in the presence of noise, the accuracy of correlation coefficient calculation increases for higher signal amplitudes. The correlation coefficient between A1cos(ω0t+α1)+θ1(t) and A2cos(ω0t+α2) is cos(α1−α2) if noise θ(t) is zero. On the other hand, the correlation coefficient tends to zero with increasing noise variance. Thus in the absence of noise, the signal amplitude does not matter for correlation calculations; but with noise, a higher signal-to-noise ratio improves accuracy of correlation coefficient estimates, making it easier to detect connectivity.
Two sample t-tests (assuming unequal variance) were performed to investigate the effects of age and prematurity on power spectrum differences. Significant p-values are reported after correcting for multiple comparisons using false discovery rate (FDR) (Benjamini and Hochberg, 1995 ). Significance of the observed effect was also verified by permutation tests. Subject group membership was randomly permuted 10000 times and null distribution of group differences was obtained. The probability of observed difference given the empirical null was obtained. This p-value was corrected for multiple comparisons.
Functional Connectivity
To assess the strength of functional connectivity within an ICA network across groups, two sample t-tests (assuming unequal variance) were performed on the spatial maps to test age and term related differences. To restrict the search space, first a one-sample t-test for a given spatial map was performed for the corresponding group. For example to test term related effect in the 18-month kid group, for each ICA spatial map a one-sample t-test was performed on all of the 18-month kid’s data. This map was thresholded at a FDR corrected p < 0.05 value and all the positively active voxels in this thresholded map were used to define a mask. The two sample t-tests for that independent component were then performed within these voxels. The resulting maps were thresholded at an FDR corrected value of p < 0.05.
Functional Network Connectivity
The 14 (manually selected) resting-state networks were divided into the following five functionally defined major groups with sub-networks. These being: (1) Visual networks, (2) Default mode networks, (3) Temporal network, (4) Motor network, and (5) Basal ganglia. These are discussed in Table 1 .
We computed correlation between each pair of ICA time courses (Jafri et al., 2008 ). These correlation values were converted to z-scores using Fisher’s Z transform [z = 1/2ln(1+r)/(1−r)], and two sample t-tests were performed on these z-scores to probe age and term related effects. In order to calculate the group mean correlation, we averaged the Z-scores and back calculated the correlation. The results of differences in correlations between different groups are presented similarly. We calculate the Z-score for the group mean difference and for presentation convert it back to a correlation.
There is considerable discussion in the literature in merits of simply averaging the untransformed correlations (Schmidt-Hunter method, Schmidt and Hunter, 1999 ) or averaging the Z-scores after transformation. We believe that both the methods will give similar results. Monte-Carlo simulation studies have shown that Schmidt-Hunter method results in estimates with an under-bias and the Fisher’s transform method leads to a slight over-bias (Law, 1995 ). Even for the Schmidt-Hunter method the significance is tested by using Fisher’s Z transform. The conversion of Z-score back to a correlation is less common but has been used previously in fMRI data analysis (see Gao et al., 2009 ).
Region of Interest Analyses
Additionally region of interest (ROI) based connectivity analysis was also performed. One-sample t-tests were performed on the 14 group ICA networks. These maps were thresholded at an arbitrary value of t > 5 and clusters of at least 80 contiguous voxels were obtained. A total of 44 regions of interest (ROIs) were obtained from all of the 14 independent components. A multiple regression was performed on each subject’s preprocessed BOLD fMRI data with their estimated motion parameters and their WM and CSF signals as regressors and residuals were obtained. ROI time courses for the clusters defined above were obtained by weighted average of these residual fMRI time series, free of physiological and motion artifacts, within voxels of each cluster. The weighting factor, a value in the range 0–1, was obtained by scaling the contribution or loading value of the voxel in the cluster with respect to all the voxels in the spatial map that survived a threshold of t > 5. Correlation matrices between these ROI time courses were computed for each subject. This resulted in 946 correlations per subject. These values were Fisher Z transformed. PCA was performed on the Fisher Z transformed correlation matrix of all subjects (946 × 47 matrix). The loading parameters/principal component coefficients of first and second eigenvectors were used to probe for age and term related effects. For visualization, correlation matrix projected into first two eigenvector spaces is plotted. The loading values for each group were plotted in the inset of these figures. Also the mean difference Fisher Z transformed maps between full-term and pre-term infants at 18 months and 36 months were obtained. These maps were inverse Z transformed to obtain a mean difference in correlation strength across groups and plotted.
Results
Spatial Maps
All of the children at 18 and 36 months exhibited well developed resting-state networks. Except for the right and left lateral fronto-parietal networks, we found all other major RSNs found in adults. The children exhibited a sub-cortical RSN (IC12) not seen in the adult population. The hippocampal formation is usually considered as part of the DMN. In our ICA analysis it manifested within the component consisting of primarily visual regions (IC22 and IC23). The spatial maps of RSNs are summarized in Figure 1 , and Table 1 summarizes the network properties with their functional grouping. The volumes in Table 1 were calculated by thresholding the spatial maps at an arbitrary value of t > 5 and retaining clusters of at least 80 contiguous voxels.
To compare the functional connectivity differences within each IC, we performed two sample t-tests with subjects as random factor probing the differences in spatial extent of independent component networks with age or term. Our data revealed that spatially IC’s were similar between pre-term and full-term children at both ages. However, a main effect of age was observed (p < 0.05 whole brain FDR corrected) in IC02, the bilateral visual cortex and IC12, basal ganglia including bilateral amygdala and putamen (Figure 2 ).
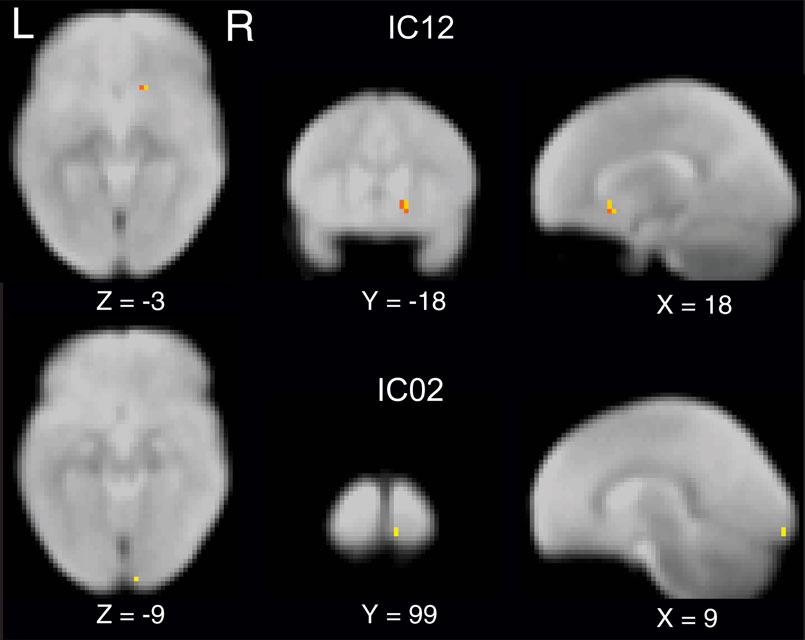
Figure 2 Independent component maps depicting significant age related differences in two sample random effects analysis. Maps are thresholded at a whole brain voxelwise FDR corrected p < 0. 05.
Time Courses
The power spectrum of the temporal response for each network was compared for group differences across subjects. The signal power had a maximum in the range (0.02–0.05 Hz) for all subjects. This supports the trend in resting-state analysis to filter the data below 0.1 Hz. The signal power in the low frequency range (0.01–0.06 Hz) was higher in pre-term infants at FDR corrected p < 0.05 than term born infants at 36 months in IC12, bilateral amygdala, and putamen (Figure 3 ). Although there was a trend for signal power in the low frequency range (0.01–0.06 Hz) to be higher in pre-term infants in several RSNs, we did not see significant differences. A similar comparison was done comparing 18-month and 36-month-old infants. No age dependent differences were observed in the spectral power of respective IC time courses. Differences between the time course spectral properties for the sedated and unsedated children were compared for the 18-month and the 36-month group and no significant differences were found. The signal power in the low frequency range (0.01–0.06 Hz) was higher in pre-term infants even after the sedated children were removed.
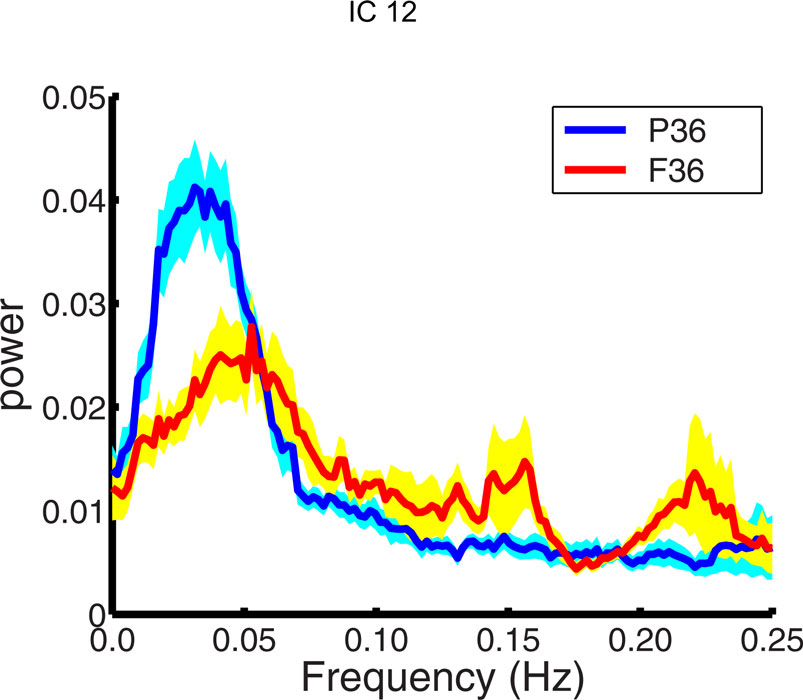
Figure 3. Spectral analysis of ICA time courses of basal ganglia (IC12) component. Plotted here is the mean spectral power for pre-term children (blue) at 36 months along with their standard errors (cyan) and mean spectral power for full term children (red) at 36 months along with their standard errors (yellow).
Functional Network Connectivity Based on ICA Components
Functional network connectivity between two independent components was defined as the correlation between their time courses. A correlation matrix between each pair of 14 ICA components was calculated and is shown in Figure 4 A. Only the lower half of the correlation matrix excluding the diagonal is shown. The ICA components have been ordered according to the groups indicated in Table 1 (Visual, DMN, Motor, Temporal, and the Basal Ganglia region). We probed for differences in correlation between these sub-networks as a function of prematurity. The results are summarized in Figure 4 B. In the default mode networks, we did not observe any significant difference in correlation between the pre-term and term born children nor did we observe any age related effects. In the visual network the pre-term children had higher correlation between the Bilateral secondary visual (IC15) and the Bilateral medial visual (IC16) (p = 0.03, FDR corrected) at 18 months. For the temporal/motor network there was significantly higher correlation in pre-term infants between left motor cortex (IC10) and the bilateral posterior temporal cortex (IC25) at 18 months and at 36 months of age (p < 0.05, FDR corrected). Connectivity differences between the sedated and unsedated pre-term children were studied for the two age groups. The difference in mean correlation values is plotted for 18-month group (Figure 5 A) and 36-month group (Figure 5 B). Since the number of unsedated children is low, significance of differences was assessed using a permutation test. The cells which depict significant correlation differences after multiple comparison correction are enclosed in a black square. The effect of sedation seems to be more in the 18-month children. None of the correlation strength differences reached significance for 36-month group.
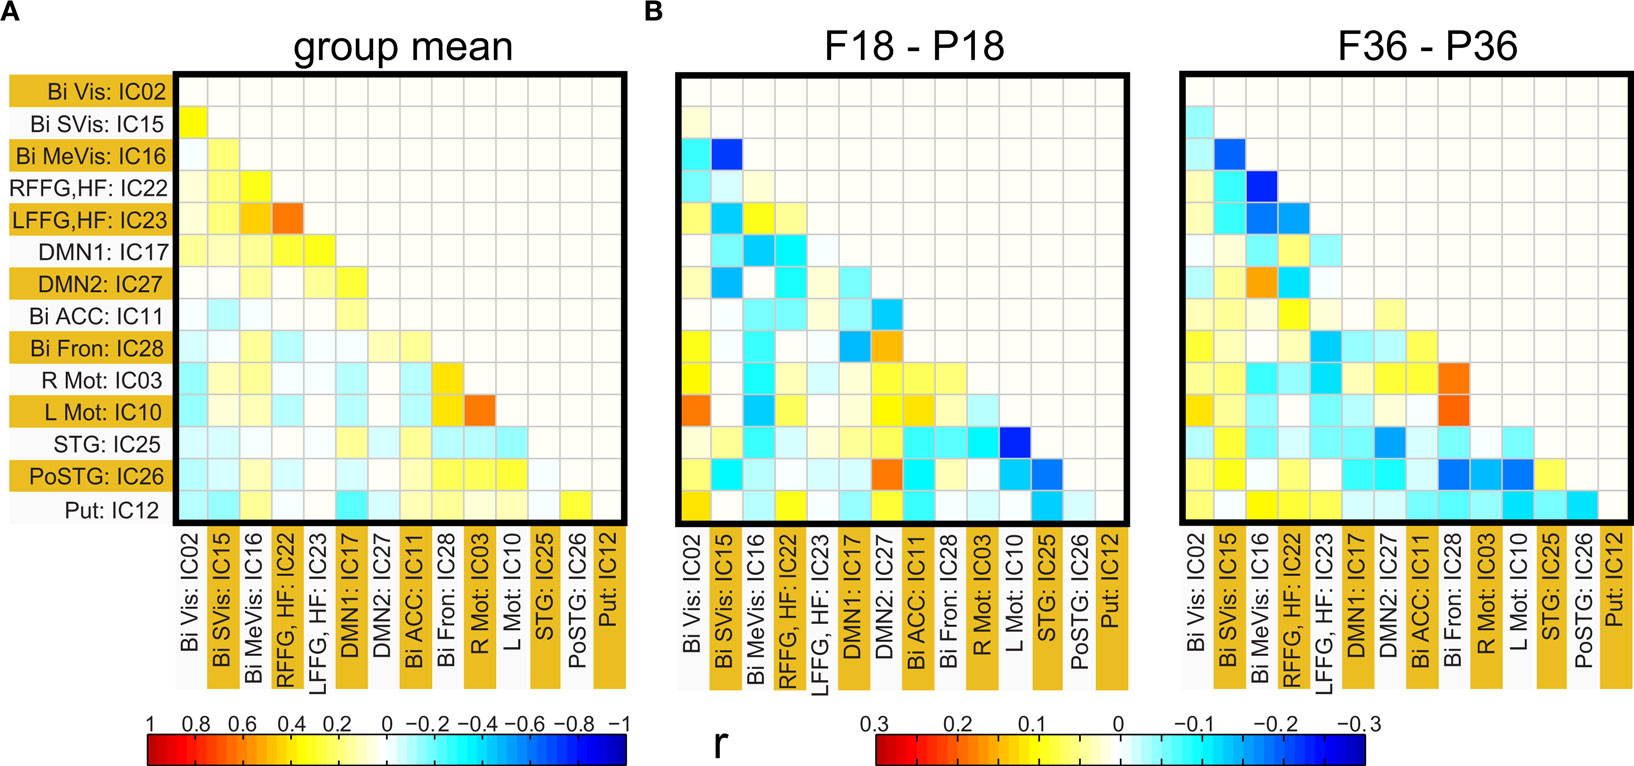
Figure 4. (A) Group functional network connectivity map: Map of correlations between ICA time courses were Fisher Z transformed and averaged across all subjects. The resultant values are inverse Z transformed to obtain mean group correlation. (B) Mean difference in connectivity (correlation) between full term and pre-term children at 18 months (left panel) and at 36 months (right panel).
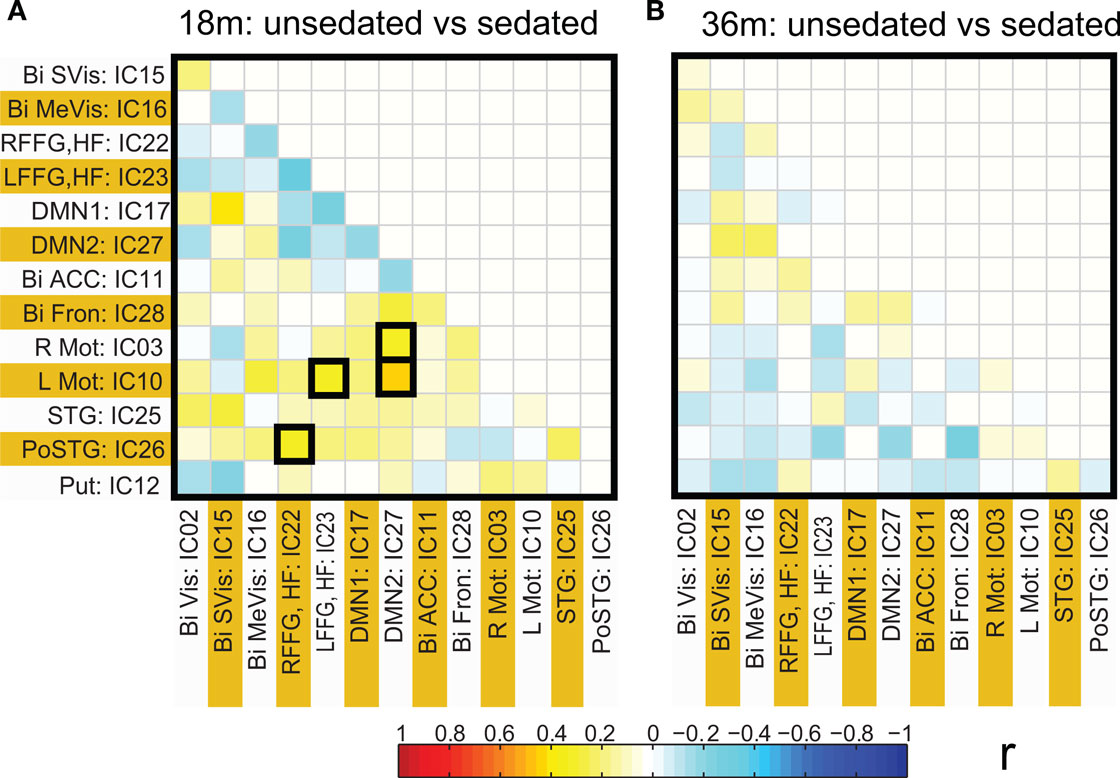
Figure 5. Connectivity differences in ICA based functional connectivity between pre-term unsedated and sedated children for the 18-month (A) and the 36-month (B) groups. The cells with significant connectivity differences (p < 0.05 after FDR correction) are enclosed in black squares. No significant differences were observed for the 36-month group.
Functional Network Connectivity Based on ROI Analysis
Spatial clusters obtained from independent component analysis were used to define ROI’s. Mean ROI time courses were computed from each subject’s preprocessed fMRI time courses that were orthogonalized with respect to their motion parameters, CSF and WM signals. We then investigated the effects of prematurity and age in the correlation between these time courses. Figure 6 A depicts the overall correlation between these ROI time courses collapsed across all subjects and the corresponding regions are indicated in Figure 6 B. Time courses were arranged such that neighboring brain areas are placed closer in the matrix. A strong positive correlation can be observed among different visual areas and also among motor networks. Also positive correlation exists between visual and motor networks, and motor and frontal networks. Results from the PCA of subject specific correlation matrices are presented in Figures 7 A,B. The PCA we did is a variant on the standard PCA. In the standard analysis the subjects would be the number of samples and the mean would be subtracted across subjects. We changed the roles of samples and their attributes, with the mean along the attributes, the column of the correlation matrix (946 × 47) matrix being subtracted. This has the effect of the first principal component score (Figure 7 A) reflecting the pattern of a shifted group mean plot (Figure 6 ). The corresponding subject loadings (inset Figure 6 A) did not show any difference across groups. The second principal component score represents modulation or variances in the connectivity among different regions. Here a main effect of prematurity in the group loadings (inset Figure 7 B) is evident (p = 0.009). The unsedated subjects in the premature group are marked with fill in the dots. The observed difference in loadings is preserved in the 36-month children as most of the unsedated kids fall in the same distribution as the sedated kids do. Insights into the second principal component score map can be obtained from the group differences in the correlation maps between pre-term and full-term kids depicted in Figures 8 A,B for ages 18 months and 36 months respectively. It should be noted that stronger connectivity among visual areas in pre-term infants compared to full terms at both ages, a stronger connectivity among visual and motor networks and motor and frontal regions in full-term infants compared to pre-term infants is reflected in the second PCA score. The third principal component score mainly corresponded to regions of weak correlations (values of r < 0.1) in mean correlation matrix shown in Figure 6 . So the third and higher PCA components were not considered for further analysis. Connectivity differences between sedated, and unsedated pre-term children was studied for the two age groups (Figure 9 ). A trend of stronger connectivity differences between sedated and unsedated children is apparent in the 18-month group, but not in the 36-month group. None of the differences survived multiple comparison correction.
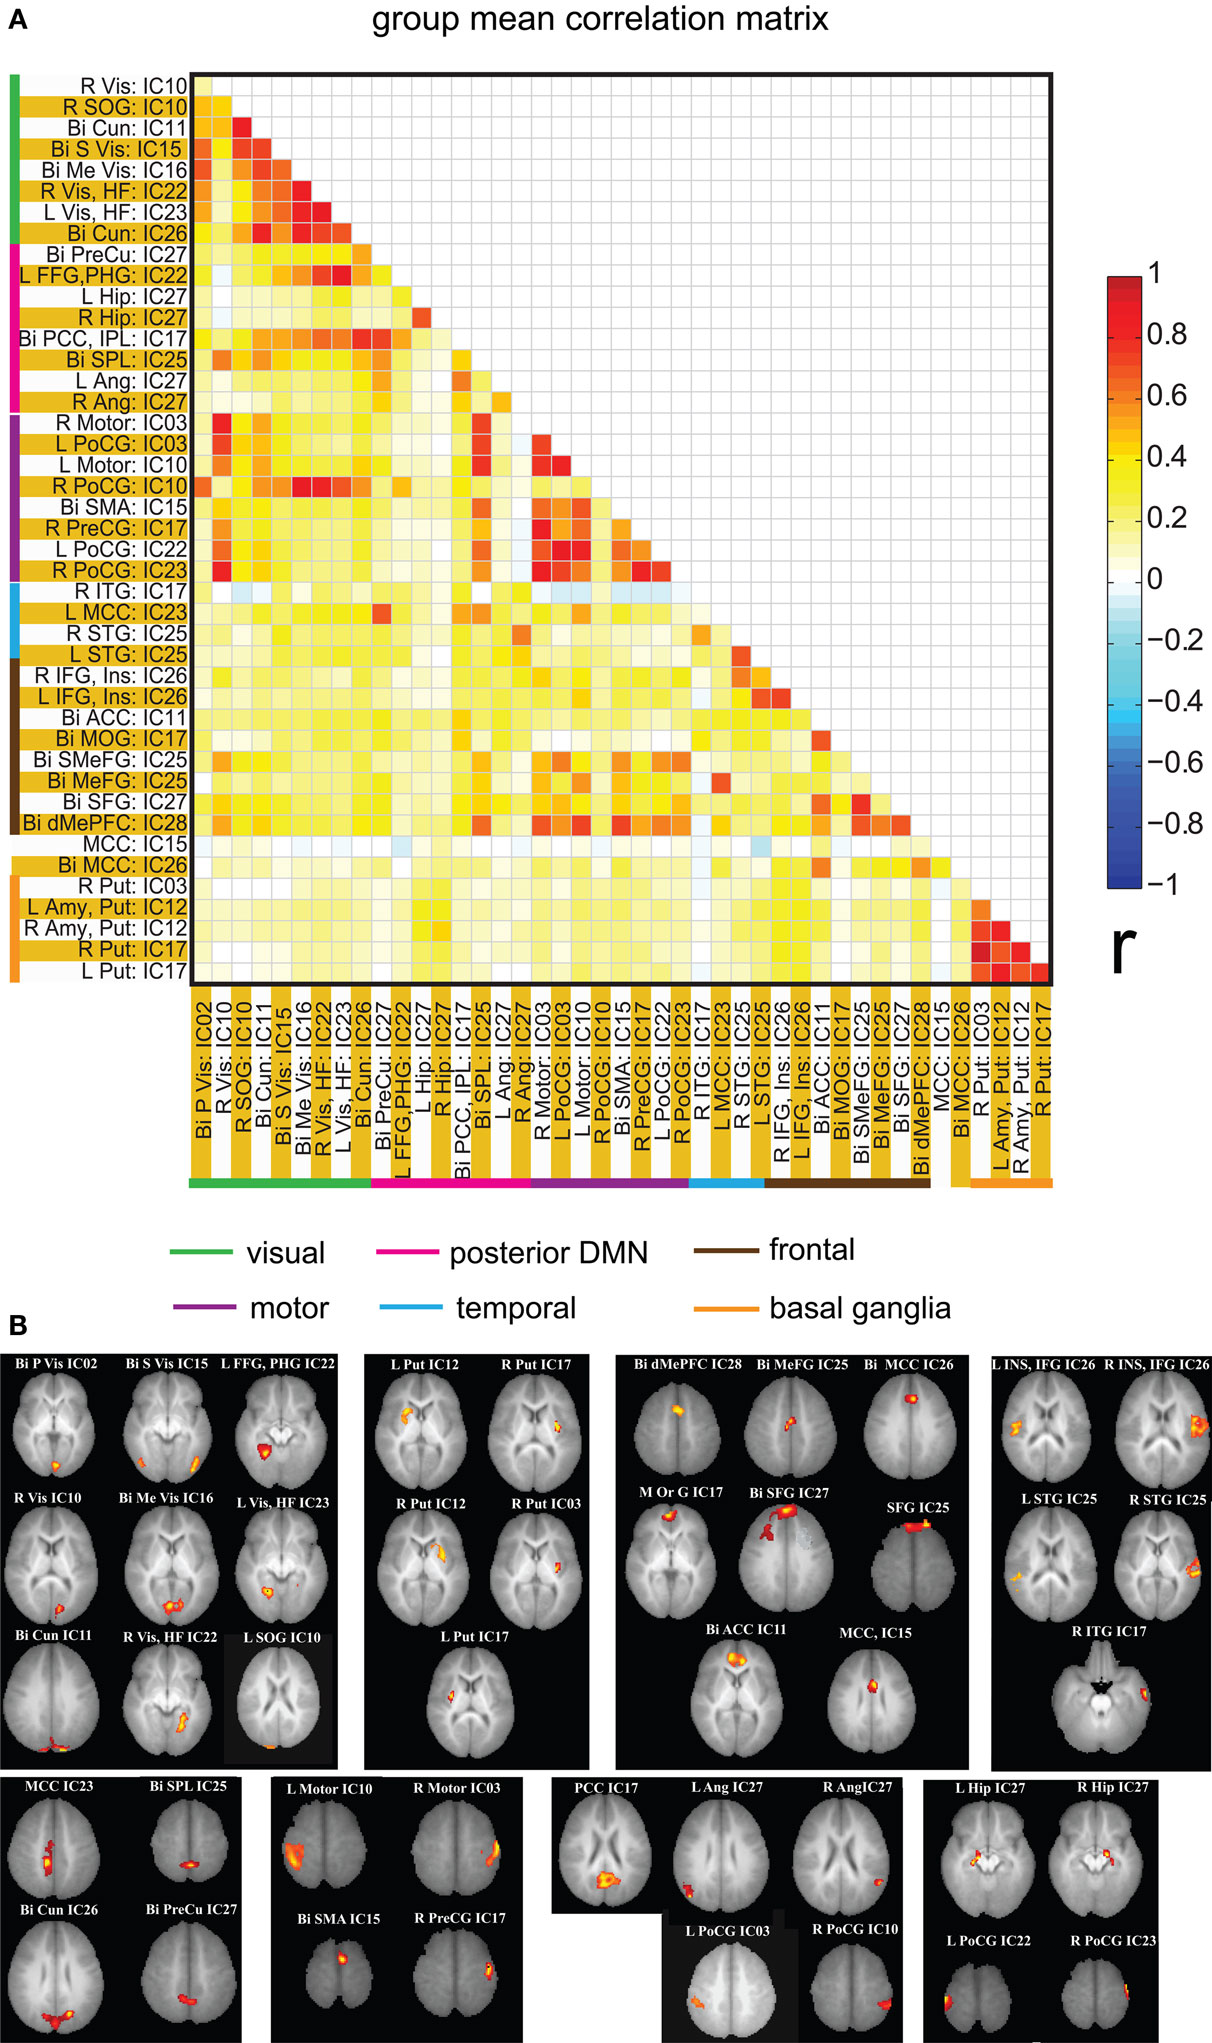
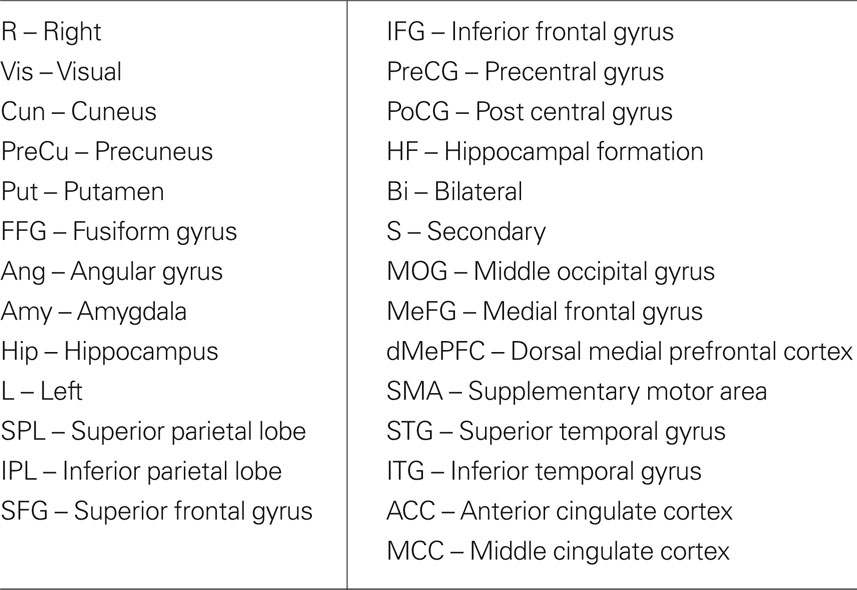
Figure 6. (A) Mean correlation matrix of the all the subjects for all of the ROI pairs. The correlation values obtained for each pair were Fisher Z transformed, averaged across all of the subjects and finally inverse Fisher Z transformed to obtain a mean correlation value for each pair. The color coding next to ROI labels shows the grouping of regions based on their location in brain. Abbreviations of labels are listed in Table 2 and the brain regions are displayed in (B). (B) Brain maps depicting the weighted ROI masks used in ROI analysis.
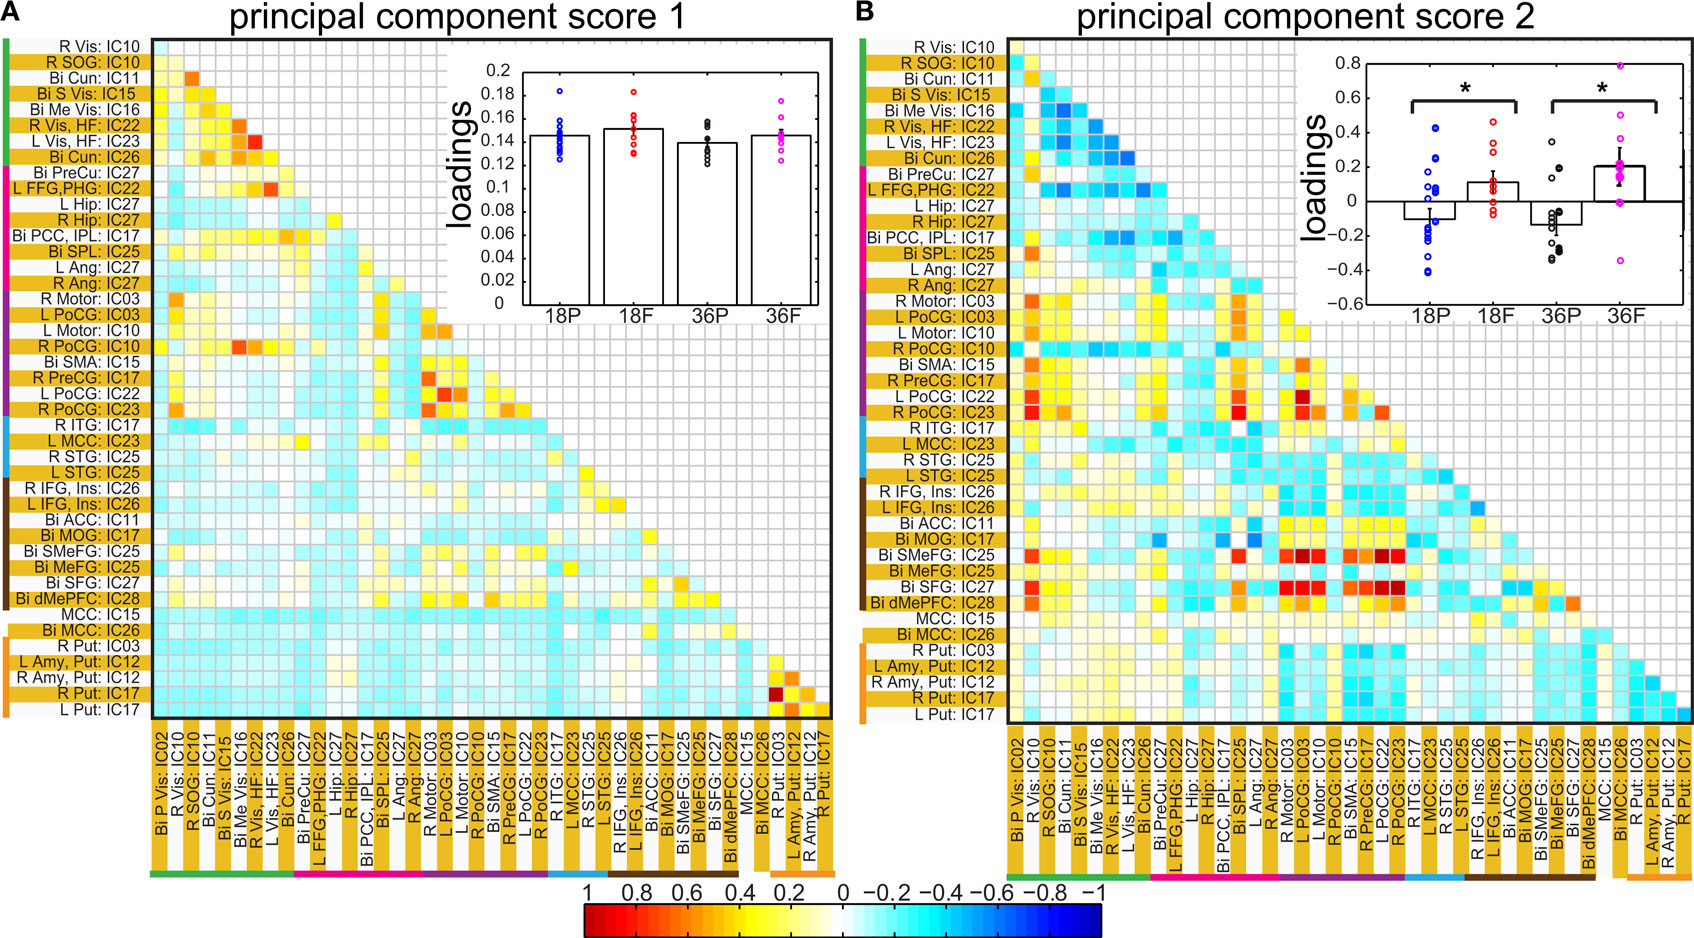
Figure 7. Principal component analysis results: Individual correlation values of all of the subjects projected into first (A) and second (B) principal component space. The insets in each panel show bar graphs of group mean loadings with standard errors for each of the four groups for the corresponding component score. Subject specific loadings are plotted in circles overlaid on top of bar graphs. * represents significant difference between pre-term and full term groups for corresponding age groups. In inset of (B), for the pre-term group, loadings for unsedated children are displayed in filled circles shifted slightly to the right.
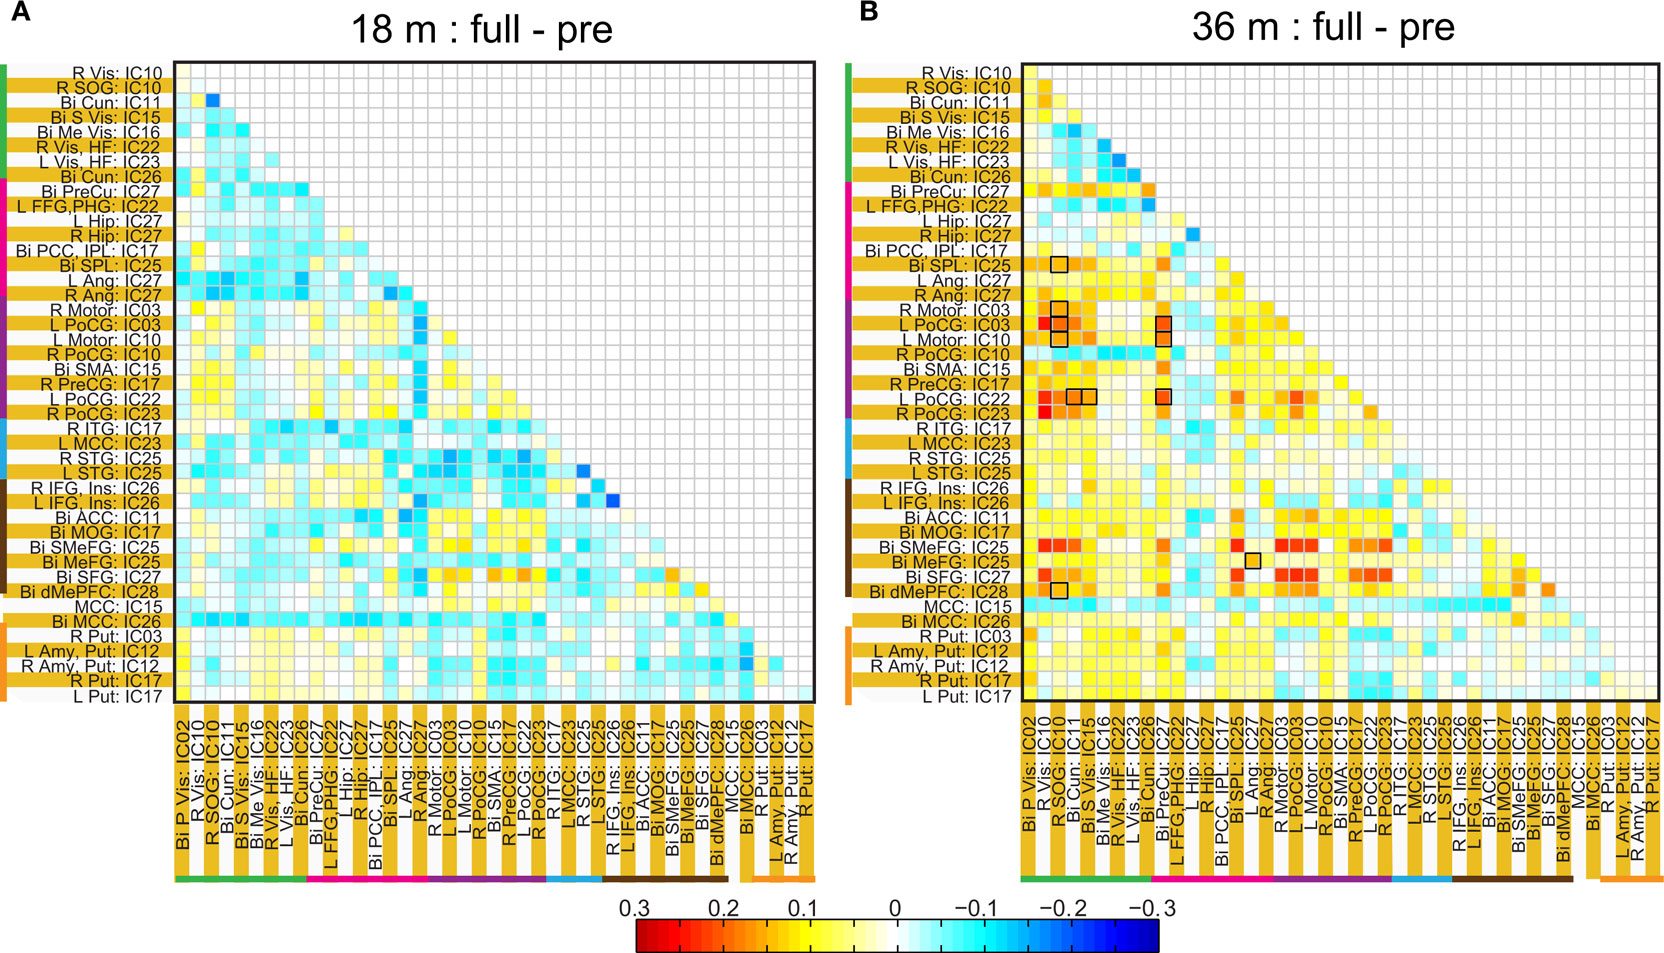
Figure 8. Difference in ROI based group average correlation maps between full-term and pre-term children at age 18 months (A) and at 36 months (B). The cells enclosed in black square represent, significant connectivity difference between groups based on a two sample t-test assuming unequal variance and surviving and FDR corrected threshold of p < 0.05.
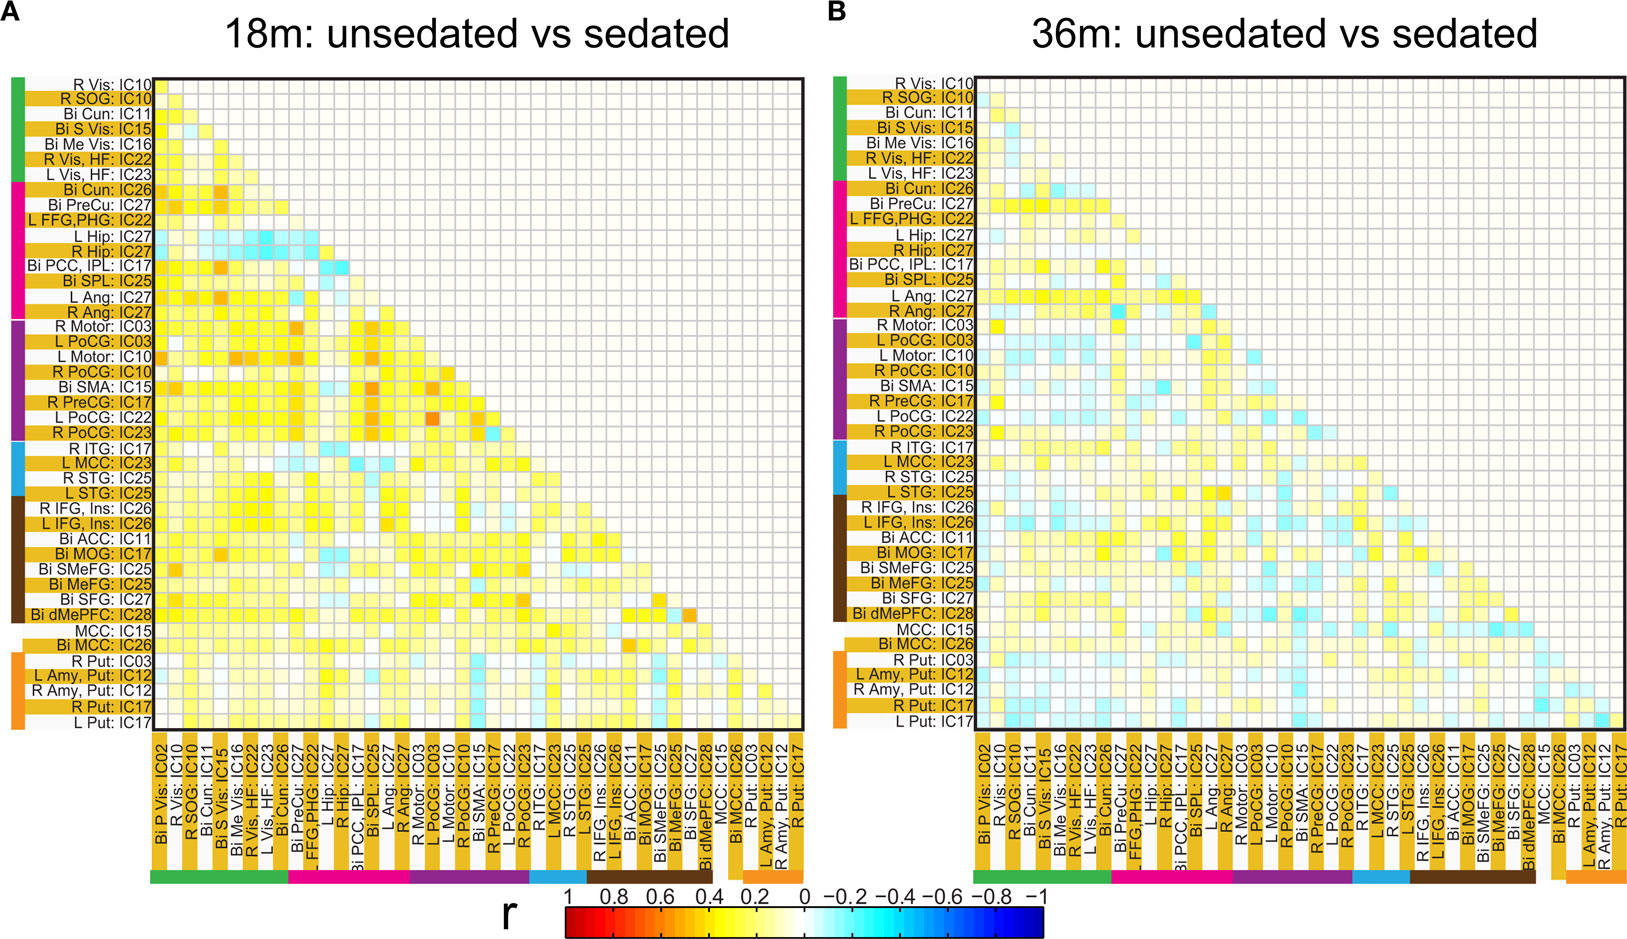
Figure 9. Connectivity differences in the ROI based functional connectivity between pre-term unsedated and sedated children for the 18 month (A) and the 36 month (B) groups. Although no significant differences were observed at an FDR corrected p < 0.05 for either groups, a trend towards higher connectivity for unsedated children was observed for 18-month group as compared to sedated children.
Discussion
The effects of prematurity and age on the RSNs of children at 18 and 36 months was investigated. Our group independent component analysis yielded RSNs similar to those observed in adults. Visual (Figure 1 A), default-mode (Figure 1 B), temporal (Figure 1 D) and motor networks (Figure 1 E) consistently observed in adults (for reference see Figure 1 in both Damoiseaux et al., 2006 ; Calhoun et al., 2008 ) were present as early as 18 months. The fronto-parietal network (Figures 1C,D Damoiseaux et al., 2006 ), which is usually lateralized in adults is not present in our data. This network is consistently shown to be involved in active memory tasks and may not be present prior to 3 years of age. We observed an additional network in the basal ganglia that encompasses caudate nucleus, putamen and amygdala. This is consistent with the recent finding by Fransson et al. (2009) who observed the network in term born infants scanned when they were sleeping naturally. The sensorimotor component (Figure 1 E) showed predominant hemispheric lateralization with a small but significant cluster in contralateral hemisphere. This is supported by a recent study by (Liu et al., 2008 ) in which they observed the same unilateralization of the network in 9 out of 11 infants scanned at 12 months. This effect is speculated to be mediated by the breakdown of effective cortical connectivity in the motor cortex during certain stages of sleep.
The same spatial maps existed in premature as well as term born children at both ages suggesting a similar pattern of network development. This finding should be interpreted with caution, however, as only premature children with normal development and normal brain structures were included. Therefore this may only suggest that prematurity per se does not interfere with the normal process of functional brain network development. Development of functional brain networks may indeed be affected by lesions sometimes associated with prematurity (such as periventricular leukomalacia or intraventricular hemorrhage), or with more subtle injury resulting in cognitive deficits that are not clinically apparent until subjects are older.
The role of different frequency bands towards functional connectivity in adults has been previously studied (Wu et al., 2008 ). They showed that 0.01–0.06 Hz band demonstrated strong cortical connections, while connections between limbic structures was distributed over a wider frequency range (0.01–0.14 Hz). Although we did not compare the role of different frequency bands towards functional connectivity we did see higher power density in the 0.01–0.06 Hz band in pre-terms at 36 months of age in amygdala and putamen regions (Figure 3 ).
The two methods of calculating network connectivity (ICA components and hybrid ROI approach) gave similar group mean connectivity patterns as seen by comparing Figures 4 A and 6 . One difference between them was that there were considerable more negative correlations present with the ICA method. The similarity is remarkable and one reason for the differences can be that the ICA spatial maps extend over the whole brain and can in part be negative. In the ROI method we obtained the regions from only the positive part of the ICA map which had a t-value >5. The patterns for the difference between premature and full-term children were also similar with two methods (compare Figures 4 B and 8 ). In the visual area the premature children had higher connectivity at both 18 months and 36 months of age with both methods of analysis. However, regions with statistically significant network connectivity were different between the two methods. In the ICA method we found significant differences in connectivity only in the visual area and between the temporal and the motor cortex, while with the hybrid ROI method we found significant differences in motor – frontal and the motor – visual areas.
A significant difference we found was stronger connectivity in the resting-state networks in term born children at 36 but not 18 months of age compared to former premature children. This was consistently identified in the two strongest networks present: motor – frontal and motor – visual networks (Figure 7 ). Prior work by Chugani (1998) using PET scans in the first year of life showed regional changes in cerebral metabolism that occurred starting in the primary sensory motor cortex and deep gray matter (newborn) to parietal lobes (3 months) to frontal lobes (8 months). A somewhat similar pattern of myelination occurs, with primary sensorimotor and visual pathways myelinating before parietal and finally frontal lobes (for review see Marsh et al. (2008) ). It is of interest that networks involving the motor (and possibly premotor) and visual areas were the strongest we identified, raising the possibility that resting-state network development, although occurring later, follows a similar pattern as does early brain metabolism and myelination. In our subjects there was consistently stronger network connectivity in the term born children compared to premature children. Thus, the connectivity, not simply the presence, of resting-state networks may be particularly sensitive to the effects of prematurity.
Only minor effects of age were observed spatially in our group of children between 18-months and 36-months old. The children at 36 months exhibited a stronger contribution to visual cortex and basal ganglia components compared to 18-month sample. Similarly, the only difference in the time course of the premature and the term born infants was in the basal ganglia network. It should be pointed out that our conclusions are dependent on our methods of analysis. Our method of back-projection of group spatial ICA maps and time courses to individual subjects does preserve differences but enhancing differences is not the primary objective in the initial PCA data reduction step and subsequent ICA analysis. Alternate methods which incorporate prior information about the subject’s group are being developed and may increase sensitivity to group differences (Sui et al., 2009a ,b ).
Our ROI based functional connectivity analysis was based on regions-of-interest being defined by ICA spatial maps. We avoid selecting ROIs based purely on anatomical considerations, or some form of atlas. Instead we use the data itself to define functionally connected regions. We treat ICA as a means of cluster analysis, where disjoint brain regions are identified with correlated BOLD response. An advantage of this hybrid ROI approach is that by decomposing an ICA network into smaller contiguous clusters allows us to define connectivity between regions whose function is known from prior work. Our method is not based on pre-defined atlas with sharp boundaries but clusters and the associated weighting function obtained from the data itself. Thus functional associations in the data are preserved and the data defines the location and weighting of the cluster. A disadvantage of this ICA based cluster definition is that we have not taken any advantage of ICA’s filtering properties. In ICA the time course of one voxel is factored into multiple time courses which can be shared between different ICA networks and those associated with noise get factored out into separate components. In the proposed hybrid method we do not have this advantage and each voxel’s time course had to be further filtered to remove effects of physiological noise. The hybrid method does use ICA to calculate the fractional contribution of each time course to the mean cluster time course.
A problem with our approach is that we have used the same data sets for doing the ICA analysis and selecting the ROIs and then doing a ROI based connectivity analysis on these regions (Kriegeskorte et al., 2009 ; Vul et al., 2009 ). If validation of the ICA method was our goal then our results would have been stronger if the groups we had used for identifying clusters were based on one group of subjects and then the ROI analysis for these clusters done on a separate group of subjects. The present analysis is valid to show that the clusters found by ICA also show high correlations for the same subjects even when the time courses are pulled directly from the input data. This is interesting because the ICA algorithm is based on mutual information cost function and does not directly use correlations as basis of optimization. Thus it is important to understand the differences between the meaning of correlations obtained from the time courses corresponding to ICA maps and correlations obtained directly from the input data based on a cluster. This consistency of the correlations between the two different time courses is intuitively expected but additional work needs to be done to tie down the connection between the two approaches.
In order to address the problem of sedation we have looked at the spectral properties of the time courses and found no difference in the energy distribution. Some differences were found in the functional connectivity of sedated and unsedated pre-term children. We found a trend for stronger connectivity in unsedated pre-term children as compared to sedated children for the 18-month group. No such differences were found for the 36-month group. Although the amount of chloral hydrate administered was the same proportion of the child’s weight, the previous observation may indicate that at the younger age of 18 months the children were more sensitive to sedation. Our results presented for the 36-month group for the time course spectral energy and the difference in connectivity between pre-term and term children was not changed by considering sedation.
Our results suggest that the anatomical locations of the RSNs are well developed by 18 months of age and their spatial locations are not distinguishable between premature and term born infants at 18 months or at 36 months, with the exception of small spatial differences noted in the basal ganglia area and the visual cortex. The two major differences between term and pre-term children were present at 36 but not 18 months and include: (1) increased spectral energy in the low frequency range (0.01–0.06 Hz) for pre-term children in the basal ganglia component, and (2) stronger connectivity between RSNs in term children. We speculate that children born very prematurely are vulnerable to injury resulting in weaker connectivity between resting-state networks by 36 months of age. Further work including longitudinal studies of brain-behavioral relationships will be necessary to determine whether the resting-state networks connectivity properties may indeed be early markers of brain injury associated with prematurity.
Conflict of Interest Statement
The authors declare that the research was conducted in the absence of any commercial or financial relationships that could be construed as a potential conflict of interest.
Acknowledgments
We thank Susann Duvall, Erica Montague, Lynette Silva, Catherine Smith, and Diana South for their help in scanning the children at night. This work was supported by an internal grant from The Mind Research Network and NIH grant R01 EB000840 to Dr. Calhoun.
Footnotes
References
Altaye, M., Holland, S. K., Wilke, M., and Gaser, C. (2008). Infant brain probability templates for MRI segmentation and normalization. Neuroimage 43, 721–730.
Anderson, P., and Doyle, L. W. (2003). Neurobehavioral outcomes of school-age children born extremely low birth weight or very preterm in the 1990s. JAMA 289, 3264–3272.
Anjari, M., Srinivasan, L., Allsop, J. M., Hajnal, J. V., Rutherford, M. A., Edwards, A. D., and Counsell, S. J. (2007). Diffusion tensor imaging with tract-based spatial statistics reveals local white matter abnormalities in preterm infants. Neuroimage 35, 1021–1027.
Beckmann, C. F., and Smith, S. M. (2004). Probabilistic independent component analysis for functional magnetic resonance imaging. IEEE Trans. Med. Imaging 23, 137–152.
Benjamini, Y., and Hochberg, Y. (1995). Controlling the false discovery rate: a practical and powerful approach to multiple testing. J. R. Stat. Soc. Series B Stat. Methodol. 57, 289–300.
Binder, J. R., Frost, J. A., Hammeke, T. A., Bellgowan, P. S., Rao, S. M., and Cox, R. W. (1999). Conceptual processing during the conscious resting state. A functional MRI study. J. Cogn. Neurosci. 11, 80–95.
Biswal, B., Yetkin, F. Z., Haughton, V. M., and Hyde, J. S. (1995). Functional connectivity in the motor cortex of resting human brain using echo-planar MRI. Magn. Reson. Med. 34, 537–541.
Buckner, R. L., Andrews-Hanna, J. R., and Schacter, D. L. (2008). The brain’s default network: anatomy, function, and relevance to disease. Ann. N. Y. Acad. Sci. 1124, 1–38.
Bullmore, E., and Sporns, O. (2009). Complex brain networks: graph theoretical analysis of structural and functional systems. Nat. Rev. Neurosci. 10, 186–198.
Calhoun, V. D., and Adali, T. (2006). ‘Unmixing’ functional magnetic resonance imaging with independent component analysis. IEEE Eng. Med. Biol. 25, 79–90.
Calhoun, V. D., Kiehl, K. A., and Pearlson, G. D. (2008). Modulation of temporally coherent brain networks estimated using ICA at rest and during cognitive tasks. Hum. Brain Mapp. 29, 828–838.
Chugani, H. T. (1998). A critical period of brain development: studies of cerebral glucose utilization with PET. Prev. Med. 27, 184–188.
Cordes, D., Haughton, V. M., Arfanakis, K., Carew, J. D., Turski, P. A., Moritz, C. H., Quigley, M. A., and Meyerand, M. E. (2001). Frequencies contributing to functional connectivity in the cerebral cortex in “resting-state” data. AJNR Am. J. Neuroradiol. 22, 1326–1333.
Cox, R. W. (1996). AFNI: Software for analysis and visualization of functional magnetic resonance neuroimages. Comput. Biomed. Res. 29, 162–173.
Damoiseaux, J. S., Rombouts, S. A. R. B., Barkhof, F., Scheltens, P., Stam, C. J., Smith, S. M., and Beckmann, C. F. (2006). Consistent resting-state networks across healthy subjects. Proc. Natl. Acad. Sci. U.S.A. 103, 13848–13853.
Erhardt, E., Rachakonda, E., Bedrick, E., Adali, T., and Calhoun, V. D. (2010). “Comparison of Multi-Subject ICA Methods for Analysis of fMRI data,” in 16th Annual Meeting of the Organization for Human Brain Mapping, 6–10 June, Barcelona, Spain.
Fair, D. A., Cohen, A. L., Dosenbach, N. U. F., Church, J. A., Miezin, F. M., Barch, D. M., Raichle, M. E., Petersen, S. E., and Schlaggar, B. L. (2008). The maturing architecture of the brain’s default network. Proc. Natl. Acad. Sci. U.S.A. 105, 4028–4032.
Fair, D. A., Cohen, A. L., Power, J. D., Dosenbach, N. U., Church, J. A., Miezin, F. M., Schlaggar, B. L., and Petersen, S. E. (2009). Functional brain networks develop from a “local to distributed” organization. PLoS Comput. Biol. 5, e1000381. doi:10.1371/journal.pcbi.1000381.
Fox, M. D., Snyder, A. Z., Vincent, J. L., Corbetta, M., Van Essen, D. C., and Raichle, M. E. (2005). The human brain is intrinsically organized into dynamic, anticorrelated functional networks. Proc. Natl. Acad. Sci. U.S.A. 102, 9673–9678.
Fransson, P., Skiold, B., Engstrom, M., Hallberg, B., Mosskin, M., Aden, U., Lagercrantz, H., and Blennow, M. (2009). Spontaneous brain activity in the newborn brain during natural sleep–an fMRI study in infants born at full term. Pediatr. Res. 66, 301–305.
Fransson, P., Skiold, B., Horsch, S., Nordell, A., Blennow, M., Lagercrantz, H., and Aden, U. (2007). Resting-state networks in the infant brain. Proc. Natl. Acad. Sci. U.S.A. 104, 15531–15536.
Gao, W., Zhu, H., Giovanello, K. S., Smith, J. K., Shen, D., Gilmore, J. H., and Lin, W. (2009). Evidence on the emergence of the brain’s default network from 2-week-old to 2-year-old healthy pediatric subjects. Proc. Natl. Acad. Sci. U.S.A. 106, 6790–6795.
Garrity, A. G., Pearlson, G. D., McKiernan, K., Lloyd, D., Kiehl, K. A., and Calhoun, V. D. (2007). Aberrant functional connectivity of the ‘default mode’ in schizophrenia. Am. J. Psychiatry 164, 450–457.
Greicius, M. D., Srivastava, G., Reiss, A. L., and Menon, V. (2004). Default-mode network activity distinguishes Alzheimer’s disease from healthy aging: evidence from functional MRI. Proc. Natl. Acad. Sci. U.S.A. 101, 4637–4642.
Hack, M., Youngstrom, E. A., Cartar, L., Schluchter, M., Taylor, H. G., Flannery, D., Klein, N., and Borawski, E. (2004). Behavioral outcomes and evidence of psychopathology among very low birth weight infants at age 20 years. Pediatrics 114, 932–940.
Himberg, J., and Hyvarinen, A. (2003). ICASSO: software for investigating the reliability of ICA estimates by clustering and visualization. In Proceedings of IEEE Workshop on Neural Networks for Signal Process, (Toulouse, France), 259–268.
Jafri, M., Pearlson, G. D., Stevens, M., and Calhoun, V. D. (2008). A method for functional network connectivity among spatially independent resting-state components in schizophrenia. Neuroimage 39, 1666–1681.
Kesler, S. R., Ment, L. R., Vohr, B., Pajot, S. K., Schneider, K. C., Katz, K. H., Ebbitt, T. B., Duncan, C. C., Makuch, R. W., and Reiss, A. L. (2004). Volumetric analysis of regional cerebral development in preterm children. Pediatr. Neurol. 31, 318–325.
Kriegeskorte, N., Simmons, W. K., Bellgowan, P. S. F., and Baker, C. I. (2009). Circular analysis in systems neuroscience: the dangers of double dipping. Nat. Neurosci. 12, 535–540.
Law, K. S. (1995). The use of Fisher’s Z in Scmidt-Hunter-type meta-analyses. J. Educ. Behav. Stat. 20, 287–306.
Liu, W.-C., Flax, J. F., Guise, K. G., Sukul, V., and Benasich, A. A. (2008). Functional connectivity of the sensorimotor area in naturally sleeping infants. Brain Res. 1223, 42–49.
Marsh, R., Gerber, A. J., and Peterson, B. S. (2008). Neuroimaging studies of normal brain development and their relevance for understanding childhood neuropsychiatric disorders. J. Am. Acad. Child Adolesc. Psychiatry 47, 1233–1251.
Ment, L. R., Hirtz, D., and Huppi, P. S. (2009). Imaging biomarkers of outcome in the developing preterm brain. Lancet Neurol. 8, 1042–1055.
Miller, S. P., Vigneron, D. B., Henry, R. G., Bohland, M. A., Ceppi-Cozzio, C., Hoffman, C., Newton, N., Partridge, J. C., Ferriero, D. M., and Barkovich, A. J. (2002). Serial quantitative diffusion tensor MRI of the premature brain: development in newborns with and without injury. J. Magn. Reson. Imaging 16, 621–632.
Raichle, M. E., MacLeod, A. M., Snyder, A. Z., Powers, W. J., Gusnard, D. A., and Shulman, G. L. (2001). A default mode of brain function. Proc. Natl. Acad. Sci. U.S.A. 98, 676–682.
Rotarska-Jagiela, A., van de Ven, V. G., Oertel-Knöchel, V., Uhlhaas, P. J., Vogeley, K., and Linden, D. E. (2010). Resting-state functional network correlates of psychotic symptoms in schizophrenia. Schizophr. Res. [Epub ahead of print].
Schmidt, F. L., and Hunter, J. E. (1999). Comparison of three meta-analysis methods revisited: an analysis of Johnson, Mullen, and Salas (1995). J. Appl. Psychol. 84, 144–148.
Smyser, C. D., Inder, T. E., Shimony. J. S., Hill, J. E., Degnan, A. J., Snyder, A. Z. and Neil, J. J. (2010). Longitudinal analysis of neural network development in preterm infants. Cereb. Cortex. doi: 10-1093/cercor/bhq035 [Epub ahead of print].
Sorg, C., Riedl, V., Muhlau, M., Calhoun, V. D., L., L., Drzezga, A., Forstl, H., Kurz, A., Zimmer, C., and Wohlschlager, A. (2007). Selective changes of resting-state networks in patients at high risk for Alzheimer’s disease – an example for profiling functional brain disorders. Proc. Natl. Acad. Sci. U.S.A. 104, 18760–18765.
Sui, J., Adali, T., Pearlson, G. D., and Calhoun, V. D. (2009a). An ICA-based method for the identification of optimal FMRI features and components using combined group-discriminative techniques. Neuroimage 46, 73–86.
Sui, J., Adali, T., Pearlson, G. D., Clark, V. P., and Calhoun, V. D. (2009b). A method for accurate group difference detection by constraining the mixing coefficients in an ICA framework. Hum. Brain Mapp. 30, 2953–2970.
Supekar, K., Musen, M., and Menon, V. (2009). Development of large-scale functional brain networks in children. PLoS Biol. 7, e1000157. doi:10.1371/journal.pbio.1000157.
Taylor, H. G., Minich, N. M., Klein, N., and Hack, M. (2004). Longitudinal outcomes of very low birth weight: neuropsychological findings. J. Int. Neuropsychol. Soc. 10, 149–163.
Thompson, D. K., Warfield, S. K., Carlin, J. B., Pavlovic, M., Wang, H. X., Bear, M., Kean, M. J., Doyle, L. W., Egan, G. F., and Inder, T. E. (2007). Perinatal risk factors altering regional brain structure in the preterm infant. Brain 130, 667–677.
Tzarouchi, L. C., Astrakas, L. G., Xydis, V., Zikou, A., Kosta, P., Drougia, A., Andronikou, S., and Argyropoulou, M. I. (2009). Age-related grey matter changes in preterm infants: an MRI study. Neuroimage 47, 1148–1153.
Vicari, S., Caravale, B., Carlesimo, G. A., Casadei, A. M., and Allemand, F. (2004). Spatial working memory deficits in children at ages 3–4 who were low birth weight, preterm infants. Neuropsychology 18, 673–678.
Vohr, B. R., Wright, L. L., Dusick, A. M., Perritt, R., Poole, W. K., Tyson, J. E., Steichen, J. J., Bauer, C. R., Wilson-Costello, D. E., and Mayes, L. C. (2004). Center differences and outcomes of extremely low birth weight infants. Pediatrics 113, 781–789.
Vul, E., Harris, C., Winkielman, P., and Pashler, H. (2009). Puzzlingly high correlations in fMRI studies of emotion, personalty, and social cognition. Perspect. Psychol. Sci. 4, 274–290.
Wilson-Costello, D., Friedman, H., Minich, N., Fanaroff, A. A., and Hack, M. (2005). Improved survival rates with increased neurodevelopmental disability for extremely low birth weight infants in the 1990s. Pediatrics 115, 997–1003.
Keywords: resting-state networks, independent component analysis, functional network connectivity, functional magnetic resonance imaging, premature children
Citation: Damaraju E, Phillips J, Lowe JR, Ohls R, Calhoun VD and Caprihan A (2010) Resting-state functional connectivity differences in premature children. Front. Syst. Neurosci. 4:23. doi: 10.3389/fnsys.2010.00023
Received: 06 February 2010;
Paper pending published: 25 February 2010;
Accepted: 19 May 2010;
Published online: 17 June 2010
Edited by:
Lucina Q. Uddin, Stanford University, USAReviewed by:
Peter Fransson, Karolinska Institutet, SwedenNico Dosenbach, Washington University in St. Louis, USA
Copyright: © 2010 Damaraju, Phillips, Lowe, Ohls, Calhoun and Caprihan. This is an open-access article subject to an exclusive license agreement between the authors and the Frontiers Research Foundation, which permits unrestricted use, distribution, and reproduction in any medium, provided the original authors and source are credited.
*Correspondence: Eswar Damaraju, The Mind Research Network, 1101 Yale Blvd NE, Albuquerque, NM 87106, USA. e-mail: edamaraju@mrn.org