 Li-chong Wang1†
 Shu-hui Chen2†
 Xiao-li Shen1Dang-chi Li3Hai-yun Liu4Yu-long Ji4Min Li5Kai Yu1Huan Yang1Jun-Jun Chen5Chong-zhen Qin6Ming-ming Luo5Qian-xia Lin4
 Qiao-li Lv7*
- 1Department of Neurosurgery, The Second Affiliated Hospital of Nanchang University, Nanchang, China
- 2Department of Radiation Oncology, Jiangxi Cancer Hospital, Nanchang, China
- 3Jiangxi University of Technology High School, Nanchang, China
- 4Jiangxi University of Traditional Chinese Medicine, Nanchang, China
- 5Jiangxi Key Laboratory of Translational Cancer Research, Jiangxi Cancer Hospital, Nanchang, China
- 6Department of Pharmacy, The First Affiliated Hospital of Zhengzhou University, Zhengzhou, China
- 7Jiangxi Key Laboratory of Translational Cancer Research, Department of Head and Neck Surgery, Jiangxi Cancer Hospital, Nanchang, China
Glioblastoma multiforme (GBM) is the most malignant glioma with a high death rate. N6-methyladenosine (m6A) RNA methylation plays an increasingly important role in tumors. The current study aimed to determine the function of the regulators of m6A RNA methylation in GBM. We evaluated the difference, interaction, and correlation of these regulators with TCGA database. HNRNPC, WTAP, YTHDF2 and, YTHDF1 were significantly upregulated in GBM. To explore the expression characteristics of regulators in GBM, we defined two subgroups through consensus cluster. HNRNPC, WTAP, and YTHDF2 were significantly upregulated in the cluster2 which had a good overall survival (OS). To investigate the prognostic value of regulators, we used lasso cox regression algorithm to screen an independent prognostic risk characteristic based on the expression of HNRNPC, ZC3H13, and YTHDF2. The prognostic feature between the low and high-risk groups was significantly different (P < 0.05), which could predict significance of prognosis (area under the curve (AUC) = 0.819). Moreover, we used western blot, RT-PCR, and immunohistochemical staining to verify the expression of HNRNPC was associated with malignancy and development of gliomas. Similarly, the high expression of HNRNPC had a good prognosis. In conclusion, HNRNPC is a vital participant in the malignant progression of GBM and might be valuable for prognosis.
Introduction
Gliomas are the most common primary malignant tumors of the central nervous system (CNS). Glioblastoma multiforme (GBM), a class IV neoplasm with astrocytic differentiation, is the most aggressive and lethal glioma (1). GBM is characterized by a poor prognosis, and people who developed a GBM had a median survival rate of < ~1 year and a high death rate (2). To date, nearly 150 types of posttranscriptional modifications have been discovered in RNA among all living organisms (3). N6-methyladenosine (m6A) RNA methylation is the most prevalent post-transcriptional modification mechanism in humans (4, 5). Its function and mechanism have not been investigated until recently, since it was discovered in the 1970s (6). The biological function of m6A modification is coordinated by multiple writers like methyltransferase-like enzymes METTL3 and METTL14, Wilms tumor 1-associated protein (WTAP), KIAA1429, RNA binding motif protein 15 (RBM15), and zinc finger CCCH-type containing protein 13 (ZC3H13), erasers like fat mass- and obesity-associated protein (FTO) and α-ketoglutarate-dependent dioxygenase AlkB homolog 5 (ALKBH5), and readers like YTH domain-containing 1 (YTHDC1), YTH domain-containing 2 (YTHDC2), YTH N6-methyl-adenosine RNA binding protein 1 (YTHDF1), YTH N6-methyladenosine RNA binding protein 2 (YTHDF2), and heterogeneous nuclear ribonucleoprotein C (HNRNPC) (7–12). The discovery of regulators increased our perception of the function of the m6A modification. M6A modification in cancer is a double-edged sword: it inhibits tumor progression in some cancers and promotes tumor progression in other cancers. It exerts vital functions in mammals, including embryonic development, neurogenesis, stress responses, sex determination, and tumorigenesis (13, 14). Studies have revealed that changes in m6A levels in glioblastoma stem cell-like cells (GSCs) seriously affect tumor growth, self-renewal, and development (15). However, the literature lacks a comprehensive analysis of the expression levels, prognostic values, and functions of m6A RNA methylation regulators in GBM.
In this study, we downloaded the original RNA-seq GBM dataset from The Cancer Genome Atlas (TCGA) (n = 174), a public database for archiving and querying cancer data. We observed the expression of the regulators in the dataset and found that HNRNPC not only played a vital role in the differentially expressed genes, but acted as a signature that could be designed to stratify the prognosis of GBM. In addition, western blot, RT-PCR, and immunohistochemical staining were performed showing that HNRNPC might be associated with malignant progression of GBM and might predict a good prognosis.
Materials and Methods
Data Acquisition
Raw RNA-seq data (FPKM files) and clinical data on GBM were extracted from the TCGA data portal (https://tcga-data.nci.nih.gov/tcga/: accessed September 2019). These data on GBM tissue samples (n = 169) and normal brain tissue samples (n = 5) were downloaded from the TCGA.
Identification of Genes Related to m6A
The thirteen m6A RNA methylation regulators (METTL3, METTL14, WTAP, KIAA1429, RBM15, ZC3H13, YTHDC1, YTHDC2, YTHDF1, YTHDF2, HNRNPC, FTO, and ALKBH5) were collated based on a previously published article (7–12). Then, we systematically compared the expression levels of these m6A RNA methylation regulators between GBM and normal brain tissues and used the Wilcoxon signed-rank test to perform a differential expression analysis. Heatmaps and violin charts were generated with R 3.6.1 (https://www.r-project.org/).
Bioinformatic Analysis
Interactions and Gene Ontology (GO) analysis of the m6A RNA methylation regulators were performed using the STRING database (http://www.string-db.org/). GEPIA (16) (http://gepia.cancerpku.cn/) is a web server for analyzing the RNA sequencing expression data of 9,736 tumor samples and 8,587 normal samples from the TCGA and the Genotype-Tissue Expression (GTEx) project using a standard processing pipeline. |log2FC| is defined as median of the expression and the cut point of |log2FC| is 1, the cutoff of p-value is 0.01.
The relation among the regulators was calculated by Pearson's correlation based on gene expression. To explore the function of m6A RNA methylation regulators in GBM, we clustered gliomas into different groups with “ConsensusClusterPlus” (50 iterations, resample rate of 80%, and Pearson's correlation http://www.bioconductor.org/). Then, principal component analysis (PCA) was performed with R 3.6.1 to examine gene expression patterns in different glioma groups.
To determine the prognostic value of m6A RNA methylation regulators, we performed univariate Cox regression analyses of their expression in the TCGA. Then, all regulators were selected for the functional analysis and development of a potential risk signature with the least absolute shrinkage and selection operator (LASSO) Cox regression algorithm. Finally, three genes and their coefficients were selected with the minimum criteria, choosing the best penalty parameter λ associated with the smallest 10-fold cross-validation within the training set. The risk score for the signature was evaluated by using the following formula:
where Coefi and xi are respectively the coefficient and the z-score-transformed relative expression value of each selected gene. This formula was used to calculate the risk score for each GBM patient in the TCGA dataset.
Patients Samples
The 116 primary glioma samples and clinical information were acquired from postoperative patients, who undergone surgical treatment first time without chemotherapy or radiotherapy between 2013 June and 2014 January at Xiangya Hospital of Central South University. Eighteen normal brain tissues from patients with cerebral trauma surgery were collected as controls. The informed consents were provided to all patients or their family members. All the participants agreed the informed consents. All of samples were instantly frozen in liquid nitrogen and stored at −80°C until the extraction of total RNA. Because of multiple parameters like the lost to follow-up, only 61 of the patients experienced a follow-up period lasting 5 years since the surgery. This study was agreed by Central South University Xiang ya Hospital Medical Ethics Committee.
RNA Extraction and Real-Time PCR
According to manufacturer's instructions, total RNA was extracted from glioma and normal samples using TRIzol reagent (Invitrogen, Carlsbad, CA, USA) and cDNA was synthesized from 1 μg of total RNA using a Primescript™ RT reagent kit with gDNA eraser (TakaRa, Japan). RT-PCR was carried out by using SYBR Premix Dimer Eraser TM (Takara, Dalian, China) to detect the expression of mRNA HNRNPC, with GAPDH as a normalizing control. The following primers were used: HNRNPC F: 5′-CCTTACCATCAAACACGATGGC-3′, R: 5′-ACTTCGAAAAGATTGCCTCCACA-3′. GAPDH:F: 5′-CCCATCACCATCTTCCAGGAG-3′, R: 5′-GTTGTCATGGATGACCTTGGC-3′.
Western Blot
Protein concentrations were estimated using the BCA protein assay. Total proteins were extracted using cold RIPA buffer with Phenylmethanesulfonyl fluoride (Beyotime, China) and phosphatase Inhibitor Cocktail 2 (sigma, USA) for 30 min on ice, and centrifuged at 12,000 × g for 15 min at 4°C. Antibodies against HNRNPC were obtained from Proteintech. Antibody to β-actin was used as a normalizing control.
Immunohistochemistry
The expression of HNRNPC was detected by IHC in 25 cases of glioma tissues. The 5-μm-thick glioma tissue sections were dewaxed in xylene, rehydrated through decreasing concentrations of ethanol and washed in distilled water. According to the standard protocols, sections were processed and stained with hematoxylin and eosin (H&E) and diaminobezidine. At last, sections were dehydrated through increasing concentrations of ethanol and xylene to the transparent state, and sealed with neutral gum. Primary antibody was diluted at 1:100 according to the manufacturer's instructions. HNRNPC positive cells in microscopic fields at ×400 and ×100 were observed and the ICH results were assessed by two pathologists, respectively.
Statistical Analysis
Wilcoxon rank-sum and signed-rank tests were texted to evaluate the expression levels of m6A RNA methylation regulators in GBM for different groups. Univariate and multivariate Cox regression analyses were tested to determine the prognostic value of the regulators. Based on the consensus expression of thirteen regulators, 169 patients with GBM were divided into two subgroups by using consensus cluster and divided into low-risk and high-risk groups by using the median risk score (originated from the risk signature) as a break point. Chi-square tests were performed to compare the characteristics of clinical features (n = 158) such as gender, race, age, IDH, and p53 mutant information, and survival time between the two risk groups and two clusters. The receiver operating characteristic (ROC) curves were used to show the prediction efficiency of the risk model for 5-year survival in clusters 1 and 2. The Kaplan–Meier method was used to compare the overall survival (OS) rates of patients in the high- and low-risk groups, while the log-rank test was tested to compare the survival distributions between two groups. The Cut-off point was used the mean of the expression of HNRNPC. All statistical analyses were conducted using R 3.6.1. Experimental data analysis was performed with the Graphpad Prism 8.0 (GraphPad, San Diego, CA, USA). The t-test was performed to detected differential expression of HNRNPC between glioma in different grades and normal brain tissues. The error bars in bar graphs were represented the mean ± SD (Standard Deviation). A p-value of < 0.05 was considered statistically significant.
Results
m6A RNA Methylation Regulators Are Significantly Different Between Tumor and Normal Brain Tissues
To study the functions of the m6A RNA methylation regulators in the tumorigenesis and progression of GBM, differences between tumor and normal brain tissues were investigated and presented as a heatmap (Figure 1A, *p < 0.05, **p < 0.01, and ***p < 0.001), showing that almost all the regulators were highly related to the oncogenesis and development of GBM. The differences between genes were presented as a violin plot (Figure 1B). The expression levels of METTL3, WTAP, KIAA1429, ZC3H13, YTHDC2, YTHDF1, YTHDF2, HNRNPC, FTO, and ALKBH5 were significantly different between GBM and normal tissues. Considering the small number of normal brain tissues in the TCGA, we investigated the expression of the m6A regulators on the online web server GEPIA, which contains large dataset of 9,736 tumors and 8,587 normal samples from the TCGA and the GTEx project, respectively (Figure 1C, *p < 0.05). A comparison of all results showed that the HNRNPC, WTAP, YTHDF2, and YTHDF1 were up-regulated in tumor samples and might influence the tumorigenesis of GBM.
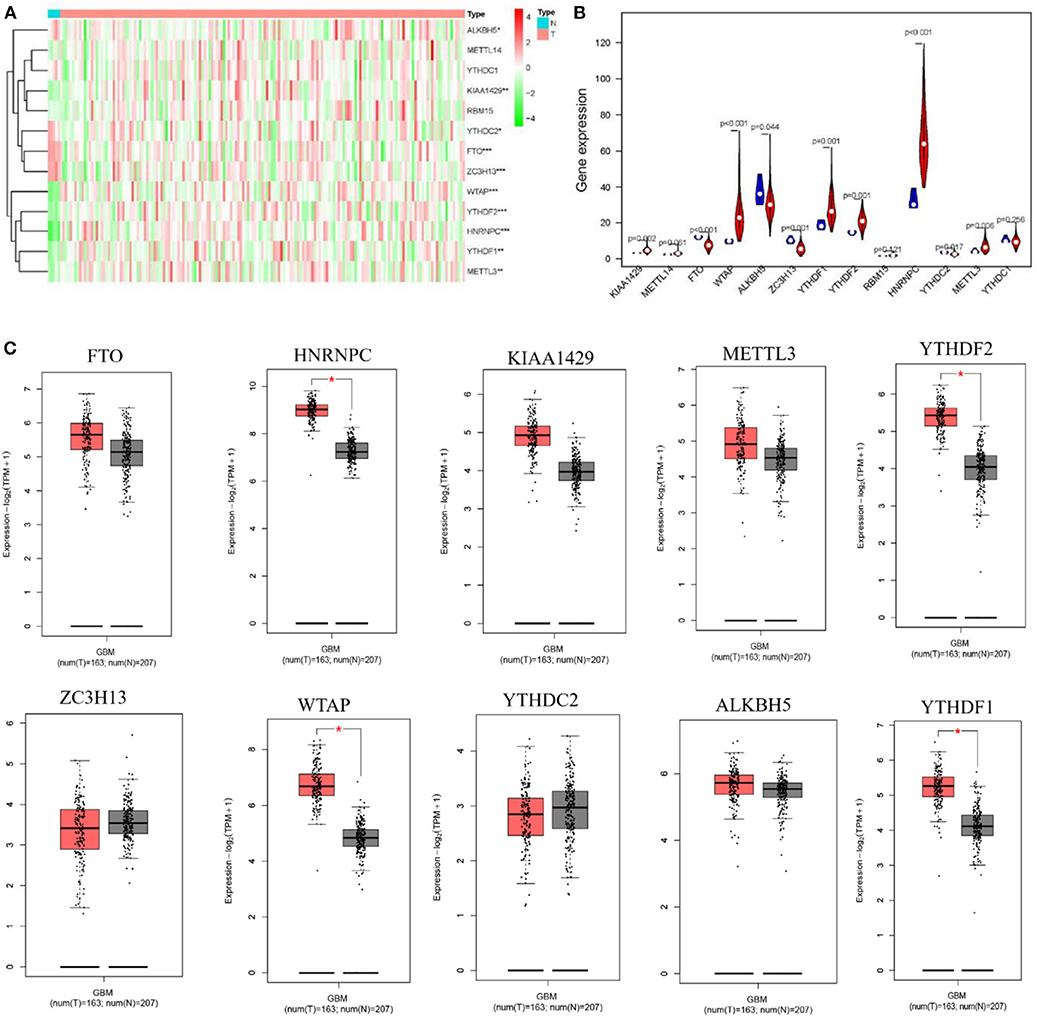
Figure 1. Expression of m6A RNA methylation regulators in GBM and normal tissue. (A,B) The heatmap and the violin diagram showed the m6A RNA methylation regulators in GBM and normal tissues. GBM was marked with red and normal tissues were marked with blue, position of white spots on the way represented the median value of expression. (C) The boxplots structured by GEPIA showed a difference between GBM and large number of normal brain tissues. The num(T) represented the number of tumors which were marked with red, the num(N) represented the number of normal tissues which were marked with blue (p < 0.001 noted with ***p < 0.01 noted with **p < 0.05 noted with *).
Interactions and Correlations Among the m6A RNA Methylation Regulators in GBM
Originated from the STRING online database (https://string-db.org/) and all m6A methylation regulators were filtered into the PPI network complex (Figure 2A). The correlations among the regulators were analyzed (Figure 2B). WTAP and FTO appeared to have a negative correlation, while METTL14 and YTHDC1 showed the most positive correlation. We also identified GO terms and Kyoto Encyclopedia of Genes and Genomes (KEGG) pathways and classified them into three functional categories: biological process (BP), cellular component (CC), and molecular function (MF). The top three enriched BP terms were “RNA modification,” “mRNA processing,” and “regulation of mRNA metabolic process.” For CCs, the top three terms were “RNA N6-methyladenosine methyltransferase complex,” “nuclear speck,” and “nucleoplasm.” The top three enriched MF terms were “N6-methyladenosine-containing RNA binding,” “RNA binding,” and “oxidative RNA demethylase activity.” All the results were shown in Figure 2C. The pathway enrichment analysis showed that the genes were associated with the reversal of alkylation damage by DNA dioxygenases and processing of the capped intron-containing pre-mRNA signaling pathway (Supplementary Table 1). These findings showed that the regulators had a broad connection to the RNA modification and cancer processes.
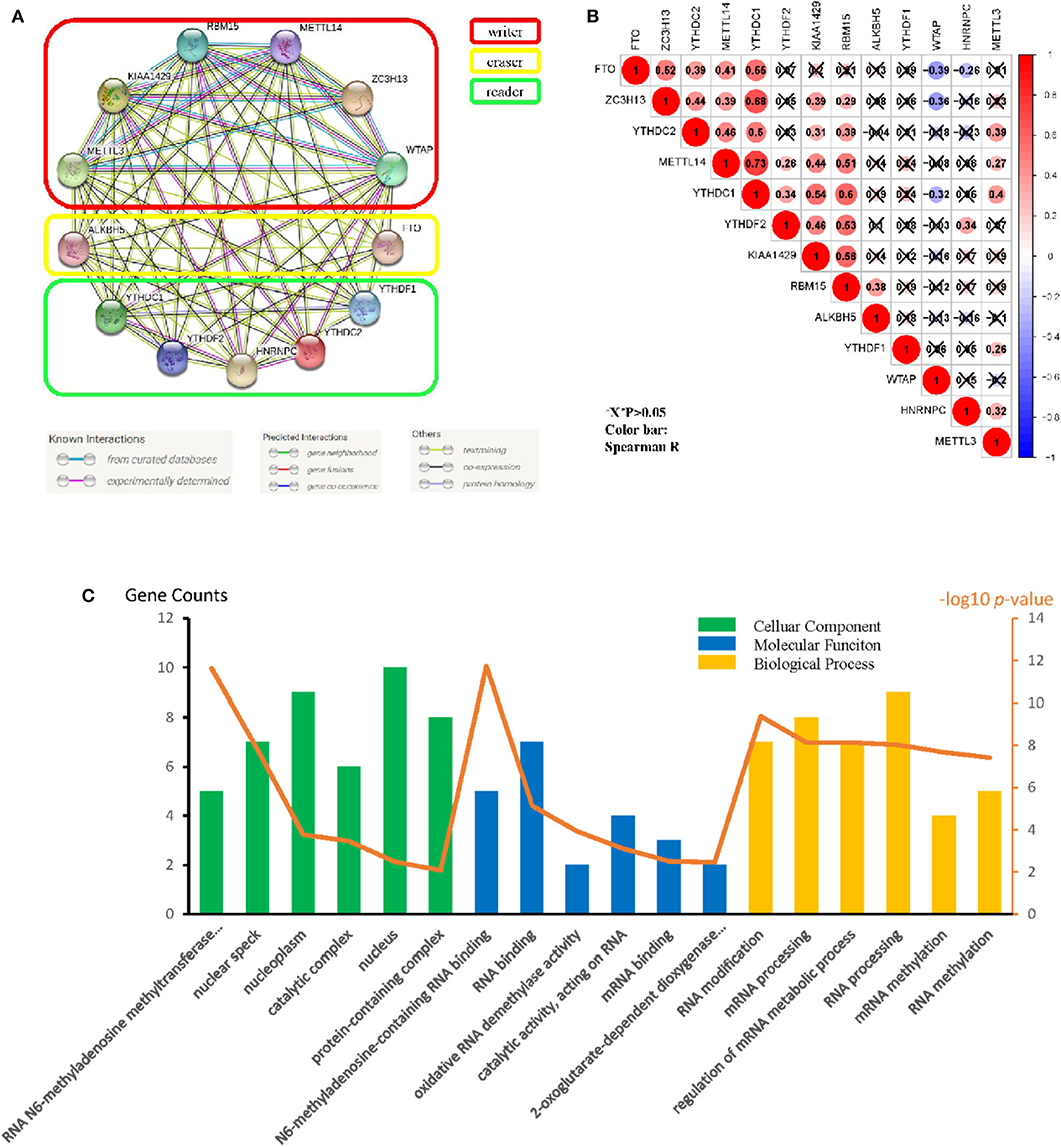
Figure 2. Protein–protein interaction (PPI), go ontology, and correlation of the m6A RNA methylation regulators. (A) M6A modification-related Protein–protein interactions among the 13 m6A RNA methylation regulators. (B) Spearman correlation analysis of the 13 m6A methylation modification regulators. (C) Gene ontology (GO) analysis classified regulators into BP (Biological Process), CC (cellular Component), and MF (Molecular Function) groups.
Two GBM Subgroups Were Clustered by Distinct Clinical Survival Times
Considering the dramatic imbalance in the numbers of GBM (n = 169) and normal brain tissue samples (n = 5) and the in-depth knowledge of GBM, we identified two new clusters of GBM based on the expression of all of the genes related to m6A RNA methylation (k = 2, which appeared to fit with the selection based on clustering stability increasing from k = 2 to 9 in the TCGA dataset) (Figures 3A–C). However, 159 of 169 gliomas clustered into one of the two subgroups in the TCGA dataset. Different clinical characteristics and the expression of m6A regulators between the two clusters (Figure 3D) showed that the different clusters are related to the survival status but the age, race, gender, IDH, and p53 mutant and HNRNPC, ALKBH5, WTAP, YTHDF2, YTHDC2, and FTO were markedly different between the two groups (Figure 3F). HNRNPC, WTAP, and YTHDF2 were upregulated in cluster 2, while ALKBH5, YTHDC2, and FTO were down-regulated in cluster 2. Principal component analysis (PCA) was performed to compare the transcriptional profiles between the cluster 1 (n = 105) and cluster 2 (n = 54) subgroups. There was a clear distinction between them (Figure 3E). Then, we compared the clinical survival outcomes of these two subgroups (cluster 1 and 2) clustered by k = 2. Interestingly, cluster 2 seemed to have a good survival trend (Figure 3G). Therefore, we believed that HNRNPC, WTAP, and YTHDF2 might be predictors of a high survival rate.
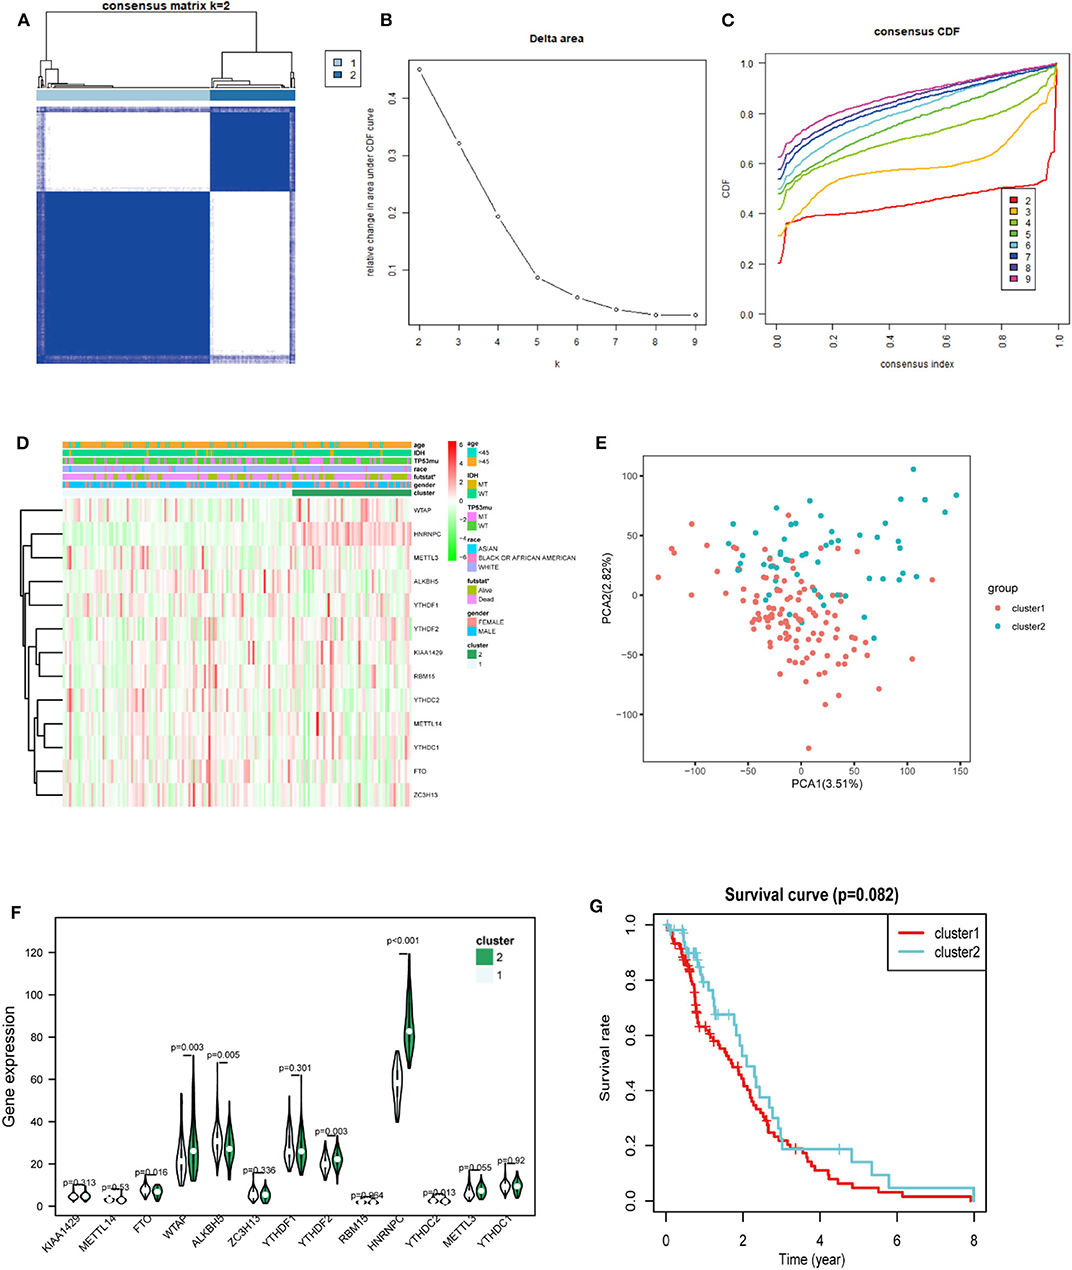
Figure 3. Differential expression and overall survival of GBM in the two subgroups. (A) The TCGA GBM cohort was divided into two clusters when k = 2. (B) Relative change in area under CDF curve for k = 2–9. (C) Consensus clustering cumulative distribution function (CDF) for k = 2–9. (D) The heatmap showed the relation between the two clusters and the clinical characteristic. (E) PCA (Principal component analysis) of the total RNA expression profile in GBM cluster1 was marked with red. (F) The violin chart of the two clusters (1 and 2) defined by the m6A RNA methylation regulators consensus expression (green represented the cluster 2) and position of white spots on the way represented the median value of expression. (G) Kaplan–Meier overall survival (OS) curves for GBM patients (p < 0.05 noted with *).
Functional Annotation of GBM in Clusters 1 and 2
We identified genes that were significantly changed (|log2-fold-change| > 1 and normalized p < 0.05) in the cluster 2 subgroup and then annotated their function using GO and pathway analyses. The results indicated that the downregulated genes in cluster2 are enriched in BPs including “chemical homeostasis,” “transmembrane transport,” and “ion transport” (Figure 4A), CCs including “intrinsic component of membrane,” “integral component of membrane,” and “plasma membrane” (Figure 4B) and MFs including “transmembrane signaling receptor activity,” “signaling receptor activity,” and “transmembrane transporter activity” (Figure 4C). Additionally, genes involved in KEGG pathways were enriched in “cGMP-PKG signaling pathway,” “neuroactive ligand-receptor interaction,” and “calcium signaling pathway” (Figure 4D). The upregulated genes were enriched in intracellular protein transport and ribosome (Supplementary Figure 1). All these findings indicate that the cluster groups divided by the expression of regulators are associated with the development of cancer.
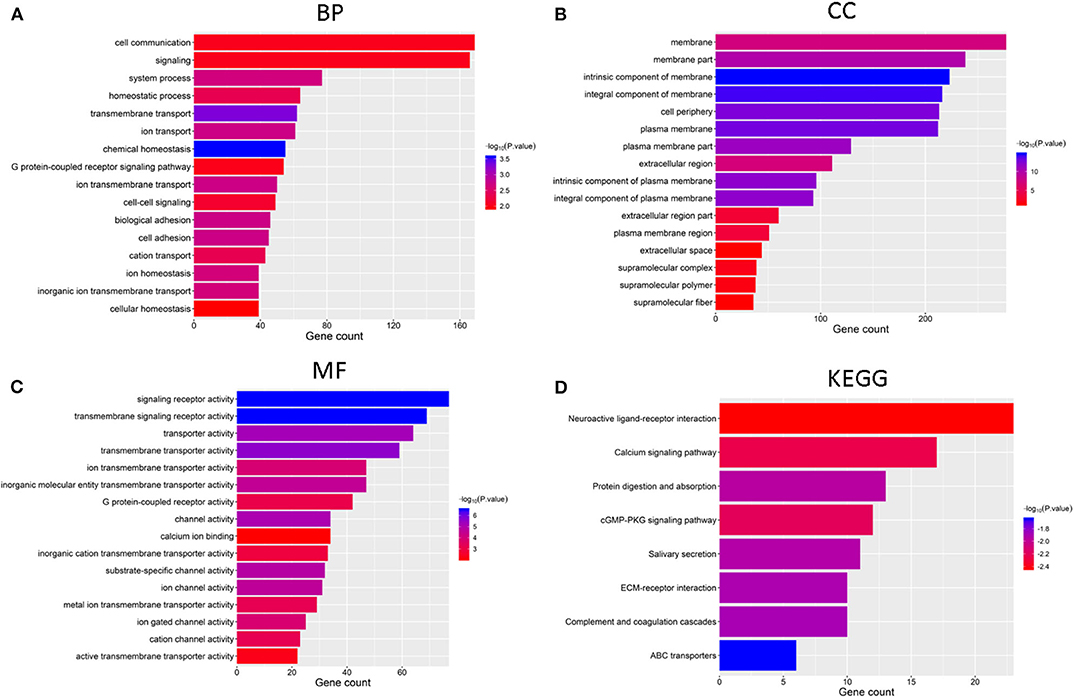
Figure 4. Functional annotation of differential expression of GBM in the two subgroups, Functional annotation of the genes with lower expression in the cluster2 subgroup using GO terms of biological processes (A), cellular component (B), molecular function (C), and KEGG pathway (D).
Prognostic Indices of m6A RNA Methylation Regulators and a Risk Signature Built Using Three Regulators
Considering the prognostic indices, we sought to investigate the prognostic role of m6A RNA methylation regulators in GBM. We performed univariate and multivariate Cox regression analysis on the expression levels in the TCGA dataset (Figures 5D,E). The results indicated that HNRNPC might be a protective gene that is significantly related to OS, with a hazard ratio (HR) < 1 (p < 0.05). The remaining tested genes were not (p > 0.05). To better predict the clinical outcomes of GBM with m6A RNA methylation regulators, the LASSO Cox regression algorithm was applied to thirteen genes. Three genes (HNRNPC, ZC3H13, and YTHDF2) were used to build a risk signature based on minimum criteria, and the coefficients obtained from the LASSO algorithm were used to calculate the risk score for the TCGA dataset (Figures 5A,B). We separated patients with GBM from the TCGA (n = 159) dataset into low-risk (n = 80) and high-risk (n = 79) groups and observed that GBM patients in the low-risk group had significantly longer OS than those in the high-risk group (p = 1.076e−02) (Figure 5C), showing that the model could predict prognosis well.
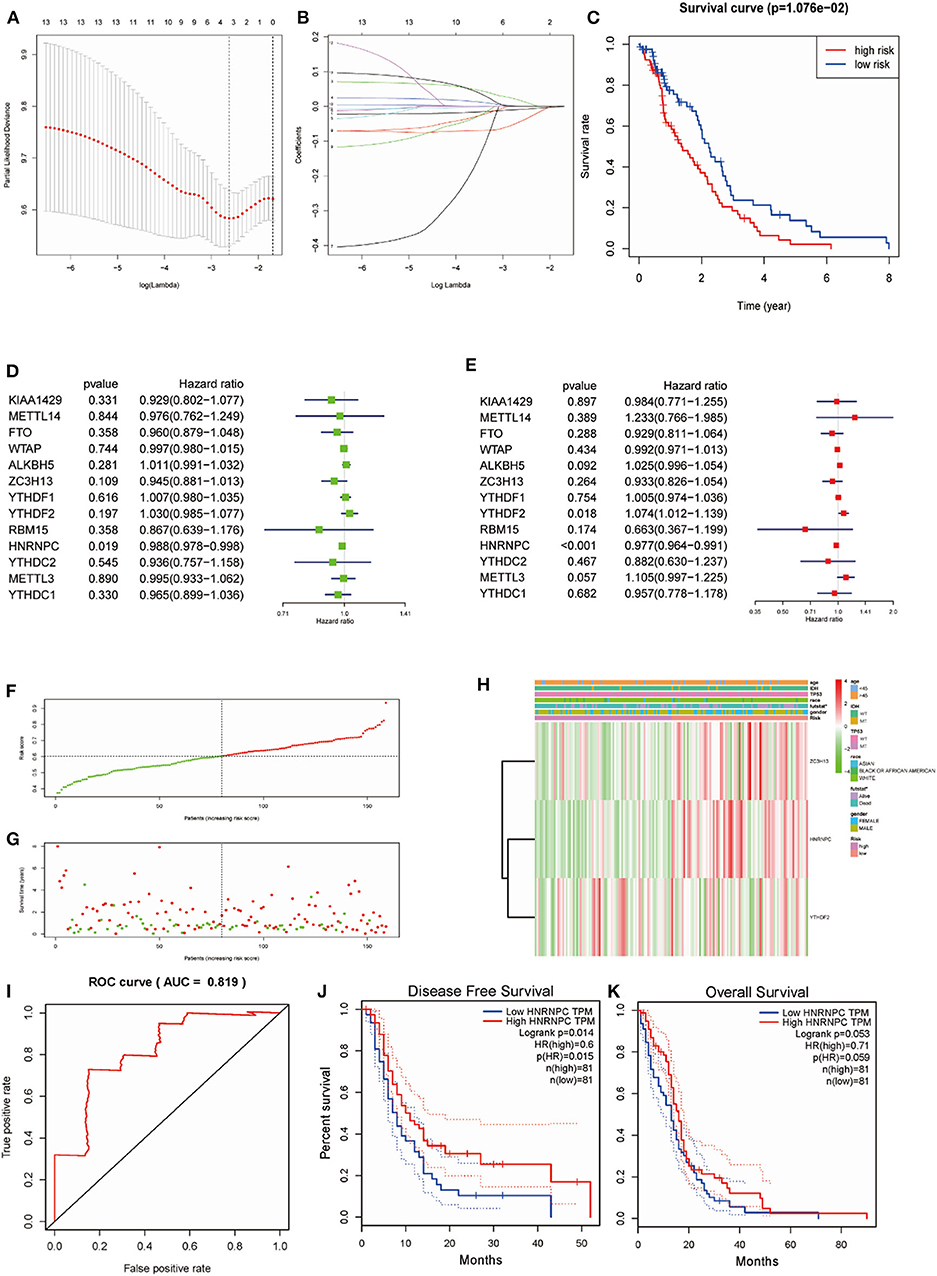
Figure 5. Risk signature with three m6A RNA methylation regulators and HNRNPC was the key gene in predicting the prognosis. (A,B) The process of building the signature containing 13 m6A RNA methylation regulators. (C) Kaplan–Meier overall survival (OS) curves for GBM patients in the TCGA datasets assigned to high- and low-risk groups based on the risk score (p = 1.076e−02). (F) The distributions of risk scores. (D) The hazard ratios (HR), 95% confidence intervals were calculated by univariate Cox regression. (E) The hazard ratios (HR), 95% confidence intervals were calculated by multivariate Cox regression. (G) The distributions of risk scores and OS status. The green and red dots indicated the alive and dead status, respectively. (H) Heatmap and clinical features by the m6A RNA methylation regulators risk signature. (I) ROC curves showed the predictive efficiency of the risk signature on the 5-year survival rate (AUC = 81.9%). (J,K) Kaplan–Meier analysis was performed to investigate the association of HNRNPC expression level with the Overall survival (OS) and disease-free survival (DFS).
To study the prognostic value of the model. Figure 5F showed the distributions of the three gene signature-based risk scores. The distributions of risk scores and OS status were displayed in Figure 5G, and the heatmap showed the expression levels of the m6A regulators in the low- and high-risk groups. Different clinical characteristics and the expression of m6A regulators between the two groups (Figure 5H, n = 158) showed that the different group are related to the survival status but the age, race, gender, IDH, and p53 mutant. As shown in Figure 5I, the ROC curve revealed that the risk score could perfectly predict the five-year survival rates for GBM patients (AUC = 81.9%). We also calculated the OS and disease-free survival (DFS) rates of HNRNPC in the TCGA GBM dataset by GEPIA (Figures 5J,K). We observed that high expression of HNRNPC was associated with a good prognosis. Also, we identified the relationship between the clinical and the prognosis in TCGA database by univariate and multivariate Cox regression. As is shown in the Figures 6A,B, only the risk-score are associated to the prognosis. These results confirmed that the risk score originating from the selected m6A RNA methylation regulators could predict prognosis in GBM patients. And HNRNPC might be the key gene for prognostic value.
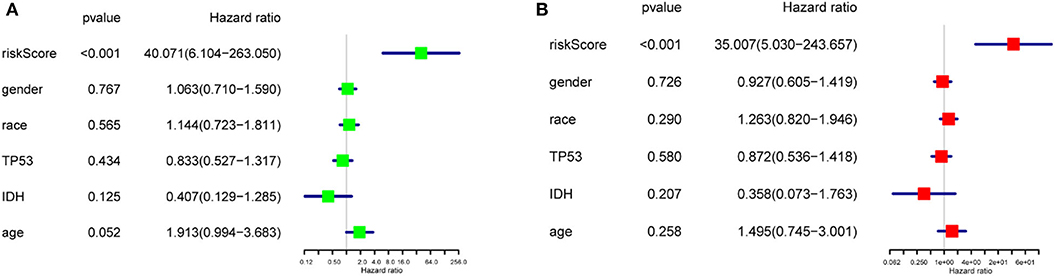
Figure 6. The relationship between the clinical characters and the prognosis by univariate and multivariate Cox regression in TCGA database (A) The hazard ratios (HR), 95% confidence intervals were calculated by univariate Cox regression. (B) The hazard ratios (HR), 95% confidence intervals were calculated by multivariate Cox regression.
HNRNPC Correlates With Cancer Progression and Development in Human Glioma Tissue
To verify whether HNRNPC played an important role in the development and progression of glioma, we firstly evaluated its mRNA expression level in glioma (n = 116) and normal brain (n = 28) tissues by RT-PCR, which indicated that HNRNPC expression was upregulated in glioma tissues compared with normal brain tissues (Figure 7A, p < 0.01). As shown is Additionally, we observed a relationship between the HNRNPC expression level and histological malignancy in tissues with different grades. As shown in Figure 7B, with the increase in HNRNPC expression, the malignancy of glioma showed an increasing tendency (p < 0.01). We examined the relationship of HNRNPC levels with overall survival (OS) rates through Kaplan–Meier analysis and log-rank test in 61 glioma cases which were collected between 2013 and 2014 with a 5-years followed up information, showing that the high expression of HNRNPC seems to be correlated with a good prognosis (Figure 7E, Hazard Ratio (HR) = 1.892, 95%Confidence Interval (CI) = 1.103–3.244, and p = 0.0205). All the results verified our prediction that HNRNPC might be a key gene in progression and development of GBM. The upregulation of HNRNPC in glioma tissues was further evaluated by Western blot (WB) and immunohistochemical (IHC) staining. For WB, we used 5 normal brain tissues, 11 low-grade (grades I-II) malignant glioma tissues, and 16 high-grade (grades III-IV) malignant glioma tissues and found that the protein level of HNRNPC was dramatically higher in high-grade and low-grade malignant glioma tissues than in normal brain tissues (Figure 7C, P < 0.05). HNRNPC expression was further examined by IHC staining in another 25 glioma tissues. We investigated the positive immunoreactivity of HNRNPC in different grades of human glioma tissues, as shown in Figure 7D, which indicated that the expression of HNRNPC was significantly related to the grades.
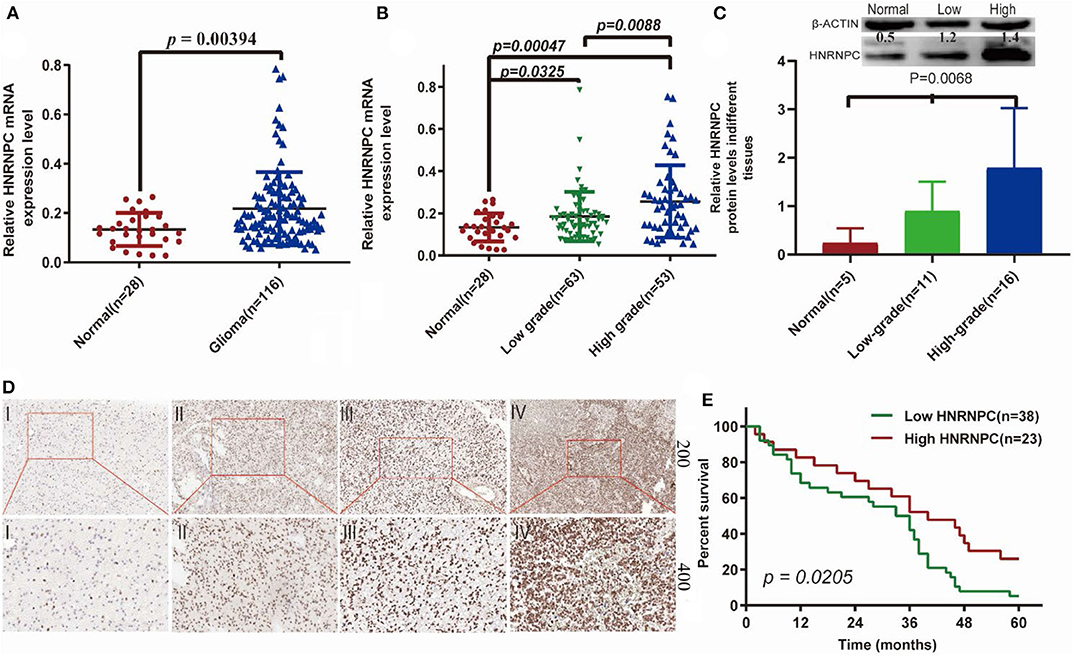
Figure 7. The expression of HNRNPC was associated with histological malignancy and clinical outcome in human gliomas. (A) The mRNA expression levels of HNRNPC in glioma and normal brain tissues were detected by RT-PCR assays. (B) HNRNPC mRNA expression levels in different glioma tissues. (C) The protein levels of HNRNPC in normal brain tissues and different grades of glioma were evaluated (D) The expression of HNRNPC was examined by immunohistochemistry staining in glioma tissues. (E) Kaplan–Meier analysis was evaluated to check the association of HNRNPC expression level with the Overall survival (OS) time in 61 cases of glioma patients (p = 0.0268).
Upregulation of HNRNPC Might Be Associated With Good Prognosis of Glioma Patients
To determine the clinical significance of HNRNPC in glioma, we examined the correlation of HNRNPC expression with clinicopathological parameters (Table 1), observing that increased HNRNPC expression level was significantly associated with tumor grade of glioma (p = 0.0001), rather than age, gender, and tumor location. All the results implied that HNRNPC might play a vital role in glioma progression.
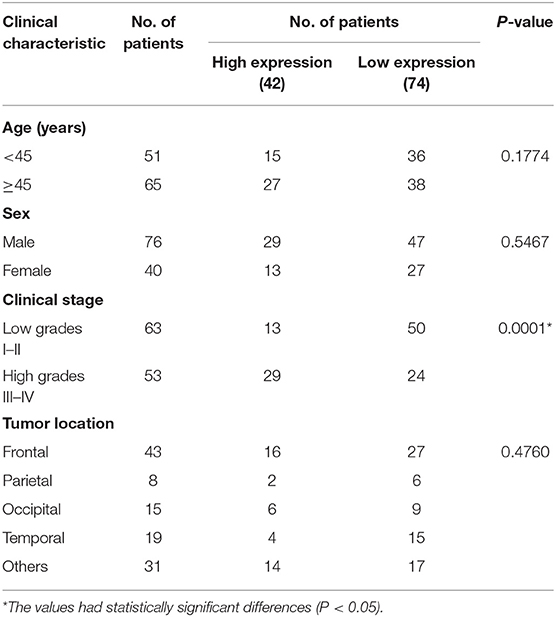
Table 1. Correlation between HNRNPC expression and clinicopathological features of glioma patients.
To further elucidate the correlation of HNRNPC expression with prognosis of glioma patients, univariate analysis demonstrated that the clinical stage (HR = 2.508, 95% CI = 1.450–4.338, and p = 0.001) and HNRNPC expression level (HR = 0.510, 95% CI = 0.282–0.923, and p = 0.026) were associated with prognosis. Multivariable Cox regression analysis confirmed that the clinical stage (HR = 2.688, 95% CI = 1.359–5.314, and p = 0.004) and the highly expressed HNRNPC (HR = 0.520, 95% CI = 0.283–0.955, and p = 0.035) were independent prognostic factors for OS of glioma patients (Table 2). These results suggested that upregulated HNRNPC seemed to be a prognostic marker for glioma patients.
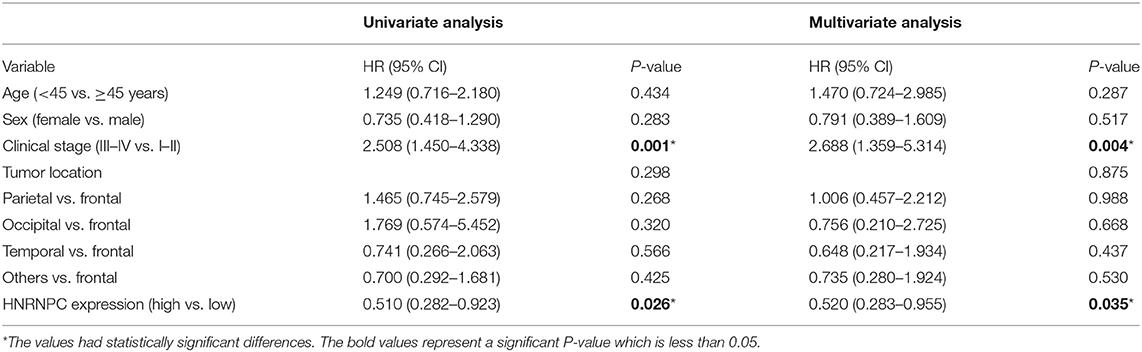
Table 2. Univariate and multivariate analyses of OS in 61 glioma patients by Cox regression analysis.
Discussion
At present, a low cure rate is a major challenge to GBM patients. In clinical practice, current common treatment options for GBM include maximal tumor excision, radiation therapy, and chemotherapy with common antineoplastic agents (such as Temozolomide) (17). Despite advances in GBM diagnosis and treatments, its poor prognosis remains a difficult challenge due to the highly aggressive and extremely infiltrative features of GBM (18, 19). Therefore, it is urgent to identify prognostic biomarkers for the tumorigenesis and development of GBM in patients who might benefit from curative therapy. With in-depth studies, epigenetic processes have become more valuable for the diagnosis and therapy of cancer. As a player in the epigenetic process, m6A methylation has a complex function in cancer. Studies have shown that m6A-regulating proteins could induce oncogene expression, cancer cell proliferation, survival, and tumor initiation and progression (20).
This study first showed the association between m6A regulators and prognosis and the relationship and function of the regulators. Based on the TCGA data, the expression levels of regulators related to m6A RNA methylation were analyzed in GBM (n = 169) and normal (n = 5) tissues. Ten of the thirteen m6A regulators, namely, METTL3, WTAP, KIAA1429, ZC3H13, YTHDC2, YTHDF1, YTHDF2, HNRNPC, FTO, and ALKBH5 showed a significant difference in GBM. Then, we filtered these regulators in GBM (n = 163) and normal brain (n = 207) tissues with GEPIA. Last, we found that HNRNPC, WTAP, YTHDF2, and YTHDF1 were significantly upregulated, indicating that these genes might be associated with the progression of GBM. In present study, the relationship among regulators was also revealed. The expression of WTAP was negatively associated with the expression of FTO, and the expression of METTL14 and YTHDC1 showed the most positive correlation. The functions of the m6A regulators were enriched in mRNA processes and RNA binding, which indicated that they were related to cancer progression. Regarding one of the enriched KEGG pathways, the “processing of capped intron-containing pre-mRNA signaling pathway” might promote the survival of malignant cells following therapy (21, 22). Among the regulators, METTL3 has been discovered to regulate cell proliferation, tumor growth, self-renewal, and development in glioma (23). METTL14 has been reported as a tumor suppressor gene in GBM, and the erasers FTO and ALKBH5 are oncogenes in glioma (24–26).
Furthermore, to find key m6A genes related to OS and process in GBM, two GBM subgroups were constructed by consensus clustering based on the expression of m6A RNA methylation regulators. The results showed HNRNPC, WTAP, and YTHDF2 were upregulated in cluster 2, while ALKBH5, YTHDC2, and FTO were downregulated in cluster 2. Differences in OS between the two subgroups were investigated, which indicated that the levels of m6A regulators were associated with the prognosis of GBM. Although no significant difference in OS was observed, a trend between the two clusters could also be discovered. Cluster 2 was associated with a good prognosis. We speculate that statistical significance might be detected by increasing the sample numbers. In addition, GO and KEGG pathway analyses were also conducted between the two clusters. Most of the enriched functions of differentially expressed genes (DEGs) identified by the two clusters were related to the cancer process. Regarding the KEGG pathways, “cGMP-PKG signaling pathway” and “calcium signaling pathway” were enriched. The calcium signaling pathway acts in various biological processes, such as the cell cycle and survival (27, 28). The cGMP-PKG signaling pathway plays an important role in tumor cell proliferation and apoptosis and prevents the progression of colon cancer (29–31). These findings indicated these regulators were related to the initiation and development of GBM and HNRNPC, WTAP, and YTHDF2 might be associated with a good prognosis.
In this study, the prognostic value of m6A regulators was subsequently evaluated. A univariate Cox analysis was performed to predict the prognostic value of the m6A regulators. HNRNPC showed a good performance (p < 0.05) for predicting the clinical outcome of GBM. In addition, a prognostic model was constructed using the three genes (ZC3H13, HNRNPC, and YTHDF2) identified by LASSO regression, which stratified the OS of patients with gliomas into high- and low-risk groups. The high-risk group suffered a poorer clinical outcome than the low-risk group. Furthermore, this model could predict the prognosis of patients well and be used to provide novel ideas for clinical applications in GBM. The prognostic model shows that the expression level of ZC3H13 was positively associated with the prognosis of GBM. ZC3H13 might act as a tumor suppressor gene, as we would expect in GBM. ZC3H13 could suppress proliferation and invasion in colorectal cancer and regulate mouse embryonic stem cell self-renewal (32, 33). Our prognostic model revealed that the expression level of HNRNPC was positively associated with the prognosis of GBM. Heterogeneous nuclear ribonucleoprotein C (HNRNPC) is an abundant nuclear RNA-binding protein responsible for pre-mRNA processing (34, 35). HNRNPC has been reported to have various functions, such as increasing differentiation in type II testicular germ cell tumors (GCTs), inducing cell death in ovarian cancer, promoting chemoresistance, and indicating OS in gastric cancer and facilitating the progression of colorectal cancer (36–39). HNRNPC was found to be a m6A methylation regulator by Liu et al. (40). Meanwhile, the article showed that KD-HNRNPC could up regulate many other genes like MAP3K3 and MTF2 which were reported to be associated with a bad prognosis, respectively, in Hepatocellular Carcinoma and ovarian carcinoma and downregulated other genes like DNAJA3 which was proved to be associated with the increasing of overall survival in breast cancer (41–43). These conclusions implied that the expression of HNRNPC might promote overall survival rate. Besides, the research revealed that low expression of ROBO1 was exhibited worse prognosis in breast cancer patients, which was similar to our finding (44). These studies demonstrated that the possibility that the expression of HNRNPC might be related to a well-prognosis by affecting other genes. Alterations in m6A regulators lead to cancer pathogenesis and development by regulating the expression of tumor-related genes (45).
Therefore, HNRNPC might play a role in GBM by regulating other genes that might influence prognosis. The trend of the expression level of YTHDF2 is not significant observed. However, YTHDF2 has been discovered in prostate cancer which can promote cell proliferation and migration (46). These findings suggested that the up- or down-regulation of specific RNA m6A methylation regulators is linked to cancer development and progression, and the same regulators might have distinct functions in different cancers. Finally, upon combining the results of the univariate Cox and LASSO regression analyses, we observed a similar scenario, which demonstrated that HNRNPC had a strong correlation with OS in GBM.
Until now, HNRNPC has been reported to have various functions in several kinds of cancer. Additionally, our study showed differences in HNRNPC expression by RT-PCR, ICH staining, and WB. HNRNPC was upregulated in glioma samples based on RT-PCR and WB analyses, and similar results have been presented in glioblastoma by Park et al. (47). We also observed the OS in the glioma which showed that the high expression of HNRNPC might have a good prognosis by Kaplan–Meier method. The result was consistent to our prediction in TCGA dataset. There is a lack of IHC evidence showing HNRNPC expression at the protein level in glioma. Thus, we used 25 different grade of glioma tissues that were evaluated immunohistochemically to further study the relationship between the expression of HNRNPC and gliomas in depth. We demonstrated that the expression level of HNRNPC significantly contributed to malignant progression of glioma. All the results indicated that HNRNPC could be a new therapeutic approach to predict diagnosis and prognosis. However, additional experiments to identify the mechanisms of HNRNPC are urgently needed.
Conclusion
Our results identified the potential function, prognostic value and expression features of the m6A RNA methylation regulators in GBM and HNRNPC could serve as a key biomarker that might be highly associated with the clinical survival rate, m6A methylation levels, and the malignant progression of gliomas (Figure 8). In summary, this study provides a new blueprint for m6A methylation research and important evidence for the future diagnosis and therapy of GBM.
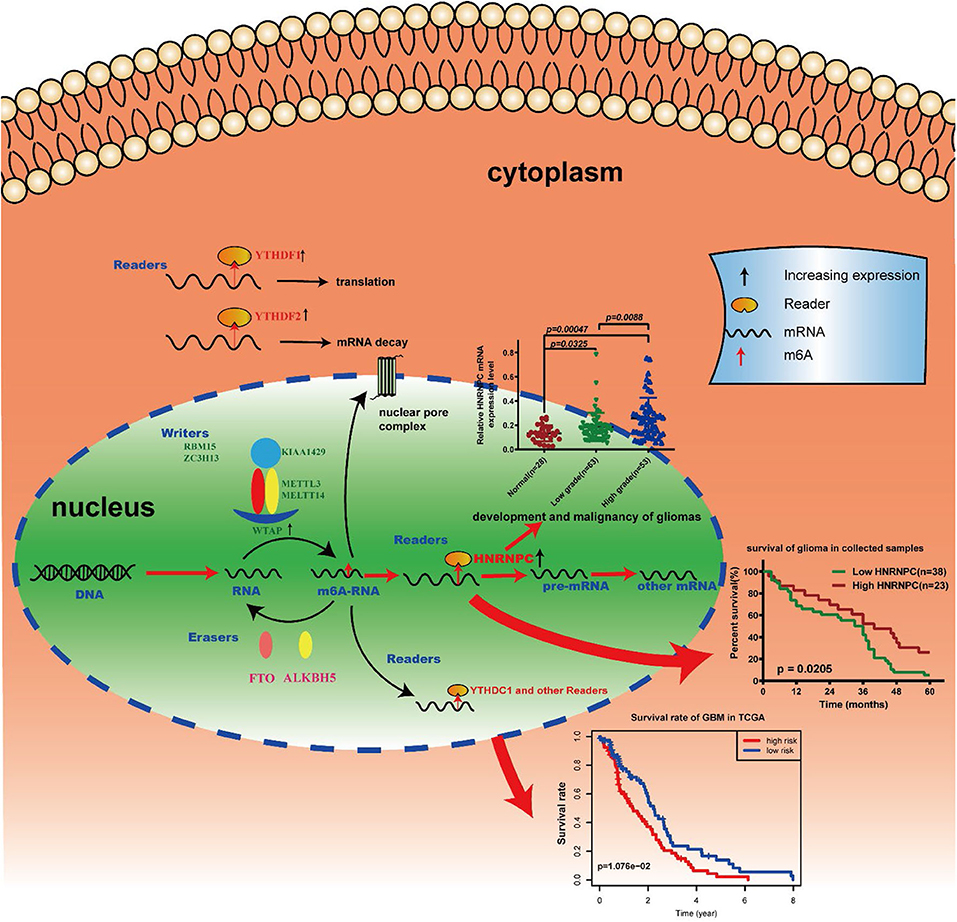
Figure 8. Summary for the expression changes and potential functions of m6A RNA methylation regulators in gliomas.
Data Availability Statement
All datasets generated for this study are included in the article/Supplementary Material.
Ethics Statement
The studies involving human participants were reviewed and approved by Medical Ethics Committee of the Xiangya Hospital of Central South University (No. 201803806). The patients/participants provided their written informed consent to participate in this study.
Author Contributions
Q-lL planned and supervised the study. L-cW and S-hC contributed to conception and design, data acquisition, and manuscript drafting. D-cL, Y-lJ, ML, KY, HY, J-JC, C-zQ, M-mL, and Q-xL collected the glioma tissues and clinical information. X-lS and H-yL drafted the article or critically revised it for important intellectual content. All authors read and approved to the final manuscript.
Funding
This study was supported in part by grants from The National Natural Science Foundation of China (81860664, 81703780, and 81960458), Science and Technology Plan of Health Commission of Jiangxi Provincial (20195424 and 20191091), Youth Science Foundation of Science and Technology Department of Jiangxi Provincial (20192BAB215063 and 20202BABL216080), and Science and Technology Research Project of Jiangxi Provincial Department of Education (180077).
Conflict of Interest
The authors declare that the research was conducted in the absence of any commercial or financial relationships that could be construed as a potential conflict of interest.
Acknowledgments
The authors thank the data from TCGA databases and Central South University Xiang ya Hospital who provided the glioma tissues.
Supplementary Material
The Supplementary Material for this article can be found online at: https://www.frontiersin.org/articles/10.3389/fonc.2020.536875/full#supplementary-material
References
1. Barbarisi M, RIaffaioli V, Armenia E, Schiavo L, De Sena G, Tafuto S, et al. Novel nanohydrogel of hyaluronic acid loaded with quercetin alone and in combination with temozolomide as new therapeutic tool, CD44 targeted based, of glioblastoma multiforme. J Cell Physiol. (2018) 233:6550–64. doi: 10.1002/jcp.26238
2. Stoyanov GS, Dzhenkov D, Ghenev P, Iliev B, Enchev Y, Tonchev AB. Cell biology of glioblastoma multiforme: from basic science to diagnosis and treatment. Medical Oncol. (2018) 35:27. doi: 10.1007/s12032-018-1083-x
3. Hsu PJ, Shi H, He C. Epitranscriptomic influences on development and disease. Genome Biol. (2017) 18:197. doi: 10.1186/s13059-017-1336-6
4. Liu N, Pan T. N6-methyladenosine-encoded epitranscriptomics. Nat Struct Mol Biol. (2016) 23:98–102. doi: 10.1038/nsmb.3162
5. Zhao BS, Roundtree IA, He C. Post-transcriptional gene regulation by mRNA modifications. Nat Rev Mol Cell Biol. (2017) 18:31–42. doi: 10.1038/nrm.2016.132
6. Fray RG, Simpson GG. The Arabidopsis epitranscriptome. Curr Opin Plant Biol. (2015) 27:17–21. doi: 10.1016/j.pbi.2015.05.015
7. Yang Y, Hsu PJ, Chen YS, Yang YG. Dynamic transcriptomic mA decoration: writers, erasers, readers and functions in RNA metabolism. Cell Res. (2018) 28:616–24. doi: 10.1038/s41422-018-0040-8
8. Tang C, Klukovich R, Peng H, Wang Z, Yu T, Zhang Y, et al. ALKBH5-dependent m6A demethylation controls splicing and stability of long 3'-UTR mRNAs in male germ cells. Proc Natl Acad Sci U S A. (2018) 115:E325–E33. doi: 10.1073/pnas.1717794115
9. Wojtas MN, Pandey RR, Mendel M, Homolka D, Sachidanandam R, Pillai RS. Regulation of mA transcripts by the 3′ → 5′ RNA helicase YTHDC2 is essential for a successful meiotic program in the mammalian germline. Mol Cell. (2017) 68:374–87.e312. doi: 10.1016/j.molcel.2017.09.021
10. Ding C, Zou Q, Ding J, Ling M, Wang W, Li H, et al. Increased N6-methyladenosine causes infertility is associated with FTO expression. J Cell Physiol. (2018) 233:7055–66. doi: 10.1002/jcp.26507
11. Wu R, Yao Y, Jiang Q, Cai M, Liu Q, Wang Y, et al. Epigallocatechin gallate targets FTO and inhibits adipogenesis in an mRNA mA-YTHDF2-dependent manner. Int J Obes. (2018) 42:1378–88. doi: 10.1038/s41366-018-0082-5
12. Kwok CT, Marshall AD, Rasko JE, Wong JJ. Genetic alterations of mA regulators predict poorer survival in acute myeloid leukemia. J Hematol Oncol. (2017) 10:39. doi: 10.1186/s13045-017-0410-6
13. Niu Y, Zhao X, Wu YS, Li MM, Wang XJ, Yang YG. N6-methyl-adenosine (m6A) in RNA: an old modification with a novel epigenetic function. Genomics Proteomics Bioinformatics. (2013) 11:8–17. doi: 10.1016/j.gpb.2012.12.002
14. Vu LP, Pickering BF, Cheng Y, Zaccara S, Nguyen D, Minuesa G, et al. The N-methyladenosine (mA)-forming enzyme METTL3 controls myeloid differentiation of normal hematopoietic and leukemia cells. Nat Med. (2017) 23:1369–76. doi: 10.1038/nm.4416
15. Li J, Yang X, Qi Z, Sang Y, Liu Y, Xu B, et al. The role of mRNA mA methylation in the nervous system. Cell Biosci. (2019) 9:66. doi: 10.1186/s13578-019-0330-y
16. Jones PA, Issa JP, Baylin S. Targeting the cancer epigenome for therapy. Nat Rev Genet. (2016) 17:630–41. doi: 10.1038/nrg.2016.93
17. Scoccianti S, Magrini SM, Ricardi U, Detti B, Buglione M, Sotti G, et al. Patterns of care and survival in a retrospective analysis of 1059 patients with glioblastoma multiforme treated between 2002 and 2007: a multicenter study by the Central Nervous System Study Group of Airo (italian Association of Radiation Oncology). Neurosurgery. (2010) 67:446–58. doi: 10.1227/01.NEU.0000371990.86656.E8
18. Chen J, Li Y, Yu TS, McKay RM, Burns DK, Kernie SG, et al. A restricted cell population propagates glioblastoma growth after chemotherapy. Nature. (2012) 488:522–6. doi: 10.1038/nature11287
19. Denysenko T, Gennero L, Roos MA, Melcarne A, Juenemann C, Faccani G, et al. Glioblastoma cancer stem cells: heterogeneity, microenvironment and related therapeutic strategies. Cell Biochem Funct. (2010) 28:343–51. doi: 10.1002/cbf.1666
20. Sun T, Wu R, Ming L. The role of m6A RNA methylation in cancer. Biomed Pharmacother. (2019) 112:108613. doi: 10.1016/j.biopha.2019.108613
21. Dvinge H, Kim E, Abdel-Wahab O, Bradley RK. RNA splicing factors as oncoproteins and tumour suppressors. Nat Rev Cancer. (2016) 16:413–30. doi: 10.1038/nrc.2016.51
22. Oltean S, Bates DO. Hallmarks of alternative splicing in cancer. Oncogene. (2014) 33:5311–8. doi: 10.1038/onc.2013.533
23. Li F, Zhang C, Zhang G. m6A RNA methylation controls proliferation of human glioma cells by influencing cell apoptosis. Cytogenet Genome Res. (2019) 159:119–25. doi: 10.1159/000499062
24. Wang S, Sun C, Li J, Zhang E, Ma Z, Xu W, et al. Roles of RNA methylation by means of N-methyladenosine (mA) in human cancers. Cancer Lett. (2017) 408:112–20. doi: 10.1016/j.canlet.2017.08.030
25. Zhang S, Zhao BS, Zhou A, Lin K, Zheng S, Lu Z, et al. mA demethylase ALKBH5 maintains tumorigenicity of glioblastoma stem-like cells by sustaining FOXM1 expression and cell proliferation program. Cancer Cell. (2017) 31:591–606.e596. doi: 10.1016/j.ccell.2017.02.013
26. Su R, Dong L, Li C, Nachtergaele S, Wunderlich M, Qing Y, et al. R-2HG exhibits anti-tumor activity by targeting FTO/mA/MYC/CEBPA signaling. Cell. (2018) 172:90–105.e123. doi: 10.1016/j.cell.2017.11.031
27. Monteith GR, McAndrew D, Faddy HM, Roberts-Thomson SJ. Calcium and cancer: targeting Ca2+ transport. Nat Rev Cancer. (2007) 7:519–30. doi: 10.1038/nrc2171
29. Mujoo K, Sharin VG, Martin E, Choi BK, Sloan C, Nikonoff LE, et al. Role of soluble guanylyl cyclase-cyclic GMP signaling in tumor cell proliferation. Nitric Oxide Biol Chem. (2010) 22:43–50. doi: 10.1016/j.niox.2009.11.007
30. Browning DD, Kwon IK, Wang R. cGMP-dependent protein kinases as potential targets for colon cancer prevention and treatment. Fut Med Chem. (2010) 2:65–80. doi: 10.4155/fmc.09.142
31. Kumazoe M, Sugihara K, Tsukamoto S, Huang Y, Tsurudome Y, Suzuki T, et al. 67-kDa laminin receptor increases cGMP to induce cancer-selective apoptosis. J Clin Invest. (2013) 123:787–99. doi: 10.1172/JCI64768
32. Zhu D, Zhou J, Zhao J, Jiang G, Zhang X, Zhang Y, et al. ZC3H13 suppresses colorectal cancer proliferation and invasion via inactivating Ras-ERK signaling. J Cell Physiol. (2019) 234:8899–907. doi: 10.1002/jcp.27551
33. Wen J, Lv R, Ma H, Shen H, He C, Wang J, et al. Zc3h13 regulates nuclear RNA mA methylation and mouse embryonic stem cell self-renewal. Mol Cell. (2018) 69:1028–38.e1026. doi: 10.1016/j.molcel.2018.02.015
34. McCloskey A, Taniguchi I, Shinmyozu K, Ohno M. hnRNP C tetramer measures RNA length to classify RNA polymerase II transcripts for export. Science. (2012) 335:1643–6. doi: 10.1126/science.1218469
35. Rajagopalan LE, Westmark CJ, Jarzembowski JA, Malter JS. hnRNP C increases amyloid precursor protein (APP) production by stabilizing APP mRNA. Nucleic Acids Res. (1998) 26:3418–23. doi: 10.1093/nar/26.14.3418
36. Nettersheim D, Berger D, Jostes S, Kristiansen G, Lochnit G, Schorle H. N6-Methyladenosine detected in RNA of testicular germ cell tumors is controlled by METTL3, ALKBH5, YTHDC1/F1/F2, and HNRNPC as writers, erasers, and readers. Andrology. (2019) 7:498–506. doi: 10.1111/andr.12612
37. Kleemann M, Schneider H, Unger K, Sander P, Schneider EM, Fischer-Posovszky P, et al. MiR-744-5p inducing cell death by directly targeting HNRNPC and NFIX in ovarian cancer cells. Sci Rep. (2018) 8:9020. doi: 10.1038/s41598-018-27438-6
38. Huang H, Han Y, Zhang C, Wu J, Feng J, Qu L, et al. HNRNPC as a candidate biomarker for chemoresistance in gastric cancer. Tumour Biol. (2016) 37:3527–3534. doi: 10.1007/s13277-015-4144-1
39. Liu X, Liu L, Dong Z, Li J, Yu Y, Chen X, et al. Expression patterns and prognostic value of mA-related genes in colorectal cancer. Am J Transl Res. (2019) 11:3972–91.
40. Liu N, Dai Q, Zheng G, He C, Parisien M, Pan T. N(6)-methyladenosine-dependent RNA structural switches regulate RNA-protein interactions. Nature. (2015) 518:560–4. doi: 10.1038/nature14234
41. Wu TT, Cai J, Tian YH, Chen JF, Cheng ZL, Pu CS, et al. MTF2 induces epithelial-mesenchymal transition and progression of hepatocellular carcinoma by transcriptionally activating snail. Onco Targets Ther. (2019) 12:11207–20.42. doi: 10.2147/OTT.S226119
42. Jia W, Dong Y, Tao L, Pang L, Ren Y, Liang W, et al. MAP3K3 overexpression is associated with poor survival in ovarian carcinoma. Human Pathol. (2016) 50:162–9. doi: 10.1016/j.humpath.2015.12.011
43. Jan CI, Yu CC, Hung MC, Harn HJ, Nieh S, Lee HS, et al. Tid1, CHIP and ErbB2 interactions and their prognostic implications for breast cancer patients. J Pathol. (2011) 225:424–37. doi: 10.1002/path.2921
44. Qin F, Zhang H, Ma L, Liu X, Dai K, Li W, et al. Low Expression of Slit2 and Robo1 is associated with poor prognosis and brain-specific metastasis of breast cancer patients. Sci Rep. (2015) 5:14430. doi: 10.1038/srep14430
45. He L, Li H, Wu A, Peng Y, Shu G, Yin G. Functions of N6-methyladenosine and its role in cancer. Mol Cancer. (2019) 18:176. doi: 10.1186/s12943-019-1109-9
46. Li J, Meng S, Xu M, Wang S, He L, Xu X, et al. Downregulation of N-methyladenosine binding YTHDF2 protein mediated by miR-493-3p suppresses prostate cancer by elevating N-methyladenosine levels. Oncotarget. (2018) 9:3752–64. doi: 10.18632/oncotarget.23365
Keywords: m6A, hnRNPC, prognosis, glioblastoma multiforme, tumorigenesis
Citation: Wang L-c, Chen S-h, Shen X-l, Li D-c, Liu H-y, Ji Y-l, Li M, Yu K, Yang H, Chen J-J, Qin C-z, Luo M-m, Lin Q-x and Lv Q-l (2020) M6A RNA Methylation Regulator HNRNPC Contributes to Tumorigenesis and Predicts Prognosis in Glioblastoma Multiforme. Front. Oncol. 10:536875. doi: 10.3389/fonc.2020.536875
Received: 21 February 2020; Accepted: 01 September 2020;
Published: 08 October 2020.
Edited by:
Massimo Nabissi, University of Camerino, ItalyReviewed by:
Dimitris G. Placantonakis, New York University, United StatesLiang Wang, Tangdu Hospital, China
Copyright © 2020 Wang, Chen, Shen, Li, Liu, Ji, Li, Yu, Yang, Chen, Qin, Luo, Lin and Lv. This is an open-access article distributed under the terms of the Creative Commons Attribution License (CC BY). The use, distribution or reproduction in other forums is permitted, provided the original author(s) and the copyright owner(s) are credited and that the original publication in this journal is cited, in accordance with accepted academic practice. No use, distribution or reproduction is permitted which does not comply with these terms.
*Correspondence: Qiao-li Lv, 137301002@csu.edu.cn
†These authors have contributed equally to this work