 Yan-Jen Chen1,2†
 Hsun-Ping Hsieh1†Kuo-Chuan Hung3,4
 Yun-Ju Shih5Sher-Wei Lim6,7Yu-Ting Kuo5,8Jeon-Hor Chen9,10
 Ching-Chung Ko5,11,12*
- 1Department of Electrical Engineering, National Cheng Kung University, Tainan, Taiwan
- 2Graduate Institute of Electronics Engineering, National Taiwan University, Taipei, Taiwan
- 3Department of Anesthesiology, Chi Mei Medical Center, Tainan, Taiwan
- 4Department of Hospital and Health Care Administration, College of Recreation and Health Management, Chia Nan University of Pharmacy and Science, Tainan, Taiwan
- 5Department of Medical Imaging, Chi-Mei Medical Center, Tainan, Taiwan
- 6Department of Neurosurgery, Chi Mei Medical Center, Tainan, Taiwan
- 7Department of Nursing, Min-Hwei College of Health Care Management, Tainan, Taiwan
- 8Department of Medical Imaging, Kaohsiung Medical University Hospital, Kaohsiung, Taiwan
- 9Department of Radiological Sciences, University of California, Irvine, Irvine, CA, United States
- 10Department of Radiology, E-DA Hospital, I-Shou University, Kaohsiung, Taiwan
- 11Department of Health and Nutrition, Chia Nan University of Pharmacy and Science, Tainan, Taiwan
- 12Institute of Biomedical Sciences, National Sun Yat-Sen University, Kaohsiung, Taiwan
Objectives: A subset of non-functioning pituitary macroadenomas (NFMAs) may exhibit early progression/recurrence (P/R) after tumor resection. The purpose of this study was to apply deep learning (DL) algorithms for prediction of P/R in NFMAs.
Methods: From June 2009 to December 2019, 78 patients diagnosed with pathologically confirmed NFMAs, and who had undergone complete preoperative MRI and postoperative MRI follow-up for more than one year, were included. DL classifiers including multi-layer perceptron (MLP) and convolutional neural network (CNN) were used to build predictive models. Categorical and continuous clinical data were fed into the MLP model, and images of preoperative MRI (T2WI and contrast enhanced T1WI) were analyzed by the CNN model. MLP, CNN and multimodal CNN-MLP architectures were performed to predict P/R in NFMAs.
Results: Forty-two (42/78, 53.8%) patients exhibited P/R after surgery. The median follow-up time was 42 months, and the median time to P/R was 25 months. As compared with CNN using MRI (accuracy 83%, precision 87%, and AUC 0.84) or MLP using clinical data (accuracy 73%, precision 73%, and AUC 0.73) alone, the multimodal CNN-MLP model using both clinical and MRI features showed the best performance for prediction of P/R in NFMAs, with accuracy 83%, precision 90%, and AUC 0.85.
Conclusions: DL architecture incorporating clinical and MRI features performs well to predict P/R in NFMAs. Pending more studies to support the findings, the results of this study may provide valuable information for NFMAs treatment planning.
Introduction
Pituitary adenomas constitute up to 15% of all intracranial tumors (1), and the majority of these tumors are nonfunctioning adenomas (2, 3). Nonfunctioning pituitary macroadenomas (NFMAs), defined as a tumor larger than 10 mm in diameter, are the most common presentation among pituitary tumors (2, 3). Clinically, NFMAs often cause bitemporal hemianopia due to compression of the optic chiasm. Endocrine dysfunction such as hypopituitarism is found in some patients because of tumor compression of the normal pituitary gland. According to 2017 WHO classification system, pituitary tumors are classified as adenoma, carcinoma, or blastoma (4). Although most NFMAs are diagnosed as benign adenomas, up to 52.7% of these tumors may undergo early progression/recurrence (P/R) after surgical resection (5). The trans-sphenoidal approach (TSA) is the optimal surgery for NFMAs in current clinical practice. However, gross total resection (GTR) is often difficult to achieve for large solid NFMAs with extrasellar extension (6). Although postoperative adjuvant radiotherapy (RT) can be used to reduce P/R in NFMAs after surgery, this method may result in irreversible pituitary insufficiency and other long-term complications (7).
Conventional MRI features such as cavernous sinus invasion, extrasellar extension, and absence of tumor apoplexy have been reported as significant imaging parameters related to P/R in NFMAs (8–11). However, most of these parameters are qualitative and subjective with inter-observer variation. Currently, machine learning (ML) algorithms have become a popular tool in cancer prognosis and prediction because it offers quantitative and objective information (12). Integration of mixed data such as clinical data and diagnostic imaging is an obvious trend toward personalized medicine (13). Imaging-based ML algorithms include two popular methods: handcrafted feature-based and automatic feature-learning based models (14). For automatic feature-learning based models, deep learning (DL) is a powerful method for building predictive models for cancer diagnosis (15). Both multilayer perceptron (MLP) and convolutional neural network (CNN) are popular DL models and can be used for image classification. As compared with MLP that takes vector as input, CNN takes tensor as input and better understands spatial relations between pixels of images. Thus, CNN performs better than MLP for complicated images and videos classification (16). CNN had attracted attention when large-scale CNN for image classification successfully outperformed all other techniques in the ImageNet 2012 competition (17). CNN is designed to learn spatial hierarchies of features automatically and adaptively through backpropagation by using three building blocks: convolution layers, pooling layers, and fully connected layers. Recently, several studies have reported that deep CNN-based approaches can achieve state-of-the-art performance in lesion detection and cancer diagnosis (18–21).
Regarding clinical applications in the management of pituitary adenomas, DL models such as MLP or CNN have been used to evaluate tumor secreting function (22), tumor consistency (23, 24), detection of pituitary adenoma (25, 26), classification of sellar tumor types (27), and predicting the extent of surgery (28). U-Net and derived DL models are currently considered as optimal for image segmentation (29). Recently, DL showed high accuracy in predicting suboptimal postoperative outcomes in functional pituitary adenomas (30). However, the DL gmodels for predicting tumor recurrence in NFMAs have not yet been reported. The purpose of this study was to investigate the roles of DL in predicting P/R in NFMAs, using the combination of clinical and MRI features in MLP and CNN architectures.
Materials and Methods
Ethics Statement
The study was approved by the Institutional Review Board (IRB no. 10902-009) of our center. Signed informed consent was waived because the retrospective nature of this study does not affect the healthcare of the included patients. All patients’ medical records and imaging data were de-identified before analysis.
Patient Selection
The inclusion criteria of this study were patients diagnosed with benign NFMAs by brain MRI (diameter > 10 mm) and pathological confirmation. All included patients must have undergone complete preoperative brain MRI, at least one postoperative MRI performed at 3 to 6 months after surgery, and serial postoperative brain MRI follow-up for more than 1 year. Patients with evidence of hormone hypersecretion in clinical, biochemical, and histopathological examinations were excluded. Based on data of previous studies (8, 31), prolactinoma is considered unlikely if the prolactin levels are below 100 ng/mL, and this diagnosis was thereafter excluded by immunocytochemical tests. Patients who received adjuvant RT before P/R were also excluded. From June 2009 to December 2019, 78 patients (49 men, 29 women, age 18 - 80 years; median age, 53.5 years) were included in this study according to above-mentioned inclusion and exclusion criteria. Total 42 P/R patients and 36 non-P/R patients were included. Seventy-six patients underwent surgery performed by TSA, and 2 patients received TSA and craniotomy due to large size tumors (tumor diameters of 6.5 cm and 6.1cm). The mean follow-up time for all patients was 42 months (range, 12 to 115 months). In 42 patients with P/R, the mean time to P/R was 25 months (range, 6 to 68 months).
Image Acquisition
The MR images were acquired using a 1.5-T (Siemens, MAGNETOM Avanto) (n = 39), 1.5-T (GE Healthcare, Signa HDxt) (n = 23), or a 3-T (GE Healthcare, Discovery MR750) (n = 16) MR scanner equipped with 8-channel head coils in each machine. The analyzed MR images included coronal T2-weighted image (T2WI) and coronal contrast-enhanced (CE) T1-weighted image (T1WI). CE T1WI images were obtained with intravenous administration of 0.1 mmol/kg of body weight of gadobutrol (Gadovist) or gadoterate meglumine (Dotarem). Detailed MR imaging parameters were described in Supplementary File 1.
Clinical and Radiological Variables
The clinical data were obtained from patients’ medical records. A neuroradiologist (C.C.K, with 11 years of experience in radiology) and a neurosurgeon (S.W.L, with 15 years of experience in neurosurgery) evaluated preoperative clinical and radiological features on the Picture Archiving and Communication System (PACS) (INFINITT Healthcare, Seoul, Korea) workstations (summarized in Table 1). For equivocal cases, judgment was made by consensus. Evaluation of cavernous sinus invasion (Knosp classification) (32) and extrasellar extension (Hardy’s classification) (33) were determined on preoperative coronal T2WI and CE T1WI. Quantitative MRI features were measured on coronal CE T1WI.
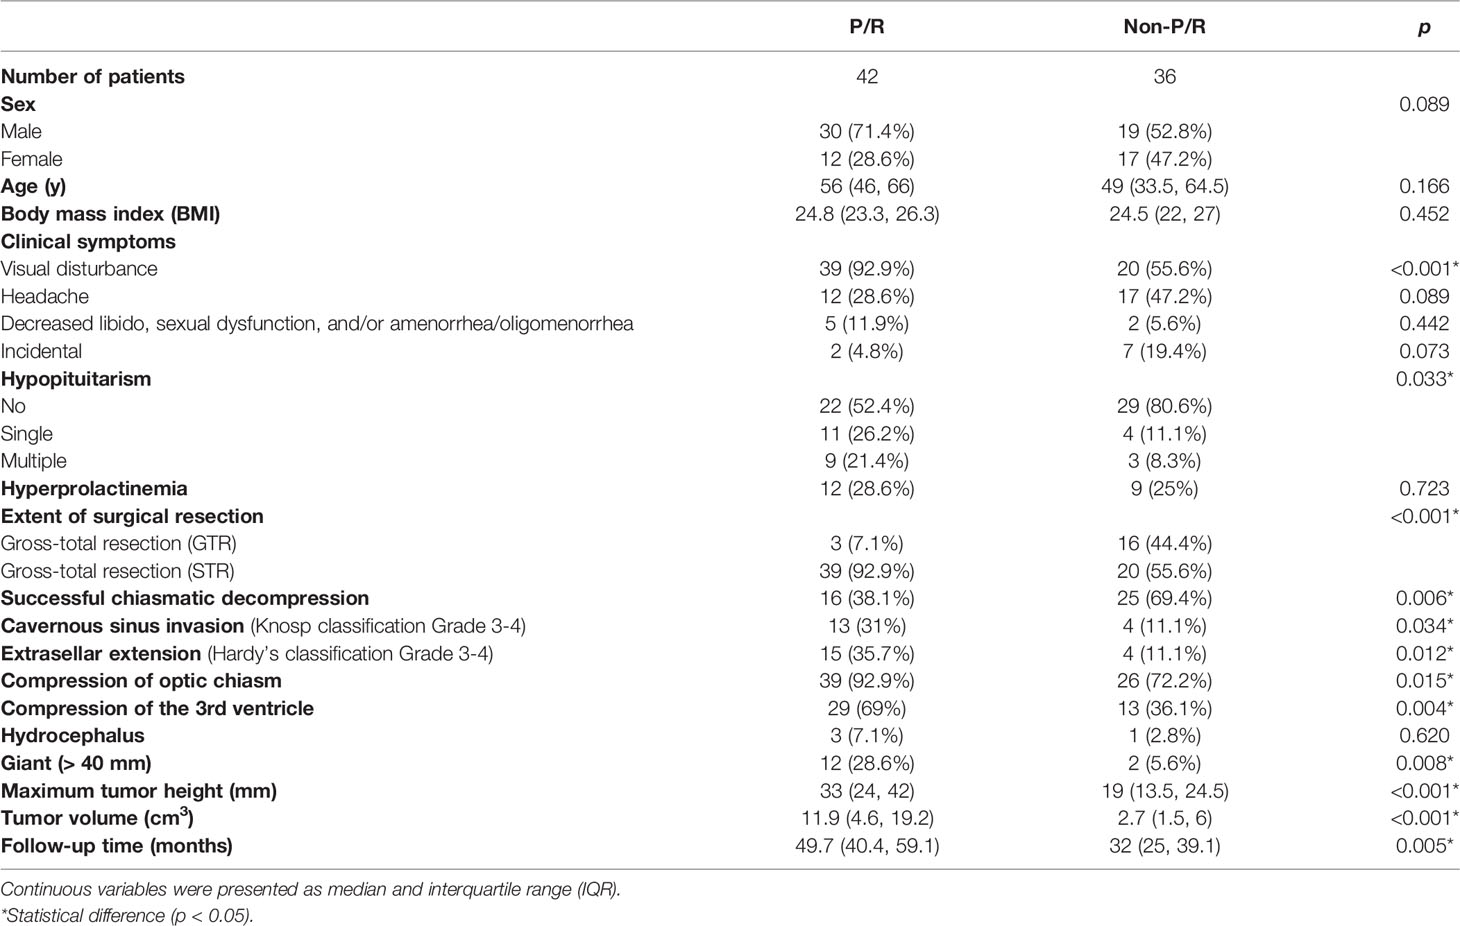
Table 1 The clinical data and MR features of nonfunctioning pituitary macroadenomas (NFMAs) with and without progression/recurrence (P/R).
Definitions of Extent of Resection (EOR) and Progression/Recurrence (P/R)
The extent of resection (EOR) was determined by review of preoperative and postoperative MRIs by a neuroradiologist (C.C.K) and a neurosurgeon (S.W.L). According to previously published studies (10, 34, 35), GTR was defined as NFMAs with a residual tumor volume of less than 10% as compared with its original tumor size. In contrast, subtotal resection (STR) was defined as the presence of residual tumor more than 10% of its original volume. For determining P/R in NFMAs, preoperative and serial postoperative MRIs were evaluated by a neuroradiologist (C.C.K) and a neurosurgeon (S.W.L), both of whom were blinded to the clinical outcomes of the studied patients. P/R was defined as progression (enlargement) of the residual tumor after STR or tumor recurrence (regrowth) after GTR observed on serial postoperative MRI (CE T1WI) as compared with the MRI performed at 3 to 6 months after surgery. The threshold of P/R in NFMAs was defined as a more than 2mm increase of residual tumor size in at least one dimension when compared with postoperative serial MRIs on CE T1WI (8, 10, 11, 35). For the determination of P/R, the inter-observer reliability with Cohen k value of 0.9 was obtained. Judgment was made by consensus in equivocal cases. Several studies showed the median time to early P/R in NFMAs was within 30 months (10, 36, 37), and the median follow-up time in the present study (both P/R and non-P/R groups) was longer than this interval.
Image Pre-Processing
Two MRI sequences, coronal T2WI and coronal CE T1WI, were used for analysis (Figure 1). Image pre-processing was performed for all MRI images in the training and validation datasets. Python image-processing package (pydicom) (38) was applied to MRI dicom files to obtain pixel data. Rescaling grey scale between 0 to 255 was performed. To fully exploit the information of tumor tissues, an experienced neuroradiologist (C.C.K) selected one coronal CE T1WI slice showing the largest tumor height as the input image. To allow the neural network model to focus on analyzing the tumor tissue without too much noise, the tumor tissue was moved to the center of the image and the outer region of the tumor image was removed. For each selected image, a cropping region with width/length of one third of the original image size is created. Then, the tumor tissue is placed at the center of this cropping region. The dataset was split into 5 folds for cross-validation. Data augmentations, including random flip, random rotate, random scale, and random shift, were applied to each MR image to enhance the training effectiveness and prevent overfitting (27). Some samples of processed images are shown in the Figure 1.
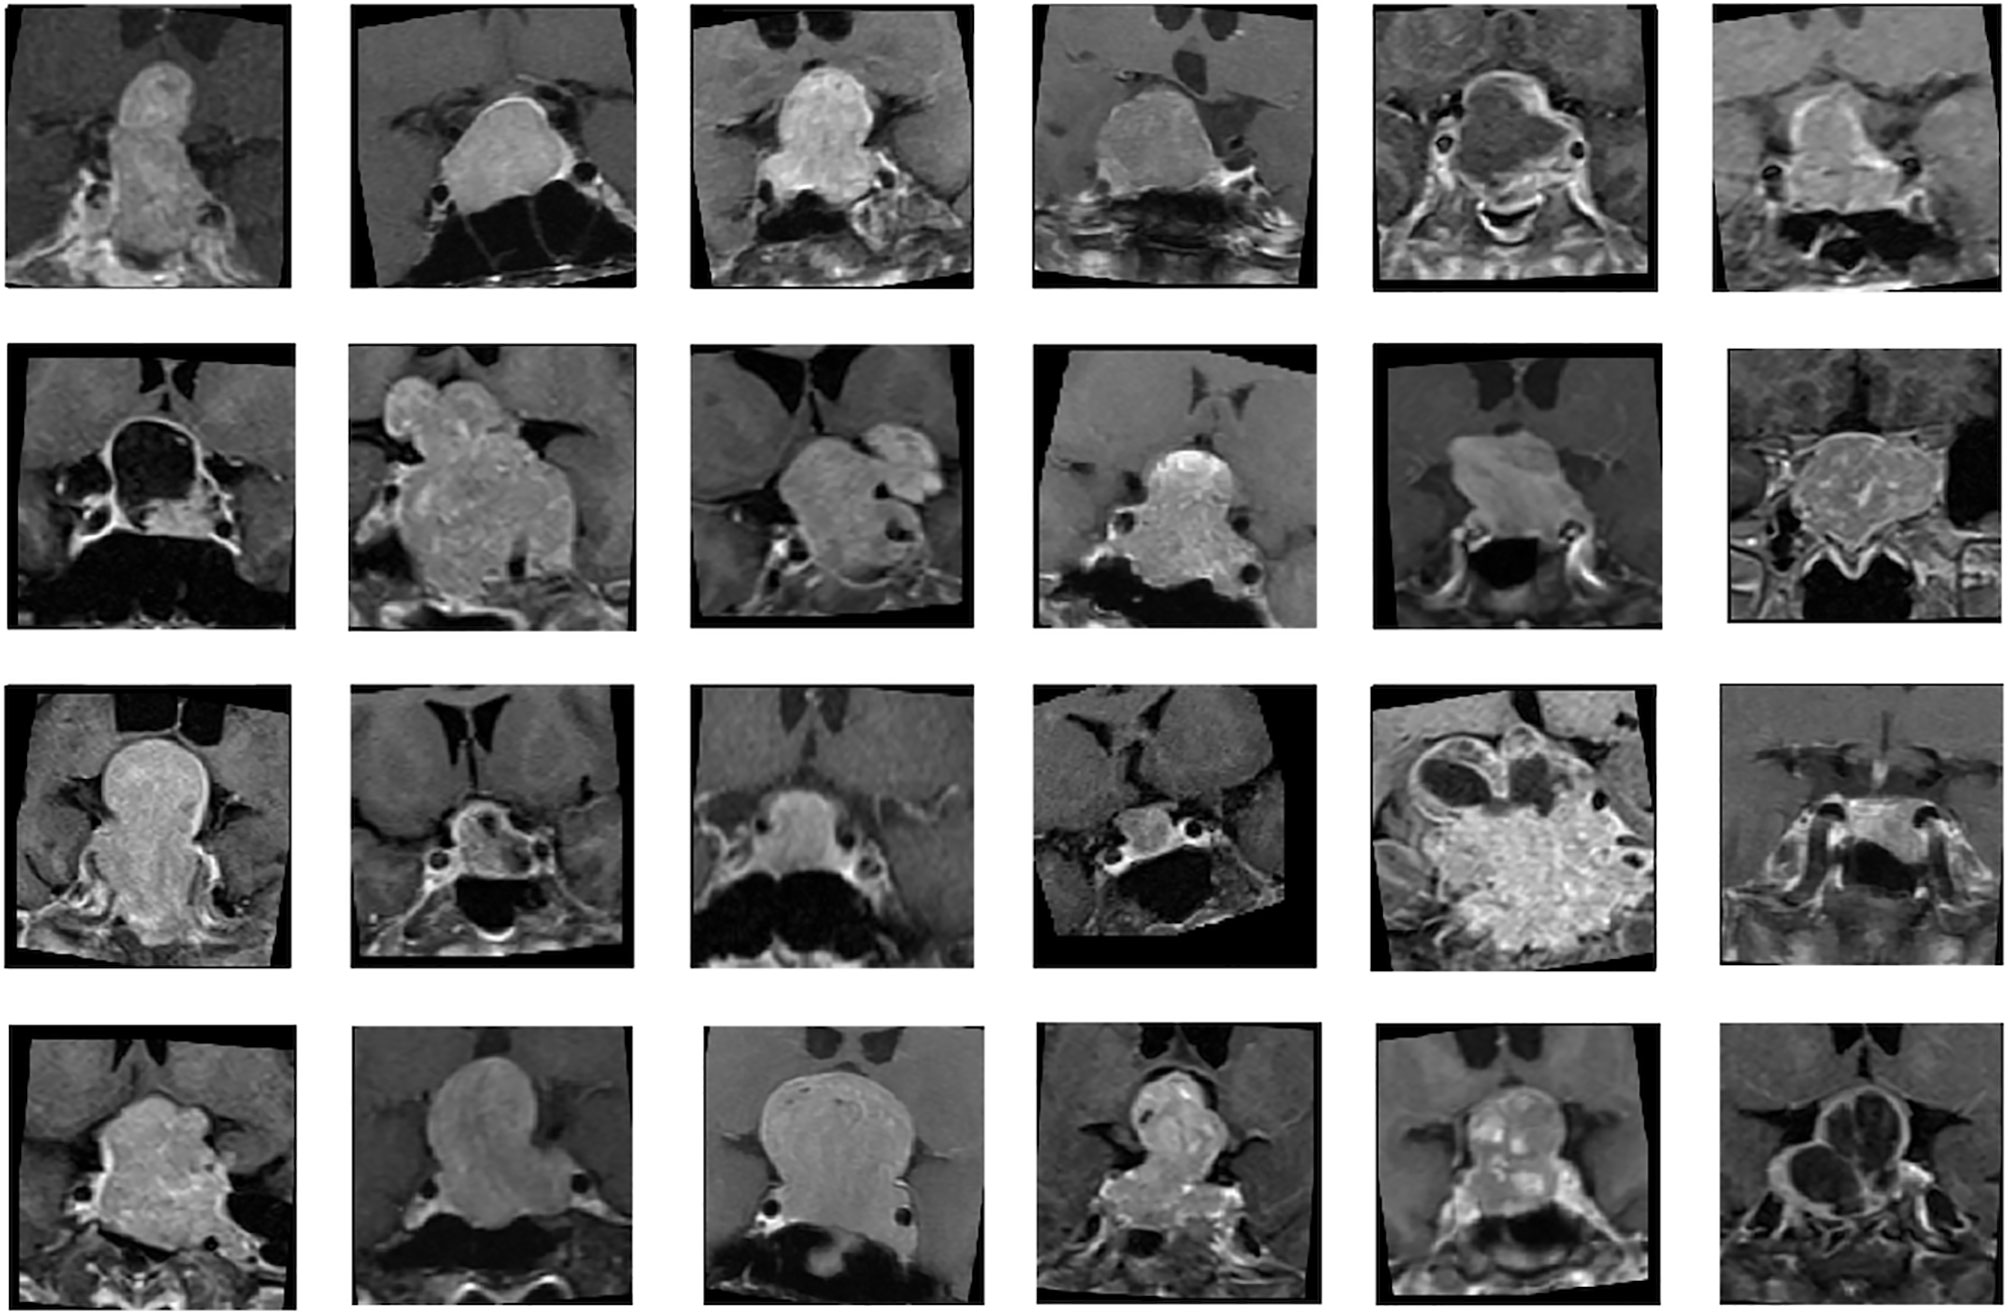
Figure 1 Samples of nonfunctioning pituitary macroadenomas (NFMAs) on coronal contrast-enhanced (CE) T1WI analyzed in CNN models.
Architectures of CNN, MLP, and multimodal CNN-MLP
Because of the small amount of data in this study, modern CNN-based architectures such as AlexNet (17) and GoogleNet (39) cannot be directly applied to train accurate models. Therefore, we proposed to build a relatively light model based on two classical CNN architectures: LeNet (40) and VGG16 (41) (Figure 2). For imaging analysis in CNN, our model takes MR images as input, and different imaging sequences (T2WI and CE T1WI) were stacked on the channel axis. This setting gave our model a chance to discover local image features from different MRI sequences. The two convolution layers in LeNet are replaced by convolution blocks from VGG16 (i.e., Convolution 1 and Convolution 2), which are formed by three 3 x 3 convolution layers (Figure 2). Then, the extracted image feature from second pooling layer (Pooling 2) is fed to three fully connected (FC) layers (FC1, FC2, and FC3) to predict the P/R. The idea of combining two such CNN models improves the predictive effectiveness. The reason is twofold. First, the original VGG16 is a complex and heavy model that suffers from the lack of data; thus, we set the basic CNN model as LeNet. Second, the convolution block of VGG16 can capture much more multi-scale image features than the original convolution block of LeNet. In this study, the designed architecture improved the predictive effectiveness as compared with applying LeNet or VGG16 individually.
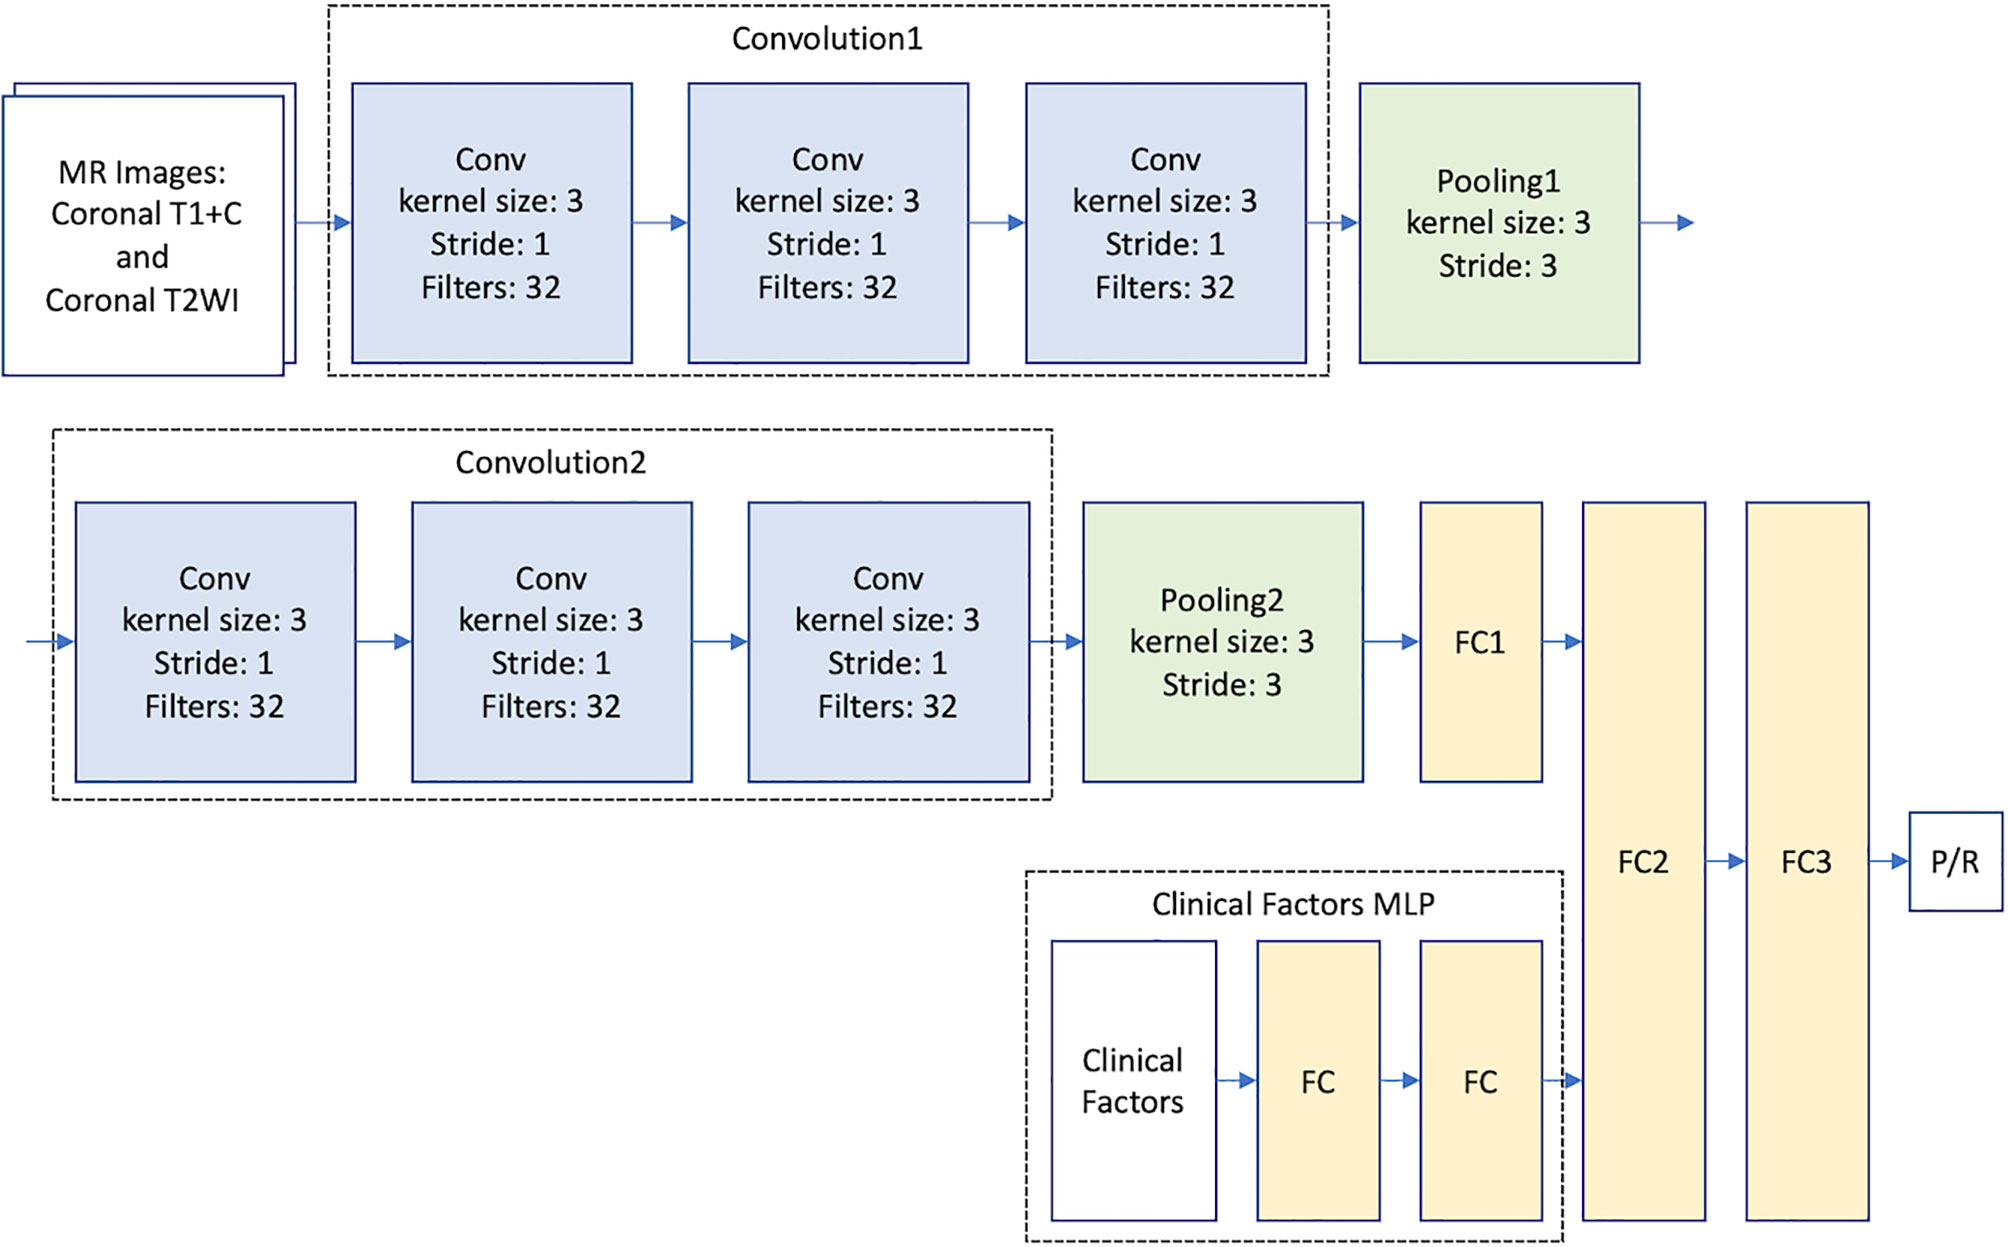
Figure 2 Multimodal CNN_v1-MLP architecture for prediction of progression/recurrence (P/R) in NFMAs.
To provide clinical variables (summarized in Table 1) to the model, a MLP network that takes clinical factors as input was added before the second fully connected layer (FC2). MLP is a class of neural network, which is good at learning relationships from categorical features. The multimodal CNN-MLP model captures both image and numerical clinical features. The following clinical variables were included in the MLP model: sex, age, body mass index (BMI), clinical symptoms, hypopituitarism, hyperprolactinemia, EOR, chiasmatic decompression, Knosp and Hardy classifications, compression of optic chiasm and 3rd ventricle, hydrocephalus, tumor diameter, and tumor volume (Table 1). Details of the multimodal CNN-MLP architecture is shown in Figure 2. Another multimodal CNN_v2-MLP model were described in Supplementary File 2.
Training Process
All experiments were trained on one NVIDIA GTX1080ti graphic card with TensorFlow 2.1. We train each model from scratch with the following setting and hyperparameters. All variables were initialized with Glorot uniform (or called Xavier uniform), and Adam optimizer was used. Learning rate initialized at 0.0001 and started decade after 20 epochs. Binary cross entropy was used as the loss function since the final prediction is only progression or recurrence. Each experiment was conducted with 5-fold cross validation to observe the stability and reliability of our model. All P/R and non-P/R case were separated evenly into 5 folds in order to prevent data imbalance. Each fold contained 8 to 9 P/R cases and 6 to 7 non-P/R cases. Hyperparameters were tuned to find the most robust models according to area under curve (AUC) values. Then, the best model was selected, and final performance results were obtained by repeated cross-validation. Training with a small dataset usually encounters overfitting. Therefore, random dropout layers were applied to each layer during the training process (42). Moreover, L1 and L2 regularizations were applied to fully connected layers with L1 penalty weight 1e-4 and L2 penalty weight 3e-5. The dataset is divided into training and validation sets according to 5-fold cross-validation. That is, each evaluation includes 80% data for training and 20% data for validation.
Statistical Analysis
Statistical analyses were performed using the statistical package SPSS (V.25.0, IBM, Chicago, IL, USA). For the evaluation of clinical and radiological data, Chi-square (or Fisher’s exact test) and Mann-Whitney U tests were performed for categorical and continuous data respectively. For the evaluation of performance in DL models, the accuracy, precision, positive predictive value (PPV), negative predictive value (NPV), recall, F1 score, loss and AUC of the different prediction models were calculated. DeLong test by MedCalc statistical software (version 20.027) was used for comparison of receiver operating characteristic (ROC) curves in different DL models. Binary cross-entropy method was used for loss calculation (43). The cross-entropy loss can be calculated using the following equation:
where N is the batch size, pi represents the predictive probability (result of the classifier) and yi represents the expected output. For all statistical analyses, p-values < 0.05 were considered statistically significant.
Results
Clinical and Radiological Features
The clinical and radiological features are summarized in Table 1. P/R was diagnosed in forty-two (42/78, 53.8%) patients. Among sex, age, and BMI, male sex is the most important clinical covariate in the predictive model. Significant differences (p < 0.05) were observed in visual disturbance, hypopituitarism, EOR, successful chiasmatic decompression, cavernous sinus/extrasellar extension, compression of the optic chiasm/3rd ventricle, and tumor height/volume between patients with and without P/R (Figures 3, 4). Although significant difference in follow-up duration existed between P/R and non-P/R groups, the follow-up time in both groups (49.7 and 32 months) was more than mean time to P/R (25 months).
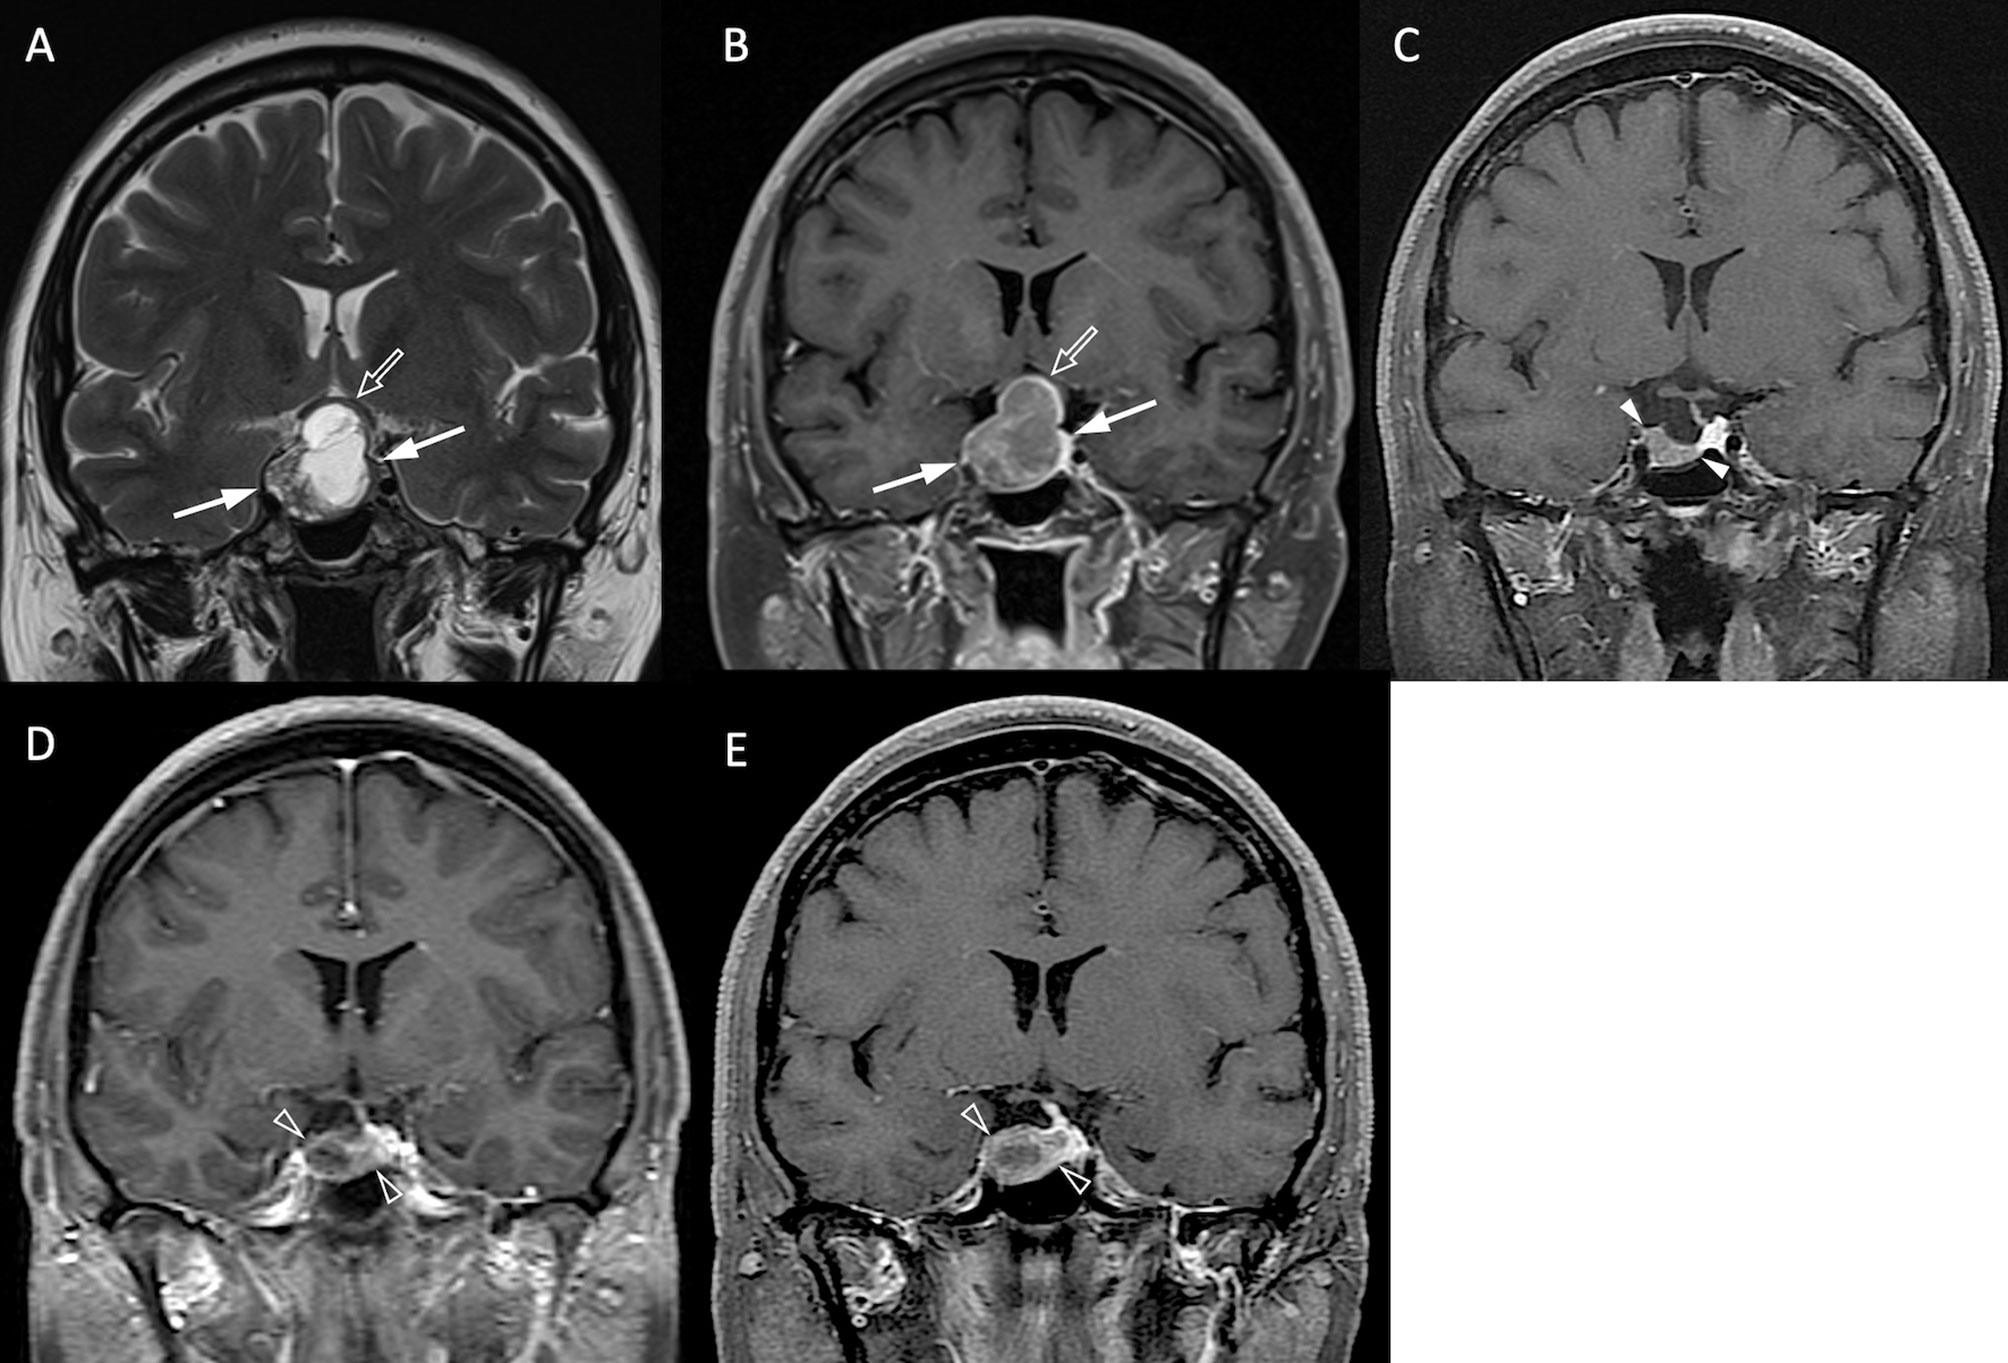
Figure 3 NFPA with P/R. A 45-year-old female patient with blurred vision, headache, and pathologically confirmed NFMA. (A, B) Coronal T2WI (A) and CE T1WI (B) show a NFMA (white arrows) with upward suprasellar extension, causing compression of the optic chiasm and the third ventricle (open arrow). (C) Subtotal tumor resection via transsphenoidal approach (TSA) was performed, and the residual tumor (arrowheads) was observed. (D, E) Progression of the residual tumor (open arrowheads) was observed in 27 months (D) and 43 months (E) after surgery.
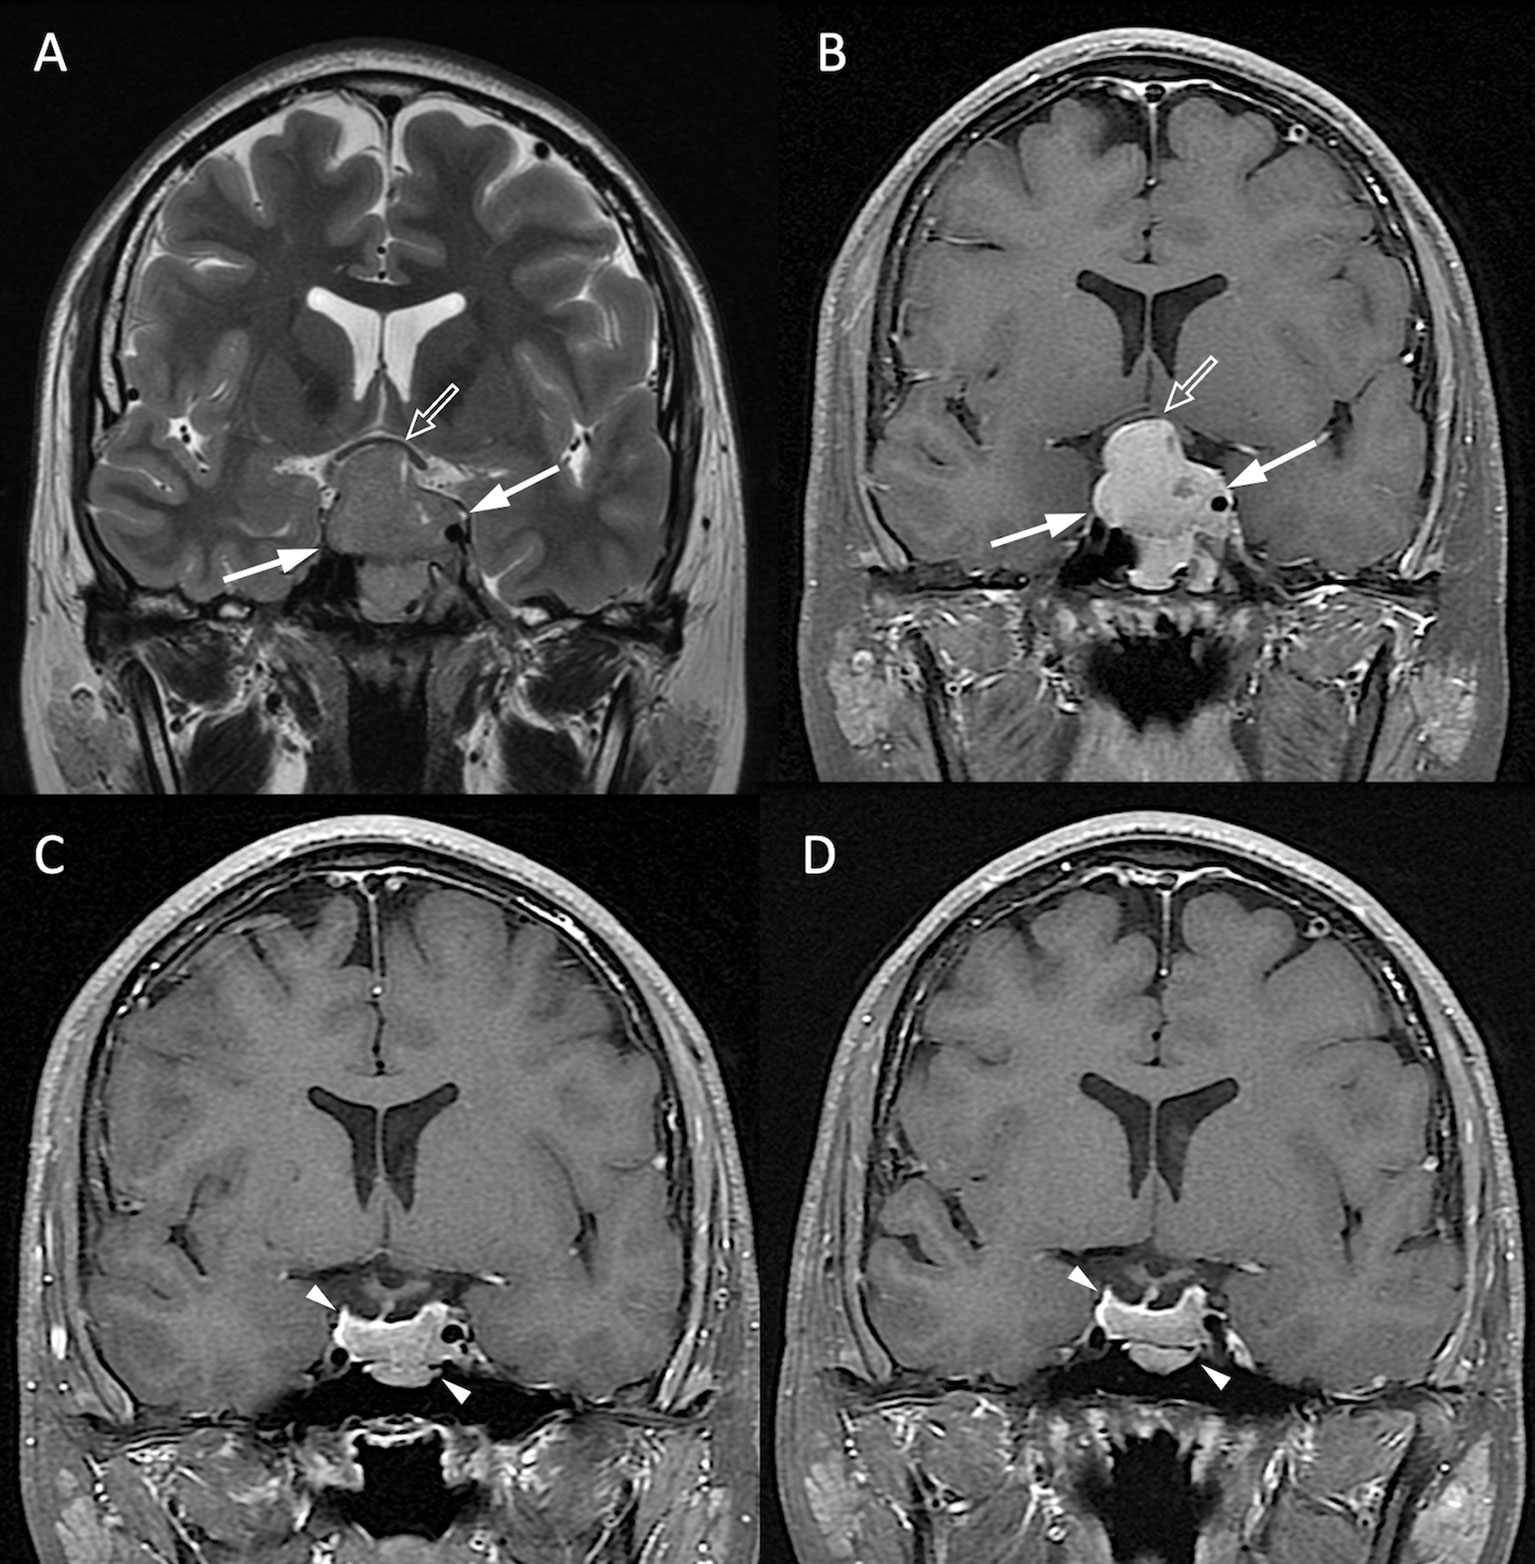
Figure 4 NFPA without P/R. A 20-year-old male patient with blurred vision and pathologically confirmed NFMA. (A, B) Coronal T2WI (A) and CE T1WI (B) show a NFMA (white arrows) with upward suprasellar extension, causing compression of the optic chiasm and the third ventricle (open arrow). (C) Subtotal tumor resection via TSA was performed, and the residual tumor (arrowheads) was observed. (D) No progression of the residual tumor (arrowheads) was observed 48 months after surgery.
Performance of CNN, MLP, and Multimodal CNN-MLP Architectures
Total 62 training cases and 16 validation cases from real patients were included. The data were extended to 6,240 training samples and 1,560 validation samples for ML. The evaluation metrics included accuracy, precision, PPV, NPV, recall, F1 score, and AUC in training and validation sets. The performance of different predictive models in the validation set are summarized in Table 2. All metrics were averaged using 5-fold cross validation. Among different combinations of input and model architectures, the multimodal light-weighted CNN_v1 model (using CE T1WI and T2WI) combined with 3-layer MLP (using clinical features) showed the best performance for prediction of P/R, with AUC up to 0.85 (Figure 5). Metrics of training and validation sets over epochs in this best predictive model are shown in Figure 6. In this predictive model, accuracy of 83%, precision of 90%, PPV of 89%, NPV of 78%, recall of 78%, F1 score of 0.84, and AUC of 0.85 were obtained in the validation set (Figure 6). Table 3 showed comparison of ROC curves in different DL models. Although CNN_v1 model (CE T1WI and T2WI) + 3-layer MLP (clinical features) showed the best predictive performance, no statistical significance exists in AUC values between the three best predictive models: CNN_v1 (T2WI/CE T1WI) + 3-layer MLP, CNN_v1 (T2WI/CE T1WI) + 2-layer MLP, and CNN_v1 (T2WI/CE T1WI).
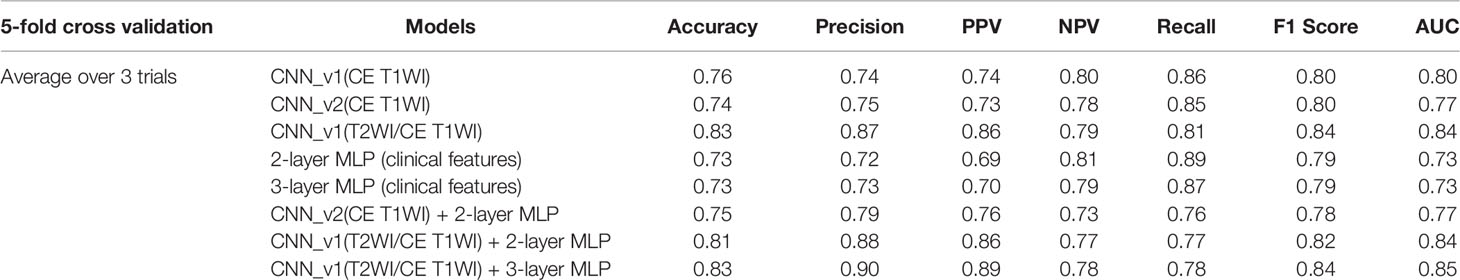
Table 2 Performance of CNN, MLP, and multimodal CNN-MLP architectures for prediction of P/R in validation set of NFMAs.
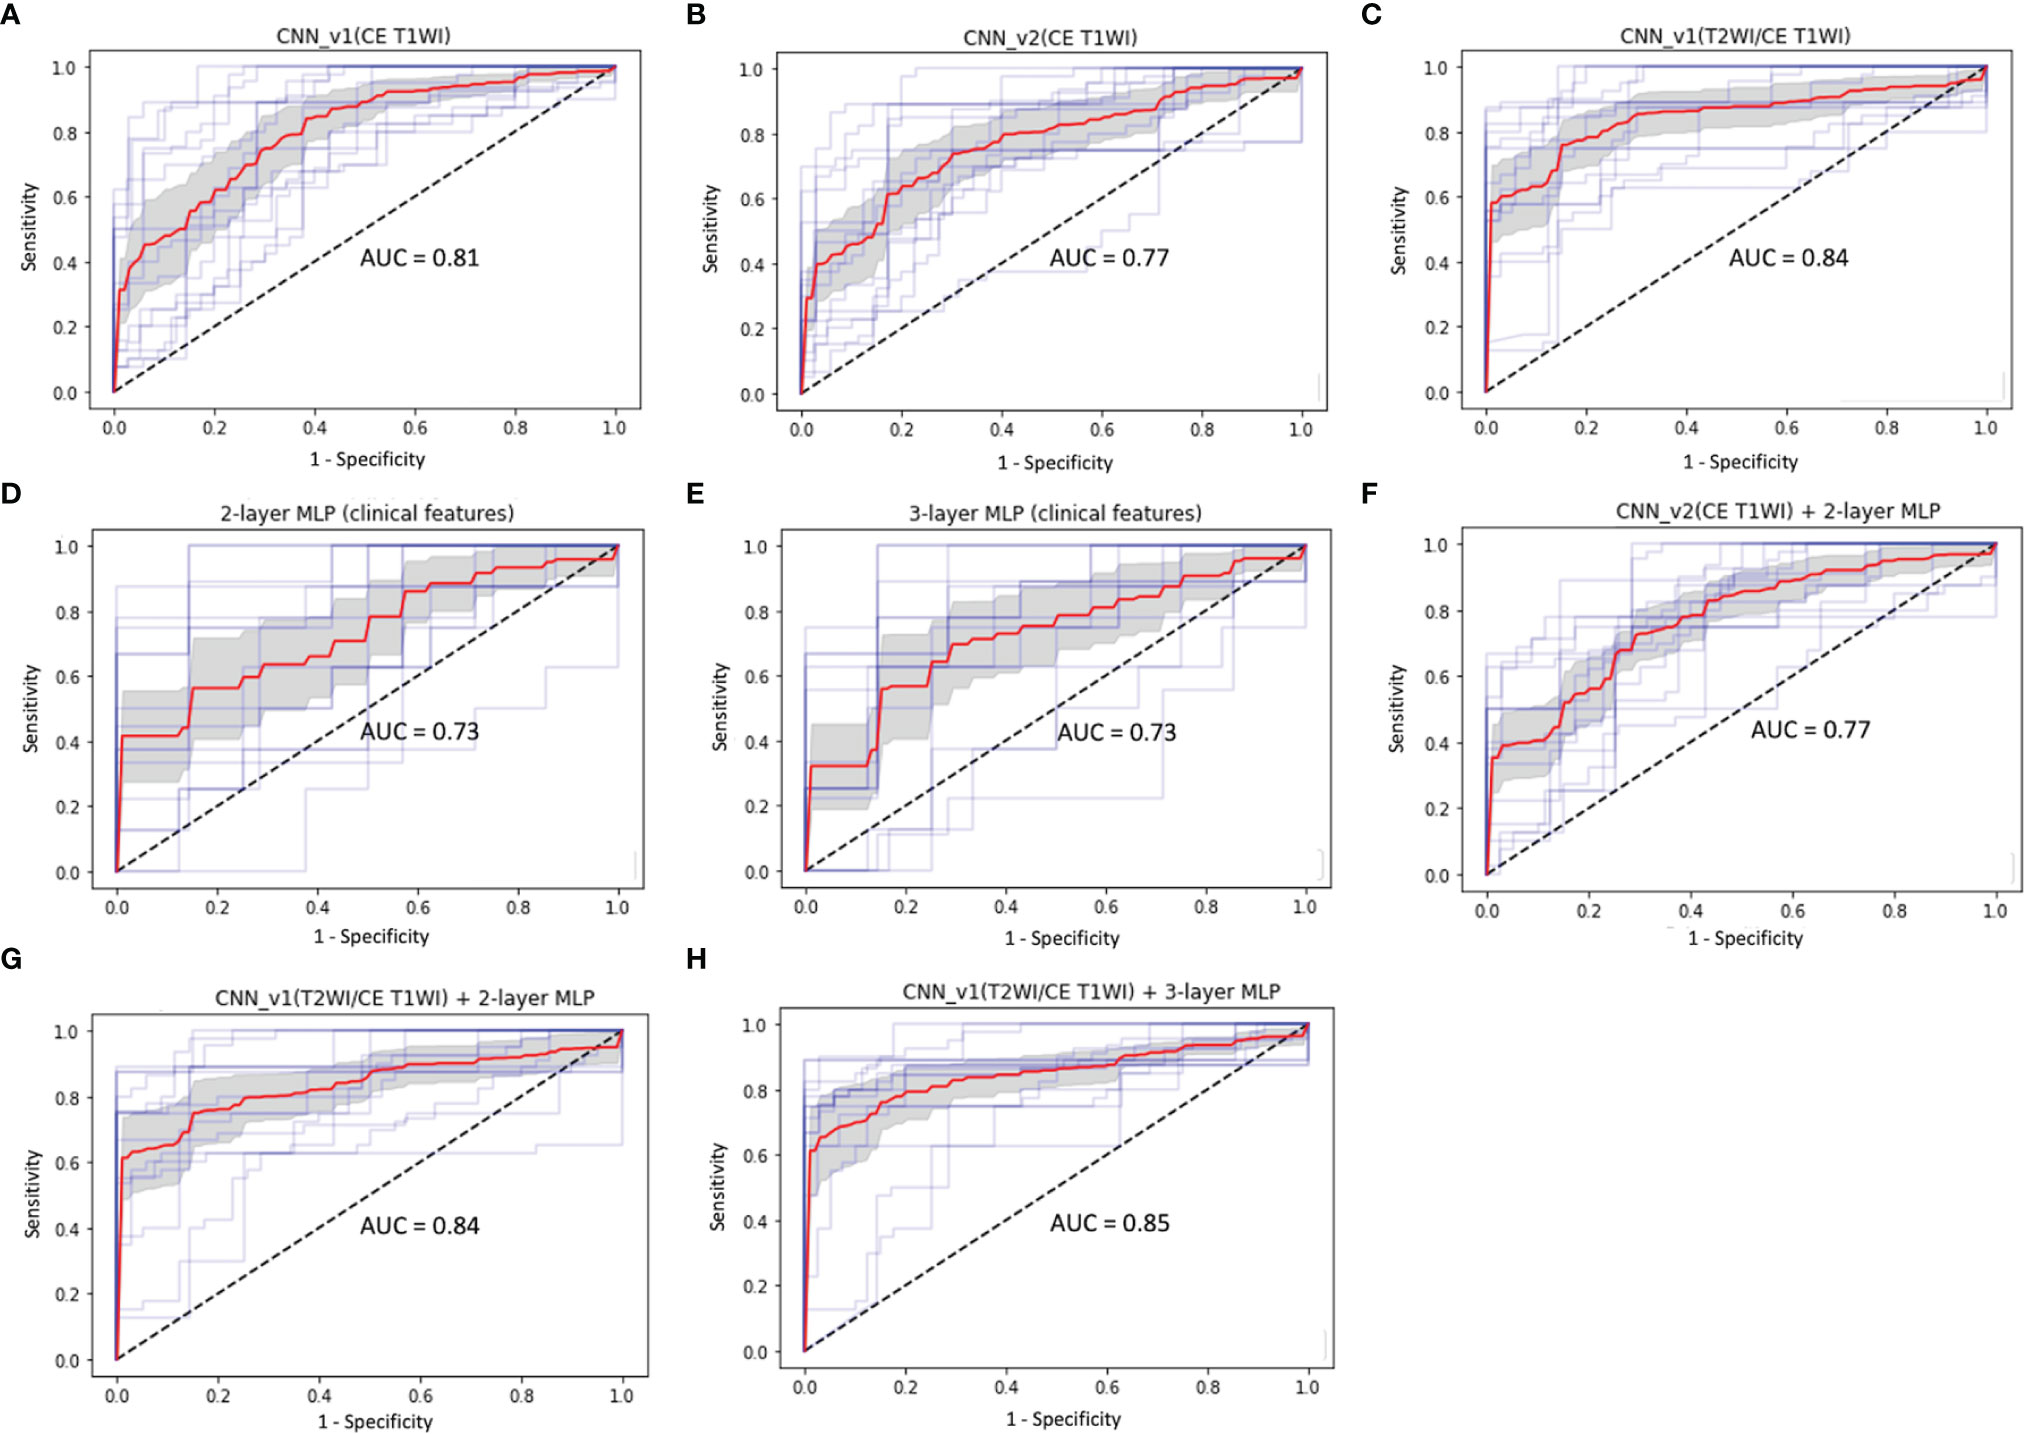
Figure 5 ROC curves (red: average, blue: 5 folds for cross-validation, gray: 95% confidence interval) and AUC values in (A) CNN_v1 (CE T1WI), (B) CNN_v2 (CE T1WI), (C) CNN_v1 (T2WI/CE T1WI), (D) 2-layer MLP (clinical features), (E) 3-layer MLP (clinical features), (F) multimodal CNN_v2 (CE T1WI) + 2-layer MLP, (G) multimodal CNN_v1 (T2WI/CE T1WI) + 2-layer MLP, and (H) multimodal CNN_v1 (T2WI/CE T1WI) + 3-layer MLP architectures for prediction of P/R in NFMAs.
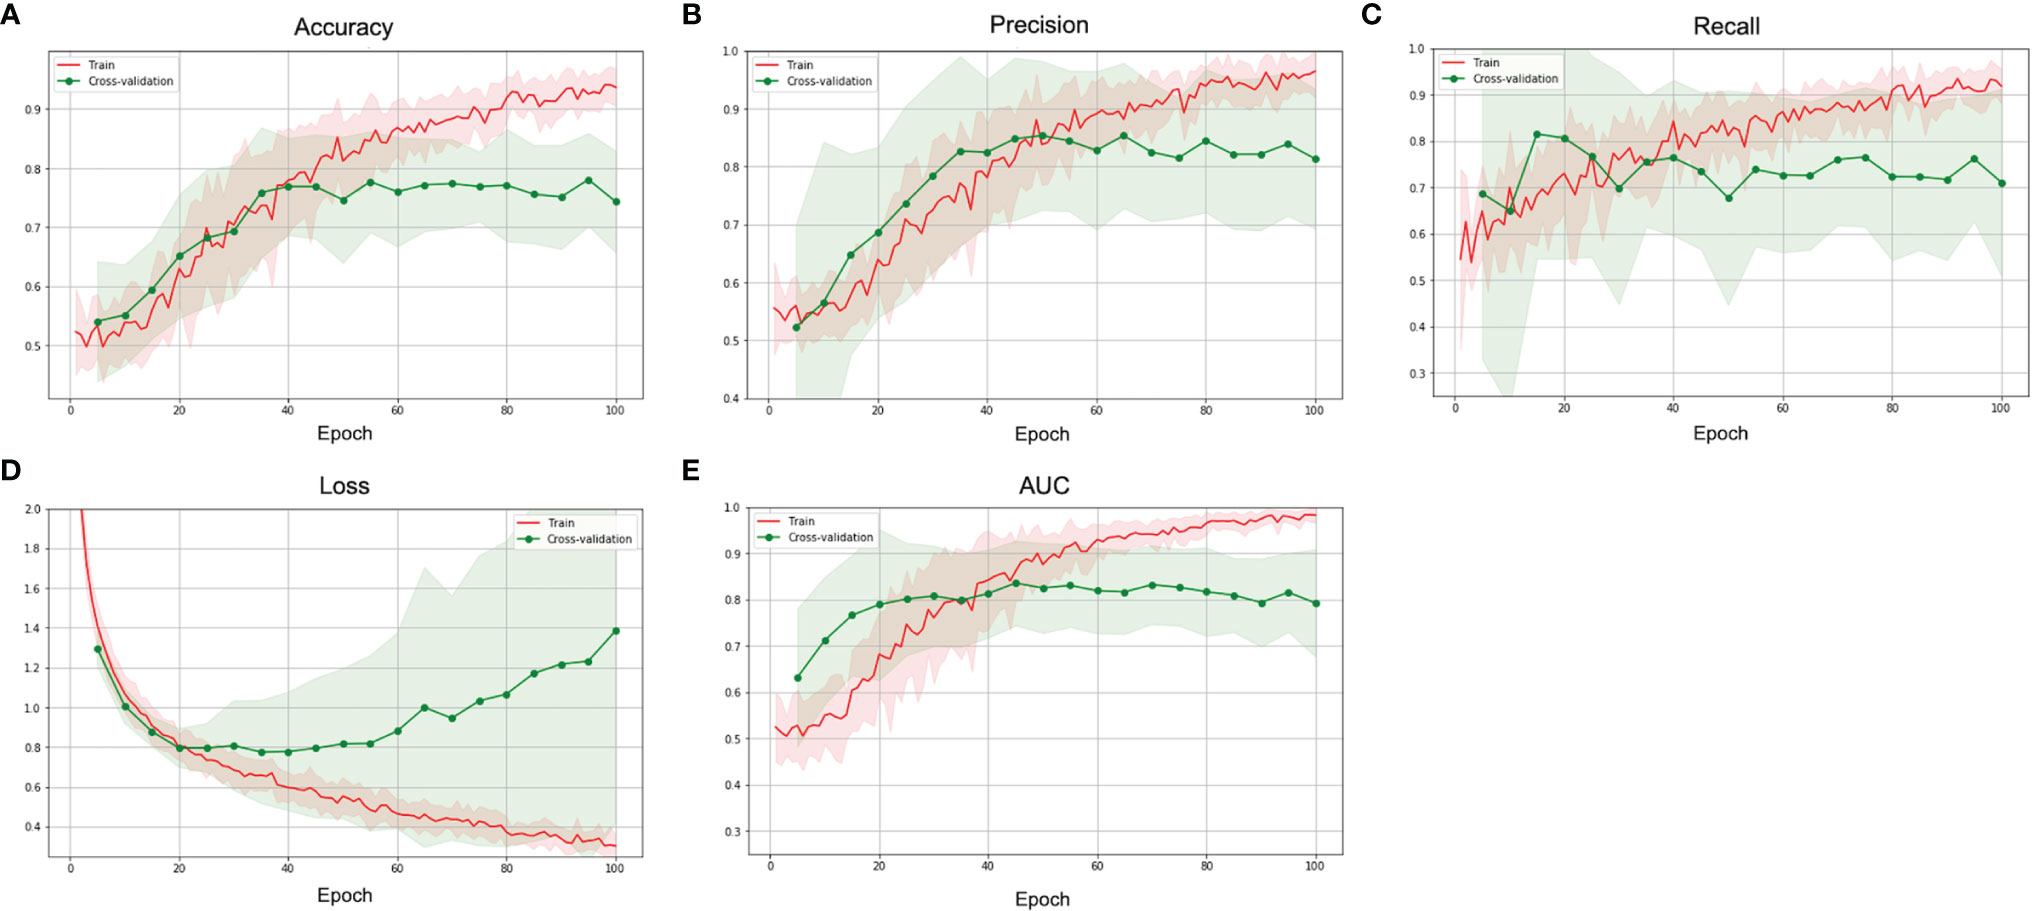
Figure 6 The (A) accuracy, (B) precision, (C) recall, (D) loss, and (E) AUC over epochs of the training (red) and validation (green) sets in the best multimodal CNN-MLP model for prediction of P/R in NFMAs.
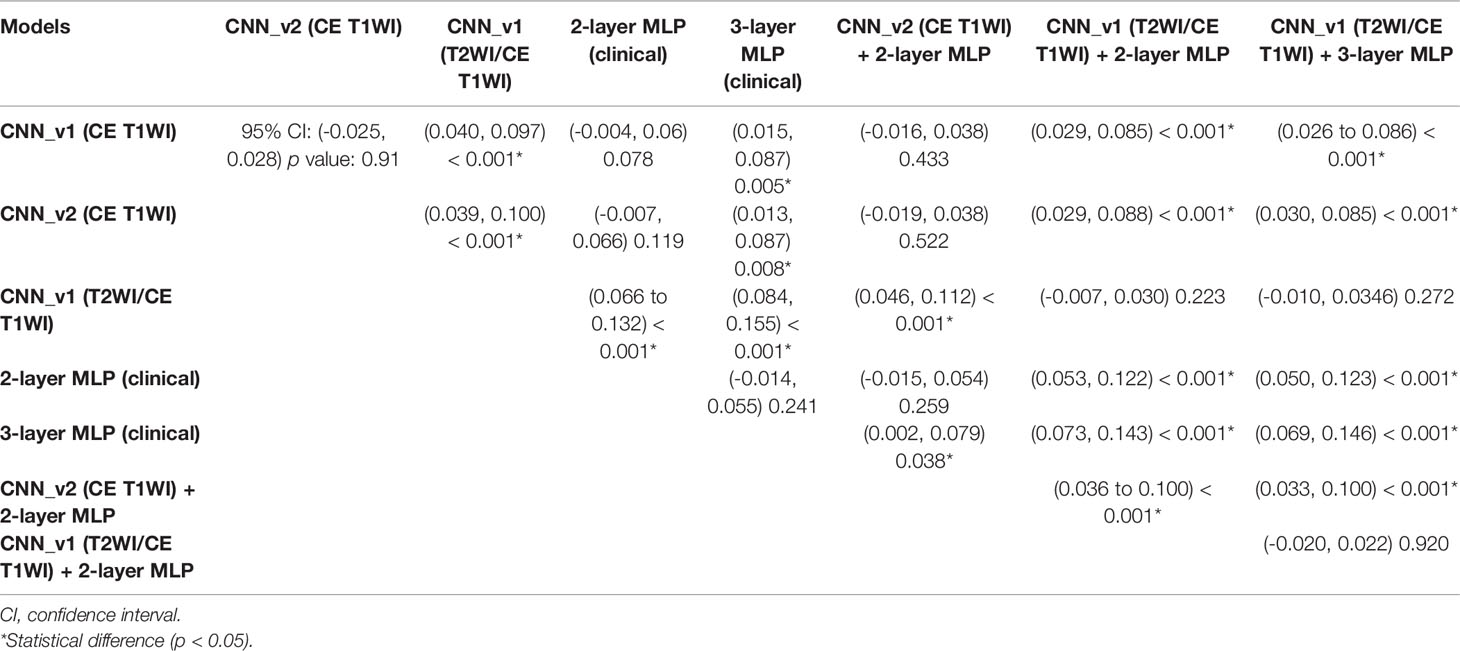
Table 3 Comparison between ROC curves of CNN and MLP architectures for prediction of P/R in NFMAs.
Discussion
The present study explored the effectiveness of DL for prediction of tumor progression and recurrence in NFMAs. Both clinical and MRI data were used in different DL models to compare the performance between models. Several DL architectures, including CNN models using T2WI and CE T1WI data, MLP models using clinical data, and multimodal CNN-MLP models using both data were developed. Among these architectures, the multimodal CNN-MLP models using combination of clinical and MRI data showed the best performance.
Although most NFMAs (> 90%) are benign adenomas according to the 2017 WHO classification system (4), up to half of patients (25% - 55%) may exhibit early tumor P/R within 5 years after surgery (5). The Ki-67 index and cell mitosis in histopathology with tumor invasion on imaging are all associated with aggressive clinical behavior in NFMAs (4). However, the invasive growth of NFMAs is not clearly defined in the WHO criteria, and it is usually dependent on corresponding MRI study (5). For functioning pituitary adenomas, postoperative hormone concentration serves as a biomarker to detect tumor recurrence; in contrast, no specific factor is used as a marker for NFMAs (5). Conventional qualitative MR imaging features such as cavernous sinus invasion and solid tumor consistency have been reported as impact parameters associated with P/R in NFMAs (6, 8–11). Recently, low apparent diffusion coefficient (ADC) value, indicating a high cellular density, is reported to be associated with P/R in NFMAs (10, 44). However, the ADC values are often affected by susceptibility imaging artifacts from blood products due to apoplexy or necrosis in NFMAs; therefore, they can only be measured for solid tumor without hemorrhage or cystic changes (6, 10, 45). The major imaging-based ML algorithms include DL and radiomics approaches (46). As compared with conventional handcrafted radiomics, the present DL models obtain discriminative features automatically from images (47). For prediction of recurrence in NFMAs, Zhang et al. (35) first reported an accuracy of 82% and AUC of 0.78 in radiomics analysis, and superior predictive performance in DL models was obtained in the present study.
The results of clinical evaluation in NFMAs by MRI-based CNN models are excellent, and most studies report accuracy up to 90% and AUC up to 0.80 (22–30). Compared with the previously reported studies, the application of DL for predicting clinical outcomes in NFMAs have not yet been reported, and no similar studies can be compared. In our results, adding T2WI improves the predictive excellence as compared with CNN models using CE T1WI only, with AUCs of 0.84 and 0.80 respectively. For clinical features analyzed in MLP models, AUC of 0.73 in prediction of P/R can be obtained. The best performance (AUC of 0.85) can be achieved using a combination of clinical and MRI features in a multimodal CNN-MLP architecture. Herein, we have introduced this new concept concerning DL algorithms for prediction of P/R in NFMAs, although the architectures must be validated in future studies with larger sample size.
The extent of surgical resection is known to be a significant determining factor affecting tumor recurrence rates in NFMAs (8), and the present study has shown similar results. However, a significant association between the number of surgical resections and complication rates in NFMAs has been observed (48). Diabetes insipidus and anterior pituitary insufficiency are the most commonly encountered surgical complications in NFMAs, with occurrence rates of 18% and 19%, respectively (48). On the other hand, although postoperative adjuvant RT offers excellent tumor control rate in NFMAs, it may increase risks of long-term complications such as hypopituitarism, cerebrovascular accident, visual deterioration, and dementia (49, 50). Because adjuvant RT may affect the independent predictive value of the preoperative MRI-based DL analysis for P/R, patients who have received adjuvant RT before P/R were excluded from the present study. Since most NFMAs are benign tumors, preoperative prediction of tumor recurrence offers clinically valuable information for treatment options. For patients at high risks of tumor recurrence, aggressive surgical resection with adjuvant RT and close MR imaging follow-up should be considered. In contrast, for patients at lower risks of P/R, the aim of surgical treatment would be to relieve clinical symptoms by decreasing tumor mass effect. On the other hand, follow-up time is an important factor for detection of P/R in NFMAs, and it should be noticed that more recurrence may occur in patients with longer follow-up time even if the predictive model shows low risk at first. Avoiding potential surgical complications while maintaining a good treatment outcome represents optimal surgical planning for low-risk patients.
Although this is the first DL study combined clinical and MRI data for investigating tumor behavior in NFMAs, the study has several limitations. First, the retrospective study design and the limited sample size may lead to selection bias. Second, as in most imaging-based ML studies of pituitary tumors (51), the present study lacked external validation due to few available data. The MR images were acquired at a single medical center with a single protocol. Further testing with multi-institutional data and different pulse sequence protocols is necessary to determine whether the predictive model is generalizable. The inconsistency of scanning machine, magnetic field strength, and contrast agent type may affect the MR image feature. The variation in follow-up time existed between P/R and non-P/R groups due to the retrospective nature. The two-dimensional information on MR images may offer limited information to the trained model as compared with using three-dimensional convolution. Finally, when larger populations become available from more institutions, the modern CNN-based architectures such as AlexNet and GoogleNet may capture more image features, which can further improve model performance.
Conclusions
The present study explored the effectiveness of DL in predicting P/R of the NFMAs. Even with a limited training data set, the results showed novel DL architecture incorporating clinical and MRI features provides a high level of accuracy and reliability for predicting recurrence in NFMAs. Better predictive performance was observed in a multimodal CNN-MLP model incorporating both clinical and MRI data as compared with classifiers using either clinical or MRI data alone. The results offer valuable information for preoperative and postoperative planning in NFMAs management, including the extent of surgical resection, implementation of adjuvant RT, and the time interval of MRI follow-up. Nevertheless, the DL architectures still require validation using larger-scale datasets from multiple institutions.
Data Availability Statement
The original contributions presented in the study are included in the article/Supplementary Material. Further inquiries can be directed to the corresponding author.
Ethics Statement
The studies involving human participants were reviewed and approved by Chi Mei Medical Center Institutional Review Board (IRB no. 10902-009). Written informed consent for participation was not required for this study in accordance with the national legislation and the institutional requirements.
Author Contributions
Conceived and designed the experiments: C-CK and H-PH. Performed the experiments: Y-JC and C-CK. Analyzed the data: Y-JC, H-PH, and C-CK. Contributed reagents/materials/analysis tools: K-CH, Y-JS, and SWL. Wrote the paper: Y-JC and C-CK. Critically revised the article: Y-TK and JHC. All authors contributed to the article and approved the submitted version.
Funding
This work was supported by the Ministry of Science and Technology (MOST) in Taiwan (MOST 109-2314-B-384-010-MY2 and MOST 110-2636-E-006-011). The funders had no role in study design, data collection and analysis, decision to publish, or preparation of the manuscript.
Conflict of Interest
The authors declare that the research was conducted in the absence of any commercial or financial relationships that could be construed as a potential conflict of interest.
Publisher’s Note
All claims expressed in this article are solely those of the authors and do not necessarily represent those of their affiliated organizations, or those of the publisher, the editors and the reviewers. Any product that may be evaluated in this article, or claim that may be made by its manufacturer, is not guaranteed or endorsed by the publisher.
Supplementary Material
The Supplementary Material for this article can be found online at: https://www.frontiersin.org/articles/10.3389/fonc.2022.813806/full#supplementary-material
References
1. Ostrom QT, Gittleman H, Farah P, Ondracek A, Chen Y, Wolinsky Y, et al. CBTRUS Statistical Report: Primary Brain and Central Nervous System Tumors Diagnosed in the United States in 2006-2010. Neuro Oncol (2013) 15 Suppl 2(Suppl 2):ii1–56. doi: 10.1093/neuonc/not151
2. Molitch ME. Nonfunctioning Pituitary Tumors and Pituitary Incidentalomas. Endocrinol Metab Clin North Am (2008) 37(1):151–71. doi: 10.1016/j.ecl.2007.10.011
3. Greenman Y, Stern N. Non-Functioning Pituitary Adenomas. Best Pract Res Clin Endocrinol Metab (2009) 23(5):625–38. doi: 10.1016/j.beem.2009.05.005
4. Lloyd RV, Osamura RY, Klöppel G, Rosai J. WHO Classification of Tumours of Endocrine Organs: International Agency for Research on Cancer. Cancer IAfRo; Lyon, France (2017).
5. Roelfsema F, Biermasz NR, Pereira AM. Clinical Factors Involved in the Recurrence of Pituitary Adenomas After Surgical Remission: A Structured Review and Meta-Analysis. Pituitary (2012) 15(1):71–83. doi: 10.1007/s11102-011-0347-7
6. Boxerman JL, Rogg JM, Donahue JE, Machan JT, Goldman MA, Doberstein CE. Preoperative MRI Evaluation of Pituitary Macroadenoma: Imaging Features Predictive of Successful Transsphenoidal Surgery. AJR Am J Roentgenol (2010) 195(3):720–8. doi: 10.2214/ajr.09.4128
7. Snead FE, Amdur RJ, Morris CG, Mendenhall WM. Long-Term Outcomes of Radiotherapy for Pituitary Adenomas. Int J Radiat Oncol Biol Phys (2008) 71(4):994–8. doi: 10.1016/j.ijrobp.2007.11.057
8. Brochier S, Galland F, Kujas M, Parker F, Gaillard S, Raftopoulos C, et al. Factors Predicting Relapse of Nonfunctioning Pituitary Macroadenomas After Neurosurgery: A Study of 142 Patients. Eur J Endocrinol (2010) 163(2):193–200. doi: 10.1530/eje-10-0255
9. Losa M, Mortini P, Barzaghi R, Ribotto P, Terreni MR, Marzoli SB, et al. Early Results of Surgery in Patients With Nonfunctioning Pituitary Adenoma and Analysis of the Risk of Tumor Recurrence. J Neurosurg (2008) 108(3):525–32. doi: 10.3171/jns/2008/108/3/0525
10. Ko CC, Chen TY, Lim SW, Kuo YT, Wu TC, Chen JH. Prediction of Recurrence in Solid Nonfunctioning Pituitary Macroadenomas: Additional Benefits of Diffusion-Weighted MR Imaging. J Neurosurg (2019) 132(2):351–9. doi: 10.3171/2018.10.Jns181783
11. Ko CC, Chang CH, Chen TY, Lim SW, Wu TC, Chen JH, et al. Solid Tumor Size for Prediction of Recurrence in Large and Giant Non-Functioning Pituitary Adenomas. Neurosurg Rev (2021) 45(2):1401-11. doi: 10.1007/s10143-021-01662-7
12. Kourou K, Exarchos TP, Exarchos KP, Karamouzis MV, Fotiadis DI. Machine Learning Applications in Cancer Prognosis and Prediction. Comput Struct Biotechnol J (2015) 13:8–17. doi: 10.1016/j.csbj.2014.11.005
13. Lambin P, Leijenaar RTH, Deist TM, Peerlings J, de Jong EEC, van Timmeren J, et al. Radiomics: The Bridge Between Medical Imaging and Personalized Medicine. Nat Rev Clin Oncol (2017) 14(12):749–62. doi: 10.1038/nrclinonc.2017.141
14. Sun Q, Lin X, Zhao Y, Li L, Yan K, Liang D, et al. Deep Learning vs. Radiomics for Predicting Axillary Lymph Node Metastasis of Breast Cancer Using Ultrasound Images: Don’t Forget the Peritumoral Region. Front Oncol (2020) 10:53. doi: 10.3389/fonc.2020.00053
15. Zhu W, Xie L, Han J, Guo X. The Application of Deep Learning in Cancer Prognosis Prediction. Cancers (Basel) (2020) 12(3):603. doi: 10.3390/cancers12030603
16. Botalb A, Moinuddin M, Al-Saggaf UM, Ali SSA eds. (2018). Contrasting Convolutional Neural Network (CNN) With Multi-Layer Perceptron (MLP) for Big Data Analysis, in: 2018 International Conference on Intelligent and Advanced System (ICIAS), Kuala Lumpur, Malaysia: IEEE, 13-14 Aug. 2018.
17. Krizhevsky A, Sutskever I, Hinton GE. ImageNet Classification With Deep Convolutional Neural Networks. In: Proceedings of the 25th International Conference on Neural Information Processing Systems, vol. 1. Lake Tahoe, Nevada: Curran Associates Inc (2012). p. 1097–105.
18. Esteva A, Kuprel B, Novoa RA, Ko J, Swetter SM, Blau HM, et al. Dermatologist-Level Classification of Skin Cancer With Deep Neural Networks. Nature (2017) 542(7639):115–8. doi: 10.1038/nature21056
19. Kermany DS, Goldbaum M, Cai W, Valentim CCS, Liang H, Baxter SL, et al. Identifying Medical Diagnoses and Treatable Diseases by Image-Based Deep Learning. Cell (2018) 172(5):1122–31.e9. doi: 10.1016/j.cell.2018.02.010
20. De Fauw J, Ledsam JR, Romera-Paredes B, Nikolov S, Tomasev N, Blackwell S, et al. Clinically Applicable Deep Learning for Diagnosis and Referral in Retinal Disease. Nat Med (2018) 24(9):1342–50. doi: 10.1038/s41591-018-0107-6
21. Shrwan R, Gupta A. (2021). Classification of Pituitary Tumor and Multiple Sclerosis Brain Lesions Through Convolutional Neural Networks, in: IOP Conference Series: Materials Science and Engineering, Jaipur, India: IOP Publishing Ltd., Vol. 1049. p. 012014. doi: 10.1088/1757-899x/1049/1/012014
22. Li H, Zhao Q, Zhang Y, Sai K, Xu L, Mou Y, et al. Image-Driven Classification of Functioning and Nonfunctioning Pituitary Adenoma by Deep Convolutional Neural Networks. Comput Struct Biotechnol J (2021) 19:3077–86. doi: 10.1016/j.csbj.2021.05.023
23. Zeynalova A, Kocak B, Durmaz ES, Comunoglu N, Ozcan K, Ozcan G, et al. Preoperative Evaluation of Tumour Consistency in Pituitary Macroadenomas: A Machine Learning-Based Histogram Analysis on Conventional T2-Weighted MRI. Neuroradiology (2019) 61(7):767–74. doi: 10.1007/s00234-019-02211-2
24. Zhu H, Fang Q, Huang Y, Xu K. Semi-Supervised Method for Image Texture Classification of Pituitary Tumors via CycleGAN and Optimized Feature Extraction. BMC Med Inform Decis Mak (2020) 20(1):215. doi: 10.1186/s12911-020-01230-x
25. Qian Y, Qiu Y, Li CC, Wang ZY, Cao BW, Huang HX, et al. A Novel Diagnostic Method for Pituitary Adenoma Based on Magnetic Resonance Imaging Using a Convolutional Neural Network. Pituitary (2020) 23(3):246–52. doi: 10.1007/s11102-020-01032-4
26. Li Q, Zhu Y, Chen M, Guo R, Hu Q, Deng Z, et al. Automatic Detection of Pituitary Microadenoma From Magnetic Resonance Imaging Using Deep Learning Algorithms. medRxiv (2021) p. 252010. doi: 10.1101/2021.03.02.21252010. 2021.03.02.21252010.
27. Paul J, Plassard A, Landman B, Fabbri D. Deep Learning for Brain Tumor Classification: SPIE. Med Imag: Biomed App in Mol, Struct and Funct Imag. 1013710. (2017). doi: 10.1117/12.2254195
28. Staartjes VE, Serra C, Muscas G, Maldaner N, Akeret K, van Niftrik CHB, et al. (2018). Utility of Deep Neural Networks in Predicting Gross-Total Resection After Transsphenoidal Surgery for Pituitary Adenoma: A Pilot Study, Neurosurg Focus 45(5). E12. doi: 10.3171/2018.8.Focus18243
29. Liu X, Zhang Y, Jing H, Wang L, Zhao S. Ore Image Segmentation Method Using U-Net and Res_Unet Convolutional Networks. RSC Adv (2020) 10:9396–406. doi: 10.1039/C9RA05877J
30. Shahrestani S, Cardinal T, Micko A, Strickland BA, Pangal DJ, Kugener G, et al. Neural Network Modeling for Prediction of Recurrence, Progression, and Hormonal Non-Remission in Patients Following Resection of Functional Pituitary Adenomas. Pituitary (2021) 24(4):523–9. doi: 10.1007/s11102-021-01128-5
31. Hong JW, Lee MK, Kim SH, Lee EJ. Discrimination of Prolactinoma From Hyperprolactinemic Non-Functioning Adenoma. Endocrine (2010) 37(1):140–7. doi: 10.1007/s12020-009-9279-7
32. Knosp E, Steiner E, Kitz K, Matula C. Pituitary Adenomas With Invasion of the Cavernous Sinus Space: A Magnetic Resonance Imaging Classification Compared With Surgical Findings. Neurosurgery (1993) 33(4):610–7. doi: 10.1227/00006123-199310000-00008
33. Hardy J. Transphenoidal Microsurgery of the Normal and Pathological Pituitary. Clin Neurosurg (1969) 16:185–217. doi: 10.1093/neurosurgery/16.cn_suppl_1.185
34. Wang S, Lin S, Wei L, Zhao L, Huang Y. Analysis of Operative Efficacy for Giant Pituitary Adenoma. BMC Surg (2014) 14:59. doi: 10.1186/1471-2482-14-59
35. Zhang Y, Ko CC, Chen JH, Chang KT, Chen TY, Lim SW, et al. Radiomics Approach for Prediction of Recurrence in Non-Functioning Pituitary Macroadenomas. Front Oncol (2020) 10:590083. doi: 10.3389/fonc.2020.590083
36. Chen W, Wang M, Duan C, Yao S, Jiao H, Wang Z, et al. Prediction of the Recurrence of Non-Functioning Pituitary Adenomas Using Preoperative Supra-Intra Sellar Volume and Tumor-Carotid Distance. Front Endocrinol (2021) 12:748997. doi: 10.3389/fendo.2021.748997
37. van Varsseveld NC, van Bunderen CC, Franken AAM, Koppeschaar HPF, van der Lely AJ, Drent ML. Tumor Recurrence or Regrowth in Adults With Nonfunctioning Pituitary Adenomas Using GH Replacement Therapy. J Clin Endocrinol Metab (2015) 100(8):3132–9. doi: 10.1210/jc.2015-1764
38. Mason D. SU-E-T-33: Pydicom: An Open Source DICOM Library. Med Phys (2011) 38:3493. doi: 10.1118/1.3611983
39. Szegedy C, Wei L, Yangqing J, Sermanet P, Reed S, Anguelov D, et al eds. (2015). Going Deeper With Convolutions, in: 2015 IEEE Conference on Computer Vision and Pattern Recognition (CVPR). Boston, MA: IEEE, 7-12 June 2015.
40. Lecun Y, Bottou L, Bengio Y, Haffner P. (1998). Gradient-Based Learning Applied to Document Recognition, in: Proceedings of the IEEE. Leuven, Belgium: IEEE, 86(11): 2278–324. doi: 10.1109/5.726791
41. Simonyan K, Zisserman A. Very Deep Convolutional Networks for Large-Scale Image Recognition. Comput Biol Learn Soc (2015) arXiv:1409.15561–14 doi: 10.48550/arXiv.1409.1556
42. Srivastava N, Hinton G, Krizhevsky A, Sutskever I, Salakhutdinov R. Dropout: A Simple Way to Prevent Neural Networks From Overfitting. J Mach Learn Res (2014) 15:1929–58. doi: 10.5555/26270313
43. Ruby U, Yendapalli V. Binary Cross Entropy With Deep Learning Technique for Image Classification. Int J Adv Trends Comput Sci Eng (2020) 9(4): 5393-97. doi: 10.30534/ijatcse/2020/175942020
44. Tamrazi B, Pekmezci M, Aboian M, Tihan T, Glastonbury CM. Apparent Diffusion Coefficient and Pituitary Macroadenomas: Pre-Operative Assessment of Tumor Atypia. Pituitary (2017) 20(2):195–200. doi: 10.1007/s11102-016-0759-5
45. Bradley WG Jr. MR Appearance of Hemorrhage in the Brain. Radiology (1993) 189(1):15–26. doi: 10.1148/radiology.189.1.8372185
46. Parekh VS, Jacobs MA. Deep Learning and Radiomics in Precision Medicine. Expert Rev Precis Med Drug Dev (2019) 4(2):59–72. doi: 10.1080/23808993.2019.1585805
47. Afshar P, Mohammadi A, Plataniotis KN, Oikonomou A, Benali H. From Handcrafted to Deep-Learning-Based Cancer Radiomics: Challenges and Opportunities. IEEE Signal Process Magazine (2019) 36(4):132–60. doi: 10.1109/MSP.2019.2900993
48. Ciric I, Ragin A, Baumgartner C, Pierce D. Complications of Transsphenoidal Surgery: Results of a National Survey, Review of the Literature, and Personal Experience. Neurosurgery (1997) 40(2):225–36. doi: 10.1097/00006123-199702000-00001
49. Rim CH, Yang DS, Park YJ, Yoon WS, Lee JA, Kim CY. Radiotherapy for Pituitary Adenomas: Long-Term Outcome and Complications. Radiat Oncol J (2011) 29(3):156–63. doi: 10.3857/roj.2011.29.3.156
50. Sebastian P, Balakrishnan R, Yadav B, John S. Outcome of Radiotherapy for Pituitary Adenomas. Rep Pract Oncol Radiother (2016) 21(5):466–72. doi: 10.1016/j.rpor.2016.06.002
Keywords: deep learning, pituitary, macroadenoma, progression, recurrence, MRI, MLP, CNN
Citation: Chen Y-J, Hsieh H-P, Hung K-C, Shih Y-J, Lim S-W, Kuo Y-T, Chen J-H and Ko C-C (2022) Deep Learning for Prediction of Progression and Recurrence in Nonfunctioning Pituitary Macroadenomas: Combination of Clinical and MRI Features. Front. Oncol. 12:813806. doi: 10.3389/fonc.2022.813806
Received: 12 November 2021; Accepted: 22 March 2022;
Published: 20 April 2022.
Edited by:
Khan Iftekharuddin, Old Dominion University, United StatesReviewed by:
Cesare Furlanello, Bruno Kessler Foundation (FBK), ItalyGuolin Ma, China-Japan Friendship Hospital, China
Copyright © 2022 Chen, Hsieh, Hung, Shih, Lim, Kuo, Chen and Ko. This is an open-access article distributed under the terms of the Creative Commons Attribution License (CC BY). The use, distribution or reproduction in other forums is permitted, provided the original author(s) and the copyright owner(s) are credited and that the original publication in this journal is cited, in accordance with accepted academic practice. No use, distribution or reproduction is permitted which does not comply with these terms.
*Correspondence: Ching-Chung Ko, kocc0729@gmail.com
†These authors have contributed equally to this work