
- 1 Child Psychiatry Branch, National Institutes of Health, National Institute of Mental Health, Bethesda, MD, USA
- 2 National Institutes of Health, Center for Information Technology, Bethesda, MD, USA
Introduction: Multivariate machine learning methods can be used to classify groups of schizophrenia patients and controls using structural magnetic resonance imaging (MRI). However, machine learning methods to date have not been extended beyond classification and contemporaneously applied in a meaningful way to clinical measures. We hypothesized that brain measures would classify groups, and that increased likelihood of being classified as a patient using regional brain measures would be positively related to illness severity, developmental delays, and genetic risk. Methods: Using 74 anatomic brain MRI sub regions and Random Forest (RF), a machine learning method, we classified 98 childhood onset schizophrenia (COS) patients and 99 age, sex, and ethnicity-matched healthy controls. We also used RF to estimate the probability of being classified as a schizophrenia patient based on MRI measures. We then explored relationships between brain-based probability of illness and symptoms, premorbid development, and presence of copy number variation (CNV) associated with schizophrenia. Results: Brain regions jointly classified COS and control groups with 73.7% accuracy. Greater brain-based probability of illness was associated with worse functioning (p = 0.0004) and fewer developmental delays (p = 0.02). Presence of CNV was associated with lower probability of being classified as schizophrenia (p = 0.001). The regions that were most important in classifying groups included left temporal lobes, bilateral dorsolateral prefrontal regions, and left medial parietal lobes. Conclusion: Schizophrenia and control groups can be well classified using RF and anatomic brain measures, and brain-based probability of illness has a positive relationship with illness severity and a negative relationship with developmental delays/problems and CNV-based risk.
Introduction
Structural brain magnetic resonance imaging (MRI) studies of schizophrenia indicate widespread neuroanatomic abnormalities in cortical thickness, hippocampus, subcortical structures, and total brain measures (Shenton et al., 2001; Narr et al., 2005; Greenstein et al., 2006; Steen et al., 2006; Nesvag et al., 2008; Byne et al., 2009; Mattai et al., 2011; van Haren et al., 2011). Functional MRI and diffusion tensor imaging studies of schizophrenia also support brain dysfunction in schizophrenia involving multiple brain systems, emphasizing networks, and connectivity dysfunction rather than brain regions acting in isolation (Meyer-Lindenberg et al., 2005; Bassett et al., 2008; Lynall et al., 2010; Repovs et al., 2011).
If schizophrenia is indeed a disorder of connectivity, then the capacity for identifying reliable neuroanatomic signatures of the disease may be reduced if regions are not considered jointly. However, traditional statistical methods (e.g., correlation, t-tests, ANOVA, logistic regression) explore group differences effectively but only within a region or voxel at a time (Sun et al., 2009). Also, traditional model-based methods are limited when exploring how regions/voxels interact as these models quickly become overburdened when trying to combine predictors and all of their interactions from high dimensional MRI data sets (e.g., six predictors have over 60 effects when including all main effects and interactions). These statistical methods may also miss a signal from brain measures interacting in non-linear, non-multiplicative ways.
In contrast, multivariate machine learning methods can utilize available information simultaneously to understand how variables jointly distinguish between groups. These methods have had previous success classifying schizophrenia and healthy controls using structural brain MRI data with classification accuracies ranging from 81 to 93% (Davatzikos et al., 2005; Kawasaki et al., 2007; Yoon et al., 2007; Koutsouleris et al., 2009; Sun et al., 2009). However, no structural MRI study using multivariate machine learning methods has attempted to link multivariate brain-based classifier results with clinical measures in samples of patients with schizophrenia. This is important in that behavioral correlates can provide a clinical context for classifier results.
Here we use Random Forest (RF; Breiman, 2001) to contemporaneously classify groups using anatomic brain measures and correlate clinical and genetic information with classification scheme results. We selected RF as it has error rates comparable to other approaches (Malley et al., 2011b) while being able to determine the probability of illness based on the feature set of brain regions (Malley et al., 2011a) (henceforth referred to as brain-based probability of illness). Of note, these probabilities can be used as a continuous measure containing more information than dichotomous classification to explore relationships with clinical correlates and risk factors for childhood onset schizophrenia (COS). Accordingly, we hypothesized that brain-based probability of illness would be positively associated with clinical measures of illness severity. To explore the idea that brain-based probability of illness would covary with other risks, we hypothesized positive associations between brain-based probability of illness and presence of copy number variations (CNVs) associated with the risk of schizophrenia. Additionally, we hypothesized that measures of developmental delays which are considered risk factors under the neurodevelopmental model for schizophrenia (Weinberger, 1987; Rapoport et al., 2005) would also be positively associated with brain-based probability of illness.
Materials and Methods
Participants
All probands were subjects in an ongoing study of COS at the National Institute of Mental Health and met DSM IIIR/IV criteria for schizophrenia with the onset of psychosis before their 13th birthday. Exclusion criteria were a history of significant medical problems, substance abuse, or a premorbid IQ below 70. We obtained informed consent from parents of minors and participants over 18, and informed assent was obtained when possible. Further details of patient selection are described elsewhere (McKenna et al., 1994; Kumra et al., 1996).
We obtained MRI scans during each proband’s initial inpatient stay and at subsequent 2-year follow-up visits. For the purposes of this study, each patient’s first good quality MRI scan (e.g., absence of visible motion artifacts) was selected to minimize length of illness and medication history for a total of 98 scans. The study was approved by the National Institutes of Health (NIH) institutional review board. Typically developing control participants were volunteers in a prospective study of normal brain development (see Giedd et al., 1999 for further details) also approved by the NIH institutional review board. The current control sample of unrelated 99 participants was selected to match the COS group on age, sex, and ethnicity. Scans with moderate or severe motion artifacts and scans from participants with dental braces were excluded. See Table 1 below for demographic information.
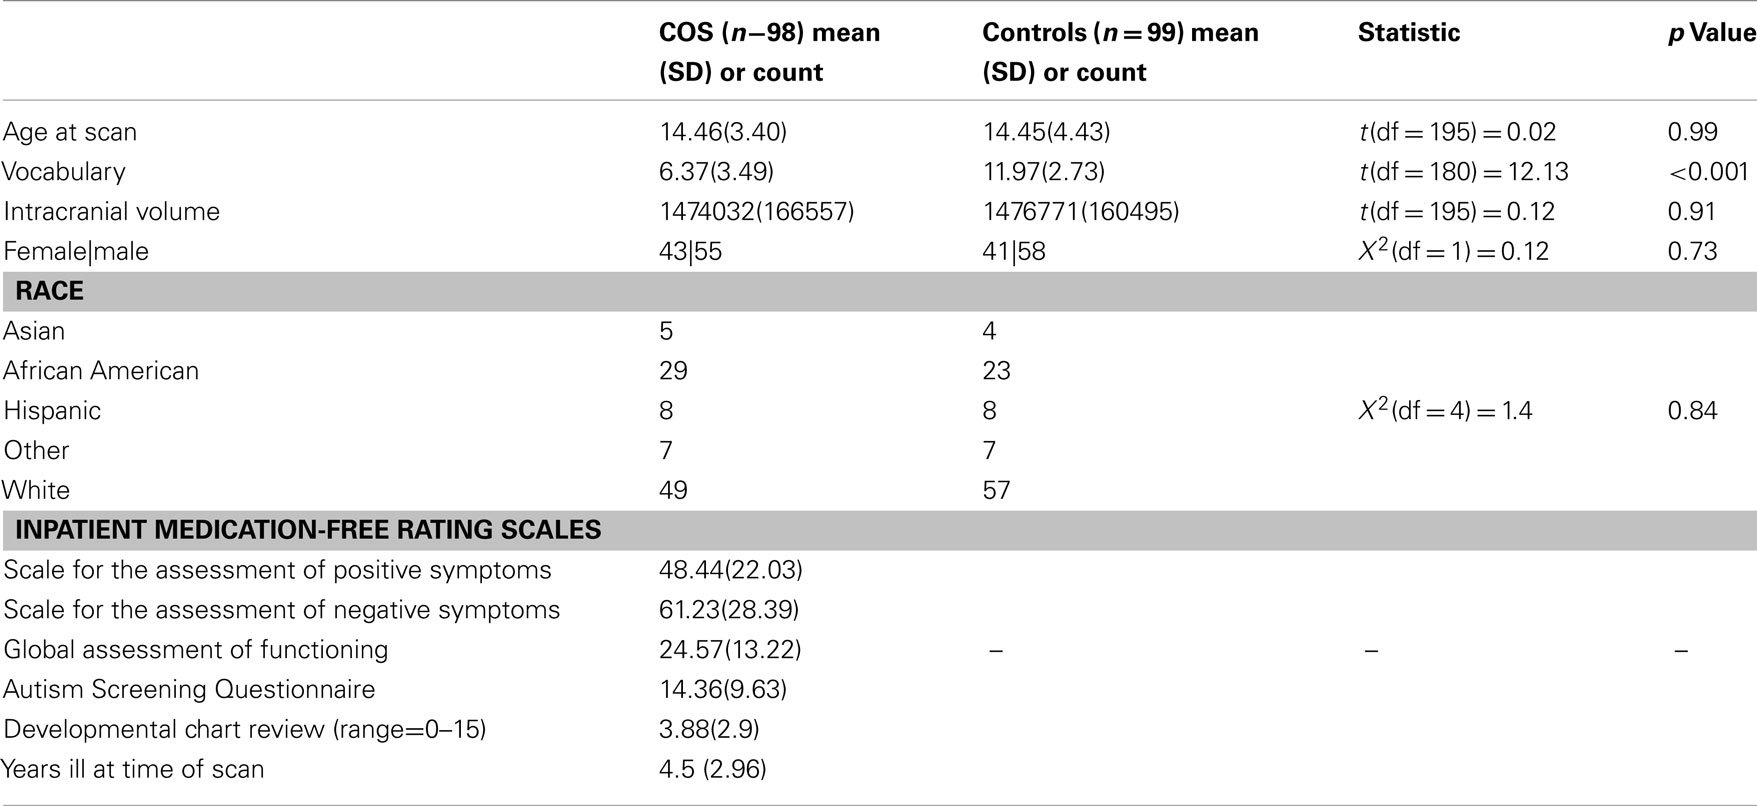
Table 1. Sample demographics and clinical measures.
Clinical Measures
We used age-appropriate versions of the Global Assessment of Functioning Scale (GAS; Shaffer et al., 1983; APA, 1994), the Scale for the Assessment of Positive Symptoms (SAPS; Andreasen, 1984), and the Scale for the Assessment of Negative Symptoms (SANS; Andreasen, 1983) to assess clinical symptoms in COS probands (intraclass correlation coefficients for all measures >0.80). We restricted ratings to NIH inpatient medication-free assessments to approximate comparable rater, treatment, and environmental effects across participants.
To assess developmental delays and problems, we used the 40-item Autism Screening questionnaire (ASQ; Berument et al., 1999). We also conducted a chart review of previous medical records for pre-illness and pre-prodrome academic, language, motor, and social developmental problems and delays. The chart review consists of 15 items [academic (2 items); social (3 items); language (6 items) motor (4 items)] scored 1 or 0 depending on presence or absence of delay/problem and is included in Table A2 in Appendix. Reliability among three chart reviewers was adequate (intraclass correlation coefficients >0.70).
Copy Number Variation
All subjects in our COS study were genotyped using Illumina 1 M SNP chip1, and CNV detection was performed by using three algorithms: (1) PennCNV Revision 220, (2) QuantiSNP v1.1, and (3) GNOSIS. Analysis and merging of CNV predictions was performed with CNVision2. Twelve subjects in the current sample have at least one CNV that has been independently associated with risk of schizophrenia [1q21 (n = 1), 2p16 (NRXN1; n = 1), 2p25(MYT1L; n = 2), 3p25(SRGAP; n = 2), 7q11 (n = 1), 7q35 (CNTNAP2; n = 1), 15q11 (n = 1), 16p13 (n = 2), 22q11 (n = 4; International Schizophrneia Consortium, 2008; Irmansyah et al., 2008; Stefansson et al., 2008; Stone et al., 2008; Kirov et al., 2009; Bassett et al., 2010; Moreno-De-Luca et al., 2010; Ingason et al., 2011; Levinson et al., 2011; Li et al., 2011]. These data were not collected for controls.
MRI Acquisition and Analysis
We obtained brain MRIs using a GE Signa 1.5 T MR system (General Electric Medical Systems, Milwaukee, WI, USA). T1-weighted structural brain images were collected using a 3D spoiled gradient recall (SPGR) sequence. Brain volumes consisted of 124 1.5 mm axial slices with a 0.9375-mm in-plane resolution. Scanning parameters were TR = 24 ms, TE = 5 ms, and a flip angle of 45°.
The brains were processed using the FreeSurfer recon-all pipeline with default settings except for the number of non-uniformity correction iterations that were increased to six. We also used the default parcelation which uses the Desikan atlas3. Cortical and subcortical volumes were measured automatically with FreeSurfer (version 5.1)4. This method has been described in detail elsewhere (Fischl et al., 2002, 2004) and will only be briefly described here. Processing included motion correction and removal of non-brain tissue using a hybrid watershed/surface deformation procedure (Segonne et al., 2004), automated Talairach transformation, segmentation of the subcortical white matter and deep gray matter volumetric structures (including the hippocampus and ventricles; Fischl et al., 2002, 2004), intensity normalization, tessellation of the gray-white matter boundary, automated topology correction (Fischl et al., 2001; Segonne et al., 2007), and surface deformation following intensity gradients to optimally place the gray-white matter and gray matter/CSF borders at the location where the greatest shift in intensity defines the transition to the other tissue class. Anatomic segmentation is based on the probability of the local spatial configuration of labels given the tissue class. This technique has previously been shown to be comparable in accuracy to manual labeling (Fischl et al., 2002) and has been demonstrated to show good test-retest reliability across scanner manufacturers and field strengths (Han et al., 2006).
The above procedure generated average cortical thickness for 68 frontal, temporal, parietal, and occipital lobe regions, and bilateral lateral ventricle, thalamus, and hippocampus volumes to yield the 74 variables we used as features in the machine learning analysis (below). Before the variables were used to classify, they were each residualized using a general linear model with sex, age, age squared, and intracranial volume as independent variables.
Statistical Analysis
Classification: random forest
We used RF5 (Breiman, 2001) as our multivariate machine learning method to predict group membership (COS or controls) with the 74 residualized brain measures (above) as features. RF’s basic unit is a classification tree. RF works by selecting a random bootstrap subset of approximately 66% of the sample per tree and randomly selecting a subset of all features (or cortical regions) at each node of the tree. At each node, RF selects the variable that best splits data into two daughter nodes. This process allows for the cortical regions to work in concert while predicting the outcome region. RF determines prediction error using the out of bag sample (i.e., roughly 33% of participants not randomly selected to build a given tree) that is sent down a tree after it is grown. It is through this process of selecting bootstrap samples to build the tree and then using the out of bag sample to determine error and variable importance that RF minimizes overfitting and contains an internal validation step. This internal validation component built into RF is similar to leave-one-out schemes and other cross-validation procedures.
Random forest provides three basic outputs: classification error, importance scores, and proximities. Classification error is the percent of times a participant (when out of bag) is incorrectly classified; subtracted from one, it is the percent of times a participant (when out of bag) is correctly classified. An importance score is the difference between out of bag error when a variable is randomly permuted and when the variable is not randomly permuted. So, if a variable’s values are randomly permuted and the error rates do not go up, it is not a useful predictor, since it is no better than random noise. Importance scores can be transformed to Z scores [(score − mean)/standard deviation] to ease interpretability. A proximity score is a measure of the frequency at which two out of bag participants are classified in the same terminal node. These proximities are used to form an n × n matrix where n is the number of subjects. This matrix can then be transformed into a distance matrix that can be visualized with multidimensional scaling (MDS).
Because the random components in RF (out of bag sampling, node-level permutation testing) can make the importance scores, proximity scores, and error rates vary, we ran each of the above steps 1000 times and took the average values. We used the R package randomForest (Liaw and Wiener, 2002) for all analyses and set the number of trees per forest at 300 as the plotted error rate was observed to stabilize before 300 trees. We set our terminal node size to 10 and number of variables randomly selected per node (aka mtry) to 10.
Finally, we utilized recent work (Malley et al., 2011a) which transforms RF into a probability machine and allows RF to determine the probability of belonging to the COS group based solely on the 74 residualized brain measures. Briefly, we accomplish this by running RF in regression mode where we assign a value of 1 to COS participants and a value of 0 to controls. Exactly as in coin-tossing problems, the estimated average of these scores for each subject is the estimated probability for that subject. These probability estimates are known to be consistent, as opposed to the standard RF probability estimates (e.g., those available in the standard output of the RandomForest package) which have no known optimality (Malley et al., 2011a; Biau, 2012). We ran this analysis 1000 times and took the average probability of being classified as COS per participant to correlate with clinical measures.
Classification: logistic regression
We computed 74 logistic regressions to determine univariate classification accuracy for each region. For each regression, we used regional cortical thickness as the independent measure (after residualizing regional thickness using age, age squared, sex, and intracranial volume) and diagnostic group as the dependent measure. Statistical significance for logistic regression coefficients was determined after false discovery rate correction (Genovese et al., 2002) (q = 0.05).
Relationships between brain-based probability of illness, clinical correlates, and schizophrenia risk factors
We used linear regression to assess the relationship between brain-based probability of illness and medication-free clinical measures (GAS, SAPS total, SANS total) and developmental measures. We used a t-test to assess the group difference in mean probability of illness between COS participants who have a CNV independently associated with risk of schizophrenia and those who do not. For these analyses, we checked assumptions of linearity, normality, and homoscedasticity, and visually explored data for outliers and unrealistic data points.
Results
Machine Learning Multivariate Classifier
Classification accuracy
The average classification error of the 1000 RF runs was 26.3% (SD = 1%), yielding an average classification accuracy of 73.7%. When we randomly permuted group membership 1000 times and ran RF for each permutation, the null distribution, and the non-permuted distribution did not overlap, indicating that the 73.7% classification accuracy is far better than chance (see Figure 1).
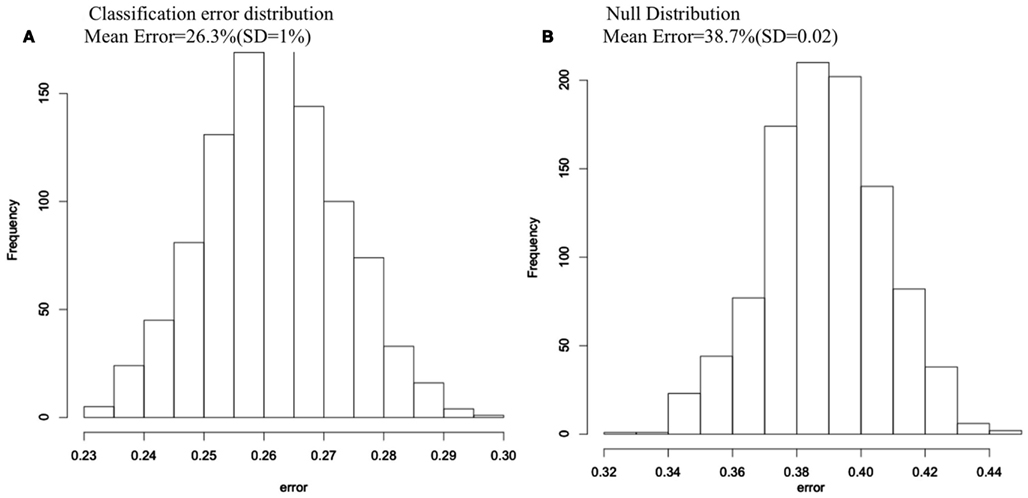
Figure 1. Classification error histograms for (A) 1000 Random Forest runs using 74 cortical and subcortical regions to predict group membership for COS and control groups; (B) 1000 Random Forest runs using 74 cortical and subcortical regions to predict group membership after group membership was randomly permuted each run.
Importance measures
The entire list of 74 importance Z scores is reported in Table A1 in Appendix. The 15 regions with an importance scores at least 0.5 SD above the mean are visually represented in Figure 2. As seen in Figure 2, bilateral frontal, left precuneus, and left temporal regions had the highest importance scores.
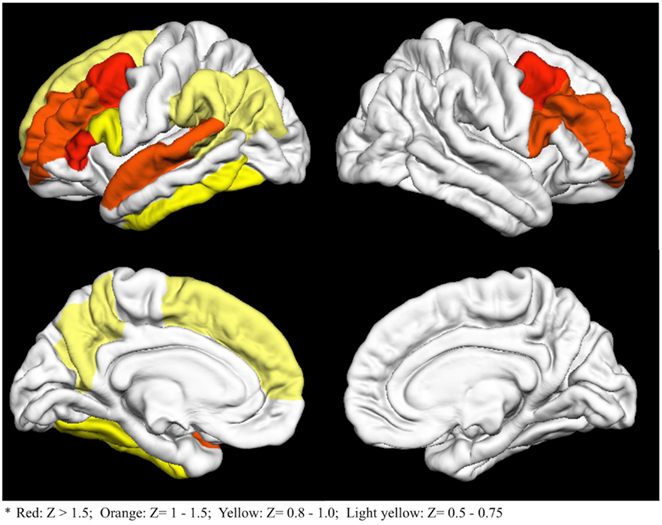
Figure 2. Fifteen cortical regions with importance Z scores at least 0.5 standard deviations above the mean. Colors go from red (high Z scores) to light yellow (lower Z scores)*.
Multidimensional scaling of proximity matrix and probability machine results
The MDS plot (Figure 3A) for the proximity matrix is a visual representation of the accuracy of the classifier; Geometric distances between people correspond to how often they are classified in the same group (closer points correspond to being classified in the same group frequently). The groups appeared well separated, corresponding to 73.7% classification accuracy. In addition, we have provided a color overlay which represents each participant’s probability of being classified as COS based on RF run as a probability machine (Figures 3B,C).
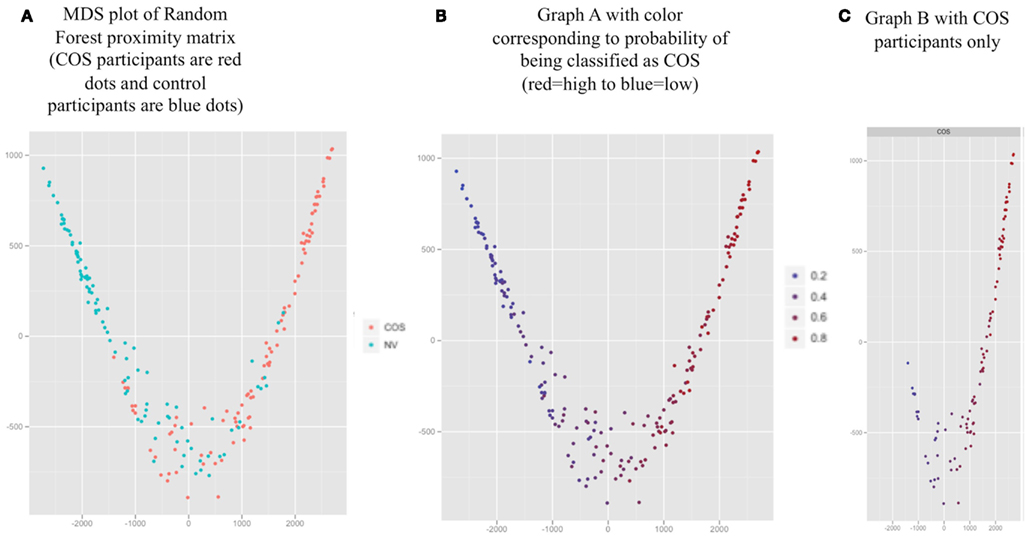
Figure 3. Proximity values averaged over 1000 Random Forest runs for all participants (represented by the dots) visualized with two dimensional multidimensional scaling (MDS). (A) MDS plot of Random Forest proximity matrix (COS participants are red dots and control participants are blue dots). (B) Graph A with color corresponding to probability of being classified as COS (red = high to blue = low). (C) Graph B with COS participants only.
Univariate Logistic Regressions
Seventy-four univariate logistic regressions yielded 55 significant odds ratios (p ≤ 0.03), all of which survived false discovery correction. Of these, only right caudal middle frontal thickness (p ≤ 0.001, classification accuracy = 73.6%) was able to classify as well as RF, although five regions individually classified subjects with at least 70% accuracy (left caudal middle frontal, left rostral middle frontal, left pars triangularis, left precuneus). These regions were also among the 15 regions with the top RF importance scores, revealing overlap between univariate and multivariate classification.
Figure 4 illustrates the curvilinear relationship between univariate results and RF important scores (also see Table A1 in Appendix for all regions, their importance scores, and univariate classification accuracies).
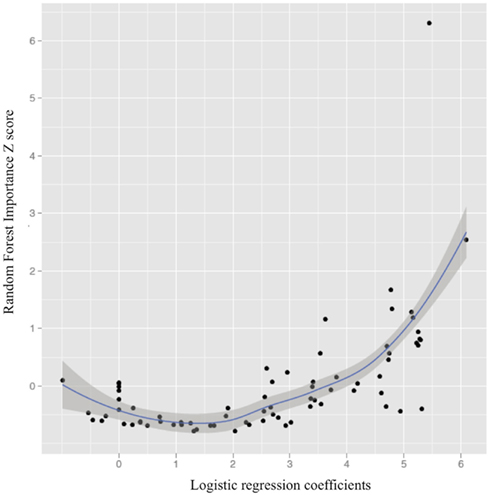
Figure 4. The relationship between univariate logistic regression coefficients and Random Forest importance Z scores (importance score-mean importance score/ SD importance scores; loess line in blue with 95% confidence interval).
Of note were the regions with relatively weaker univariate effects (e.g., not among the top 20 univariate classifiers) and importance scores greater than 0.50 SDs above the mean. Such predictors included right pars opercularis, left bank of the superior temporal sulcus, left fusiform gyrus (importance Z scores = 1.34, 0.56, 0.94, respectively; univariate accuracy rate = 65, 65, 64.5%, respectively).
Clinical Correlates
Inpatient medication-free ratings
Greater brain-based probability of being classified as COS was significantly associated with worse overall functioning during inpatient medication-free baseline (GAS score = 0.0004; see Figure 5). Positive relationships between probability of being classified as COS and negative and positive symptoms during inpatient medication-free baseline (greater probability associated with more symptoms) were statistical trends (SAPS p = 0.07, SANS = 0.09, respectively).
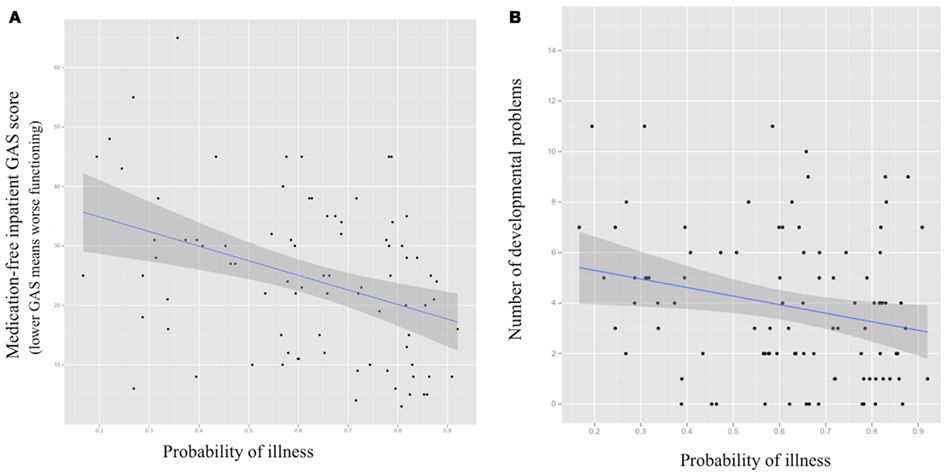
Figure 5. Scatter plots for probability of being classified as COS using structural MRl-based Random Forest classifier (X axis) and (A) medication-free inpatient Global Assessment of Functioning Scale score (GAS; p = 0.0004); (B) number of premorbid academic, language, social, and motor difficulties (p = 0.02) with fitted regression line and 95% confidence interval.
Schizophrenia risk factors
Developmental measures. Greater brain-based probability of being classified as COS was significantly associated with fewer documented pre-illness academic, language, motor, and social difficulties and delays (p = 0.02; see Figure 5). There was no relationship between probability of being classified as COS and scores on the ASQ (p = 0.22).
Copy number variations. The 12 COS subjects who have a CNV that has been independently associated with risk of schizophrenia had a lower mean probability of illness [0.44(SD = 0.23)] than patients who did not [n = 86, mean = 0.64 (SD = 0.18); t = 3.398 (df = 96) p = 0.001].
Discussion
Using a multivariate machine learning approach and measures of regional cortical thickness, bilateral hippocampus, thalamus, and lateral ventricle volumes, we achieved good classification between COS patients and controls. We were also able to use all brain measures jointly to predict group membership, which is consistent with a current emphasis on brain systems and networks rather than regions in isolation. The regions that were most important in our multivariate classifier included temporal, dorsolateral prefrontal regions, and medial parietal lobe: this is consistent with current univariate results and previous reports of gray matter reductions and brain network abnormalities in these regions (Shenton et al., 2001; Ellison-Wright and Bullmore, 2009; Meyer-Lindenberg, 2010; van den Heuvel and Hulshoff Pol, in press).
To our knowledge, we provide initial evidence that multivariate machine learning approaches can link probability of illness with clinical measures in a meaningful way. Specifically, here we link medication-free illness severity ratings, CNVs, and developmental risk factors with nuanced, continuous information generated by machine learning at an individual level: i.e., what is the probability a person is affected given the features, rather than dichotomous affected/not affected output. For example, 52 and 85% chance of an event or diagnosis both declare for the event but clearly, there is more information available in the continuous percentage.
Consistent with our hypothesis we found a positive relationship between probability of illness base solely on brain measures and illness severity. Counter to our hypothesis, however, fewer premorbid academic, language, motor, and social developmental problems and having a CNV associated with schizophrenia were associated with a lower brain-based probability of being classified as schizophrenic. This suggests that there may be a relationship between schizophrenia patients who sustained a large genetic mutation on a pathway of unusual strength, reflected in more frequent early difficulties but with less neuroanatomic disturbance. However, caution is warranted when while interpreting the CNV group difference in probability of illness, as the group of CNVs is diverse and may not represent a single homogenous population.
We hypothesized that linear and/or non-linear relationships among brain regions would make the multivariate classifier superior to univariate classifiers. However, the current multivariate approach did not out-perform several univariate logistic regressions on a pure classification task, and our hypothesis was thus not confirmed. Specifically, right caudal middle frontal thickness alone performed as well as the multivariate classifier, and several other frontal and temporal regions had classification accuracies greater than 70%. At the same time, the strong curvilinear relationship between RF importance scores and univariate classification accuracy indicates that both approaches detect strong effects, and RF does so without incurring costs for correcting for multiple tests with unknown joint correlation structure or assumptions of normality and homoscedasticity. Also, some univariate effects that are not particularly accurate classifiers have relatively strong importance scores. This outcome suggests that the combination of univariate and multivariate methods can be used detect regions of relative importance when interacting with other regions but that do not classify particularly well when acting alone (e.g., right pars opercularis, left bank of the superior temporal sulcus, left fusiform gyrus). This is particularly important in an illness like schizophrenia, which is can be considered a disorder of dysconnectivity, as individual brain regions are unlikely to be affected in an isolated manner.
Our multivariate classification error rate of 73.7%, although good, is not high enough to warrant the use of MRI measures as a stand-alone diagnostic tool. While previous multivariate classification studies report upward of 80% accuracy (Davatzikos et al., 2005; Kawasaki et al., 2007; Yoon et al., 2007; Koutsouleris et al., 2009; Sun et al., 2009), clinical interview conducted by a skilled clinician still remains the most efficient, cost-effective diagnostic tool between healthy and psychotic patients. However, structural brain-based classifiers do appear to be relevant when the goal is to understand the most important neuroanatomic factors distinguishing diagnostic groups without encumbrances inherent in multiple tests and parametric test assumptions. Also, we recommend future studies using features from MEG, DTI, and fMRI scans, as MEG, DTI, and fMRI data is collected specifically to detect active brain networks and connectivity. We believe this kind of study may be better suited than structural MRI to fully harness the power of multivariate methods’ ability to capitalize on linear and non-linear interactions. Also, when brain imaging features can classify cases and controls, researches can use methods like the ones currently employed to detect relationships between phenotypes and continuous probabilities from machines with brain-based (or fMRI, DTI, EEG, etc…) features. These relationships might otherwise be missed if the machine output is restricted to dichotomous classification.
Limitations of the current study include the lack of a validation sample, although COS is a very rare disorder and the current sample required several decades to acquire. Also, our assessment of developmental issues has two drawbacks: (1) retrospective chart reviews may miss relevant information that was never documented and (2) the ASQ assesses current functioning as well as premorbid development. Also, here we have chosen to use regional brain measures that provide less noise albeit lower resolution compared to the higher resolution voxel-wise measures. Despite these limitations, RF appears to provide a means of distinguishing groups that has the advantage of linking clinical information and risk factors and classification using multiple brain regions jointly.
Author Contribution
Deanna Greenstein wrote the manuscript and performed the statistical analyses. James Malley provided consultation and technical report on statistical and machine learning methods. Liv Clasen selected the sample. Brian Weisinger assisted with data management and graph preparation. Nitin Gogtay served as senior author and assisted with manuscript edits.
Conflict of Interest Statement
The authors declare that the research was conducted in the absence of any commercial or financial relationships that could be construed as a potential conflict of interest.
Footnotes
References
Andreasen, N. C. (1983). Scale for the Assessment of Negative Symptoms (SANS). Iowa City: University of Iowa.
Andreasen, N. C. (1984). Scale for the Assessment of Positive Symptoms (SAPS). Iowa City: University of Iowa.
APA. (1994). Diagnostic and Statistical Manual of Mental Disorders (DSM-IV), 4th Edn. Washington, DC: American Psychiatric Association.
Bassett, A. S., Scherer, S. W., and Brzustowicz, L. M. (2010). Copy number variations in schizophrenia: critical review and new perspectives on concepts of genetics and disease. Am. J. Psychiatry 167, 899–914.
Bassett, D. S., Bullmore, E., Verchinski, B. A., Mattay, V. S., Weinberger, D. R., and Meyer-Lindenberg, A. (2008). Hierarchical organization of human cortical networks in health and schizophrenia. J. Neurosci. 28, 9239–9248.
Berument, S. K., Rutter, M., Lord, C., Pickles, A., and Bailey, A. (1999). Autism screening questionnaire: diagnostic validity. Br. J. Psychiatry 175, 444–451.
Byne, W., Hazlett, E., Buchsbaum, M., and Kemether, E. (2009). The thalamus and schizophrenia: current status of research. Acta Neuropathol. 117, 347–368.
Davatzikos, C., Shen, D., Gur, R. C., Wu, X., Liu, D., Fan, Y., Hughett, P., Turetsky, B. I., and Gur, R. E. (2005). Whole-brain morphometric study of schizophrenia revealing a spatially complex set of focal abnormalities. Arch. Gen. Psychiatry 62, 1218–1227.
Ellison-Wright, I., and Bullmore, E. (2009). Meta-analysis of diffusion tensor imaging studies in schizophrenia. Schizophr. Res. 108, 3–10.
Fischl, B., Liu, A., and Dale, A. M. (2001). Automated manifold surgery: constructing geometrically accurate and topologically correct models of the human cerebral cortex. IEEE Trans. Med. Imaging 20, 70–80.
Fischl, B., Salat, D. H., Busa, E., Albert, M., Dieterich, M., Haselgrove, C., van der Kouwe, A., Killiany, R., Kennedy, D., Klaveness, S., Montillo, A., Makris, N., Rosen, B., and Dale, A. M. (2002). Whole brain segmentation: automated labeling of neuroanatomical structures in the human brain. Neuron 33, 341–355.
Fischl, B., van der Kouwe, A., Destrieux, C., Halgren, E., Ségonne, F., Salat, D. H., Busa, E., Seidman, L. J., Goldstein, J., Kennedy, D., Caviness, V., Makris, N., Rosen, B., and Dale, A. M. (2004). Automatically parcellating the human cerebral cortex. Cereb. Cortex 14, 11–22.
Genovese, C. R., Lazar, N. A., and Nichols, T. (2002). Thresholding of statistical maps in functional neuroimaging using the false discovery rate. Neuroimage 15, 870–878.
Giedd, J. N., Blumenthal, J., Jeffries, N. O., Castellanos, F. X., Liu, H., Zijdenbos, A., Paus, T., Evans, A. C., and Rapoport, J. L. (1999). Brain development during childhood and adolescence: a longitudinal MRI study. Nat. Neurosci. 2, 861–863.
Greenstein, D., Lerch, J., Shaw, P., Clasen, L., Giedd, J., Gochman, P., Rapoport, J., and Gogtay, N. (2006). Childhood onset schizophrenia: cortical brain abnormalities as young adults. J. Child Psychol. Psychiatry 47, 1003–1012.
Han, X., Jovicich, J., Salat, D., van der Kouwe, A., Quinn, B., Czanner, S., Busa, E., Pacheco, J., Albert, M., Killiany, R., Maguire, P., Rosas, D., Makris, N., Dale, A., Dickerson, B., and Fischl, B. (2006). Reliability of MRI-derived measurements of human cerebral cortical thickness: the effects of field strength, scanner upgrade and manufacturer. Neuroimage 32, 180–194.
Ingason, A., Rujescu, D., Cichon, S., Sigurdsson, E., Sigmundsson, T., Pietilainen, O. P., Buizer-Voskamp, J. E., Strengman, E., Francks, C., Muglia, P., Gylfason, A., Gustafsson, O., Olason, P. I., Steinberg, S., Hansen, T., Jakobsen, K. D., Rasmussen, H. B., Giegling, I., Moller, H. J., Hartmann, A., Crombie, C., Fraser, G., Walker, N., Lonnqvist, J., Suvisaari, J., Tuulio-Henriksson, A., Bramon, E., Kiemeney, L. A., Franke, B., Murray, R., Vassos, E., Toulopoulou, T., Muhleisen, T. W., Tosato, S., Ruggeri, M., Djurovic, S., Andreassen, O. A., Zhang, Z., Werge, T., Ophoff, R. A., Rietschel, M., Nothen, M. M., Petursson, H., Stefansson, H., Peltonen, L., Collier, D., Stefansson, K., and St Clair, D. M. (2011). Copy number variations of chromosome 16p13.1 region associated with schizophrenia. Mol. Psychiatry 16, 17–25.
International Schizophrneia Consortium. (2008). Rare chromosomal deletions and duplications increase risk of schizophrenia. Nature 455, 237–241.
Irmansyah, Schwab, S. G., Heriani, Handoko, H. Y., Kusumawardhani, A., Widyawati, I., Amir, N., Nasrun, M. W. S., Holmans, P., Knapp, M., and Wildenauer, D. B. (2008). Genome-wide scan in 124 Indonesian sib-pair families with schizophrenia reveals genome-wide significant linkage to a locus on chromosome 3p26-21. Am. J. Med. Genet. B Neuropsychiatr. Genet. 147B, 1245–1252.
Kawasaki, Y., Suzuki, M., Kherif, F., Takahashi, T., Zhou, S.-Y., Nakamura, K., Matsui, M., Sumiyoshi, T., Seto, H., and Kurachi, M. (2007). Multivariate voxel-based morphometry successfully differentiates schizophrenia patients from healthy controls. Neuroimage 34, 235–242.
Kirov, G., Rujescu, D., Ingason, A., Collier, D. A., O’Donovan, M. C., and Owen, M. J. (2009). Neurexin 1 (NRXN1) deletions in schizophrenia. Schizophr. Bull. 35, 851–854.
Koutsouleris, N., Meisenzahl, E. M., Davatzikos, C., Bottlender, R., Frodl, T., Scheuerecker, J., Schmitt, G., Zetzsche, T., Decker, P., Reiser, M., Moller, H.-J., and Gaser, C. (2009). Use of neuroanatomical pattern classification to identify subjects in at-risk mental states of psychosis and predict disease transition. Arch. Gen. Psychiatry 66, 700–712.
Kumra, S., Frazier, J. A., Jacobsen, L. K., McKenna, K., Gordon, C. T., Lenane, M. C., Hamburger, S. D., Smith, A. K., Albus, K. E., Alaghband-Rad, J., and Rapoport, J. L. (1996). Childhood-onset schizophrenia. A double-blind clozapine-haloperidol comparison. Arch. Gen. Psychiatry 53, 1090–1097.
Levinson, D. F., Duan, J., Oh, S., Wang, K., Sanders, A. R., Shi, J., Zhang, N., Mowry, B. J., Olincy, A., Amin, F., Cloninger, C. R., Silverman, J. M., Buccola, N. G., Byerley, W. F., Black, D. W., Kendler, K. S., Freedman, R., Dudbridge, F., Pe’er, I., Hakonarson, H., Bergen, S. E., Fanous, A. H., Holmans, P. A., and Gejman, P. V. (2011). Copy number variants in schizophrenia: confirmation of five previous findings and new evidence for 3q29 microdeletions and VIPR2 duplications. Am. J. Psychiatry 168, 302–316.
Li, W., Wang, X., Zhao, J., Lin, J., Song, X. Q., Yang, Y., Jiang, C., Xiao, B., Yang, G., Zhang, H. X., and Lv, L. X. (2011). Association study of myelin transcription factor 1-like polymorphisms with schizophrenia in Han Chinese population. Genes Brain Behav. 11, 87–93.
Lynall, M.-E., Bassett, D. S., Kerwin, R., McKenna, P. J., Kitzbichler, M., Muller, U., and Bullmore, E. (2010). Functional connectivity and brain networks in schizophrenia. J. Neurosci. 30, 9477–9487.
Malley, J., Kruppa, J., Dasgupta, A., Malley, K., and Ziegler, A. (2011a). Probability machines. Consistent probability estimation using nonparametric learning machines. Methods Inf. Med. 50, 74–81.
Malley, J., Malley, K., and Pajeviv, S. (2011b). Statistical Learning for Biomedical Data. New York: Cambridge University Press.
McKenna, K., Gordon, C. T., Lenane, M., Kaysen, D., Fahey, K., and Rapoport, J. L. (1994). Looking for childhood-onset schizophrenia: the first 71 cases screened. J. Am. Acad. Child Adolesc. Psychiatry 33, 636–44.
Mattai, A., Hosanagar, A., Weisinger, B., Greenstein, D., Stidd, R., Clasen, L., Lalonde, F., Rapoport, J., and Gogtay, N. (2011). Hippocampal volume development in healthy siblings of childhood-onset schizophrenia patients. Am. J. Psychiatry 168, 427–435.
Meyer-Lindenberg, A. (2010). From maps to mechanisms through neuroimaging of schizophrenia. Nature 468, 194–202.
Meyer-Lindenberg, A. S., Olsen, R. K., Kohn, P. D., Brown, T., Egan, M. F., Weinberger, D. R., and Berman, K. F. (2005). Regionally specific disturbance of dorsolateral prefrontal-hippocampal functional connectivity in schizophrenia. Arch. Gen. Psychiatry 62, 379–386.
Moreno-De-Luca, D., Mulle, J. G., Kaminsky, E. B., Sanders, S. J., Myers, S. M., Adam, M. P., Pakula, A. T., Eisenhauer, N. J., Uhas, K., Weik, L., Guy, L., Care, M. E., Morel, C. F., Boni, C., Salbert, B. A., Chandrareddy, A., Demmer, L. A., Chow, E. W., Surti, U., Aradhya, S., Pickering, D. L., Golden, D. M., Sanger, W. G., Aston, E., Brothman, A. R., Gliem, T. J., Thorland, E. C., Ackley, T., Iyer, R., Huang, S., Barber, J. C., Crolla, J. A., Warren, S. T., Martin, C. L., and Ledbetter, D. H. (2010). Deletion 17q12 is a recurrent copy number variant that confers high risk of autism and schizophrenia. Am. J. Hum. Genet. 87, 618–630.
Narr, K. L., Bilder, R. M., Toga, A. W., Woods, R. P., Rex, D. E., Szeszko, P. R., Robinson, D., Sevy, S., Gunduz-Bruce, H., Wang, Y-P., DeLuca, H., and Thompson, P. M. (2005). Mapping cortical thickness and gray matter concentration in first episode schizophrenia. Cereb. Cortex 15, 708–719.
Nesvag, R., Lawyer, G., Varnas, K., Fjell, A. M., Walhovd, K. B., Frigessi, A., Jonsson, E. G., and Agartz, I. (2008). Regional thinning of the cerebral cortex in schizophrenia: effects of diagnosis, age and antipsychotic medication. Schizophr. Res. 98, 16–28.
Rapoport, J. L., Addington, A. M., and Frangou, S. (2005). The neurodevelopmental model of schizophrenia: update 2005. Mol. Psychiatry 10, 434–449.
Repovs, G., Csernansky, J. G., and Barch, D. M. (2011). Brain network connectivity in individuals with schizophrenia and their siblings. Biol. Psychiatry 69, 967–973.
Segonne, F., Dale, A. M., Busa, E., Glessner, M., Salat, D., Hahn, H. K., and Fischl, B. (2004). A hybrid approach to the skull stripping problem in MRI. Neuroimage 22, 1060–1075.
Segonne, F., Pacheco, J., and Fischl, B. (2007). Geometrically accurate topology-correction of cortical surfaces using nonseparating loops. IEEE Trans. Med. Imaging. 26, 518–529.
Shaffer, D., Gould, M. S., Brasic, J., Ambrosini, P., Fisher, P., Bird, H., and Aluwahlia, S. (1983). A Children’s Global Assessment Scale (CGAS). Arch. Gen. Psychiatry 40, 1228–1231.
Shenton, M. E., Dickey, C. C., Frumin, M., and McCarley, R. W. (2001). A review of MRI findings in schizophrenia. Schizophr. Res. 49, 1–52.
Stefansson, H., Rujescu, D., Cichon, S., Ingason, A., Steinberg, S., Fossdal, R., Sigurdsson, E., Sigmundsson, T., Buizer-Voskamp, J. E., Hansen, T., Jakobsen, K. D., Muglia, P., Francks, C., Matthews, P. M., Gylfason, A., Halldorsson, B. V., Gudbjartsson, D., Thorgeirsson, T. E., Sigurdsson, A., Jonasdottir, A., Bjornsson, A., Mattiasdottir, S., Blondal, T., Haraldsson, M., Magnusdottir, B. B., Giegling, I., Moller, H. J., Hartmann, A., Shianna, K. V., Ge, D., Need, A. C., Crombie, C., Fraser, G., Walker, N., Lonnqvist, J., Suvisaari, J., Tuulio-Henriksson, A., Paunio, T., Toulopoulou, T., Bramon, E., Di Forti, M., Murray, R., Ruggeri, M., Vassos, E., Tosato, S., Walshe, M., Li, T., Vasilescu, C., Muhleisen, T. W., Wang, A. G., Ullum, H., Djurovic, S., Melle, I., Olesen, J., Kiemeney, L. A., Franke, B., Sabatti, C., Freimer, N. B., Gulcher, J. R., Thorsteinsdottir, U., Kong, A., Andreassen, O. A., Ophoff, R. A., Georgi, A., Rietschel, M., Werge, T., Petursson, H., Goldstein, D. B., Nothen, M. M., Peltonen, L., Collier, D. A., St Clair, D., and Stefansson, K. (2008). Large recurrent microdeletions associated with schizophrenia. Nature 455, 232–236.
Steen, R. G., MullL, C., McClure, R., Hamer, R. M., and Lieberman, J. A. (2006). Brain volume in first-episode schizophrenia. British J. Psychiatry 188, 510–518.
Stone, J. L., O’Donovan, M. C., Gurling, H., Kirov, G. K., Blackwood, D. H., Corvin, A., Craddock, N. J., Gill, M., Hultman, C. M., Lichtenstein, P., McQuillin, A., Pato, C. N., Ruderfer, D. M., Owen, M. J., St Clair, D., Sullivan, P. F., Sklar, P., Purcell Leader, S. M., Korn, J., Macgregor, S., Morris, D. W., O’Dushlaine, C. T., Daly, M. J., Visscher, P. M., Holmans, P. A., Purcell, S. M., Scolnick, E. M., Sklar Leader, P., Williams, N. M., Georgieva, L., Nikolov, I., Norton, N., Williams, H., Toncheva, D., Milanova, V., Thelander, E. F., Sullivan, P., Kenny, E., Waddington, J. L., Choudhury, K., Datta, S., Pimm, J., Thirumalai, S., Puri, V., Krasucki, R., Lawrence, J., Quested, D., Bass, N., Curtis, D., Crombie, C., Fraser, G., Leh Kwan, S., Walker, N., Muir, W. J., McGhee, K. A., Pickard, B., Malloy, P., Maclean, A. W., Van Beck, M., Pato, M. T., Medeiros, H., Middleton, F., Carvalho, C., Morley, C., Fanous, A., Conti, D., Knowles, J. A., Paz Ferreira, C., Macedo, A., Helena Azevedo, M., McCarroll, S. A., Daly, M., Chambert, K., Gates, C., Gabriel, S. B., Mahon, S., and Ardlie, K. (2008). Rare chromosomal deletions and duplications increase risk of schizophrenia. Nature 455, 37–241.
Sun, D., van Erp, T. G. M., Thompson, P. M., Bearden, C. E., Daley, M., Kushan, L., Hardt, M. E., Nuechterlein, K. H., Toga, A. W., and Cannon, T. D. (2009). Elucidating a magnetic resonance imaging-based neuroanatomic biomarker for psychosis: classification analysis using probabilistic brain atlas and machine learning algorithms. Biol. Psychiatry 66, 1055–1060.
van den Heuvel, M. P., and Hulshoff Pol, H. E. (in press). Exploring the brain network: a review on resting-state fMRI functional connectivity. Eur. Neuropsychopharmacol.
van Haren, N. E. M., Schnack, H. G., Cahn, W., van den Heuvel, M. P., Lepage, C., Collins, L., Evans, A. C., Pol, H. E. H., and Kahn, R. S. (2011). Changes in cortical thickness during the course of illness in schizophrenia. Arch. Gen. Psychiatry 68, 871–880.
Weinberger, D. (1987). Implications of normal brain development for the pathogenesis of schizophrenia. Arch. Gen. Psychiatry 44, 660–669.
Yoon, U., Lee, J.-M., Im, K., Shin, Y.-W., Cho, B. H., Kim, I. Y., Kwon, J. S., and Kim, S. I. (2007). Pattern classification using principal components of cortical thickness and its discriminative pattern in schizophrenia. Neuroimage 34, 1405–1415.
Appendix
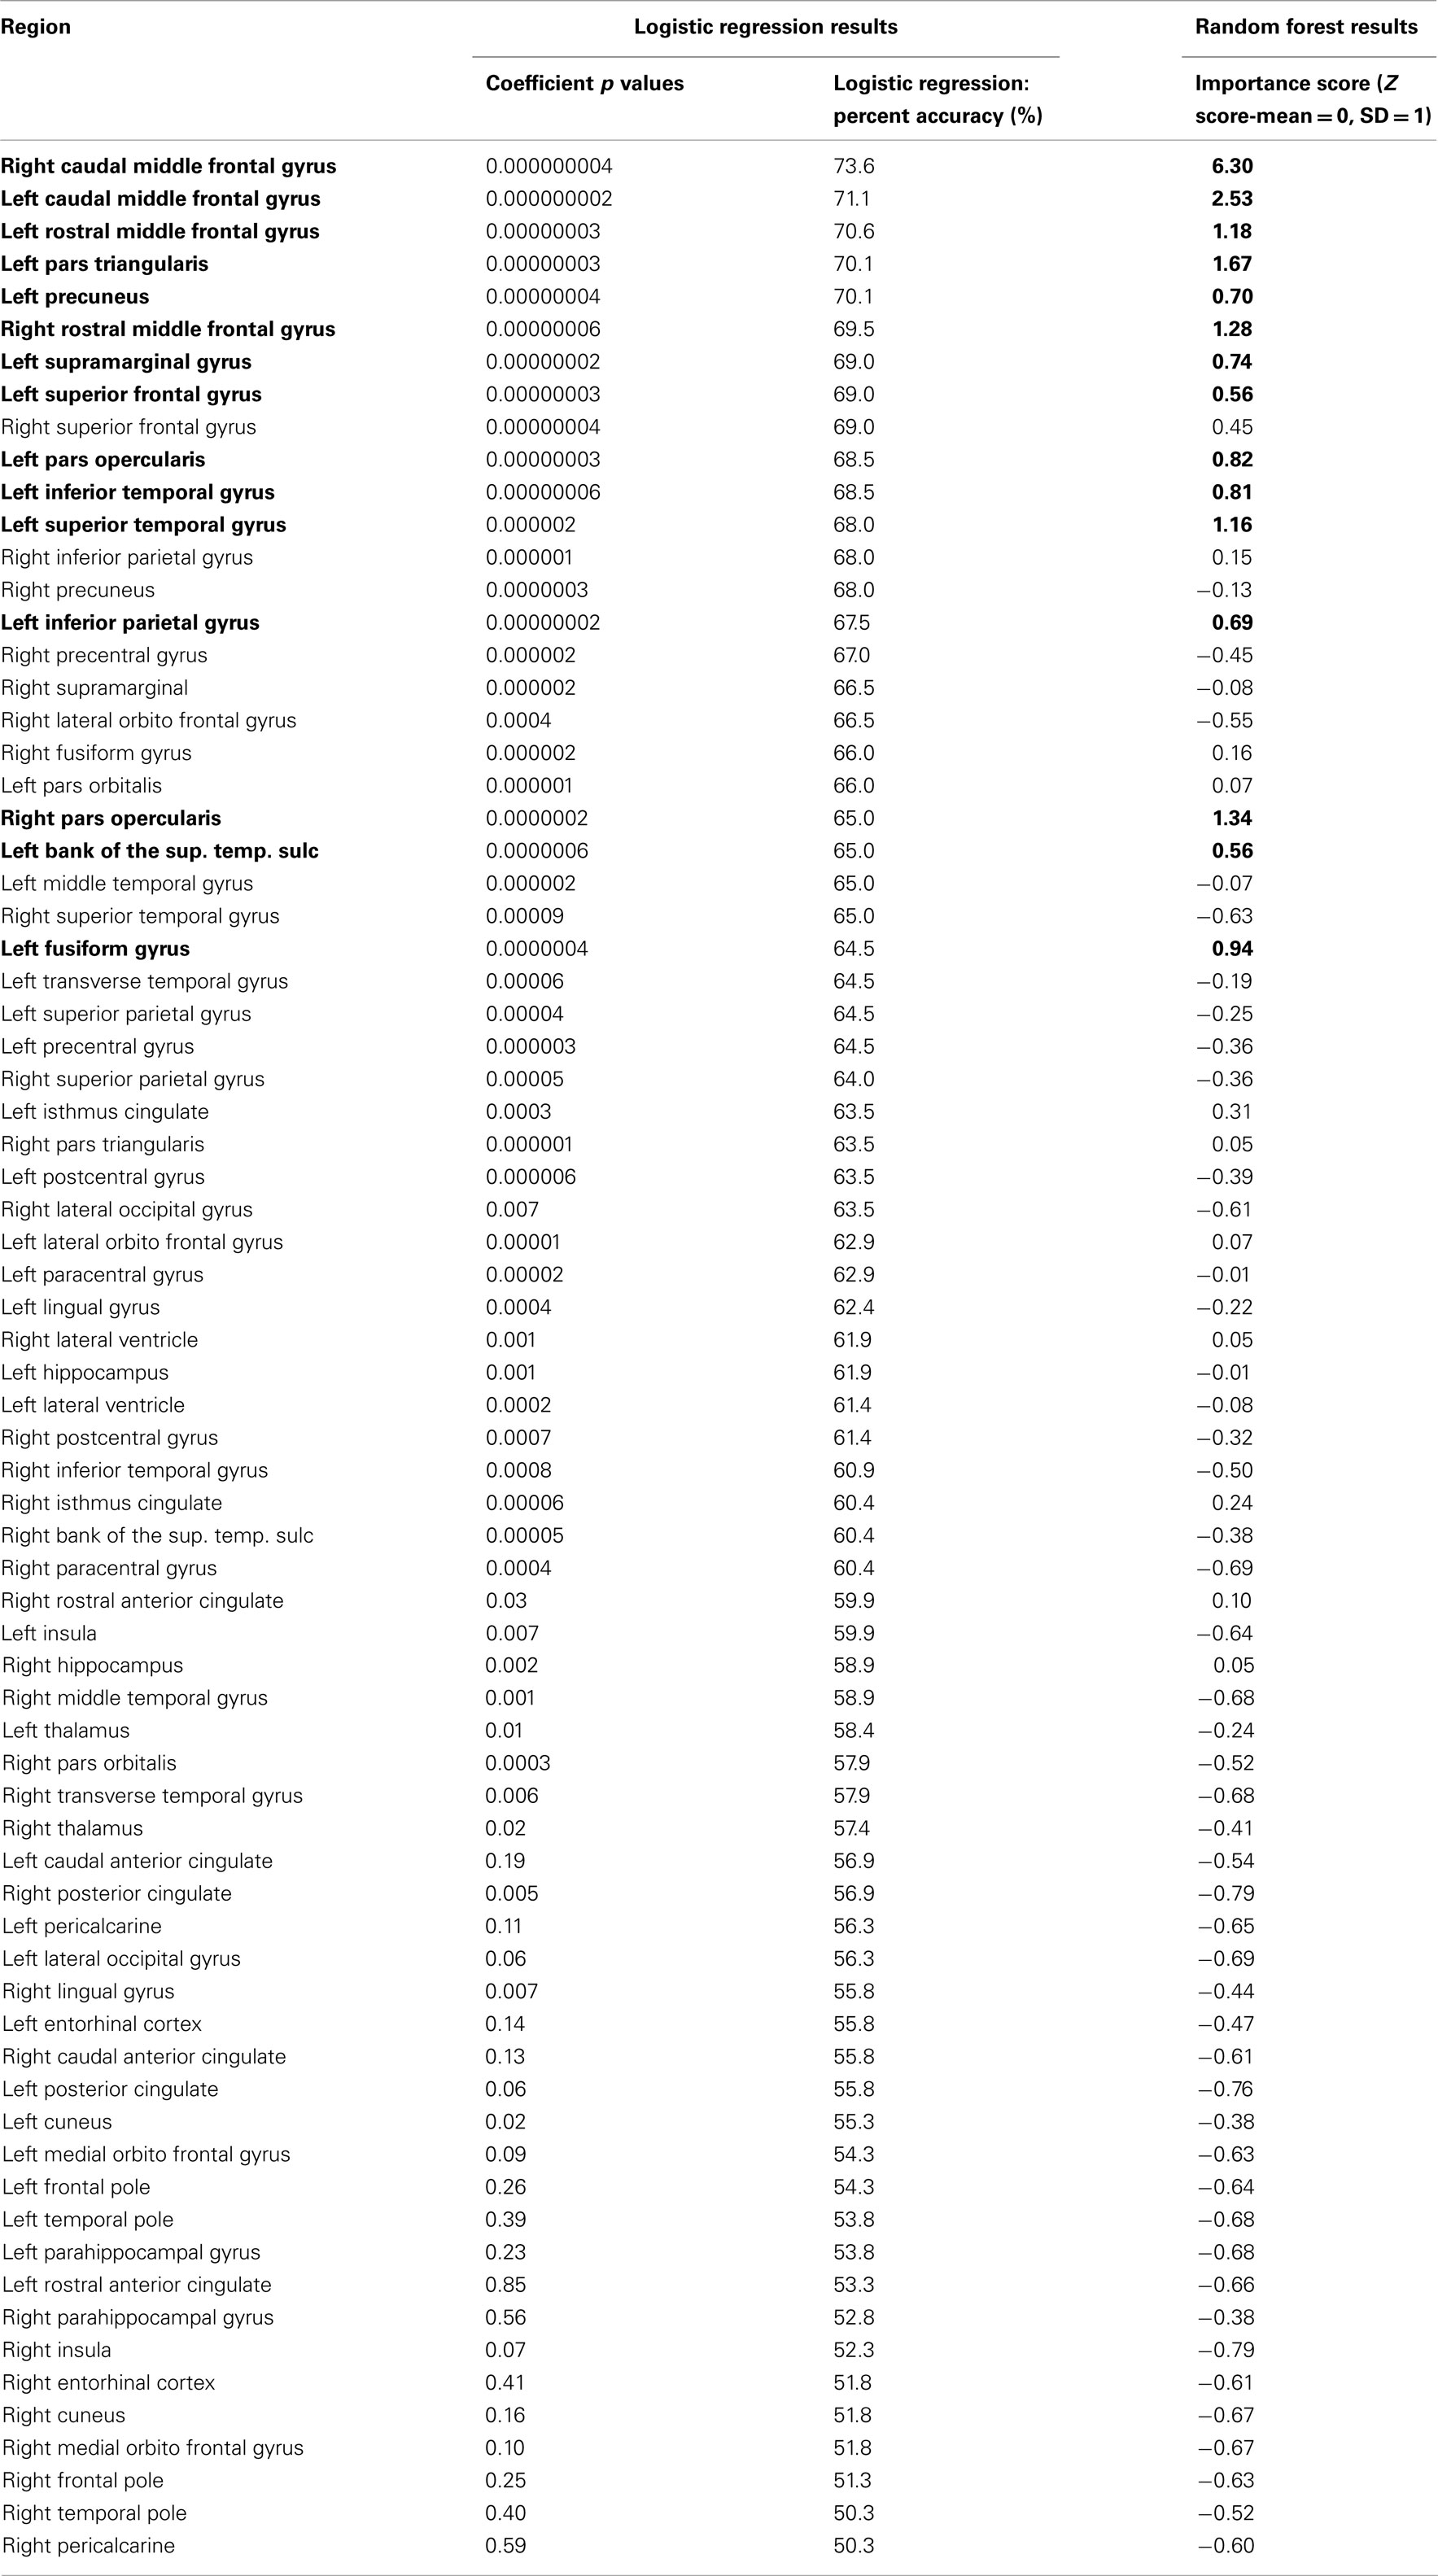
Table A1. All 74 regions sorted by univariate logistic regression percent accuracy and Random Forest importance score (top 15 importance scores with greater than Z > 0.05 in bold).
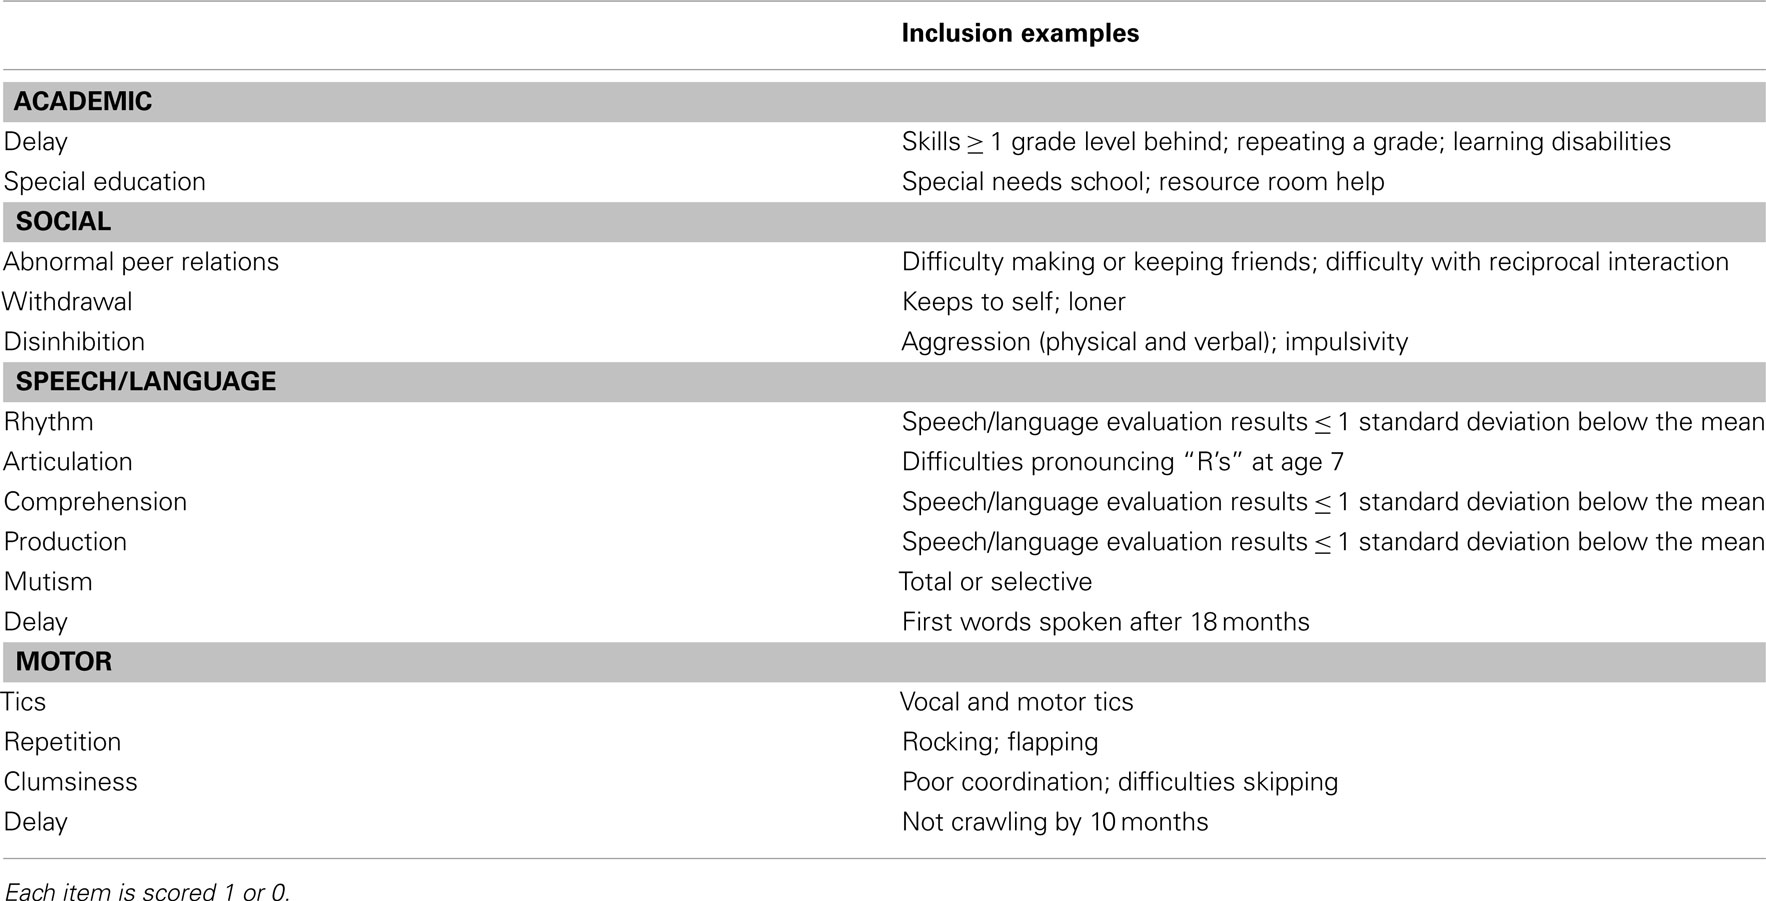
Table A2. Fifteen item chart review for developmental issues with inclusion examples.
Keywords: machine learning, MRI, cortical thickness, schizophrenia
Citation: Greenstein D, Malley JD, Weisinger B, Clasen L and Gogtay N (2012) Using multivariate machine learning methods and structural MRI to classify childhood onset schizophrenia and healthy controls. Front. Psychiatry 3:53. doi: 10.3389/fpsyt.2012.00053
Received: 27 February 2012; Accepted: 14 May 2012;
Published online: 01 June 2012.
Edited by:
Zafiris J. Daskalakis, University of Toronto, CanadaReviewed by:
Paul Croarkin, Mayo Clinic, USA;Jarred Younger, Stanford University School of Medicine, USA
Copyright: © 2012 Greenstein, Malley, Weisinger, Clasen and Gogtay. This is an open-access article distributed under the terms of the Creative Commons Attribution Non Commercial License, which permits non-commercial use, distribution, and reproduction in other forums, provided the original authors and source are credited.
*Correspondence: Deanna Greenstein, Child Psychiatry Branch, National Institutes of Health, National Institute of Mental Health, Child Psychiatry Branch, 10 Center Drive, Room 3N202, Bethesda, MD 20892, USA. e-mail: greenstd@mail.nih.gov