 Renrong Wu1,2
 Yangpan Ou1,2
 Feng Liu3Jindong Chen1,2Huabing Li4
 Jingping Zhao1,2
 Wenbin Guo1,2*
 Xiaoduo Fan5*
- 1Department of Psychiatry, The Second Xiangya Hospital of Central South University, Changsha, China
- 2National Clinical Research Center for Mental Disorders, Changsha, China
- 3Department of Radiology, Tianjin Medical University General Hospital, Tianjin, China
- 4Department of Radiology, The Second Xiangya Hospital of Central South University, Changsha, China
- 5University of Massachusetts Medical School, UMass Memorial Medical Center, One Biotech, Worcester, MA, United States
Antipsychotic medications can have a significant effect on brain function after only several days of treatment. It is unclear whether such an acute effect can serve as an early predictor for treatment response in schizophrenia. Thirty-two patients with drug-naive, first-episode schizophrenia and 32 healthy controls underwent resting-state functional magnetic resonance imaging. Patients were treated with olanzapine and were scanned at baseline and 1 week of treatment. Healthy controls were scanned once at baseline. Symptom severity was assessed within the patient group using the Positive and Negative Syndrome Scale (PANSS) at three time points (baseline, 1 week of treatment, and 8 weeks of treatment). The fractional amplitude of low frequency fluctuation (fALFF) and support vector regression (SVR) methods were used to analyze the data. Compared with the control group, the patient group showed increased levels of fALFF in the bilateral putamen at baseline. After 1week of olanzapine treatment, the patient group showed decreased levels of fALFF in the right putamen relative to those at baseline. The SVR analysis found a significantly positive relationship between the reduction in fALFF after 1 week of treatment and the improvement in positive symptoms after 8 weeks of treatment (r = 0.431, p = 0.014). The present study provides evidence that early reduction and normalization of fALFF in the right putamen may serve as a predictor for treatment response in patients with schizophrenia.
Introduction
Antipsychotic medications are the standard treatment for schizophrenia. However, up to 30% of patients with schizophrenia respond poorly to current antipsychotic treatment (1). Therefore, it is of great clinical value if we can develop a biomarker either before the treatment or during the early treatment course to predict clinical outcome. However, previous effort trying to explore clinically useful predictors has mostly failed (2, 3, 4).
Recently, functional magnetic resonance imaging (fMRI) provides insights into the underlying pathophysiological mechanisms of schizophrenia and antipsychotic effects on brain function. Antipsychotic medications are dopamine receptor antagonists or partial agonists (5). Antipsychotic treatment modulates intrinsic brain activity in the cortical (i.e., the prefrontal cortex and anterior cingulate cortex) and subcortical regions (i.e., the basal ganglia and amygdala) in patients with schizophrenia, which constitute the thalamocortical network (6, 7, 8, 9). Results from longitudinal investigations indicate a normalization and a concurrent denormalization of intrinsic brain activity related to antipsychotic treatment in schizophrenia (2, 3, 4). We have reported that olanzapine increases functional connectivity (FC) in the default-mode network (DMN) and sensorimotor circuits and decreases FC in the left superior temporal gyrus (10, 11, 12) in schizophrenia. In addition, Lui et al. observed a significant relationship between improvement in clinical symptoms and alterations of brain activity in drug-naive, first-episode schizophrenia (13). Another study suggested that prefrontal lobe dysfunction predicts treatment response in drug-naive, first-episode schizophrenia (14).
Although the abovementioned studies provide useful information for us to understand antipsychotic treatment effect on brain activity in schizophrenia, several important issues in the existing literature need to be addressed. First, in most previous studies, patients were exposed to different antipsychotic medications. For example, risperidone, olanzapine, clozapine, aripiprazole, and sulpiride were used in a study with first-episode schizophrenia (13). Different antipsychotic medications may have differential effects on brain function as reported in positron emission tomography (PET) studies (15, 16). Second, chronic patients with a long illness duration were recruited in some previous studies (10, 11, 12). The illness duration itself may have a neurotoxic effect on brain gray matter (17). Third, many previous studies have focused on specified brain regions or networks using a region-of-interest (ROI) method (18, 19). It is not surprising that different studies reported different findings when different ROIs were used. Although the findings are meaningful, the ROI method may not include all significant brain regions that are related to the core pathological alterations in schizophrenia.
Taking these potentially important confounding factors into consideration, the present study was to examine whether acute changes in the brain, 1 week after olanzapine treatment, can predict clinical response after 8 weeks of olanzapine treatment in drug-naive, first-episode schizophrenia because antipsychotic drugs may have acute effects on brain function after only 1 week of treatment when it is in general still too early to observe meaningful clinical improvement (20). Fractional amplitude of low frequency fluctuation (fALFF) was used to analyze the imaging data in a voxel-wise and whole-brain fashion. Support vector regression (SVR) analysis, one of pattern classification approaches, was used to predict individual level clinical response after 8 weeks of olanzapine treatment.
Methods
Participants
A total of 68 right-handed participants were recruited, including 34 patients with drug-naive, first-episode schizophrenia and 34 healthy controls. Patients were recruited from the Department of Psychiatry, the Second Xiangya Hospital of Central South University in China, and healthy controls were recruited from the local community. Schizophrenia was diagnosed using the Structural Clinical Interview for DSM-IV (SCID), patient version (21). All participants had more than 6 years of formal education and aged from 18 to 50 years old. All participants had routine laboratory tests and a physical exam, and met the following exclusion criteria: any psychiatric disorders other than schizophrenia and any medical disorders. For healthy controls, those who have a first-degree relative with psychiatric disorders were excluded.
The study was approved by the ethics committee of the Second Xiangya Hospital of Central South University, China. Each participant provided a written informed consent to participate in the study.
Procedure
Clinical symptoms were assessed using the Positive and Negative Syndrome Scale (PANSS), which includes the positive symptoms, negative symptoms, and general psychopathology subscales (22). All patients were treated with olanzapine as clinically appropriate and tolerated (week 1: dose range 10–20 mg/day with mean and standard deviation 12.19 and 3.09, respectively; week 8: dose range 10–30 mg/day with mean and standard deviation 18.59 and 4.96, respectively). For patients, clinical symptom assessment and the imaging scan were performed twice (pre-treatment baseline, after 8 weeks of treatment). For healthy controls, the imaging scan was performed at baseline.
Data Acquisition and Preprocessing
MRI images were obtained using a 3T MRI scanner (Siemens Verio, Erlangen, Germany). The participants were required to remain motionless and awake with their eyes closed. Soft earplugs and foam pads were used to decrease scanner noise and head motion. Resting-state fMRI images were obtained with a gradient-echo echo-planar imaging (EPI) sequence using the following parameters: repetition time/echo time = 2,000 ms/30 ms, 33 slices, 64 × 64 matrix, 90° flip angle, 22 cm field of view, 4 mm slice thickness, no slice gap, and 240 volumes (480 s).
The images were preprocessed in Matlab (R2012b) using the DPABI software (V4.1_190725) (23) and SPM8. After slice timing and head motion correction, participants with over 2 mm maximal translation and 2° maximal rotation were excluded. Several covariates, including Friston-24 head motion parameters (6 head motion parameters, 6 head motion parameters one time point before, and 12 corresponding squared items) acquired via rigid body correction (24), signal from a ventricular region of interest, and signal from a region centered in the white matter, were removed. The global signal was not removed as it is still a controversial practice in the resting-state fMRI field (25). The data were then normalized to conventional EPI template in the Montreal Neurological Institute (MNI) space and resampled to 3 × 3 × 3 mm3 voxels. Finally, the images were bandpass-filtered (0.01–0.08 Hz) and linearly detrended.
Calculation of fALFF
The analysis procedure for fALFF was performed according to the methods described in a previous study (26). First, the time course of each voxel was converted to the frequency domain without bandpass filtering with a fast Fourier Transform (FFT) and the power spectrum was acquired. Then, the square root was calculated at each frequency of the power spectrum because the power of a given frequency was proportional to the square of the amplitude of its frequency component, and the averaged square root was obtained across 0.01–0.08 Hz at each voxel. The sum of amplitude across 0.01–0.08 Hz was divided by that across the whole frequency range. Finally, the fALFF of each voxel was divided by the global mean fALFF value within a brain mask for standardization purpose (27). This method has been well applied in psychiatric disorders, such as schizophrenia (28, 29, 30), major depressive disorder (27, 31, 32), somatization disorder (33), and healthy subjects (34).
Statistical Analyses
Demographic and clinical data were analyzed using chi-square test and two-sample t-test as appropriate.
Group comparisons between patients and healthy controls were performed at baseline to identify brain regions with abnormal values of fALFF in schizophrenia. For those abnormal brain regions, paired-sample t-test was performed within the patient group to compare values of fALFF between 1 week after olanzapine treatment and baseline. Framewise displacement (FD) was calculated for each participant according to the method described in a previous study (35). The mean FD, age, gender, years of education, and individual dose of olanzapine were used as covariates of no interest. The significance level of p value was corrected for multiple comparisons based on the Gaussian random field (GRF) theory (voxel significance: p < 0.001, cluster significance: p < 0.05) using the software REST (36).
Improvement in Clinical Symptoms
We calculated the reduction rate (RR) of the PANSS total scores using the following formula.
Note: RRtotal_8w refers to the reduction rate of the PANSS total score after 8 weeks of treatment. PANSStotal_0 is the PANSS total score at baseline, whereas PANSStotal_8w is the PANSS total score after 8 weeks of treatment. The RR of each PANSS subscale was calculated using a similar formula.
Pattern Classification
Pattern classification was conducted using the LIBSVM software (http://www.csie.ntu.edu.tw/∼cjlin/libsvm/), including a set of machine learning-based algorithms to differentiate two or more groups based on high-dimensional data such as functional images. In the present study, an SVR was performed using a “leave-one-out” procedure and based on the mean fALFF values of the identified cluster. The purpose of SVR was to examine whether changes of fALFF after 1 week of olanzapine treatment can predict improvement in clinical symptoms after 8 weeks of treatment as reflected by the RRs of the PANSS total and subscale scores.
Results
Characteristics of the Participants
The flowchart of the study participants is shown in Figure 1. The imaging scans from three participants (two patients and one healthy control) were discarded due to excessive head motion; one healthy control withdrew the consent. The final analysis included 32 patients and 32 healthy controls. There were no significant differences between the two groups in gender, age, years of education, and the mean FD value (p’s > 0.20) (Table 1).
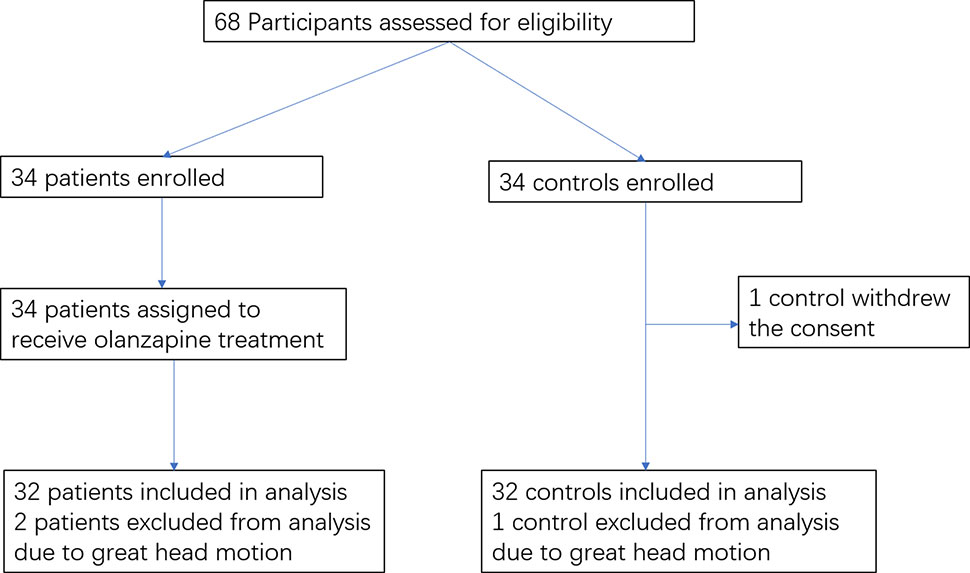
Figure 1 Flowchart of the study participants.
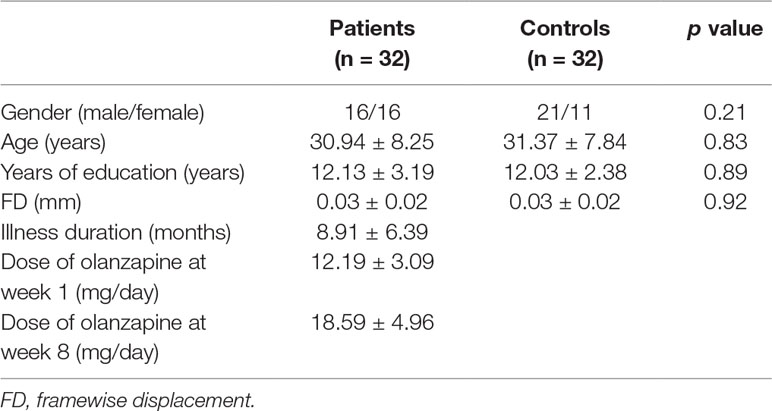
Table 1 Characteristics of the study participants at baseline.
Improvement in Clinical Symptoms Within the Patient Group After 8 Weeks of Treatment
At baseline, the PANSS total score, positive symptoms score, negative symptoms score, and general psychopathology score were 77.38 ± 5.17/20.00 ± 4.32/20.59 ± 3.46/36.78 ± 3.68, respectively (mean ± SD). A significant reduction was found on the PANSS total and subscale scores after 8 weeks of treatment compared to baseline (p’s < 0.001) (Table 2).
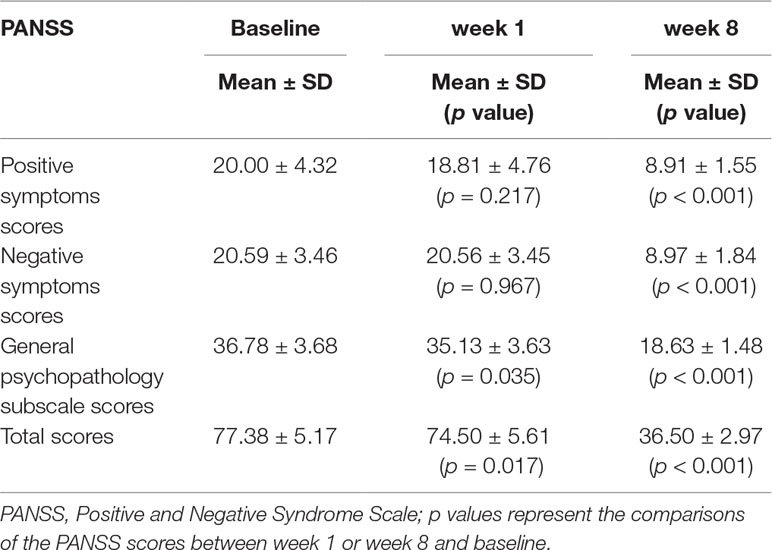
Table 2 The PANSS scores within the patient group.
Baseline Differences in fALFF Between Patients and Healthy Controls
At baseline, compared with the control group, the patient group showed increased levels of fALFF in the bilateral putamen/caudate/pallidum, right cerebellum pons, left cerebellum culmen, right inferior parietal lobule, left inferior parietal lobule, and left superior parietal lobule, and decreased levels of fALFF in the left medial frontal gyrus (orbital part), right fusiform gyrus/lingual gyrus, left calcarine cortex/precuneus, and left superior occipital lobe (Figure 2 and Table 3).
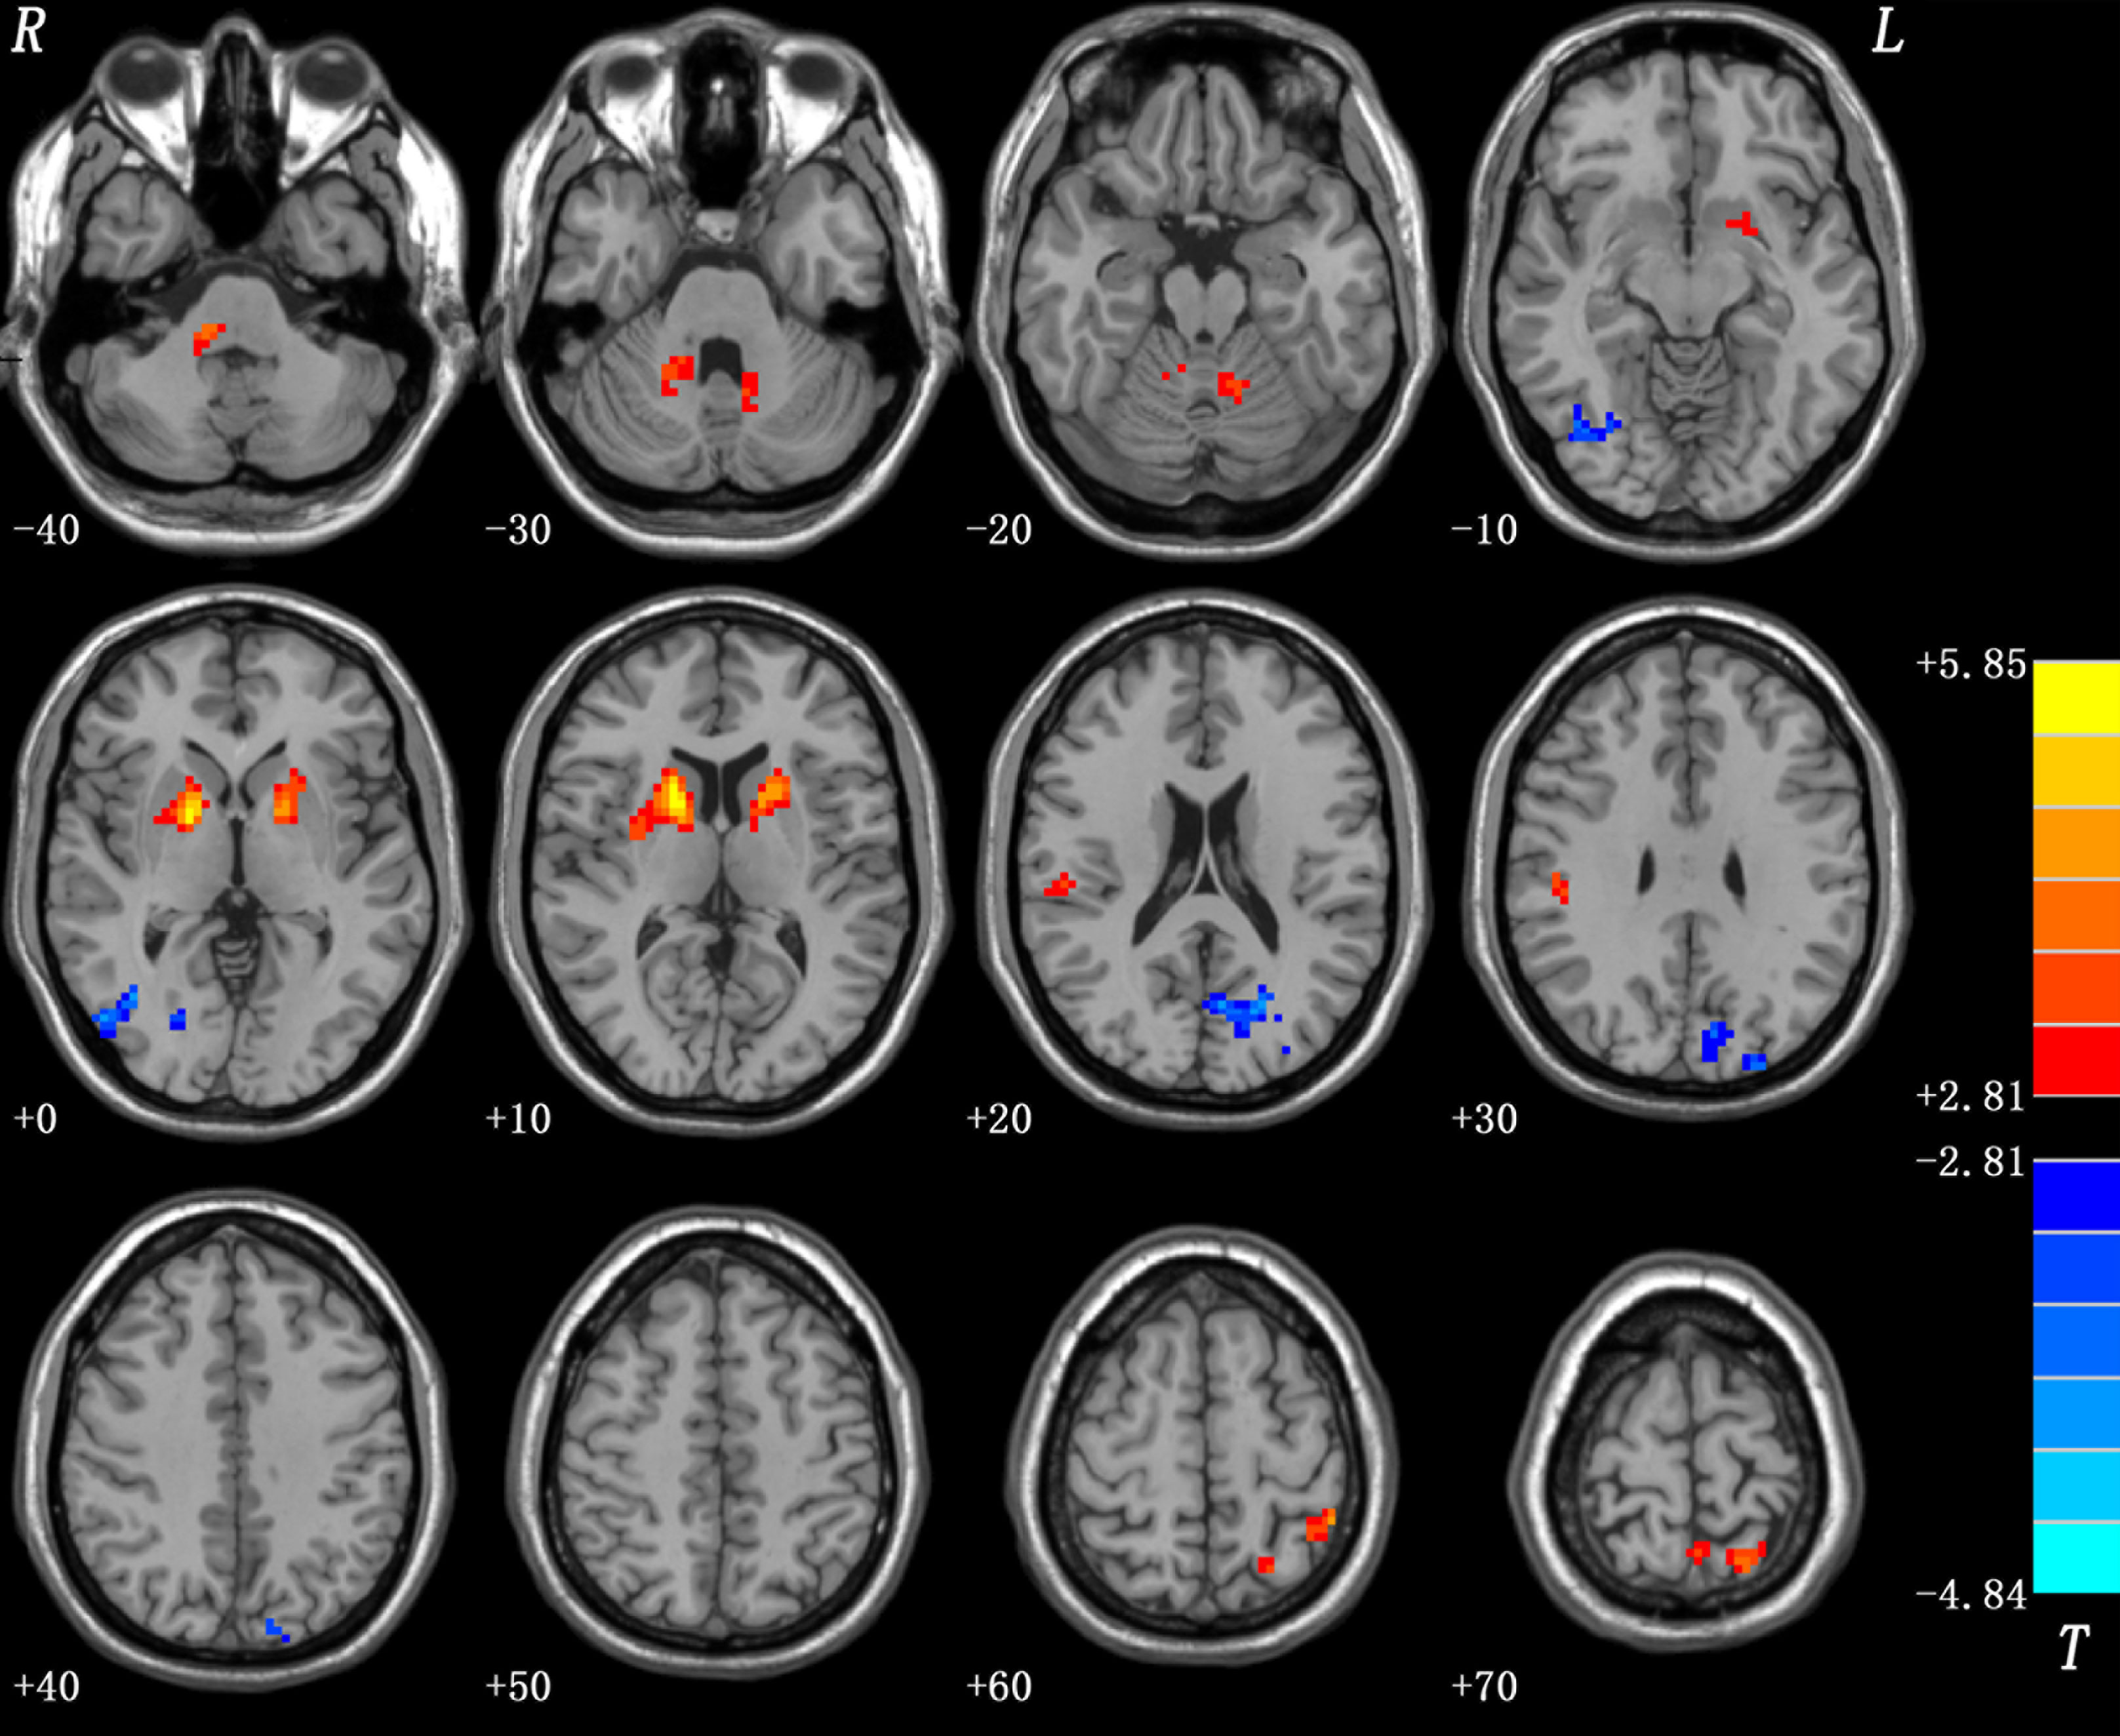
Figure 2 Baseline differences in fALFF between patients and healthy controls. The figure is presented using the viewer of the REST software. Color bars indicate t-values of the group analysis. Red color denotes increased fALFF in the patient group compared to the control group, whereas blue color denotes decreased fALFF in the patient group compared to the control group (p < 0.05, corrected by the GRF method). fALFF, fractional amplitude of low frequency fluctuation; GRF, Gaussian random field.
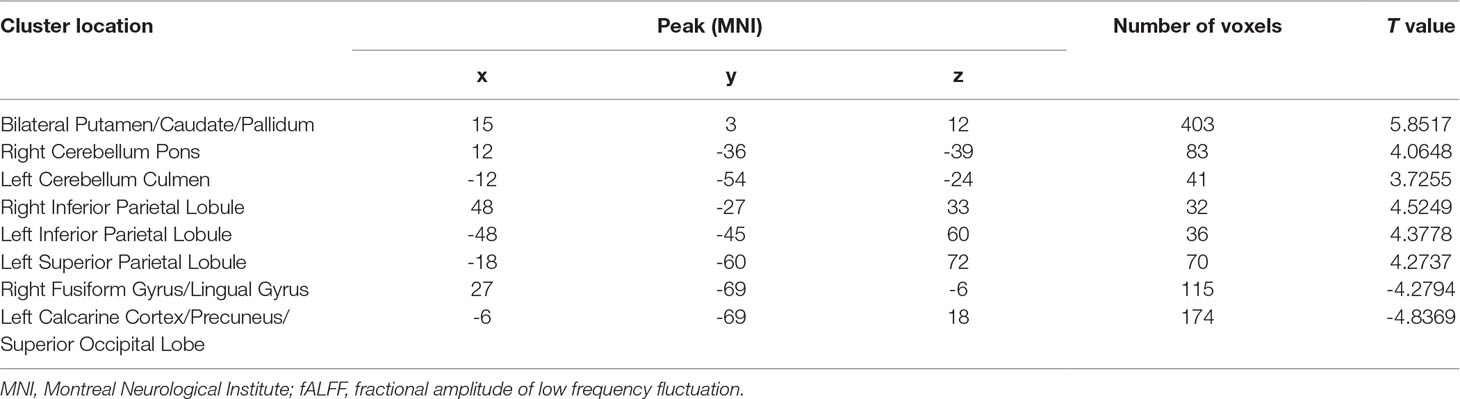
Table 3 Baseline differences in fALFF between patients and healthy controls.
Alterations in fALFF After 1 Week of Olanzapine Treatment Within the Patient Group
After 1 week of treatment, the patient group showed decreased and normalized levels of fALFF in the right putamen relative to those at baseline (Figure 3 and Table 4). For other brain areas with abnormal levels of fALFF at baseline, no significant changes were found after 1 week of olanzapine treatment within the patient group.
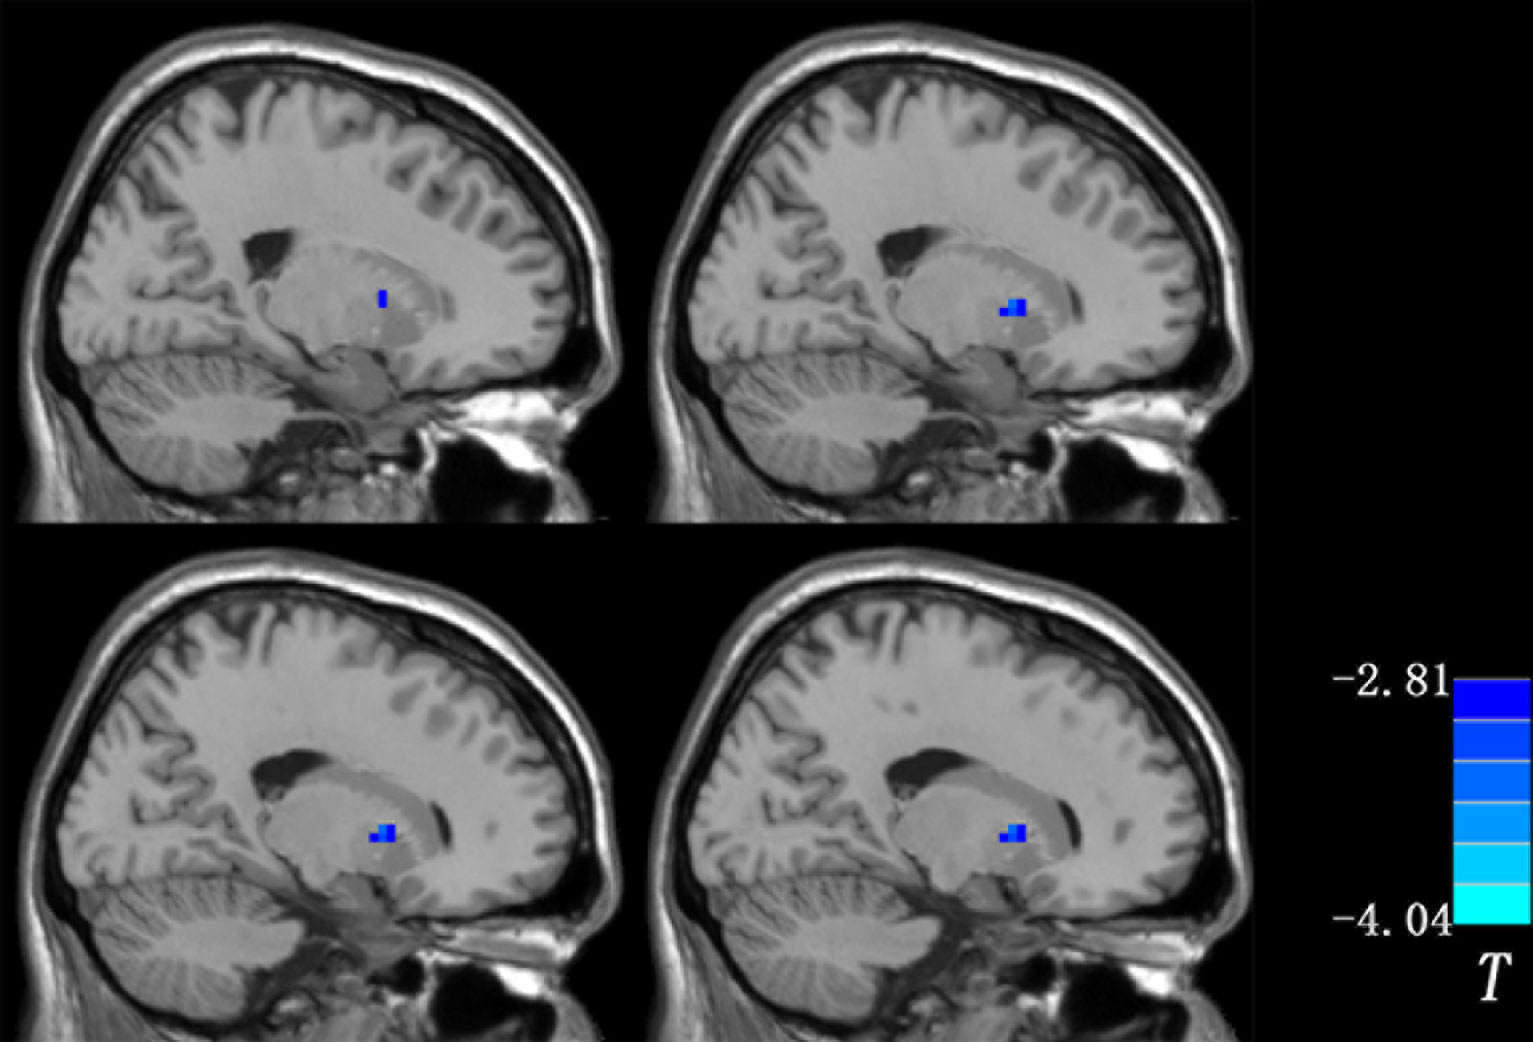
Figure 3 Changes in fALFF after 1 week of olanzapine treatment within the patient group (the right putamen). The comparisons were limited to the brain regions with abnormal levels of fALFF at baseline. The figure is presented using the viewer of the REST software. Color bar indicates t-values of the group analysis. Blue color denotes decreased fALFF after 1 week of olanzapine treatment relative to the values at baseline (p < 0.05, corrected by the GRF method). fALFF, fractional amplitude of low frequency fluctuation; GRF, Gaussian random field.
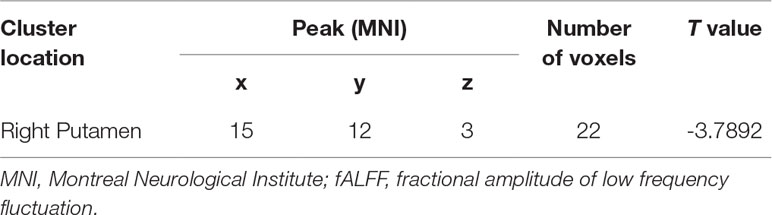
Table 4 Treatment effect on fALFF after 1 week of olanzapine treatment within the patient group.
Pattern Classification Results
Since the right putamen was the only brain region that showed decreased and normalized fALFF after 1 week of olanzapine treatment, the change in levels of fALFF in the right putamen at week 1 might be able to predict treatment response at week 8. To test this possibility, SVR analysis was conducted. The SVR result showed a significantly positive relationship between decreased levels of fALFF at week 1 and the improvement in positive symptoms at week 8 as measured by the RR of the PANSS positive symptoms subscale scores (r = 0.431, p = 0.014, Figure 4).
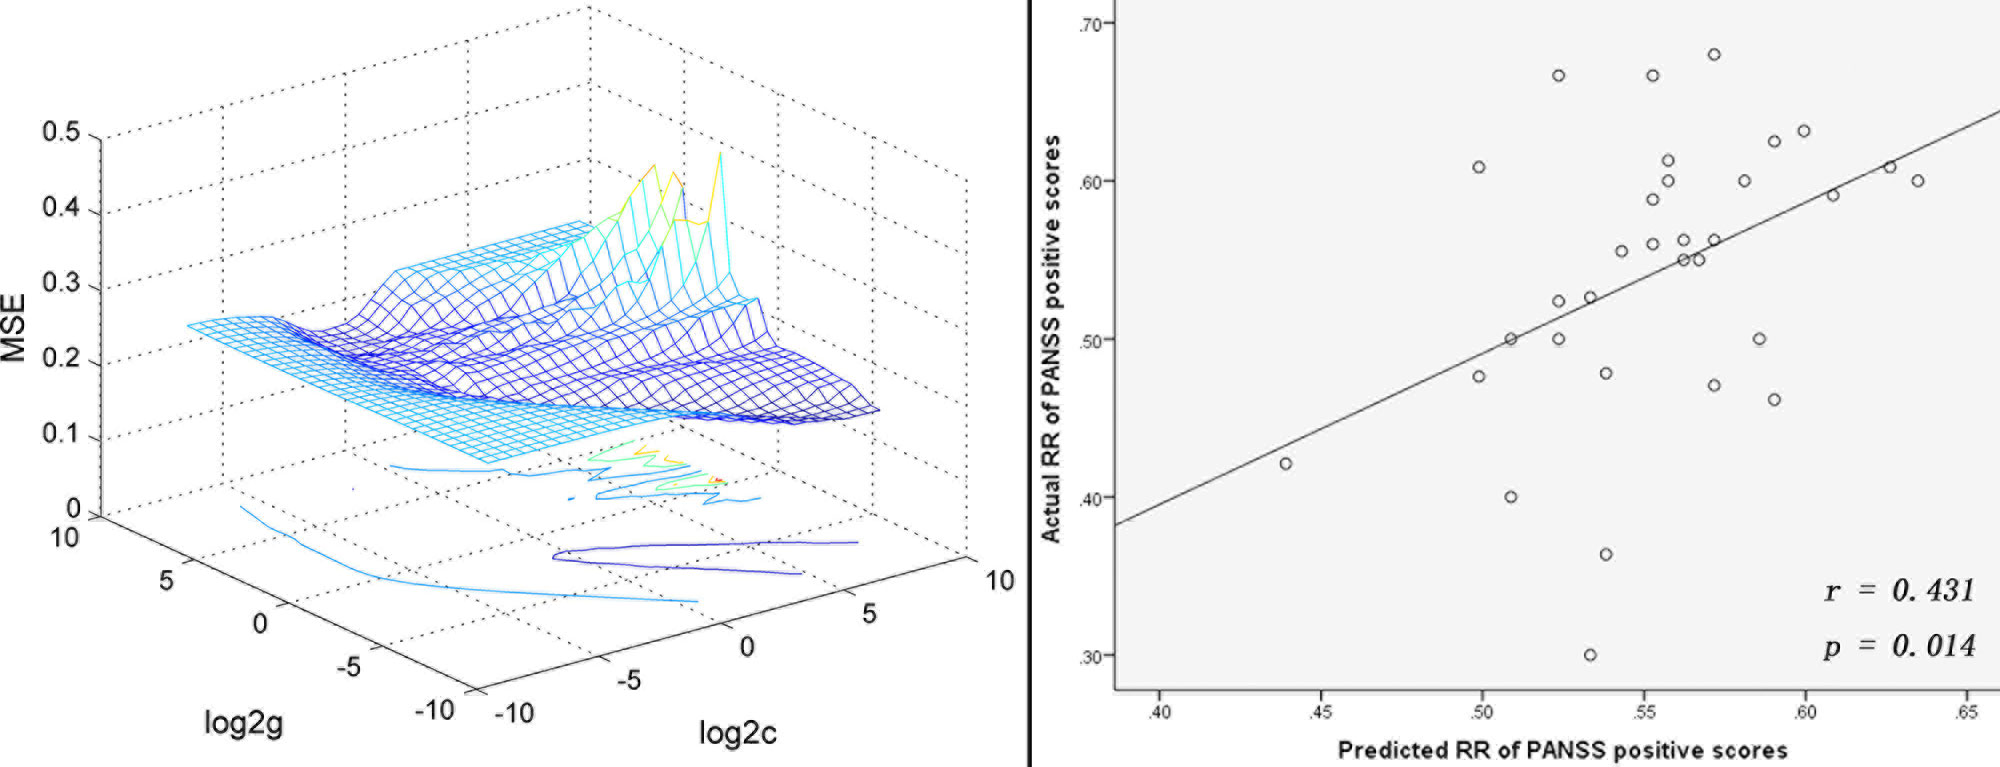
Figure 4 SVR analysis indicates that decreased levels of fALFF in the right putamen after 1 week of olanzapine treatment may predict improvement in positive symptoms after 8 weeks of olanzapine treatment. Left: 3D visualization of SVR results with the best parameters (best c = 22.6274, g = 0.015625) using the grid search method. Right: A positive correlation between predicted and actual reduction rates of individual level PANSS positive symptoms subscale scores after 8 weeks of treatment (r = 0.431, p = 0.014). The predicted reduction rates were calculated based on decreased levels of fALFF in the right putamen after 1 week of olanzapine treatment using the LIBSVM software. SVR, support vector regression; MSE, mean square error; fALFF, fractional amplitude of low frequency fluctuation; PANSS, the Positive and Negative Syndrome Scale.
Discussion
To our knowledge, the present study was the first to explore an early imaging biomarker to predict antipsychotic treatment response in drug-naive, first-episode schizophrenia using a combination of fMRI data and pattern classification methods. We found that reduced and normalized fALFF in the right putamen after 1 week of olanzapine treatment may serve as a predictor for improvement in positive symptoms after 8 weeks of olanzapine treatment.
Our findings are in line with a previous report (37), which observed increased levels of ALFF in the right putamen in patients with or without auditory hallucinations in first episode schizophrenia. Our findings are also consistent with the results from another study that showed that medicated patients with schizophrenia had decreased metabolic rates in the putamen relative to never-medicated patients (38). Further, our findings are consistent with a previous study that reported that increased gray matter (GM) volume in the right putamen might be a marker to predict antipsychotic treatment response in schizophrenia (39). In that study, patients with drug-naive, first-episode schizophrenia received antipsychotic treatment for 6 weeks. The imaging data were analyzed using a tensor-based morphometry method. It was found that increased GM volume in the right putamen after 6 weeks of treatment was associated with improvement in positive symptoms of schizophrenia. Together with these studies, the present study suggests that structural and functional changes in putamen in response to antipsychotic treatment might be associated with clinical outcome in patients with schizophrenia.
The putamen, a subcortical node of the striatum, is rich in dopamine, a main neurotransmitter in the brain. Dopamine plays a key role in complex behavior and cognition in schizophrenia (40). According to the dopamine hypothesis in schizophrenia, excessive dopamine in the striatum (including the putamen) is associated with positive symptoms such as hallucinations and delusions (41). Antipsychotic medications target multiple dopaminergic receptors including D1 and D2 in the striatum, which might contribute to improvement in positive symptoms. Therefore, reduced and normalized fALFF in the right putamen, even in the early treatment course, was associated with improvement in positive symptoms in the present study.
Our study has several novel aspects. First, we identified a possible imaging biomarker at 1 week of treatment to predict clinical response at 8 weeks of treatment. Clinically, it usually takes 6–8 weeks to determine clinical effectiveness of antipsychotic treatment. Therefore, establishing an early predictor for treatment response is of great clinical value to help psychiatrists decide, during the early treatment course, whether the patient should stay on the chosen antipsychotic medication or switch to a different one. Second, a ROI method was commonly used in previous studies; this method focuses on selected brain regions but may miss other brain regions that are critical to the underlying pathophysiology of schizophrenia (19). In contrast, the fALFF analysis, which takes a voxel-wise whole-brain approach, was used in our study. Third, most previous studies that tried to identify predictors for treatment response used univariate statistics, which is appropriate for group level prediction (42); in contrast, SVR analysis, a pattern classification technique used in our study, is a promising tool for individual level prediction (43). Fourth, the present study included patients with drug-naive, first-episode schizophrenia, minimizing several important possible confounding factors, such as a long illness duration and prior exposure to antipsychotic medication.
The mean age of patients seems older than in typical first-episode patients, such as patients in our previous study (44). Different inclusion criteria on age were used in our two studies. The previous study was conducted in Guangxi and included participants aged from 16 to 30 years, whereas the present study was performed in Changsha and included participants aged from 18 to 50 years. The typical age range for first episode psychosis is 16–35 years old. In the present study, most patients fell into this age range and only four patients were older than 35 years. Hence, the patients in the present study in general still represent usual first-episode drug-naive patients with schizophrenia.
The present study has several limitations. First, the relatively small sample size may limit the generalizability of the results from the present study. Second, all patients were treated with olanzapine; the findings from this study may not be able to generalize to other antipsychotic medications. Third, imaging scans were not done 8 weeks after treatment. Therefore, it is unclear whether the changes in fALFF observed at week 1 persisted at week 8. Future studies with a larger sample size are needed to further examine the clinical utility of using acute changes in fALFF in the right putamen to predict antipsychotic treatment response in patients with schizophrenia.
In conclusion, the present study provides evidence that early reduction and normalization of fALFF in the right putamen may serve as a predictor for treatment response in patients with schizophrenia.
Data Availability Statement
All datasets generated for this study are included in the manuscript/supplementary files.
Ethics Statement
The study was approved by the ethics committee of the Second Xiangya Hospital of Central South University, China. Each subject provided a written informed consent to participate in the study. The patients/participants provided their written informed consent to participate in this study.
Author Contributions
Study concept and design: WG, XF, and JZ. Acquisition, analysis, or interpretation of data: FL, JC, HL, YO, and RW. Drafting of the manuscript: RW, WG, and XF. Critical revision of the manuscript for important intellectual content: WG, XF, and FL. Statistical analysis: WG and FL. Obtained funding: WG and JZ. Administrative, technical, or material support: WG, FL, JC, HL, RW, and JZ. Study supervision: WG and JZ.
Funding
This study was supported by grants from the National Key R&D Program of China (Grant Nos. 2016YFC1307100 and 2016YFC1306900), the National Natural Science Foundation of China (Grant Nos. 81571310, 81771447, and 81630033), and the Natural Science Foundation of Tianjin (Grant No. 18JCQNJC10900).
Conflict of Interest
XF has received research support or honoraria from Alkermes, Neurocrine, Avanir, Allergen, Otsuka, Lundbeck, Boehringer Ingelheim, Merck, and Janssen.
The remaining authors declare that the research was conducted in the absence of any commercial or financial relationships that could be construed as a potential conflict of interest.
Acknowledgments
The authors thank all individuals who served as research subjects in this study.
References
1. Lieberman JA, Stroup TS, McEvoy JP, Swartz MS, Rosenheck RA, Perkins DO, et al. Clinical antipsychotic trials of intervention effectiveness: effectiveness of antipsychotic drugs in patients with chronic schizophrenia. N Engl J Med (2005) 353(12):1209–23. doi: 10.1056/NEJMoa051688
2. De Rossi P, Chiapponi C, Spalletta G. Brain functional effects of psychopharmacological treatments in schizophrenia: a network-based functional perspective beyond neurotransmitter systems. Curr Neuropharmacol (2015) 13(4):435–44. doi: 10.2174/1570159X13666150507223542
3. Gong Q, Lui S, Sweeney JA. A selective review of cerebral abnormalities in patients with first-episode schizophrenia before and after treatment. Am J Psychiatry (2016) 173(3):232–43. doi: 10.1176/appi.ajp.2015.15050641
4. Abbott CC, Jaramillo A, Wilcox CE, Hamilton DA. Antipsychotic drug effects in schizophrenia: a review of longitudinal FMRI investigations and neural interpretations. Curr Med Chem (2013) 20(3):428–37. doi: 10.2174/0929867311320030014
5. Howes OD, Kapur S. The dopamine hypothesis of schizophrenia: version III—the final common pathway. Schizophr Bull (2009) 35(3):549–62. doi: 10.1093/schbul/sbp006
6. Shenton ME, Dickey CC, Frumin M, McCarley RW. A review of MRI findings in schizophrenia. Schizophr Res (2001) 49(1-2):1–52. doi: 10.1016/S0920-9964(01)00163-3
7. Glahn DC, Laird AR, Ellison-Wright I, Thelen SM, Robinson JL, Lancaster JL, et al. Meta-analysis of gray matter anomalies in schizophrenia: application of anatomic likelihood estimation and network analysis. Biol Psychiatry (2008) 64(9):774–81. doi: 10.1016/j.biopsych.2008.03.031
8. Minzenberg MJ, Laird AR, Thelen S, Carter CS, Glahn DC. Meta-analysis of 41 functional neuroimaging studies of executive function in schizophrenia. Arch Gen Psychiatry (2009) 66(8):811–22. doi: 10.1001/archgenpsychiatry.2009.91
9. Welsh RC, Chen AC, Taylor SF. Low-frequency BOLD fluctuations demonstrate altered thalamocortical connectivity in schizophrenia. Schizophr Bull (2010) 36(4):713–22. doi: 10.1093/schbul/sbn145
10. Guo W, Liu F, Chen J, Wu R, Li L, Zhang Z, et al. Olanzapine modulates the default-mode network homogeneity in recurrent drug-free schizophrenia at rest. Aust N Z J Psychiatry (2017) 51(10):1000–9. doi: 10.1177/0004867417714952
11. Guo W, Liu F, Chen J, Wu R, Li L, Zhang Z, et al. Olanzapine modulation of long- and short-range functional connectivity in the resting brain in a sample of patients with schizophrenia. Eur Neuropsychopharmacol (2017) 27:48–58. doi: 10.1016/j.euroneuro.2016.11.002
12. Guo W, Liu F, Chen J, Wu R, Li L, Zhang Z, et al. Treatment effects of olanzapine on homotopic connectivity in drug-free schizophrenia at rest. World J Biol Psychiatry (2018) 19(sup3): S106–14. doi: 10.1080/15622975.2017.1346280
13. Lui S, Li T, Deng W, Jiang L, Wu Q, Tang H, et al. Short-term effects of antipsychotic treatment on cerebral function in drug-naive first-episode schizophrenia revealed by “resting state” functional magnetic resonance imaging. Arch Gen Psychiatry (2010) 67(8):783–92. doi: 10.1001/archgenpsychiatry.2010.84
14. van Veelen NM, Vink M, Ramsey NF, van Buuren M, Hoogendam JM, Kahn RS. Prefrontal lobe dysfunction predicts treatment response in medication-naive first-episode schizophrenia. Schizophr Res (2011) 129(2-3):156–62. doi: 10.1016/j.schres.2011.03.026
15. Lahti AC, Holcomb HH, Weiler MA, Medoff DR, Tamminga CA. Functional effects of antipsychotic drugs: comparing clozapine with haloperidol. Biol Psychiatry (2003) 53(7):601–8. doi: 10.1016/S0006-3223(02)01602-5
16. Molina V, Gispert JD, Reig S, Sanz J, Pascau J, Santos A, et al. Cerebral metabolism and risperidone treatment in schizophrenia. Schizophr Res (2003) 60(1):1–7. doi: 10.1016/S0920-9964(02)00199-8
17. Perkins DO, Gu H, Boteva K, Lieberman JA. Relationship between duration of untreated psychosis and outcome in first-episode schizophrenia: a critical review and meta-analysis. Am J Psychiatry (2005) 162(10):1785–804. doi: 10.1176/appi.ajp.162.10.1785
18. Cui X, Liu F, Chen J, Xie G, Wu R, Zhang Z, et al. Voxel-wise brain-wide functional connectivity abnormalities in first-episode, drug-naive patients with major depressive disorder. Am J Med Genet B Neuropsychiatr Genet (2018) 177(4):447–53. doi: 10.1002/ajmg.b.32633
19. Li T, Wang Q, Zhang J, Rolls ET, Yang W, Palaniyappan L, et al. Brain-wide analysis of functional connectivity in first-episode and chronic stages of schizophrenia. Schizophr Bull (2017) 43(2):436–48. doi: 10.1093/schbul/sbw099
20. Hadley JA, Nenert R, Kraguljac NV, Bolding MS, White DM, Skidmore FM, et al. Ventral tegmental area/midbrain functional connectivity and response to antipsychotic medication in schizophrenia. Neuropsychopharmacology (2014) 39(4):1020–30. doi: 10.1038/npp.2013.305
21. First MB, Spitzer RL, Gibbon M, Williams JBW. Structured clinical interview for DSM-IV axis I disorders (SCID). Washington, DC: American Psychiatric Press (1997).
22. Kay SR, Fiszbein A, Opler LA. The positive and negative syndrome scale (PANSS) for schizophrenia. Schizophr Bull (1987) 13(2):261–76. doi: 10.1093/schbul/13.2.261
23. Yan CG, Wang XD, Zuo XN, Zang YF. DPABI: Data Processing & Analysis for (Resting-State) Brain Imaging. Neuroinformatics (2016) 14(3):339–51. doi: 10.1007/s12021-016-9299-4
24. de Kwaasteniet B, Ruhe E, Caan M, Rive M, Olabarriaga S, Groefsema M, et al. Relation between structural and functional connectivity in major depressive disorder. Biol Psychiatry (2013) 74(1):40–7. doi: 10.1016/j.biopsych.2012.12.024
25. Hahamy A, Calhoun V, Pearlson G, Harel M, Stern N, Attar F, et al. Save the global: global signal connectivity as a tool for studying clinical populations with functional magnetic resonance imaging. Brain Connect (2014) 4(6):395–403. doi: 10.1089/brain.2014.0244
26. Zou QH, Zhu CZ, Yang Y, Zuo XN, Long XY, Cao QJ, et al. An improved approach to detection of amplitude of low-frequency fluctuation (ALFF) for resting-state fMRI: fractional ALFF. J Neurosci Methods (2008) 172(1):137–41. doi: 10.1016/j.jneumeth.2008.04.012
27. Liu F, Guo W, Liu L, Long Z, Ma C, Xue Z, et al. Abnormal amplitude low-frequency oscillations in medication-naive, first-episode patients with major depressive disorder: a resting-state fMRI study. J Affect Disord (2013) 146:401–6. doi: 10.1016/j.jad.2012.10.001
28. Guo W, Liu F, Chen J, Wu R, Li L, Zhang Z, et al. Hyperactivity of the default-mode network in first-episode, drug-naive schizophrenia at rest revealed by family-based case-control and traditional case-control designs. Medicine (Baltimore) (2017) 96(13):e6223. doi: 10.1097/MD.0000000000006223
29. Hoptman MJ, Zuo XN, Butler PD, Javitt DC, D’Angelo D, Mauro CJ, et al. Amplitude of low-frequency oscillations in schizophrenia: a resting state fMRI study. Schizophr Res (2010) 117:13–20. doi: 10.1016/j.schres.2009.09.030
30. Li H, Guo W, Liu F, Chen J, Su Q, Zhang Z, et al. Enhanced baseline activity in the left ventromedial putamen predicts individual treatment response in drug-naive, first-episode schizophrenia: results from two independent study samples. EBioMedicine (2019) 46:248–55.doi: 10.1016/j.ebiom.2019.07.022
31. Guo W, Liu F, Yu M, Zhang J, Zhang Z, Liu J, et al. Decreased regional activity and network homogeneity of the fronto-limbic network at rest in drug-naive major depressive disorder. Aust N Z J Psychiatry (2015) 49(6):550–6. doi: 10.1177/0004867415577978
32. Guo W, Liu F, Zhang J, Zhang Z, Yu L, Liu J, et al. Dissociation of regional activity in the default mode network in first-episode, drug-naive major depressive disorder at rest. J Affect Disord (2013) 151:1097–101. doi: 10.1016/j.jad.2013.09.003
33. Su Q, Yao D, Jiang M, Liu F, Jiang J, Xu C, et al. Dissociation of regional activity in default mode network in medication-naive, first-episode somatization disorder. PLoS One (2014) 9(7):e99273. doi: 10.1371/journal.pone.0099273
34. Kunisato Y, Okamoto Y, Okada G, Aoyama S, Nishiyama Y, Onoda K, et al. Personality traits and the amplitude of spontaneous low-frequency oscillations during resting state. Neurosci Lett (2011) 492(2):109–13. doi: 10.1016/j.neulet.2011.01.067
35. Power JD, Barnes KA, Snyder AZ, Schlaggar BL, Petersen SE. Spurious but systematic correlations in functional connectivity MRI networks arise from subject motion. Neuroimage (2012) 59:2142–54. doi: 10.1016/j.neuroimage.2011.10.018
36. Song XW, Dong ZY, Long XY, Li SF, Zuo XN, Zhu CZ, et al. REST: a toolkit for resting-state functional magnetic resonance imaging data processing. PLoS One (2011) 6:e25031. doi: 10.1371/journal.pone.0025031
37. Cui LB, Liu K, Li C, Wang LX, Guo F, Tian P, et al. Putamen-related regional and network functional deficits in first-episode schizophrenia with auditory verbal hallucinations. Schizophr Res (2016) 173(1-2):13–22. doi: 10.1016/j.schres.2016.02.039
38. Shihabuddin L, Buchsbaum MS, Hazlett EA, Haznedar MM, Harvey PD, Newman A, et al. Dorsal striatal size, shape, and metabolic rate in never-medicated and previously medicated schizophrenics performing a verbal learning task. Arch Gen Psychiatry (1998) 55(3):235–43. doi: 10.1001/archpsyc.55.3.235
39. Li M, Chen Z, Deng W, He Z, Wang Q, Jiang L, et al. Volume increases in putamen associated with positive symptom reduction in previously drug-naive schizophrenia after 6 weeks antipsychotic treatment. Psychol Med (2012) 42(7):1475–83. doi: 10.1017/S0033291711002157
40. Schultz W. Behavioral dopamine signals. Trends Neurosci (2007) 30(5):203–10. doi: 10.1016/j.tins.2007.03.007
41. Toda M, Abi-Dargham A. Dopamine hypothesis of schizophrenia: making sense of it all. Curr Psychiatr Rep (2007) 9(4):329–36. doi: 10.1007/s11920-007-0041-7
42. Gong Q, Li L, Tognin S, Wu Q, Pettersson-Yeo W, Lui S, et al. Using structural neuroanatomy to identify trauma survivors with and without post-traumatic stress disorder at the individual level. Psychol Med (2014) 44(1):195–203. doi: 10.1017/S0033291713000561
43. Redlich R, Opel N, Grotegerd D, Dohm K, Zaremba D, Burger C, et al. Prediction of individual response to electroconvulsive therapy via machine learning on structural magnetic resonance imaging data. JAMA Psychiatry (2016) 73(6):557–64. doi: 10.1001/jamapsychiatry.2016.0316
Keywords: schizophrenia, early predictor, olanzapine, fractional amplitude of low frequency fluctuation, pattern classification
Citation: Wu R, Ou Y, Liu F, Chen J, Li H, Zhao J, Guo W and Fan X (2019) Reduced Brain Activity in the Right Putamen as an Early Predictor for Treatment Response in Drug-Naive, First-Episode Schizophrenia. Front. Psychiatry 10:741. doi: 10.3389/fpsyt.2019.00741
Received: 21 May 2019; Accepted: 16 September 2019;
Published: 08 October 2019.
Edited by:
Quanying Liu, California Institute of Technology, United StatesReviewed by:
Kiyotaka Nemoto, University of Tsukuba, JapanZhikun Zhang, Guangxi Medical University, China
Copyright © 2019 Wu, Ou, Liu, Chen, Li, Zhao, Guo and Fan. This is an open-access article distributed under the terms of the Creative Commons Attribution License (CC BY). The use, distribution or reproduction in other forums is permitted, provided the original author(s) and the copyright owner(s) are credited and that the original publication in this journal is cited, in accordance with accepted academic practice. No use, distribution or reproduction is permitted which does not comply with these terms.
*Correspondence: Wenbin Guo, guowenbin76@csu.edu.cn; Xiaoduo Fan, xiaoduo.fan@umassmed.edu