 Min Cao
 Bin Cui*
- Shanghai Clinical Center for Endocrine and Metabolic Diseases, Shanghai Institute of Endocrine and Metabolic Diseases, Ruijin Hospital, Shanghai JiaoTong University School of Medicine, Shanghai, China
Background: Observational studies showed that educational attainment (EA) is associated with cardiometabolic diseases, but the long interval between exposure and outcome makes it difficult to infer causality. We herein used Mendelian randomization (MR) to examine the causal effects of EA on adiposity, type 2 diabetes (T2D), and coronary artery disease (CAD).
Methods: A two-sample MR analysis was conducted using genome-wide association study (GWAS) summary statistics. Seventy-four instrumental variables (IVs) were used to determine the causal effect of EA on cardiometabolic diseases. Sensitivity analyses were also performed to detect the pleiotropy of the IVs.
Results: Using the MR approach, we found that each additional year in EA is associated with a reduction in the body mass index (BMI) (β −0.17 [95% CI −0.23, −0.10], P = 8.85 × 10⁻⁷), a 39% reduction in the odds of having T2D (OR 0.61 [95% CI 0.50, 0.75], P = 1.16 × 10⁻⁶), and a 36% reduction in the odds of having CAD (OR 0.64 [95% CI 0.55, 0.75], P = 2.38 × 10⁻⁸) at the Bonferroni-adjusted level of significance.
Conclusion: Our findings suggest a causal role of EA on the cardiometabolic diseases including adiposity, T2D, and CAD.
Introduction
Observational studies have consistently showed that socioeconomic status such as low education is associated with an increased risk of cardiovascular disease (CVD) and mortality (1–4), but disentangling causality is challenging due to the long interval between exposure and outcome. Mendelian randomization (MR) analysis may help to clarify the relationship (5), which utilizes genetic variants as the unconfounded proxies for an exposure of interest and leverages the random assortment of alleles at the time of conception to overcome limitations inherent in observational studies, thus improving causal inferences. The MR method has been widely used in a range of biological and behavioral exposures, but very few in socioeconomic exposure. Two MR analyses revealed the causal role of educational attainment (EA) on myopia (6) and obesity (7), but both using relatively small sample size. A recent MR study indicated a causal association between low EA and increased risk of smoking, which might explain the observational associations between EA and adverse health outcomes such as coronary artery disease (CAD) (8). Relatedly, a well-designed MR study found that additional education was causally associated with a decreased risk of CAD, and proposed that smoking, body mass index (BMI), and blood lipids might be the potential mechanisms, but no causal effect was found on type 2 diabetes (T2D) (9). The recent findings in an MR study suggested that a large part of the protective effect of education on CVD was mediated by BMI, systolic blood pressure, and smoking behavior (10).
In this study, in order to determine the causal effect of EA on adiposity, T2D, and CAD, we used a two-sample MR approach obtaining publicly available summary statistics from genome-wide association studies (GWAS) of EA (11) and the outcomes (12–14). We also tested the robustness of our findings across a range of MR methods as sensitivity analyses.
Methods
Study Design
We performed two-sample MR studies based on the publicly available summary-level data from GWASs to determine the causal relationship between EA and BMI, T2D, and CAD. The genetic instrumental variables (IVs) applied in the MR analysis must satisfy the following three assumptions (15): (1) the genetic variants used as IVs must be associated with EA, (2) the genetic variants must not be associated with any confounders, and (3) the genetic variants must influence BMI, T2D, and CAD only through EA but not through any direct or alternative pathways.
IV Selection and Data Sources
Summary statistics of EA associated single nucleotide polymorphisms (SNPs) were extracted from a GWAS incorporating 293,723 individuals of European descent, and a replication cohort of 111,349 individuals from the UK Biobank (11). Throughout all analyses, we defined education in the same way as in the original GWAS analysis, in which data from 65 studies were harmonized against the International Standard Classification of Education 1997 classification system (11). A total of 74 SNPs were reported as being associated with EA at the genome-wide significance level (P < 5 × 10⁻⁸) (11). To ensure that all the IVs are not in linkage disequilibrium (LD) with each other, we assessed correlation LD between all the selected SNPs in the European subset of 1,000 Genomes (phase 3) via LDlink (16). When the correlation coefficient between SNPs was high (r2 > 0.05), we discarded the SNP with the larger P value (17). A total of six SNPs (rs13402908, rs4500960, rs4851251, rs2245901, rs148734725, and rs324886) were removed after LD assessment and 68 SNPs were left as IVs for further analysis.
Summary-level data were extracted from the Genetic Investigation of ANthropometric Traits (GIANT) consortium (n = 322,154) for the BMI (12), from the Diabetes Genetics Replication and Meta-analysis (DIAGRAM) consortium (n = 159,208) for T2D (13), and from the Coronary Artery Disease Genome-wide Replication and Meta-analysis (CARDIoGRAM) plus the Coronary Artery Disease (C4D) Genetics (CARDIoGRAMplusC4D) consortium (n = 184,305) for CAD (14). The BMI (measured or self-reported weight in kilogram per height in meters squared), a measure commonly used to assess adiposity, was adjusted for age, age squared, and any necessary study-specific covariates in a linear regression model (12). Case subjects with T2D were diagnosed according to the 1999 World Health Organization criteria of fasting plasma glucose concentration ≥ 7.0 mmol/L or 2-h plasma glucose concentration ≥ 11.1 mmol/L, by a report of diabetes medication use, or based on medical record review (18). CAD was determined with a broad definition including myocardial infarction, acute coronary syndrome, chronic stable angina, or coronary artery stenosis > 50% (14). When target SNPs were not available in the outcome study, we used proxy SNPs that were in high LD (r2 > 0.8) with the SNPs of interest. Two variants (rs1871109 and rs1606974) were discarded in the analyses for T2D and CAD as no suitable proxy SNP was found (Supplementary Table 1), and another 10 (rs10061788, rs112634398, rs12646808, rs12772375, rs165633, rs17824247, rs2610986, rs35761247, rs62259535, and rs8005528) were removed in the analysis for adiposity (Supplementary Table 2).
Ethical review and informed consent had been obtained in all of the original studies.
Statistical Analysis
The estimates of the causal effect of EA on the outcomes were analyzed using the inverse variance–weighted (IVW) method, median-based method, and MR-Egger for multiple genetic variants. The IVW method was used to provide a combined estimate of the causal estimate from each SNP (19). Median-based methods, including the simple median-based method and the weighted median-based method, have greater robustness to individual genetics with strongly outlying causal estimates compared with IVW and MR-Egger methods, which give a consistent estimate of the causal effect when at least 50% of the genetic variants are valid IVs (20). The MR-Egger regression test was used to evaluate the directional pleiotropy and investigate the null causal hypothesis under the InSIDE (Instrument Strength Independent of Direct Effect) assumption (15). In this study, the MR-Egger regression (15) and the Cochran's Q test (21) were used as sensitivity analyses to investigate the presence of pleiotropy. All statistical analyses were performed using R v3.5.3 (the R Foundation) and the related package (Mendelian Randomization) (22). The Bonferroni-adjusted level of statistical significance for the BMI, T2D, and CAD was P < 0.017 (0.05/3 = 0.017) to account for three tests.
Results
Education and BMI
A total of 56 IVs were used in the MR analysis after LD assessment and data availability check. Standard IVW MR analysis showed that 1 year longer education was associated with a reduction in the BMI (β −0.17 [95% CI −0.23, −0.10], P = 8.85 × 10⁻⁷) at the Bonferroni adjusted level of significance (P < 0.017; Table 1). The intercept term estimated for the BMI from MR-Egger regression did not differ from 0 (intercept estimate −0.003, 95% CI −0.001 to 0.004, P = 0.34), suggesting that individual SNP heterogeneity was largely balanced (Table 1).
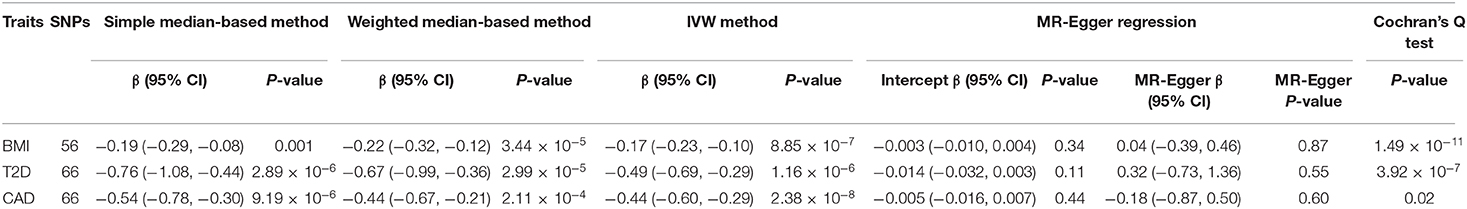
Table 1. MR analyses of the causal effect of EA on BMI, T2D, and CAD.
Furthermore, the simple median–based method and the weighted median–based method were also used to estimate the causal effect of EA on the BMI and further proved the significant effects on adiposity, supporting the robustness of our findings (Table 1).
Education and T2D
The IVW method using the 66 IVs demonstrated a causal effect of EA on T2D, with 1-year increase in EA causing a 39% reduction in the odds of having T2D (OR 0.61 [95% CI 0.50, 0.75], P = 1.16 × 10⁻⁶) (Figure 1). There was moderate evidence of heterogeneity to suggest the presence of horizontal pleiotropy, with a Cochran's Q test P-value of 3.92 × 10⁻⁷. MR-Egger regression analysis did not provide evidence of directional horizontal pleiotropy (intercept estimate −0.014, 95% CI −0.032 to 0.003, P = 0.11) (Table 1). The sensitivity analyses using the simple median–based method and the weighted median–based method also demonstrated similar causal effects, with additional EA associated with the reduction in the odds of having T2D (β −0.76 [95% CI −1.08, −0.44], P = 2.89 × 10⁻⁶ and β −0.67 [95% CI −0.99, −0.36], P = 2.99 × 10⁻⁵, respectively) (Table 1).
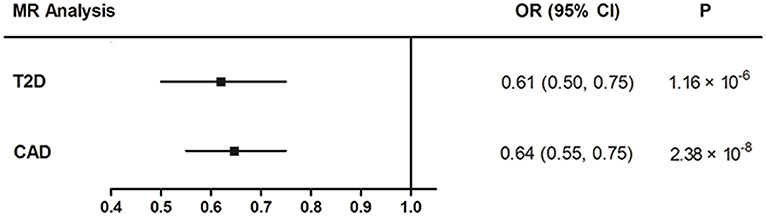
Figure 1. MR estimated effects of EA on T2D and CAD. OR, odds ratio; 95% CI, 95% confidence interval.
Education and CAD
Similarly, the IVW MR result showed that each additional year in EA was associated with a 36% reduction in the odds of having CAD (OR 0.64 [95% CI 0.55, 0.75], P = 2.38 × 10⁻⁸) (Figure 1). The intercept term estimated from MR-Egger regression was centered at the origin with a CI including the null, showing that the observed results were not influenced by pleiotropy (Table 1). The simple median–based method and the weighted median–based method both showed consistent results with that of the IVW method (Table 1).
Discussion
In the use of MR analysis, we found that longer EA was causally associated with the decreased odds of having cardiometabolic diseases, which is consistent with the traditional observational studies showing that socioeconomic status was associated with obesity, T2D, CVD, and even life expectancy (4, 23–27).
The MR method has been widely adopted to assess the causality. In the current study, we selected the commonly used education-associated SNPs as IVs and only kept the independent SNPs after LD pruning. The MR-Egger regression results showed that our findings were not being influenced by pleiotropy. Our findings may provide additional evidence for the causal role of EA on adiposity, T2D, and CAD since the influence of traditional confounding factors in observational studies is minimized. Limited evidence of MR analysis on education has been reported, especially for cardiometabolic diseases. An MR study showed a negative causal effect of education on the BMI using the same IVs as in our study; however, the sample size is too small (N = 2,011) (7). The recent findings used the MR method to demonstrate a strong inverse genetic correlation between EA and CAD risk, as well as the BMI, smoking, and blood pressure, but not T2D (9, 10), while our current study used the widely accepted IVs for EA and the updated summary data from GWAS reports to demonstrate the causal effect of EA on the BMI and CAD, and also revealed its significant association with T2D (P = 1.16 × 10⁻⁶). In addition, the sensitivity analyses, including IVW the method, the simple median–based method, and the weighted median–based method, all showed consistent causal effects, supporting the robustness of our findings.
Even for a behavioral phenotype like EA that is mostly environmentally determined, a well-powered GWAS identifies replicable associated genetic variants that suggest biologically relevant pathways. The IVs used in the study are disproportionately found in genomic regions regulating gene expression in the fetal brain, and the candidate genes are preferentially expressed in neural tissue, especially during the prenatal period, and enriched for biological pathways involved in neural development (11). Because EA is measured in large numbers of individuals, it will be useful as a proxy phenotype in efforts to characterize the genetic influences of related phenotypes, including cognition and neuropsychiatric disease. Moreover, cognition and brain function have been reported to be associated with cardiometabolic diseases (28–30).
Our study has several important strengths. First, the causal effect revealed by the MR method will not be influenced by the confounding factors, which is a major limitation of the observational studies. Second, using the large and updated GWAS summary data, our study could have sufficient power to assess the potential causal effects.
There are also some limitations in our study. First, the causal associations between EA and adiposity, T2D, and CAD were consistent in IVW and median-based methods, but the result from MR-Egger was less compelling, suggesting that IVW estimates may be biased by other confounding factors. However, we note that MR-Egger is generally considered as only one of the sensitivity analyses used to assess the validity of MR findings (20). Second, majority of the samples in our study were of European origin from high income countries, which would bring bias due to population stratification; we still need further evidence to assess the relationship in additional countries with different economic status and across additional ancestral backgrounds. Third, it is hard to reach the conclusion that simply increasing education would help people lower their risk of cardiovascular diseases, since little is known about the underlying mechanism of the genetic effects.
In conclusion, our MR results demonstrated the causal effect of longer education on the decreased odds of having cardiometabolic diseases. However, the findings may need further replications in other large, prospective studies.
Data Availability Statement
Publicly available datasets were analyzed in this study. This data can be found here: the Genetic Investigation of ANthropometric Traits (GIANT) consortium, the Diabetes Genetics Replication and Meta-analysis (DIAGRAM) consortium, and the Coronary Artery Disease Genome-wide Replication and Meta-analysis (CARDIoGRAM) plus the Coronary Artery Disease (C4D) Genetics (CARDIoGRAMplusC4D) consortium.
Ethics Statement
All data used are publicly available. Ethical review and informed consent had been obtained in all of the original studies.
Author Contributions
BC and MC designed the study and revised the manuscript critically. MC analyzed data and wrote the draft of the manuscript. All authors gave final approval of the version to be published.
Funding
This study was supported by National Key R&D Program of China (Nos. 2018YFC1314802, 2016YFC1305500), the National Natural Science Foundation of China (Nos. 81670799, 81570707, 81702642), and Shanghai Sailing Program (No. 16YF1409800).
Conflict of Interest
The authors declare that the research was conducted in the absence of any commercial or financial relationships that could be construed as a potential conflict of interest.
Supplementary Material
The Supplementary Material for this article can be found online at: https://www.frontiersin.org/articles/10.3389/fpubh.2020.00112/full#supplementary-material
References
1. Veronesi G, Tunstall-Pedoe H, Ferrario MM, Kee F, Kuulasmaa K, Chambless LE, et al. Combined effect of educational status and cardiovascular risk factors on the incidence of coronary heart disease and stroke in European cohorts: implications for prevention. Eur J Prev Cardiol. (2017) 24:437–45. doi: 10.1177/2047487316679521
2. Roth GA, Huffman MD, Moran AE, Feigin V, Mensah GA, Naghavi M, et al. Global and regional patterns in cardiovascular mortality from 1990 to 2013. Circulation. (2015) 132:1667–78. doi: 10.1161/CIRCULATIONAHA.114.008720
3. Stringhini S, Carmeli C, Jokela M, Avendano M, Muennig P, Guida F, et al. Socioeconomic status and the 25 x 25 risk factors as determinants of premature mortality: a multicohort study and meta-analysis of 1.7 million men and women. Lancet. (2017) 389:1229–37. doi: 10.1016/S0140-6736(16)32380-7
4. Rosengren A, Smyth A, Rangarajan S, Ramasundarahettige C, Bangdiwala SI, AlHabib KF, et al. Socioeconomic status and risk of cardiovascular disease in 20 low-income, middle-income, and high-income countries: the Prospective Urban Rural Epidemiologic (PURE) study. Lancet Glob Health. (2019) 7:e748–60. doi: 10.1016/S2214-109X(19)30045-2
5. Smith GD, Ebrahim S. 'Mendelian randomization': can genetic epidemiology contribute to understanding environmental determinants of disease? Int J Epidemiol. (2003) 32:1–22. doi: 10.1093/ije/dyg070
6. Cuellar-Partida G, Lu Y, Kho PF, Hewitt AW, Wichmann HE, Yazar S, et al. Assessing the genetic predisposition of education on myopia: a mendelian randomization study. Genet Epidemiol. (2016) 40:66–72. doi: 10.1002/gepi.21936
7. Bockerman P, Viinikainen J, Pulkki-Raback L, Hakulinen C, Pitkanen N, Lehtimaki T, et al. Does higher education protect against obesity? Evidence using Mendelian randomization. Prev Med. (2017) 101:195–8. doi: 10.1016/j.ypmed.2017.06.015
8. Gage SH, Bowden J, Davey Smith G, Munafo MR. Investigating causality in associations between education and smoking: a two-sample Mendelian randomization study. Int J Epidemiol. (2018) 47:1131–40. doi: 10.1093/ije/dyy131
9. Tillmann T, Vaucher J, Okbay A, Pikhart H, Peasey A, Kubinova R, et al. Education and coronary heart disease: mendelian randomisation study. BMJ. (2017) 358:j3542. doi: 10.1136/bmj.j3542
10. Carter AR, Gill D, Davies NM, Taylor AE, Tillmann T, Vaucher J, et al. Understanding the consequences of education inequality on cardiovascular disease: mendelian randomisation study. BMJ. (2019) 365:l1855. doi: 10.1136/bmj.l1855
11. Okbay A, Beauchamp JP, Fontana MA, Lee JJ, Pers TH, Rietveld CA, et al. Genome-wide association study identifies 74 loci associated with educational attainment. Nature. (2016) 533:539–42. doi: 10.1038/nature17671
12. Locke AE, Kahali B, Berndt SI, Justice AE, Pers TH, Day FR, et al. Genetic studies of body mass index yield new insights for obesity biology. Nature. (2015) 518:197–206. doi: 10.1038/nature14177
13. Scott RA, Scott LJ, Magi R, Marullo L, Gaulton KJ, Kaakinen M, et al. An expanded genome-wide association study of type 2 diabetes in Europeans. Diabetes. (2017) 66:2888–902. doi: 10.2337/db16-1253
14. Nikpay M, Goel A, Won HH, Hall LM, Willenborg C, Kanoni S, et al. A comprehensive 1,000 Genomes-based genome-wide association meta-analysis of coronary artery disease. Nat Genet. (2015) 47:1121–30. doi: 10.1038/ng.3396
15. Bowden J, Davey Smith G, Burgess S. Mendelian randomization with invalid instruments: effect estimation and bias detection through Egger regression. Int J Epidemiol. (2015) 44:512–25. doi: 10.1093/ije/dyv080
16. Machiela MJ, Chanock SJ. LDlink: a web-based application for exploring population-specific haplotype structure and linking correlated alleles of possible functional variants. Bioinformatics. (2015) 31:3555–7. doi: 10.1093/bioinformatics/btv402
17. Lawlor DA, Harbord RM, Sterne JA, Timpson N, Davey Smith G. Mendelian randomization: using genes as instruments for making causal inferences in epidemiology. Stat Med. (2008) 27:1133–63. doi: 10.1002/sim.3034
18. Scott RA, Lagou V, Welch RP, Wheeler E, Montasser ME, Luan J, et al. Large-scale association analyses identify new loci influencing glycemic traits and provide insight into the underlying biological pathways. Nat Genet. (2012) 44:991–1005. doi: 10.1038/ng.2385
19. Burgess S, Butterworth A, Thompson SG. Mendelian randomization analysis with multiple genetic variants using summarized data. Genet Epidemiol. (2013) 37:658–65. doi: 10.1002/gepi.21758
20. Bowden J, Davey Smith G, Haycock PC, Burgess S. Consistent estimation in mendelian randomization with some invalid instruments using a weighted Median estimator. Genet Epidemiol. (2016) 40:304–14. doi: 10.1002/gepi.21965
21. Greco MF, Minelli C, Sheehan NA, Thompson JR. Detecting pleiotropy in Mendelian randomisation studies with summary data and a continuous outcome. Stat Med. (2015) 34:2926–40. doi: 10.1002/sim.6522
22. Yavorska OO, Burgess S. Mendelian Randomization: an R package for performing Mendelian randomization analyses using summarized data. Int J Epidemiol. (2017) 46:1734–9. doi: 10.1093/ije/dyx034
23. Murakami K, Ohkubo T, Hashimoto H. Distinct association between educational attainment and overweight/obesity in unmarried and married women: evidence from a population-based study in Japan. BMC Public Health. (2017) 17:903. doi: 10.1186/s12889-017-4912-5
24. Bellou V, Belbasis L, Tzoulaki I, Evangelou E. Risk factors for type 2 diabetes mellitus: an exposure-wide umbrella review of meta-analyses. PLoS ONE. (2018) 13:e0194127. doi: 10.1371/journal.pone.0194127
25. Wu H, Lau ES, Kong AP, Ma RC, Ozaki R, Cheung KK, et al. Association between educational level and cardiovascular disease and all-cause mortality in patients with type 2 diabetes: a prospective study in the Joint Asia Diabetes Evaluation Program. Clin Epidemiol. (2018) 10:1561–71. doi: 10.2147/CLEP.S177437
26. Stephens AS, Gupta L, Thackway S, Broome RA. Socioeconomic, remoteness and sex differences in life expectancy in New South Wales, Australia, 2001-2012: a population-based study. BMJ Open. (2017) 7:e013227. doi: 10.1136/bmjopen-2016-013227
27. Zeng Y, Wu J, Han Y, Chen F, Chen L, Yang S, et al. Educational disparities in the associations between self-monitoring of blood glucose and glycemic control in type 2 diabetes patients in Xiamen, China. J Diabetes. (2018) 10:715–23. doi: 10.1111/1753-0407.12651
28. Agusti A, Garcia-Pardo MP, Lopez-Almela I, Campillo I, Maes M, Romani-Perez M, et al. Interplay between the gut-brain axis, obesity and cognitive function. Front Neurosci. (2018) 12:155. doi: 10.3389/fnins.2018.00155
29. Macpherson H, Formica M, Harris E, Daly RM. Brain functional alterations in Type 2 Diabetes - A systematic review of fMRI studies. Front Neuroendocrinol. (2017) 47:34–46. doi: 10.1016/j.yfrne.2017.07.001
Keywords: Mendelian randomization, educational attainment, adiposity, type 2 diabetes, coronary artery disease
Citation: Cao M and Cui B (2020) Association of Educational Attainment With Adiposity, Type 2 Diabetes, and Coronary Artery Diseases: A Mendelian Randomization Study. Front. Public Health 8:112. doi: 10.3389/fpubh.2020.00112
Received: 09 January 2020; Accepted: 19 March 2020;
Published: 22 April 2020.
Edited by:
Bryan Bassig, National Institutes of Health (NIH), United StatesReviewed by:
Giridhara R. Babu, Public Health Foundation of India, IndiaBruno Oliveira, Federal University of Rio de Janeiro, Brazil
Copyright © 2020 Cao and Cui. This is an open-access article distributed under the terms of the Creative Commons Attribution License (CC BY). The use, distribution or reproduction in other forums is permitted, provided the original author(s) and the copyright owner(s) are credited and that the original publication in this journal is cited, in accordance with accepted academic practice. No use, distribution or reproduction is permitted which does not comply with these terms.
*Correspondence: Bin Cui, cb11302@rjh.com.cn