 Huanhuan Zhao
 Xiaoyu Zhang1,2
- 1Institute of Intelligent Machines, Hefei Institutes of Physical Science, Chinese Academy of Sciences, Hefei, China
- 2Science Island Branch of Graduate School, University of Science and Technology of China, Hefei, China
- 3School of Computer and Information Engineering, Chuzhou University, Chuzhou, China
- 4Institute of Health Management, Chinese People's Liberation Army (PLA) General Hospital, Beijing, China
Hypertension is a widespread chronic disease. Risk prediction of hypertension is an intervention that contributes to the early prevention and management of hypertension. The implementation of such intervention requires an effective and easy-to-implement hypertension risk prediction model. This study evaluated and compared the performance of four machine learning algorithms on predicting the risk of hypertension based on easy-to-collect risk factors. A dataset of 29,700 samples collected through a physical examination was used for model training and testing. Firstly, we identified easy-to-collect risk factors of hypertension, through univariate logistic regression analysis. Then, based on the selected features, 10-fold cross-validation was utilized to optimize four models, random forest (RF), CatBoost, MLP neural network and logistic regression (LR), to find the best hyper-parameters on the training set. Finally, the performance of models was evaluated by AUC, accuracy, sensitivity and specificity on the test set. The experimental results showed that the RF model outperformed the other three models, and achieved an AUC of 0.92, an accuracy of 0.82, a sensitivity of 0.83 and a specificity of 0.81. In addition, Body Mass Index (BMI), age, family history and waist circumference (WC) are the four primary risk factors of hypertension. These findings reveal that it is feasible to use machine learning algorithms, especially RF, to predict hypertension risk without clinical or genetic data. The technique can provide a non-invasive and economical way for the prevention and management of hypertension in a large population.
Introduction
The expert system can learn medical knowledge and expert experience, and finally simulate expert diagnosis and treatment ideas and draw conclusions, which can help diagnose and analyze human diseases (1). The management of human diseases urgently needs an expert system to assist in real-time diagnosis and personalized prevention or treatment guidance. With the development of artificial intelligence (AI) and fuzzy logic, the effectiveness of expert systems in the medical field has been widely reported (2–6). As a core technology of AI, machine learning is the foundation of expert systems (7). Supervised machine learning algorithms have been used in traditional disease risk prediction models to improve the accuracy of classification (8).
Hypertension is a widespread cardiovascular disease (9, 10), which has been the first risk factor of death and the third risk factor of the economic burden (11). Moreover, most of the occurrence and development of hypertension are symptomless. The continuous rise of blood pressure in hypertension patients usually has complications, such as arteriosclerosis, myocardial infarction, and stroke (12, 13). Luckily, previous studies consistently indicated that the early stage of lifestyle modification can prevent and control the development of hypertension (14). Therefore, it is critical to access the individuals' risk of hypertension and to screen hypertension early. The hypertension risk prediction model can identify high-risk groups and screen out hypertension patients at an early stage. Individuals can cease the unhealthy behaviors to prevent and control the management of hypertension, with the early warning from lifestyle risk factor indicators (15–18). Therefore, identifying lifestyle risk factors of hypertension and early identification of hypertension play an important role in the prevention and management of hypertension.
Existing hypertension risk prediction approaches can be roughly classified into queue-based and cross-sectional data-based. The former focuses on obtaining the absolute risk of hypertension and requires long-time longitudinal data, which limits the application of modeling methods. In contrast, the latter one employs features extracted from cross-sectional data to evaluate the current risk of hypertension and screen out hypertension, which is also of great value in the prevention and management of hypertension. Probably the most related investigation in hypertension has recently been focusing on the current risk prediction by analyzing clinical indicators or genetic information. Ture et al. (19) constructed different hypertension prediction models based on clinical indicators. The performance of neural networks is superior to decision trees and traditional statistical algorithms. Elizabeth Held (20) generated a hypertension prediction model by using LR based on age, sex, smoke, age*sex and genetic information. With the help of the K-means algorithm to avoid sample imbalance to obtain balanced experimental data, Wang et al. (21) utilized a neural network to establish a hypertension prediction model. A Swedish hypertension risk model (22) employed LR to study heart rate, memory and metabolic characteristics and their association with the prevalence of hypertension. In a multi-ethnic study, Lopez-Martinez F et al. (23) utilized LR to build a hypertension prediction model based on the classification values of each risk factor, and the performance of the model was better than random guessing.
Extensive research efforts have been dedicated to the issue of hypertension risk prediction. However, there are still great difficulties in applying these models in practical applications in a large population because of the complexity of predictors' collection and the unsatisfied predictive ability of these models. Firstly, the predictors of these current models all contain biochemical indicators or genetic information, which requires a complex measurement and cannot be achieved in some situations, such as rural areas or some community health service centers. Secondly, compared with models based on biochemical indicators or genetic information, the model based on lifestyle risk factors can effectively identify the risk level of hypertension and contribute to targeted intervention. Thirdly, It is urgent to develop an effective model using only easy-to-collect risk factors (no biochemical and genetic information) to improve predictive performance. Furthermore, the poor interpretability of previous prediction models limits their practical application.
The objectives of this study were to evaluate and compare the performance of four different machine learning algorithms in predicting the risk of developing hypertension from easy-to-collect information. And choose the best machine learning algorithm to develop a risk prediction model of hypertension based on easy-to-collect information. The four machine learning algorithms used in this study were RF, CatBoost, MLP neural network and LR.
Materials and Methods
Material
The data set used to construct the model in this paper comes from a physical examination center of a hospital in Beijing in China. A total of 29,750 cases of complete data were collected. Among them, there are 10,650 cases of hypertension and 19,100 cases of normal. Most of the normal cases are between 18 and 70 years old, and most hypertension cases are between 20 and 75 years old. To ensure a similar age distribution between hypertension and normal cases, the age of samples is further restricted between 20 and 70 years old. For the selected 10,625 hypertension cases and 19,080 normal controls, we took the following measures to clean up the data: eliminate the subjects with significant outliers (more than or equal to 3 times four Quantile intervals). After screening and data cleaning of inclusion and exclusion criteria, 10,623 cases of hypertension and 19,077 cases of normal controls were finally included in this study. We promise to keep the patients' information strictly confidential. According to the Helsinki Declaration, the study was approved by the Ethics Committee of the Hefei Institute of Physical Science, Chinese Academy of Sciences (No. Y-2018-29).
The anthropometric information and blood pressure of the subjects were measured by professional medical workers using standard measurement methods. According to the diagnostic criteria of the “Chinese Hypertension Prevention Guide,” hypertension is defined as having been diagnosed as hypertension in the hospital or the average systolic blood pressure> = 140 mmHg or diastolic blood pressure> = 90 mmHg in this physical examination. The anthropometric indicators mainly include height, weight and WC. During the measurement, the subjects were required to wear light clothes and maintain a correct standing posture. BMI is calculated according to the standard formula [BMI = weight/height2 (kg/m2)]. WC is measured by using the tape around the subject for one circle at 1 cm above the navel (24). Professional medical staff used standardized epidemiological questionnaires to complete interviews of subjects for collecting basic demographic and lifestyle information. Family history refers to the hypertension status of one's parents. Smoke is defined as smoking every day and has been smoking for more than 6 months (25). Drink refers to drinking at least once a week and has been drinking for more than 6 months (26). Occupation refers to one's occupation type. The physical activity presents physical activity status, frequent physical activity refers to 30 min of moderate-intensity exercise performed at least three times a week (27). A healthy diet is defined as the total score of the healthy eating index (HEI) >51 (28). Psychological pressure refers to the total score of the Perceived Stress Scale (PSS) > = 43 (29). Table 1 shows the details of these variables.
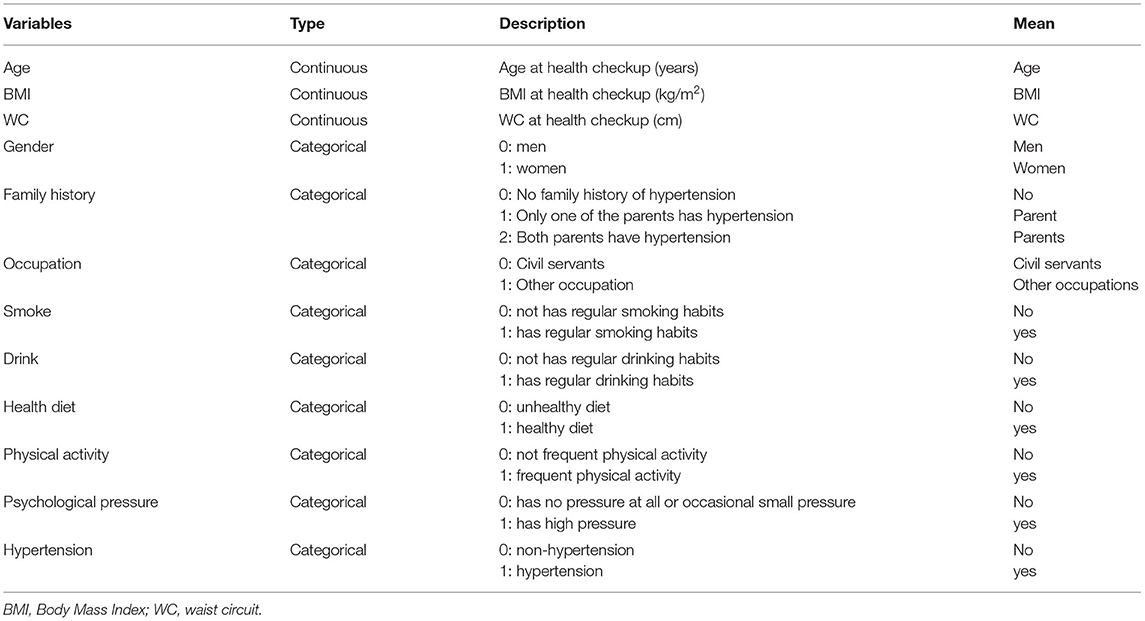
Table 1. Variable description information.
To verify the performance of the four machine learning algorithms on our data, we randomly divided the dataset into a training set and a test set according to ratio 4:1. There is no significant difference in each variable between the training set and the test set. The main characteristics of the training set and the test set are shown in Table 2.

Table 2. The main characteristics of the training set and test set.
Feature Selection
The variables used to construct hypertension risk prediction model must meet the following two conditions: (1) it is an easy-to-collect variable, including basic demographic information, anthropometric information, or lifestyle information; (2) It is a variable statistically significant to hypertension in univariate logistic regression analysis (p < 0.05) (30).
Machine Learning Algorithms
In this study, we used four machine learning techniques to develop four models based on easy-to-collect variables to predict the risk of hypertension: RF, CatBoost, MLP neural network and LR.
RF
RF is an ensemble machine learning method with decision trees as the base classifier (31). Each decision tree is built based on various sub-datasets and features. Therefore, each decision tree is different and independent, and finally, the classification result from the voting results of multiple decision trees is obtained. This approach allows reducing variance in decision trees (32). Thus, RF can analyze the classification characteristics with complex interactions, and it is very robust to noisy data and data with missing values. Meanwhile, the learning speed of RF is also very fast.
CatBoost
CatBoost is a new ensemble algorithm based on decision tree gradient boosting (33). CatBoost uses combined categorical features, which can take advantage of the connections between features and greatly enrich the feature dimension. Therefore, CatBoost is intrinsically more efficient and has better predictive performance compared with the traditional boosting algorithm in the case of categorical features.
MLP Neural Network
As a non-linear mapping model, MLP neural network is flexible and effective in modeling complex relationships between inputs and outputs (34). It includes an input layer, a hidden layer, and an output layer. Each layer is fully connected to the previous layer. The MLP neural network is trained according to the error backpropagation algorithm (35). It performs error analysis on the training and expected results each time, which helps change the weights and thresholds to obtain a model that the outputs are consistent with the expected results step by step. The process can be terminated when the error rate reaches sufficiently small.
LR
LR is a generalized linear regression analysis algorithm that can explore the relationship between a categorical dependent variable and several independent variables (30) and connect the values of the independent variables with the probability of the event defined by the dependent variable. The LR algorithm assumes that the predicted value is the linear addition of all products of independent variables and corresponding coefficients.
Hyper-Parameters Tuning and Model Development
To evaluate the performance of four machine learning models, we randomly divided the data into a training set and a test set according to ratio 4:1. For the four machine learning techniques, the training set was used to adjust the model parameters and construct the model, and the test set was used to evaluate the performance of the model. The training set was divided into a training subset and a verification set according to ratio 9:1, AUC of 10-fold cross-validation was used as the evaluation indicator to adjust the model parameters for constructing the optimal model. The training set was used to fit the model and generate the final model after the optimal parameters were determined. All the algorithms were implemented in Python 2.7.
Evaluation Metrics
The performance of the predictive model is evaluated by ROC (Receiver Operating Curve) curve, accuracy, sensitivity, specificity, and Youden index. Accuracy refers to the ratio of correctly classified samples to the total number of samples. Sensitivity refers to the proportion of positive samples that are predicted to be positive. Specificity refers to the proportion of negative samples that are predicted to be negative. The classification confusion matrix (36) is shown in Table 3.

Table 3. Classification confusion matrix.
Among them, TP is the number of positive samples judged as positive, FN is the number of positive samples judged as negative, FP is the number of negative samples judged as positive, and TN is the number of negative samples judged as negative.
ROC curve is a curve drawn according to a series of different threshold values, with the true positive rate (sensitivity) as the ordinate and the false positive rate (1-specificity) as the abscissa. AUC (Area Under Curve) represents the area under the ROC curve. The value of AUC is equal to the probability that the prediction value is greater for a randomly given positive sample than a randomly given negative sample (37). The calculation formula of AUC is as follows:
In the above formula, TPR stands for true positive rate and FPR stands for false positive rate.
Feature Importance
One weakness of machine learning methods is that the learning process is a black box operation, and the results are poorly interpretable. In this study, we calculated the importance of each feature to improve the interpretability of the model. To calculate the importance of a feature, we repeated the testing process 10 times. In each testing process, we successively permuted the values of each feature in the test set and calculated the corresponding decrease in the AUC. The importance of a feature is measured by the average decrease in the AUC of the test set. The larger the value means the greater the contribution of the feature to the model, that is the greater the importance of the feature.
Results
Selected Features
To select the input features for the prediction model, a univariate logistic regression analysis was utilized separately for 11 easy-to-collect hypertension risk factors on the training set. According to the variable inclusion criteria of statistical significance p-value < 0.05, psychological pressure was excluded (p = 0.097). Finally, 10 variables of age, gender, BMI, WC, family history, occupation, smoke, drink, healthy diet and physical activity were selected as the input features of the model. Table 4 presents the results of the univariate logistic regression analysis.
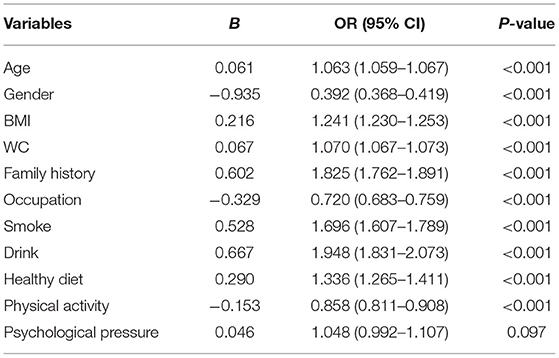
Table 4. Univariate logistical regression analysis for the presence of hypertension.
Model Hyper-Parameters
Based on the 10 selected easy-to-collect risk factors, the training set was used to determine the optimal hyper-parameters for RF, CatBoost, MLP neural network and LR, respectively. The hyper-parameters of each model under optimal performance are shown in Table 5. Default values were set for other unlisted parameters in the four machine learning algorithms.
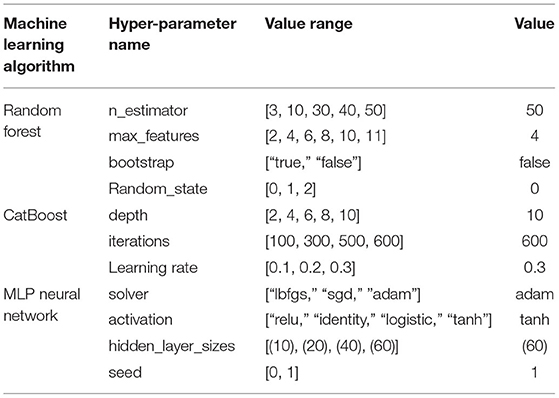
Table 5. Configuration of hyper-parameters in each machine-learning algorithm.
Model Performance
As shown in Table 6, the AUC for the test set on the RF model is the best, which is 0.92, followed by the CatBoost model with an AUC of 0.87, then the MLP neural network with an AUC of 0.78, and the LR model with an AUC of 0.77. The ROC curves on the test set of four models are shown in Figure 1. The RF model outperforms the other three models significantly.

Table 6. The performance of each model when the optimal threshold is selected.
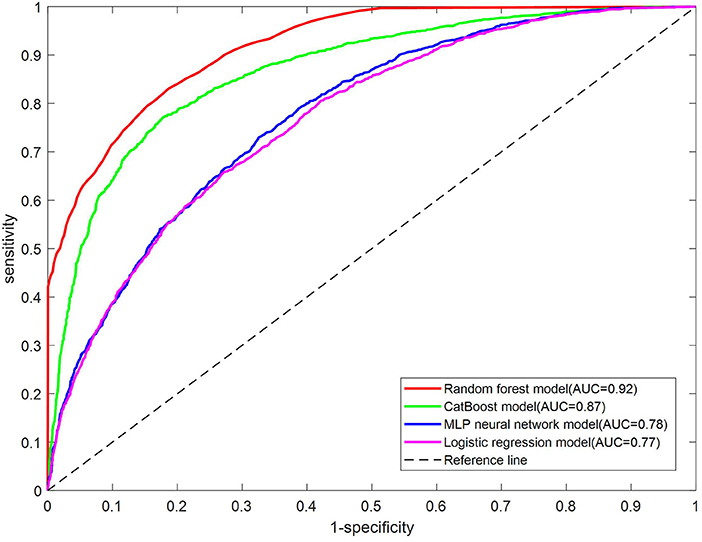
Figure 1. ROC curve for the test set of each model.
Due to the imbalance phenomenon in the dataset, we adjusted the threshold to achieve the maximum Youden index. We obtained the classification confusion matrix after the threshold was determined for each model. Figure 2 shows the classification confusion matrix on the test set of four models. TP, FN, FP and TN for the RF model were 1771,360,712 and 3,097, respectively. The CatBoost model got a TP of 1,643, FN of 488, FP of 677, and TN of 3,132. For MLP neural network model, TP, FN, FP and TN were 1555, 576, 1,240 and 2,569, respectively. And the TP, FN, FP and TN were, respectively 1,402, 729, 1,033 and 2,776 for LR model. The RF model showed the best ability for identifying high-risk groups of hypertension compared with the other three models.

Figure 2. Confusion matrix for the test set of each model. (A) RF model, (B) CatBoost model, (C) MLP neural network model, (D) LR model.
Refer to the accuracy, sensitivity, specificity and Youden index of the test set. As shown in Table 6, the best Youden index for the RF model is achieved (0.64) when the threshold is 0.34. At this time, the accuracy, sensitivity, and specificity for the model are 0.82, 0.83, and 0.81, respectively. The best Youden index for the CatBoost model is reached (0.59) when the threshold is 0.37. At this time, the accuracy, sensitivity, and specificity for the model are 0.81, 0.77 and 0.82, respectively. The best Youden index for the MLP neural network model is obtained (0.40) when the threshold is 0.30. At this time, the accuracy, sensitivity and specificity of the model are 0.69, 0.73 and 0.67, respectively. The best Youden index for the LR model is gotten (0.39) when the threshold is 0.39. At this time, the model got an accuracy of 0.70, a sensitivity of 0.66 and a specificity of 0.73, respectively. The results showed the performance of the RF model was still the best among the four models.
Based on the above results, the RF model performs the best on most evaluation metrics, including AUC, accuracy, sensitivity and Youden index, and achieves a favorable specificity, which was as good as the CatBoost model. Besides, RF was faster than CatBoost (2.24 s vs. 31.47 s). Therefore, RF had the overall best performance.
Feature Importance
We calculated the importance of each feature in the RF model, which achieved the best performance. The order of importance of each feature is shown in Figure 3. The top 4 features in order of importance were BMI, age, family history, and WC. Later, smoke, drink, gender, occupation, healthy diet, and physical activity were the features ranked 5 to 10 in order of importance.

Figure 3. Feature importance ranking for the RF model.
Discussion
Principal Findings
In this study, four machine learning algorithms were evaluated and compared for hypertension risk prediction, based on easy-to-collect risk factors. The risk factors included 4 basic demographic indicators (gender, age, occupation and family history of hypertension), 2 anthropometric indexes (BMI and WC), and 4 lifestyle indicators (healthy diet, smoke, drink and physical activity). The results indicated that, compared with the LR model (AUC: 0.77), the performance of the three non-linear models was better. Thus, there is a non-linear relationship between the independent variables and the dependent variable. Among the three non-linear machine learning models, the RF model outperformed CatBoost and MLP neural network models and got an AUC of 0.92 and an accuracy of 0.82.
RF is a bagging ensemble algorithm based on multiple decision trees. The random selection of samples and features is further introduced in the training process. In the RF algorithm, there is no dependence between weak learners, and parallel operation can be achieved. All these attributes contribute to the excellent performance of RF in many classification studies (38, 39). CatBoost is an ensemble algorithm based on boosting, which is usually expert in dealing with categorical variables. As for the MLP neural network algorithm, it is more often utilized for processing unstructured data and data with complex structures. Thus, our sample data happens to meet the structured data and categorical features, which meet the demands of the RF algorithm and CatBoost algorithm. As expected, the two models have shown favorable performance in our data. In addition, the RF model outperforms CatBoost model (AUC: 0.92 vs. 0.87; accuracy: 0.82 vs. 0.80). Therefore, we believe RF is more reliable than CatBoost in terms of our data. Our results are consistent with a study of classification performance (38), in which the RF algorithm performed the best among the 179 classification algorithms on 121 UCI datasets.
Compared with statistical methods, the performance of the model built by the machine learning algorithm is better, but the disadvantage is the poor interpretability of the model. The process of machine learning to build a model is to learn the potential rules of input and output of training data, so it can fit complex non-linear relationships, and then get a trained model and predict new input data. However, the rule of the training data is unknown, so the process of machine learning is often called a black-box operation. To increase the transparency of the model and provide health education to residents in practical applications, we measure the effect of each feature on the performance of the RF model by calculating the average value of AUC reduction caused by permuting the values of each feature and explore the causal relationship between independent variables and dependent variable.
BMI, age, family history, and WC were the top four important features. Among them, BMI and age were the top two features. Wiewiora et al. (40) and Szpalski et al. (41) showed that obesity increased cardiac output and resistance of peripheral blood vessels, resulting in increased blood pressure. Among the many indicators of obesity, BMI was most closely related to hypertension (42). Mariunas et al. (43, 44) showed that with the increase of age, the elasticity of blood vessels became poor. To supply the blood demand of the whole body, blood pressure would rise. Therefore, age was an important risk factor for hypertension. The risk factors that followed were family history of hypertension and WC, A large population study (45) showed that people with a family history of hypertension had 1.79 times higher risk of hypertension than those without a family history of hypertension in China. The blood pressure level and prevalence of hypertension in those whose parents both had hypertension were significantly higher than those whose father or mother had hypertension. The prevalence of hypertension in those whose parents were both hypertension was about twice that of those without a family history of hypertension. These results are consistent with this study. WC was an important indicator of central obesity. Previous studies (46, 47) indicated that the risk of hypertension in centrally obese patients was much higher than that of the normal population. Therefore, WC was also an important risk factor for hypertension. Our results showed that the significance of WC on the incidence of hypertension was still great even after considering the effect of BMI on the incidence of hypertension. This was consistent with previous studies (42, 48). Smoke and drink were the next two important risk factors. Then, in order of importance, the risk factors were gender, occupation, healthy diet, and physical activity.
Although limited by the complexity of modern machine learning algorithms, we still cannot intuitively understand the relationship between independent and dependent variables in the model. However, the importance ranking of features indicated that the underlying rules in the data set learned by the RF algorithm were consistent with the findings of previous studies, which suggested that older and obese people had the highest risk of hypertension, and other unhealthy lifestyles would increase the risk of hypertension.
The RF model constructed in this study has made significant progress compared to similar previous hypertension prediction models. As shown in Table 7, we reviewed previous studies of hypertension prediction models. Ture et al. (19) built a hypertension prediction model based on lipoprotein (a), triglyceride, uric acid, total cholesterol and other biochemical indicators using the neural network, the calculated AUC of the model was 0.81. LR was used in the Swedish hypertension risk prediction model based on age, gender, BMI, heart rate, glycolipid parameters and other memory elements, the model got an AUC of 0.66 (22). Wang et al. (21) used a neural network to build a hypertension prediction model. The model with 10 hidden layers has the best performance with an AUC of 0.77. A hypertension prediction model based on genetic information, which was constructed using LR, achieved an accuracy of 0.77 (20). Lopez-Martinez et al. (23) utilized LR to construct a hypertension prediction model based on independent risk factors. The prediction model got an AUC of 0.73 and outperformed random guessing. Most models indicated a fair agreement with the final diagnosis for AUC values between 0.7 and 0.8. In this study, the RF model achieved a higher AUC (0.92) compared with the previous models. Studies have indicated that different ethnic populations have different characteristics of hypertension (49, 50), which likely impacts different AUCs for different models. Nevertheless, this study revealed a superior ability of the RF algorithm in distinguishing high-risk and low-risk populations of hypertension.
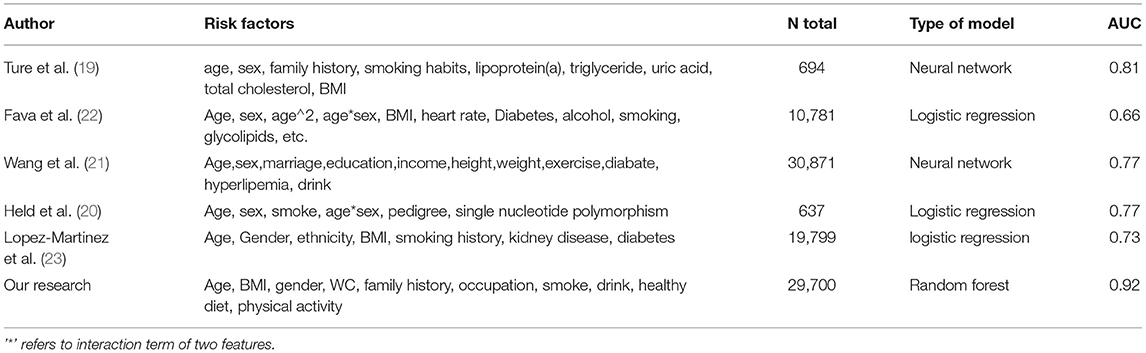
Table 7. Hypertension prediction models comparison.
On the other hand, the input variables of the previous hypertension prediction model all contained biochemical indicators or genetic information. Lipoprotein, triglyceride, uric acid, total cholesterol were required in Ture M's research (19). Although Wang et al. (21, 23) used a questionnaire to obtain predictors, the information about dyslipidemia and diabetes were required in Wang's research (21) and the information on kidney disease and diabetes were needed in Lopez-Martinez' s research (23). Genetic information was required when using Held E's model (20). Glucose and lipid parameters were the input variables of the model in Fava C's research (22). The acquisition of these variables requires biochemical testing, which makes these models unavailable for residents who cannot carry out biochemical testing on time. Thus, these models are not suitable and practical for hypertension prediction in a large population, which limits the application of these models in the prevention and management of hypertension. Different from previous prediction models constructed in other populations, the input variables of the RF model in this study are non-invasive and can be easily collected, which facilitates the application of the model.
Limitations of This Study
This study still has several limitations. Firstly, the data set used for model construction in the study was derived from cross-sectional data of physical examination. Although the model cannot predict the absolute risk of hypertension, it can distinguish high-risk and low-risk groups of hypertension. Secondly, the data used in the study were collected from a local hospital, which means it can only represent the characteristics of hypertension among residents in this specific area. Therefore, the generalization of the RF model established in this study to other regions needs further research and confirmation. Lastly, we did not evaluate the effect of all possible lifestyle variables because they were not included in the health examination. Therefore, occupation was the only new risk factor for hypertension identified in this study. Further research needs to incorporate more lifestyle information.
Conclusions
In this study, we evaluated and compared four machine learning algorithms in predicting hypertension risk based on easy-to-collect risk factors. Dataset was health checkup information collected through a physical examination in a hospital in Beijing. Results showed that the RF model outperformed the other three machine learning methods, and it performed an AUC of 0.92, an accuracy of 0.82, a sensitivity of 0.83, and a specificity of 0.81. The results revealed that the RF model could distinguish high-risk and low-risk populations of hypertension based on easy-to-collect variables. Thus, the RF model has a great application value in the prevention and management of hypertension.
Data Availability Statement
The raw data supporting the conclusions of this article will be made available by the authors, without undue reservation.
Ethics Statement
The studies involving human participants were reviewed and approved by the Ethics Committee of the Hefei Institute of Physical Science, Chinese Academy of Sciences. The patients/participants provided their written informed consent to participate in this study. Written informed consent was obtained from the individual(s) for the publication of any potentially identifiable images or data included in this article.
Author Contributions
HZ and ZM: conceptualization. LG and ZM: funding acquisition. HZ and YX: investigation. XZ and WW: resources. YS: supervision. HZ: Writing – original draft. ZM: Writing – review & editing. All authors contributed to the article and approved the submitted version.
Funding
This work was supported by the major special project of Anhui Science and Technology Department under Grant 18030801133, and Science and Technology Service Network Initiative under Grant KFJ-STS-ZDTP-079.
Conflict of Interest
The authors declare that the research was conducted in the absence of any commercial or financial relationships that could be construed as a potential conflict of interest.
Publisher's Note
All claims expressed in this article are solely those of the authors and do not necessarily represent those of their affiliated organizations, or those of the publisher, the editors and the reviewers. Any product that may be evaluated in this article, or claim that may be made by its manufacturer, is not guaranteed or endorsed by the publisher.
Acknowledgments
The authors would like to thank all the participants in the survey, as well as the staff from the physical examination center of Chinese PLA General Hospital for their dedicated effort in making this study possible. The corresponding author affirms that he has listed everyone who contributed to the work.
References
1. Das S, Chowdhury SR, Saha H. Accuracy enhancement in a fuzzy expert decision making system through appropriate determination of membership functions and its application in a medical diagnostic decision making system. J Med Syst. (2012) 36:1607–20. doi: 10.1007/s10916-010-9623-8
2. Jiang F, Jiang Y, Zhi H, Dong Y, Li H, Ma S, et al. Artificial intelligence in healthcare: past, present and future. Stroke Vasc Neurol. (2017) 2:230–43. doi: 10.1136/svn-2017-000101
3. Moreira MWL, Rodrigues JJPC, Korotaev V, Al-Muhtadi J, Kumar N. A comprehensive review on smart decision support systems for health care. Ieee Syst J. (2019) 13:3536–45. doi: 10.1109/JSYST.2018.2890121
4. Simjanoska M, Kochev S, Tanevski J, Bogdanova AM, Papa G, Eftimov T. Multi-level information fusion for learning a blood pressure predictive model using sensor data. Inform Fusion. (2020) 58:24–39. doi: 10.1016/j.inffus.2019.12.008
5. Niel O, Bastard P, Boussard C, Hogan J, Kwon T, Deschenes G. Artificial intelligence outperforms experienced nephrologists to assess dry weight in pediatric patients on chronic hemodialysis. Pediatr Nephrol. (2018) 33:1799–803. doi: 10.1007/s00467-018-4015-2
6. Chatterjee S, Das A. A novel systematic approach to diagnose brain tumor using integrated type-II fuzzy logic and ANFIS (adaptive neuro-fuzzy inference system) model. Soft Comp. (2020) 24:11731–54. doi: 10.1007/s00500-019-04635-7
7. Hijazi S, Page A, Kantarci B, Soyata T. Machine learning in cardiac health monitoring and decision support. Computer. (2016) 49:38–48. doi: 10.1109/MC.2016.339
8. Hou C, Zhong X, He P, Xu B, Diao S, Yi F, et al. Predicting breast cancer in chinese women using machine learning techniques: algorithm development. Jmir Med Inform. (2020) 8:e17364. doi: 10.2196/17364
9. Ansah JP, Inn RLH, Ahmad S. An evaluation of the impact of aggressive hypertension, diabetes and smoking cessation management on CVD outcomes at the population level: a dynamic simulation analysis. Bmc Public Health. (2019) 19:1105. doi: 10.1186/s12889-019-7429-2
10. Fernandez-Ruiz I. Systolic and diastolic hypertension independently predict CVD risk. Nat Rev Cardiol. (2019) 16:578–9. doi: 10.1038/s41569-019-0248-4
11. Wu JH, Wei W, Zhang L, Wang J, Damasevicius R, Li J, et al. Risk assessment of hypertension in steel workers based on LVQ and fisher-SVM deep excavation. Ieee Access. (2019) 7:23109–19. doi: 10.1109/ACCESS.2019.2899625
12. Zhang XY, Xu QQ, Guo XL, Jing ZY, Sun L, Li JJ, et al. Catastrophic health expenditure: a comparative study between hypertensive patients with and without complication in rural Shandong, China. Bmc Public Health. (2020) 20:545. doi: 10.1186/s12889-020-08662-0
13. Fihaya FY, Sofiatin Y, Ong PA, Sukandar H, Roesli RMA. Prevalence of hypertension and its complications in Jatinangor 2014. J Hypert. (2015) 33:E35–E. doi: 10.1097/01.hjh.0000469851.39188.36
14. Moraes-Silva IC, Mostarda CT, Silva-Filho AC, Irigoyen MC. Hypertension and exercise training: evidence from clinical studies. Adv Exp Med Biol. (2017) 1000:65–84. doi: 10.1007/978-981-10-4304-8_5
15. Park JE, Shin C, Lee SW. Effect of lifestyle factors on hypertension by constitution type: a large community-based study. Evid Based Complem Altern Med. (2019) 2019:3231628. doi: 10.1155/2019/3231628
16. Nguyen B, Bauman A, Ding D. Association between lifestyle risk factors and incident hypertension among middle-aged and older Australians. Prev Med. (2019) 118:73–80. doi: 10.1016/j.ypmed.2018.10.007
17. Lelong H, Blacher J, Baudry J, Adriouch S, Galan P, Fezeu L, et al. Combination of healthy lifestyle factors on the risk of hypertension in a large cohort of french adults. Nutrients. (2019) 11:1687. doi: 10.3390/nu11071687
18. Guo LQ, Peng C, Xu H, Wilson A, Li PH, Wang H, et al. Age at menarche and prevention of hypertension through lifestyle in young Chinese adult women: result from project ELEFANT. Bmc Womens Health. (2018) 18:182. doi: 10.1186/s12905-018-0677-y
19. Ture M, Kurt I, Kurum AT, Ozdamar K. Comparing classification techniques for predicting essential hypertension. Exp Syst Applic. (2005) 29:583–8. doi: 10.1016/j.eswa.2005.04.014
20. Held E, Cape J, Tintle N. Comparing machine learning and logistic regression methods for predicting hypertension using a combination of gene expression and next-generation sequencing data. BMC Proc. (2016) 10(Suppl. 7):141–5. doi: 10.1186/s12919-016-0020-2
21. Wang AG, An N, Chen GL, Li L, Alterovitz G. Predicting hypertension without measurement: a non-invasive, questionnaire-based approach. Exp Syst Applic. (2015) 42:7601–9. doi: 10.1016/j.eswa.2015.06.012
22. Fava C, Sjogren M, Montagnana M, Danese E, Imgren P, Engstrom G, et al. Prediction of blood pressure changes over time and incidence of hypertension by a genetic risk score in swedes. Hypertension. (2013) 61:E50. doi: 10.1161/HYPERTENSIONAHA.112.202655
23. Lopez-Martinez F, Schwarcz A, Rolando Nunez-Valdez E, Garcia-Diaz V. Machine learning learning classification analysis for a hypertensive population as a function of several risk factors. Exp Syst Applic. (2018) 110:206–15. doi: 10.1016/j.eswa.2018.06.006
24. Goyal A, Gupta Y. A need for the use of a standard protocol for waist circumference measurement across studies. Diab Res Clin Pract. (2020) 161:107908. doi: 10.1016/j.diabres.2019.107908
25. Li XX, Zhao Y, Huang LX, Xu HX, Liu XY, Yang JJ, et al. Effects of smoking and alcohol consumption on lipid profile in male adults in northwest rural China. Public Health. (2018) 157:7–13. doi: 10.1016/j.puhe.2018.01.003
26. Shi L, Shu XO, Li HL, Cai H, Liu QL, Zheng W, et al. Physical activity, smoking, and alcohol consumption in association with incidence of type 2 diabetes among middle-aged and elderly chinese men. PLoS ONE. (2013) 8:e77919. doi: 10.1371/journal.pone.0077919
27. Zhengzhen W, Yu Z. Exercise, physical activity and chronic disease prevention. J Wuhan Inst Phys Educ. (2013) 047:69–75.
28. Kennedy ET, Ohls J, Carlson S, Fleming K. The healthy eating index - design and applications. J Am Diet Assoc. (1995) 95:1103–8. doi: 10.1016/S0002-8223(95)00300-2
29. Cohen S, Kamarck T, Mermelstein R. A global measure of perceived stress. J Health Soc Behav. (1983) 24:385–96. doi: 10.2307/2136404
30. Buya S, Tongkumchum P, Owusu BE. Modelling of land-use change in Thailand using binary logistic regression and multinomial logistic regression. Arab J Geosci. (2020) 13:12. doi: 10.1007/s12517-020-05451-2
32. Dinh A, Miertschin S, Young A, Mohanty SD. A data-driven approach to predicting diabetes and cardiovascular disease with machine learning. BMC Med Inform Decis Mak. (2019) 19:15. doi: 10.1186/s12911-019-0918-5
33. Gupta A, Potty ASR, Ganta D, Mistovich RJ, Penna S, Cady C, et al. Streamlining the the KOOS activities of daily living subscale using machine learning. Orthop J Sports Med. (2020) 8:5. doi: 10.1177/2325967120910447
34. Paitz P, Gokhberg A, Fichtner A. A neural network for noise correlation classification. Geophys J Int. (2018) 212:1468–74. doi: 10.1093/gji/ggx495
35. Ding SF, Su CY, Yu JZ. An optimizing BP neural network algorithm based on genetic algorithm. Artif Intell Rev. (2011) 36:153–62. doi: 10.1007/s10462-011-9208-z
36. Provost F, Kohavi R. Guest editors' introduction: on applied research in machine learning. Mach Learn. (1998) 30:127–32. doi: 10.1023/A:1007442505281
37. Xu X, Zhang Y, Liang Z, Wang M, Ao L, editors. A gene signature for breast cancer prognosis using support vector machine. International Conference on Biomedical Engineering & Informatics. Chongqing (2012).
38. Fernandez-Delgado M, Cernadas E, Barro S, Amorim D. Do we need hundreds of classifiers to solve real world classification problems? J Mach Learn Res. (2014) 15:3133–81.
39. Belgiu M, Dragut L. Random forest in remote sensing: A review of applications and future directions. ISPRS-J Photog Remote Sens. (2016) 114:24–31. doi: 10.1016/j.isprsjprs.2016.01.011
40. Wiewiora M, Krzak A, Twardzik M, Piecuch J. Obesity, blood rheology and angiogenesis. Clin Hemorheol Microc. (2018) 69:339–42. doi: 10.3233/CH-170348
41. Szpalski C, Wetterau M, Cohen O, Patel M, Layliev J, Saadeh PB, et al. Obesity impairs blood vessel formation. Wound Rep Reg. (2011) 19:A56.
42. Zhang M, Zhao Y, Wang G, Zhang H, Ren Y, Wang B, et al. Body mass index and waist circumference combined predicts obesity-related hypertension better than either alone in a rural Chinese population. Sci Rep. (2016) 6:31935. doi: 10.1038/srep31935
43. Mariunas M, Kuzborska Z. The influence of age, gender and pathology to blood vessels arterial pressure and efficiency. J Vibroeng. (2009) 11:262–7.
44. Gunin AG, Petrov VV, Golubtzova NN, Vasilieva OV, Kornilova NK. Age-related changes in angiogenesis in human dermis. Exp Gerontol. (2014) 55:143–51. doi: 10.1016/j.exger.2014.04.010
45. Huang X-b, Chen F, Dai W, Song L, Tu J, Xu J-b, et al. Prevalence and risk factors associated with hypertension in the Chinese Qiang population. Clin Exp Hypert. (2018) 40:427–33. doi: 10.1080/10641963.2017.1392553
46. Al-Sumaih I, Johnston B, Donnelly M, O'Neill C. The relationship between obesity, diabetes, hypertension and vitamin D deficiency among Saudi Arabians aged 15 and over: results from the Saudi health interview survey. BMC Endoc Dis. (2020) 20:81. doi: 10.1186/s12902-020-00562-z
47. Ghosh S, Banerjee A, Ray N, Wood PW, Padwal R, editors. Continuous blood pressure prediction from pulse transit time using ECG and PPG signals. IEEE Healthcare Innovation Point-of-care Technologies Conference. Cancun (2016).
48. Schwartz J, Alexeeff SE, Mordukhovich I, Gryparis A, Vokonas P, Suh H, et al. Original article:Association between long-term exposure to traffic particles and blood pressure in the veterans administration normative aging study. Occup Environ Med. (2012) 69:422–7. doi: 10.1136/oemed-2011-100268
49. Brown MJ. Hypertension and ethnic group. BMJ Bri Med J. (2006) 332:833–6B. doi: 10.1136/bmj.332.7545.833
Keywords: hypertension, risk prediction, machine learning method, easy-to-collect, lifestyle
Citation: Zhao H, Zhang X, Xu Y, Gao L, Ma Z, Sun Y and Wang W (2021) Predicting the Risk of Hypertension Based on Several Easy-to-Collect Risk Factors: A Machine Learning Method. Front. Public Health 9:619429. doi: 10.3389/fpubh.2021.619429
Received: 20 October 2020; Accepted: 26 August 2021;
Published: 24 September 2021.
Edited by:
Cathal Gurrin, Dublin City University, IrelandReviewed by:
Robertas Damasevicius, Silesian University of Technology, PolandSylvia Hach, Unitec Institute of Technology, New Zealand
Copyright © 2021 Zhao, Zhang, Xu, Gao, Ma, Sun and Wang. This is an open-access article distributed under the terms of the Creative Commons Attribution License (CC BY). The use, distribution or reproduction in other forums is permitted, provided the original author(s) and the copyright owner(s) are credited and that the original publication in this journal is cited, in accordance with accepted academic practice. No use, distribution or reproduction is permitted which does not comply with these terms.
*Correspondence: Zuchang Ma, zcma@iim.ac.cn