Department of Physiology & Pharmacology, School of Medical Sciences, University Walk, University of Bristol, Bristol, UK
Whilst the cerebellum is predominantly considered a sensorimotor control structure, accumulating evidence suggests that it may also subserve non-motor functions during cognition. However, this possibility is not universally accepted, not least because the nature and pattern of links between higher cortical structures and the cerebellum are poorly characterized. We have therefore used in vivo electrophysiological methods in anaesthetized rats to directly investigate connectivity between the medial prefrontal cortex (prelimbic subdivision, PrL) and the cerebellum. Stimulation of deep layers of PrL evoked distinct field potentials in the cerebellar cortex with a mean latency to peak of approximately 35 ms. These responses showed a well-defined topography, and were maximal in lobule VII of the contralateral vermis (a known oculomotor centre); they were not attenuated by local anaesthesia of the overlying M2 motor cortex, though M2 stimulation did evoke field potentials in lobule VII with a shorter latency (approximately 30 ms). Single unit recordings showed that prelimbic cortical stimulation elicits complex spikes in lobule VII Purkinje cells, indicating transmission via a previously undescribed cerebro-olivocerebellar pathway. Our results therefore establish a physiological basis for communication between PrL and the cerebellum. The role(s) of this pathway remain to be resolved, but presumably relate to control of eye movements and/or distributed networks associated with integrated prefrontal cortical functions.
Goal-directed behaviours necessitate interactions between sensory, cognitive and motor systems. For example, whilst the cerebellum clearly plays a prominent role in the regulation of voluntary movements, such actions must ultimately be influenced by signals from higher order (neocortical) structures involved in executive control. However, the nature of links between neocortex and cerebellum remains poorly understood.
Results from functional brain imaging and clinical studies in patients, as well as neuroanatomical tract tracing experiments in primates, have been interpreted as evidence that the cerebellum is involved in cognition (Allen et al., 1997
; Dum et al., 2002
; Kelly and Strick, 2003
; Kim et al., 1994
; Leiner et al., 1989
, 1993
; see Ramnani, 2006
; Schmahmann et al., 2007
; Strick et al., 2009
; Thach, 2007
for review). However, Glickstein (2007
, 2008)
has suggested that interactions between the cerebellum and higher order structures may be more closely related to the control of eye movements than cognition per se. Connectivity between prefrontal cortical areas and the cerebellum might therefore involve cerebellar regions implicated in oculomotor control given that many cognitive processes are enabled by, or associated with, directed eye movements.
The rat medial prefrontal cortex subserves a range of cognitive functions (Dalley et al., 2004
; Fuster, 2001
; Kolb, 1984
; Kolb and Gibb, 1990
; Ongur and Price, 2000
; Vertes, 2006
). We have therefore used in vivo electrophysiological techniques in anaesthetized rats to map links between the medial prefrontal cortex (prelimbic cortex subdivision) and the cerebellar cortex. Stimulation of the prelimbic cortex reliably evoked field potentials on the cerebellar cortical surface, consistent with activation of climbing fibres. The responses were always largest within vermal lobule VII on the contralateral side. Such responses were not attenuated by reversible inactivation of the nearby supplementary motor cortex (M2), although M2 stimulation did evoke distinct field potentials within lobule VII with a shorter latency. The dissociation of PrL and M2 responses indicates that electrical stimulation of prefrontal cortex was localized to the prelimbic subdivision and did not inadvertently activate M2 projections to the cerebellum. Our results therefore establish a distinct physiological pathway in rats between the prelimbic cortex and a region of the cerebellum well known for its role in oculomotor control (for a review see Voogd and Barmack, 2005
), presumably reflecting the importance of eye movements in goal-directed behaviours.
All experimental procedures were carried out in accordance with the UK Animals (Scientific Procedures) Act 1986, and were approved by the University of Bristol institutional animal licence advisory group. A total of 24 adult rats were used (male Wistar, weight 280–380 g, Harlan, UK). Methods were consistent across experiments except where stated otherwise, and were divided into three overlapping categories: (i) field potential mapping (n = 19 rats); (ii) single unit recording (n = 5 rats) and (iii) pharmacological inactivation (n = 3 rats). All averaged data are presented as mean ± s.e.m. unless otherwise stated.
General Experimental Procedures
Rats were anaesthetized with sodium pentobarbitone (60 mg/kg intraperitoneal injection) and received a subcutaneous injection of atropine sulphate (0.1 ml, 600 μg/ml, AnimalCare Ltd, York, UK) to attenuate mucosal secretions. Rats were then placed in a stereotaxic frame (David Kopf Instruments, Tujunga, CA, USA) and secured with atraumatic ear bars coated with a topical local anaesthetic (Xylocaine, Astra Pharmaceuticals, Kings Langley, UK). Supplementary doses of barbiturate were given as required to maintain surgical levels of anaesthesia, as evidenced by the absence of limb withdrawal and corneal reflexes and lack of whisking. Core body temperature was maintained at ∼37°C through the use of a homeothermic blanket controlled by a probe measuring rectal temperature (Harvard Apparatus, MA, USA).
In all experiments a craniotomy exposed the frontal cortex (unilaterally or bilaterally) and a second craniotomy exposed the dorsal surface of the posterior lobe of the cerebellum. The dura was removed and the brain surface was periodically irrigated with warmed saline. The size of the cerebellar exposure varied according to the aim of the experiment. For general field potential mapping, the exposure included vermal lobules VI–IX, ansiform lobule, paramedian lobule and the copula pyramidis (see Figure 1
). The rostral and lateral extent of the exposure was limited by the transverse sinus and posterior inferior cerebellar artery, respectively. For more detailed field potential mapping, single unit recording, and pharmacological inactivation experiments, the exposure was restricted to vermal lobules VI–VIII. In all experiments the cerebellar exposure was photographed and surface blood vessels used as landmarks to map the location of individual recording sites on a digital image. The distance between the paravermal veins on either side of the vermis was used to estimate anatomical midline.
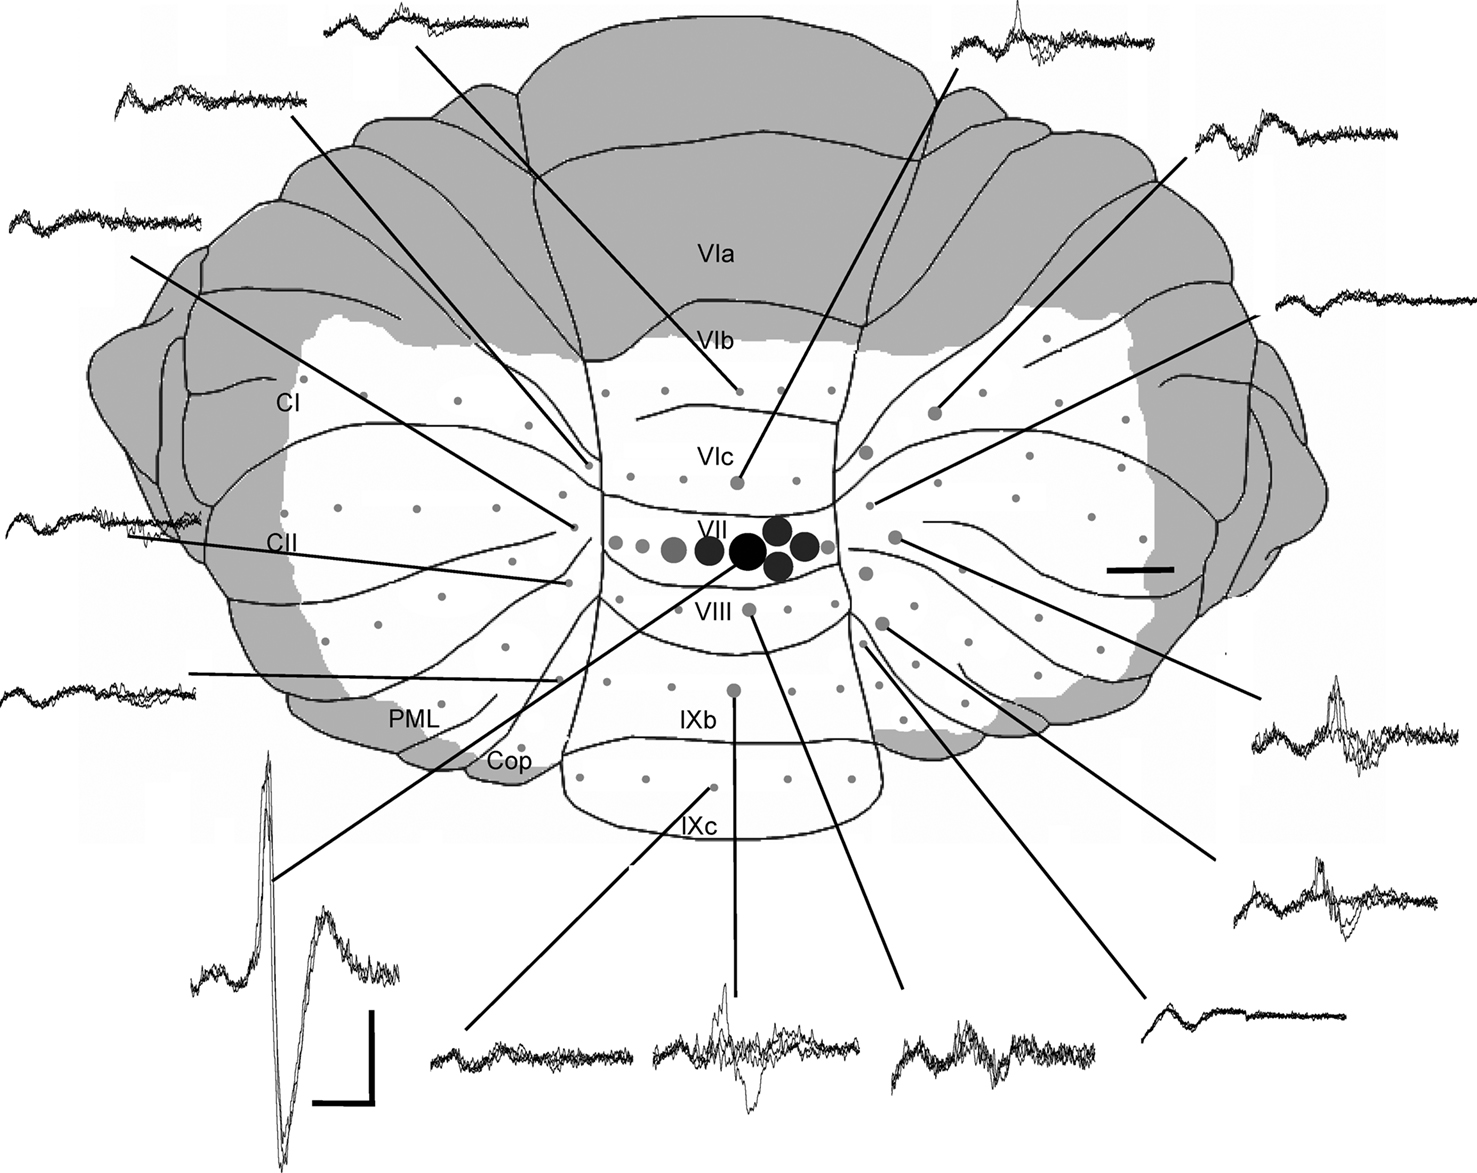
Figure 1. Mapping of cerebellar field potentials. Dorsal view of the rat cerebellum illustrating the distribution of responses evoked by stimulation of left PrL at intensity 2T in one experiment (case 31). Example waveforms (superimpositions of four consecutive responses) are shown of the largest responses recorded on the surface within each cerebellar region. Approximate peak-to-trough amplitude is represented by the size of circles. , >1 mV;
  , 0.5–1 mV;
  , 0.25–0.5 mV;
  , 0.1–0.25 mV;
  , 0–0.1 mV. VI–IX, vermal lobules VI–IX; PML, paramedian lobule; Cop, copula pyramidis; Crus I-II, crura of ansiform lobule. Shaded area = unstudied. Calibrations: 40 ms, 0.4 mV for field potentials, ∼1 mm for cerebellum. Stimulus delivered at start of each trace. Upward deflection indicates positivity (cf. Eccles et al., 1967
).
, 0–0.1 mV. VI–IX, vermal lobules VI–IX; PML, paramedian lobule; Cop, copula pyramidis; Crus I-II, crura of ansiform lobule. Shaded area = unstudied. Calibrations: 40 ms, 0.4 mV for field potentials, ∼1 mm for cerebellum. Stimulus delivered at start of each trace. Upward deflection indicates positivity (cf. Eccles et al., 1967
).
, >1 mV; , 0.5–1 mV; , 0.25–0.5 mV; , 0.1–0.25 mV; , 0–0.1 mV. VI–IX, vermal lobules VI–IX; PML, paramedian lobule; Cop, copula pyramidis; Crus I-II, crura of ansiform lobule. Shaded area = unstudied. Calibrations: 40 ms, 0.4 mV for field potentials, ∼1 mm for cerebellum. Stimulus delivered at start of each trace. Upward deflection indicates positivity (cf. Eccles et al., 1967
).At the end of each experiment, animals were euthanized with an intraperitoneal overdose of sodium pentobarbital (200 mg/kg).
Stimulation
A bipolar stimulating electrode (SNE-100X, interpolar distance of 0.5 mm, Rhodes Medical Instruments, distributed by David Kopf Instruments, Tujunga, CA, USA) was used to electrically stimulate the left prelimbic (PrL) cortical subdivision of the medial prefrontal cortex (mPFC, stereotaxic coordinates typically AP + 3.0, ML 0.8 and DV 3.0), or the supplementary motor cortex (M2, stereotaxic coordinates typically AP + 3.0, ML 0–1.0 and DV 0.5), using single square pulses of 0.2 ms duration, delivered at 0.1 Hz. The stimulus intensity was expressed as multiples of threshold (T) for evoking a detectable cerebellar cortical field; test pulses of 2–3× T were typically used (T = 0.5–0.7 mA).
Recording
Extracellular field potentials on the cerebellar surface were recorded either with custom-made tungsten-in-glass microelectrodes (impedance ∼50 kΩ) or a low impedance silver wire ball electrode. Extracellular single unit activity was recorded in the cerebellar cortex with high impedance tungsten-in-glass microelectrodes (impedance ∼10 MΩ, Melanie Ainsworth, Northamptonshire, UK). All responses were recorded differentially between the microelectrode and an indifferent placed nearby on bone or muscle and were amplified, bandpass filtered at 30 Hz–2.5 kHz (fields) or 300 Hz–7.5 kHz (single units), while any 50–60 Hz electrical interference was removed by a Humbug device (Quest Scientific, distributed by Digitimer Ltd, UK). Signals were sampled at 25 kHz using a CED 1401plus A/D converter (Cambridge Electronic Design, UK), and customized trigger sampled software (Spike2, CED, Cambridge, UK). Responses were analyzed offline. The trial-by-trial amplitude and latency to initial peak of individual evoked field potentials was measured using cursors positioned at the peak and trough of each field potential. At the end of each field potential mapping experiment the cerebellar cortical region of the highest amplitude response was marked by a ∼0.5 μl microinjection of pontamine sky blue dye (Sigma-Aldrich, USA). For single unit recording the activity of individual Purkinje cells was identified by the presence of complex spikes. Individual complex spikes were discriminated using template analysis functions in the Spike2 software.
Reversible Inactivation
In the reversible inactivation experiments cerebellar field potentials were evoked alternately by PrL and M2 stimulation (interstimulus interval of 3 s) before, and after (for up to 90 min) topical application of lidocaine to the surface of M2 (a piece of gelfoam approximately 2.5 mm2 soaked in 1% solution, Astra Pharmaceuticals Ltd, Kings Langley, UK). In each experiment the gelfoam was removed and the cerebral cortical surface flushed with saline after ∼30 min.
Histology
At the end of each experiment brains were removed and fixed in 4% paraformaldehyde solution for a minimum of 5 days. Fixed brains were then stored in 30% sucrose solution until saturated then sectioned at 100 μm. Sections were mounted onto gelatinized slides, counterstained with neutral red, dehydrated, cleared and coverslipped. Light microscopy was used to verify the position of the stimulating electrode in the prefrontal cortex, and the location of the cerebellar cortical recording site marked with pontamine sky blue.
Topography of Evoked Cerebellar Responses
Initial experiments (n = 6) used a stimulating electrode at a fixed position in PrL, and a roving microelectrode to map the location of field potentials evoked on the cerebellar cortical surface. The number of recording sites varied from 30–80 cerebellar cortical loci with a separation of ∼0.3–1 mm between sites. A complete survey of surface responses was not possible in all experiments, but the data obtained in less complete cases were always consistent with the pattern determined in those that were studied more extensively (see Figure 1
for an example of a case in which extensive mapping was carried out).
In every experiment the largest evoked field potentials were located in vermal lobule VII, although smaller amplitude responses were sometimes present in other cerebellar regions. The lobule VII responses had a mean peak-to-trough amplitude of 0.6 ± 0.2 mV (n = 6).
In 12 animals, more detailed mapping within vermal lobule VII (distance between recording sites of ∼0.2 mm) demonstrated that response amplitude varied as a function of medio-lateral position. The largest responses were always evoked in vermal lobule VII (Figure 2
A), on the contralateral side relative to PrL stimulation. Figure 2
B shows data plotted for one experiment and Figures 2
C,D show pooled data for all experiments. On average, the responses on the contralateral side were 41% larger than those evoked on the ipsilateral side (P < 0.0001, Wilcoxon signed rank test, n = 12).
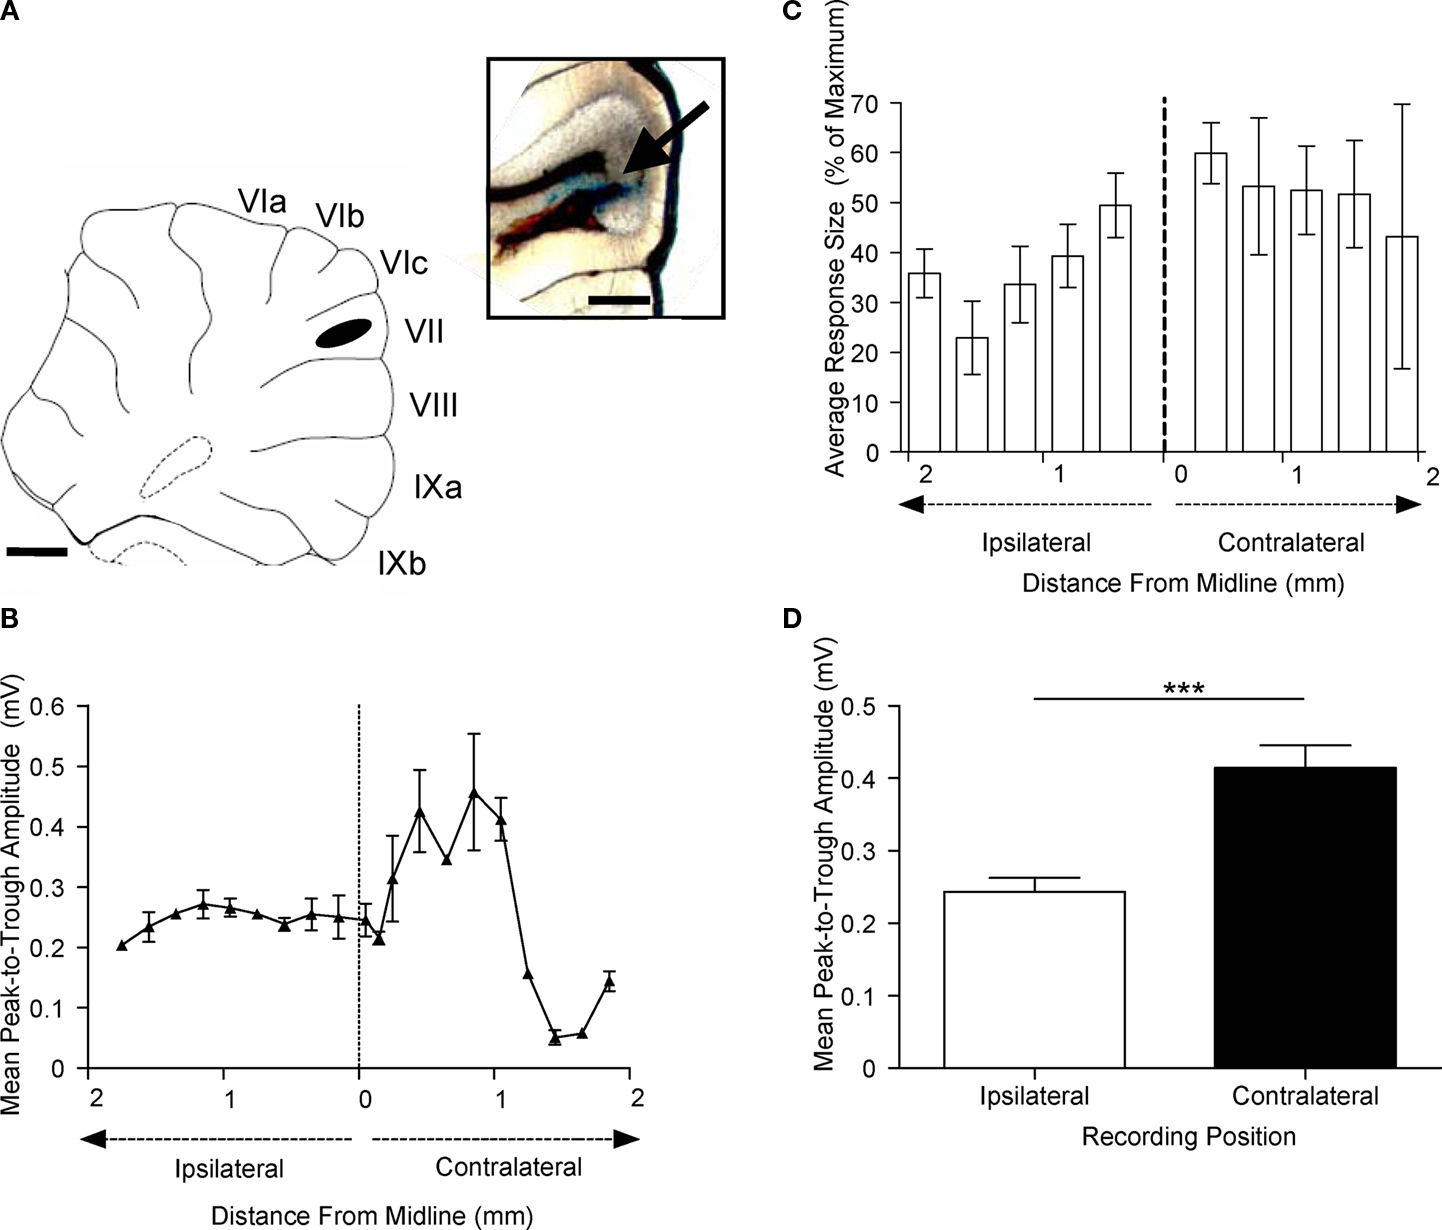
Figure 2. Detailed mapping of responses in vermal lobule VII evoked by PrL stimulation. (A) Standard cerebellar saggital outline (adapted from Paxinos and Watson, 2005
) showing lobule of largest evoked field potentials (black spot). Inset shows histological verification at higher magnification (blue spot, arrowed). (B) Typical example of changes in field potential amplitude as a function of medio-lateral recording position on the surface of lobule VII. Each data point represents the mean of four responses ± s.e.m. Cerebellar paravermal veins are located ∼0.5 mm lateral from the lateral-most recording points. (C) Pooled data from 12 animals to show mean changes in field potential amplitude as a function of medio-lateral recording position on the surface of lobule VII. Each bar represents mean responses ± s.e.m within 0.4 mm bins. The number of recording points per bin varies from 5 to 21. (D) Pooled data to show mean size of the responses evoked on the two sides of the vermis of lobule VII. ***P < 0.0001, Wilcoxon signed rank test, n = 12, all ipsilateral and contralateral recording points are included in the analysis. Scale bar 1 mm for low power view of cerebellum, 0.25 mm for inset.
Electrophysiological Identification of Evoked Responses
The cerebellar surface recordings displayed features typical of climbing fibre field potentials. These included: (i) a highly characteristic waveform with an initial rapid rising positive deflection with a duration of ∼5 ms, as described previously in cats (e.g. Armstrong and Harvey, 1968
; Armstrong et al., 1973
) and rats (Armstrong and Drew, 1980
; Atkins and Apps, 1997
); (ii) the amplitude of the responses often varied from trial-to-trial, again characteristic of evoked climbing fibre responses (cf. Armstrong and Harvey, 1968
); and (iii) their pattern of response to a conditioning stimulus was typical of climbing fibre responses. When two supramaximal stimuli were delivered at interstimulus intervals ranging from 60 to 250 ms, the second climbing fibre response always exhibited a reduction in size (n = 3, not illustrated, cf. Armstrong and Harvey, 1968
; Eccles et al., 1966
; Miller et al., 1969
). Given that cerebellar field potentials attributable to activity in mossy fibre afferents are usually severely depressed in barbiturate preparations (see for example Bengtsson and Jörntell, 2007
; Gordon et al., 1973
) we therefore judged the field potentials as being mainly climbing fibre in origin.
Unequivocal evidence that the PrL stimulation activated climbing fibre pathways was obtained in five additional experiments in which extracellular single unit recordings were obtained from individual Purkinje cells located in the cortical layer immediately subjacent to the site where the largest field potentials were evoked on the cerebellar surface. Figure 3
A illustrates an example case and shows that a train of complex spikes (due to activation of climbing fibre input from the inferior olive) was evoked by the single pulse PrL stimulation. Consistent with the field potential data, the onset latency of the first complex spike was on average 29 ± 7 ms (S.D., n = 10 cells), thus falling within the range of latencies of the evoked field potentials. A rhythmic train of complex spike activity following PrL stimulation occurred in 60% of the Purkinje cells studied (Figure 3
C) and was also evident in the field potential recordings (not shown). Typically, three or four complex spikes were evoked with an inter-spike interval of about 70–90 ms. In each case, post mortem histological reconstruction confirmed that the tip of the stimulation electrode was within the anatomical boundaries of PrL (a typical example is illustrated in Figure 3
B). In summary, these electrophysiological data therefore indicate that the field potential responses evoked by PrL stimulation and recorded in cerebellar vermal lobule VII were mainly, if not exclusively, due to activity in a cerebro-olivocerebellar pathway.
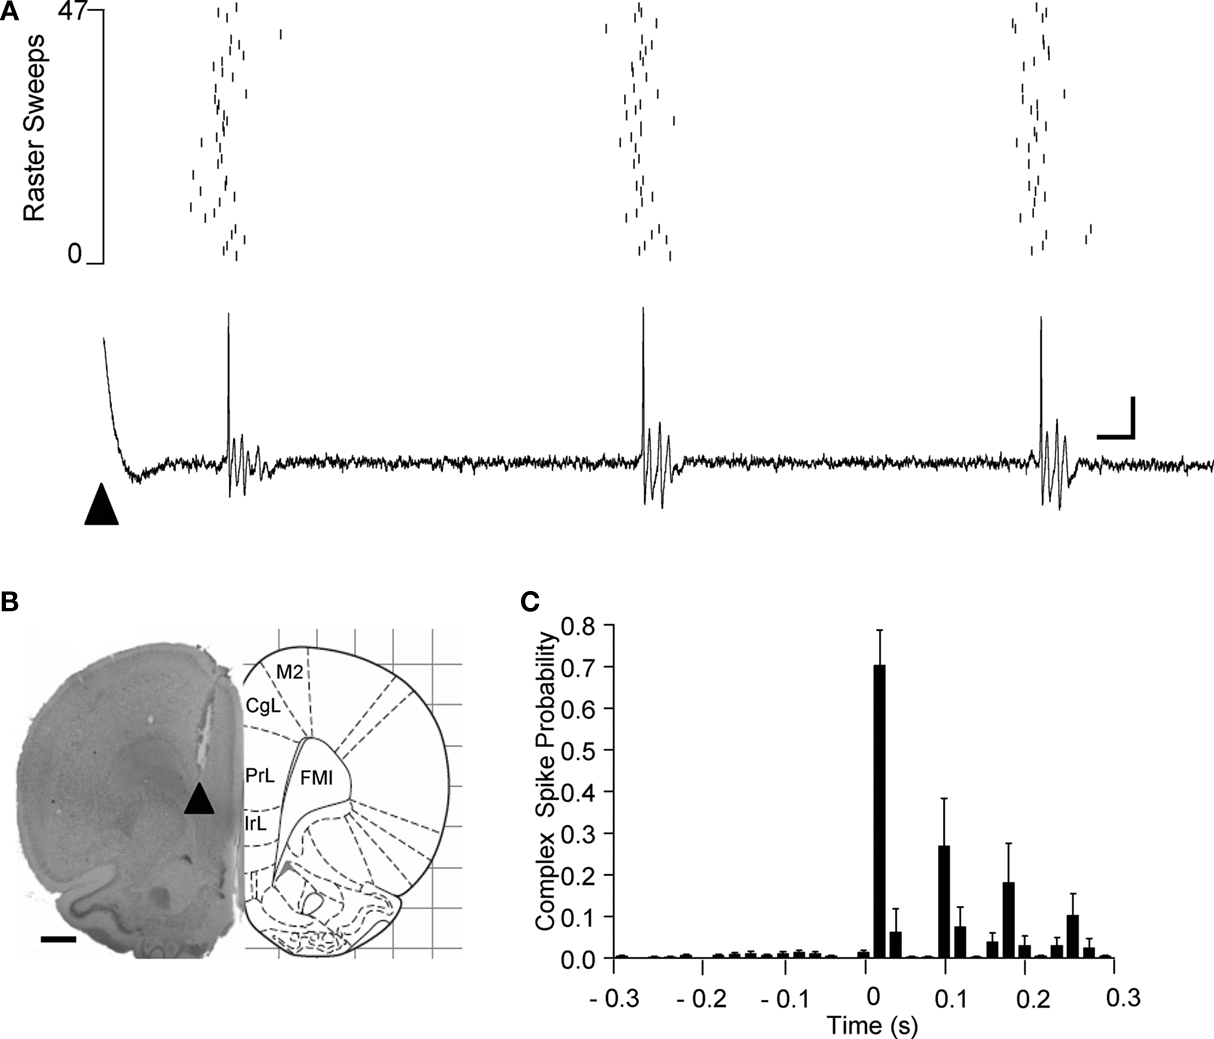
Figure 3. Single unit Purkinje cell responses evoked by PrL stimulation. (A) Raster plot and example single sweep illustrating complex spike activity of a Purkinje cell located in a superficial cortical layer in contralateral vermal lobule VII evoked by PrL stimulation (arrowhead). Raster = 47 consecutive trials. (B) Histological verification of the site of PrL stimulation (arrowhead) for the experiment shown in A (adapted from Paxinos and Watson, 2005
). (C) Peristimulus time histogram to show pooled complex spike activity of 10 Purkinje cells (obtained in five experiments). In each case the probability of complex spikes occurring following PrL stimulation (time zero) was calculated from a total of 47 consecutive trials, mean ± s.e.m. Bin width 20 ms. CgL, cingluate cortex; IrL, infralimbic cortex; FMI, forceps minor of the corpus collosum. Scale bars: A, 10 ms, 0.2 mV; B, 1 mm.
CNS Stimulation Site
Current strengths of ∼0.6 mA were generally needed to evoke the cerebellar responses, presumably because of the closely spaced configuration of the electrode dipole (see Materials and Methods). However, in every experiment tested (n = 10 animals), the latency of the cerebellar responses varied systematically with depth of the stimulation electrode, suggesting that the effect of the stimulus was localized. An example is illustrated in Figure 4
A in which averaged lobule VII field potential responses are shown following stimulation at the indicated depths below the dorsal surface of the brain, along a dorso-ventral track in medial prefrontal cortex. There is a clear reduction in amplitude of the responses at a depth of 2.0 mm (corresponding stereotaxically to the boundary between cingulate cortex and PrL), and at deeper levels a subsequent increase in response amplitude with a concomitant shift in the latency to peak, with the longer latency responses corresponding stereotaxically to PrL. Stimulation at more superficial levels (corresponding to M2), resulted in responses with a mean latency to peak of 30.2 ± 1.0 ms (n = 10); responses in the same animals but evoked by stimulation at depths corresponding to PrL had a significantly longer mean latency to peak of 35.2 ± 1.3 ms (Figure 4
B, P < 0.005, Wilcoxon signed rank test, n = 10). Figure 4
C shows the change in latency to peak as a function of dorso-ventral depth for all available cases (n = 10). At superficial depths (0.5–2.0 mm) the latency to peak was about 30 ms, while at 3–3.5 mm depth there is a clear shift to a longer latency of about 35 ms.
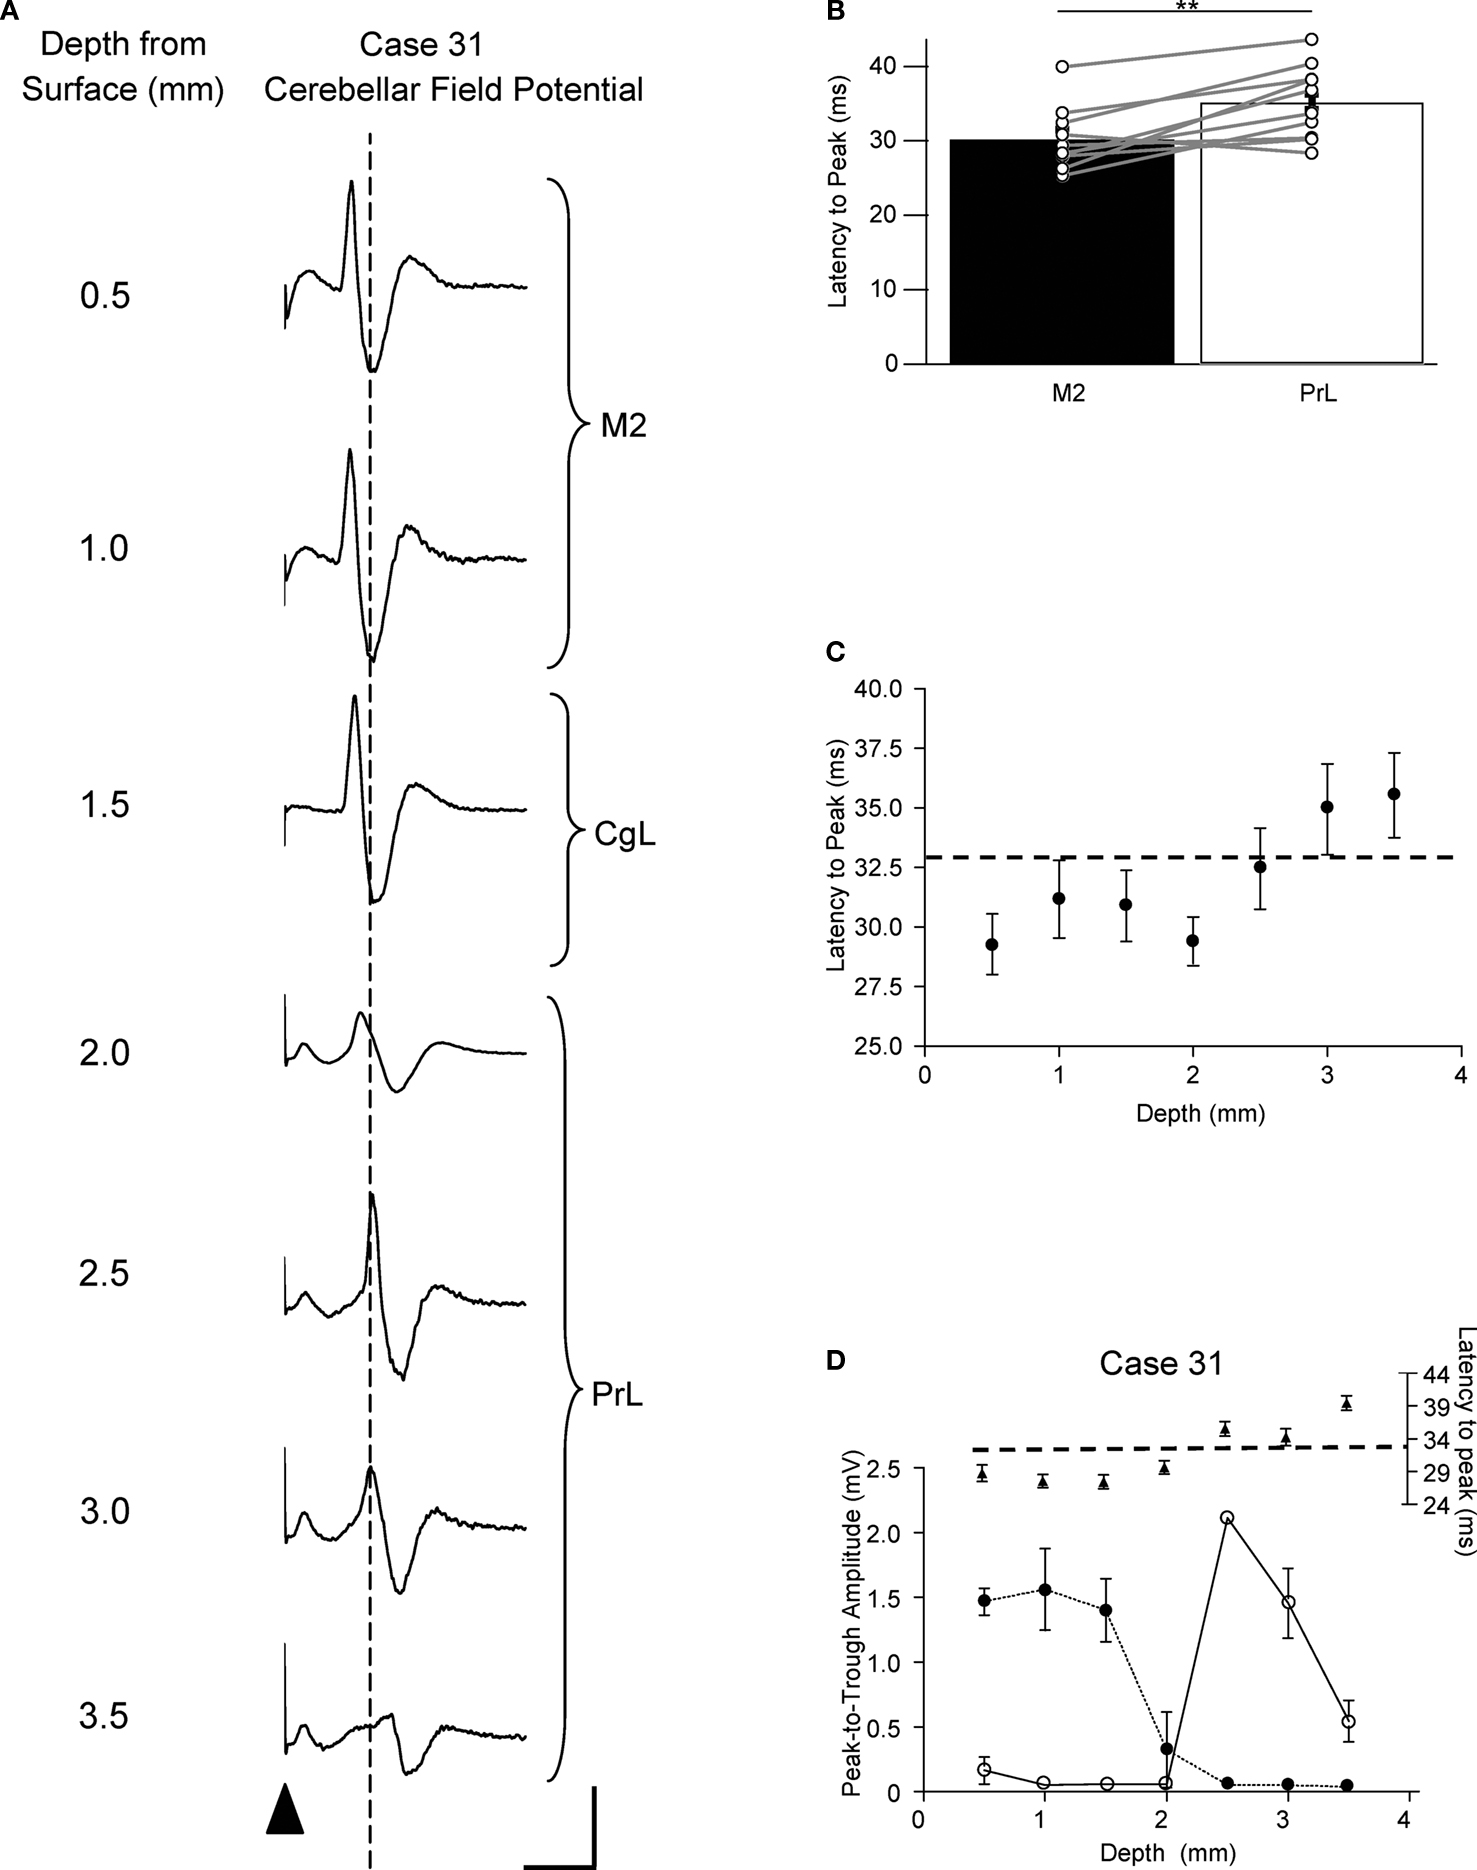
Figure 4. Latency of lobule VII responses evoked by M2 and PrL stimulation. (A) Example case showing average field waveforms (n = 4), recorded on the surface of cerebellar vermal lobule VII, following frontal cortical stimulation (arrowhead) at various depths below the cerebral cortical surface. The dashed vertical line represents the latency to peak following PrL stimulation at a depth of 3 mm. (B) Pooled latency to peak of responses evoked by stimulation at 0.5–1 mm depth (M2) and 3–3.5 mm depth (PrL). Mean latency ± s.e.m. **P < 0.005, Wilcoxon signed rank test, n = 10. (C) Average latency to peak of responses evoked by stimulation at varying dorso-ventral depths in the frontal cortex (n = 10). Dashed horizontal line indicates the threshold for defining longer latency responses (33 ms, see text). (D) Graphical display of the same case shown in A. Upper panel plots latency to peak of the responses as a function of dorso-ventral depth. Dashed horizontal line indicates threshold for longer latency pathways. Lower panel plots response amplitude at different depths for the same responses. Shorter latency responses (<33 ms, filled circles); longer latency responses (≥33 ms, open circles). Each point represents the mean amplitude of four responses ± s.e.m. Scale bars: A, 30 ms, 1 mV.
For further analysis all responses with a latency to peak of <33 ms were taken as ‘shorter latency’, while all responses with a latency to peak ≥33 ms were taken to be ‘longer latency’ (see Figure 4
C for derivation of latency bounds). In four animals both superficial (M2/cingulate) and deeper (PrL) stimulation evoked responses in lobule VII (see Figure 4
D). In two additional animals only PrL stimulation evoked detectable responses (at longer latency), while in four other animals responses in lobule VII were mainly evoked by superficial (M2/cingulate) stimulation (at shorter latency). There was no systematic difference in the presence or absence of shorter or longer latency responses in relation to the rostrocaudal location of stimulation sites in different experiments. Also, when several tracks were made in the same experiment to activate different parts of M2 and PrL, similar findings were obtained in each track. Thus, the shorter and longer latency responses were dissociable, suggesting the presence of two distinct cerebro-olivocerebellar pathways: a shorter latency pathway arising from M2 and a longer latency pathway arising from PrL. It should be noted, however, that the possibility cannot be entirely excluded that the current strengths used resulted in activation of fibres not only in M2 or PrL, but also close by.
Reversible Inactivation
To test directly whether the climbing fibre responses recorded at the same cerebellar recording sites in lobule VII evoked by M2 or PrL stimulation were the result of activity in pathways with different origins, in three animals a local anaesthetic (lidocaine) was applied topically to the cerebral cortical surface in the region of M2 (see Materials and Methods for further details). Figure 5
A illustrates data from one example experiment in which climbing fibre responses were recorded in vermal lobule VII following PrL and M2 stimulation. After application of lidocaine to the cerebral surface (arrow), the responses evoked by M2 stimulation were substantially reduced in size (filled circles, to ∼20% of control after 10 min, P < 0.01, repeated measures ANOVA, Dunnett’s post hoc), but recovered over time. In marked contrast, the responses at the same cerebellar recording site evoked by PrL stimulation remained essentially unchanged (open circles, P > 0.05, repeated measures ANOVA, Dunnett’s post hoc).
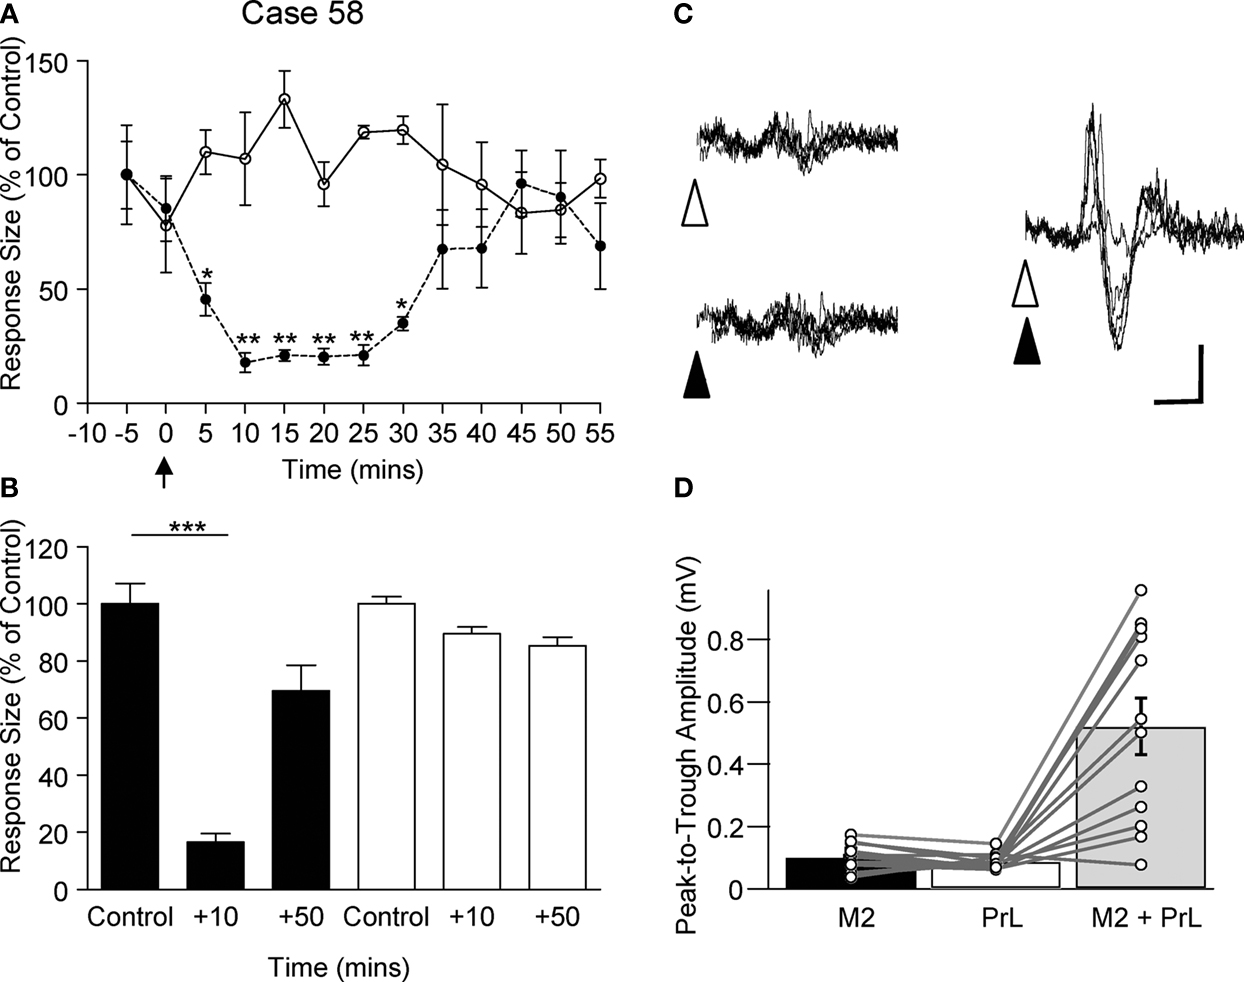
Figure 5. Selective pharmacological inactivation and pathway convergence. (A) Example experiment, plotting the amplitude (expressed as a percentage of control) of evoked climbing fibre responses, recorded at the same lobule VII site, as a function of time before and after (arrow) topical application of local anaesthetic to M2 (lidocaine, see Materials and Methods for further details). M2 evoked responses are represented by filled circles; PrL evoked responses are represented by open circles. Each data point represents the mean of four responses ± s.e.m. *P < 0.05; **P < 0.01, Repeated measures ANOVA, Dunnett’s post hoc comparison against pre-anaesthetic control. (B) Pooled data from three animals in which local anaesthetic was topically applied to M2 whilst stimulating M2 and PrL alternately. Responses recorded from vermal lobule VII at two different time points after local anaesthetic application. Data expressed as a percentage of control size pre-anaesthetic application. M2 evoked responses (filled bars), PrL evoked responses (open bars). Each bar represents the mean of 12 responses ± s.e.m. ***P < 0.001; Bonferroni’s multiple comparison test N = 3. (C) Example experiment illustrating the effect of conjunctive M2 (filled arrowhead) and PrL (open arrowhead) stimulation on responses evoked by stimuli delivered at an intensity just above threshold for a detectable cerebellar response. Scale bars: 30 ms; 0.2 mV. (D) Pooled data from three animals showing the mean amplitude of cerebellar response evoked in lobule VII following M2 (filled bar) or PrL (open bar) stimulation at threshold intensity, compared with the amplitude of responses evoked by combined M2 and PrL threshold intensity stimulation (grey bar).
The data from all three experiments are pooled in Figure 5
B. The mean size of responses evoked by M2 and PrL stimulation at two different time points after lidocaine application (10 and 50 min) was compared to control values. The shorter latency responses evoked by M2 stimulation were significantly reduced in size compared to control levels 10 min after lidocaine application (on average the responses were 17% of control, P < 0.001, Bonferroni’s multiple comparison test, n = 3). In contrast, the longer latency responses evoked by PrL stimulation displayed no statistically significant difference in amplitude or latency 10 min after lidocaine application (on average 90% of control amplitude, P > 0.05, Bonferroni’s multiple comparison test, n = 3).
In one additional experiment, local anaesthetic was applied to the surface of M2 whilst recording multiunit activity at a depth of 1 mm below the site of application. Activity was markedly reduced within ∼10 min (firing rate reduced by over 90% of control levels), indicating that the topical application of local anaesthetic was effective at blocking activity in deeper (output) layers of M2.
In summary, the pharmacological inactivation experiments demonstrate that local anaesthetic topically applied to the cerebral cortical surface can differentially effect transmission in cerebro-olivocerebellar pathways that arise from M2 but not those that arise from PrL, providing evidence that the two paths are independent at this level of the neuraxis.
Pathway Convergence
Although the focus of the present study was the topography of cerebro-olivocerebellar projections arising from PrL, it was also of interest to compare these findings with the spatial pattern of projections arising from M2. In two animals the cerebellar responses evoked by M2 stimulation were mapped. In each case the topography of responses was found to be the same as those evoked by PrL stimulation, with the largest climbing fibre responses being evoked in vermal lobule VII. This suggests that the two cerebro-olivocerebellar pathways activate a common group of olivary neurones. To determine whether the cerebro-olivocerebellar pathways arising from M2 and PrL converged at (or before) the level of the inferior olive, both cerebral sites were stimulated simultaneously at near threshold levels (cf. Allen et al., 1974
). If the two descending pathways have an excitatory influence on the same olive cells, and thereby provide a common climbing fibre input to the cerebellar recording site under study, threshold inputs should summate to evoke a larger cerebellar response. In all three experiments in which this was tested this was found to be the case (Figures 5
C,D). On average, the combined stimulation evoked a response that was respectively 78% and 72% larger than the response evoked by M2 or PrL stimulation alone. The results therefore suggest that, although the cerebellar responses recorded within lobule VII appear to have different origins in the cerebral cortex, nonetheless the two descending paths converge to activate an overlapping network of olivary neurones.
The present study provides evidence consistent with the presence of two distinct cerebro-olivocerebellar projections arising from the M2 and PrL subdivisions of rat frontal cortex. These pathways converge at or prior to the inferior olive, before terminating as climbing fibres in the contralateral vermis of lobule VII, a region of cerebellar cortex known for its contributions to oculomotor control. Thus, prefrontal-cerebellar connectivity exists that presumably underlies functional interactions between the two regions during behaviour.
Methodological Considerations
In our physiological mapping experiments it might be argued that the stimulation activated multiple regions of the frontal cortex (Ranck, 1975
). Two lines of evidence suggest, however, that this was not the case: (1) the abolition of M2 evoked responses by application of lidocaine indicates that stimulus current was localized sufficiently to excite discrete subregions ventral to the motor cortex. And (2) the systematic changes in climbing fibre field amplitude recorded at a fixed site within lobule VII, following stimulation at various frontal cortical depths, indicates localized stimulation. It therefore seems reasonable to conclude that the cells of origin of the cerebro-olivocerebellar pathways under study were located mainly (if not exclusively) within PrL and M2.
It might also be argued that the cerebellar responses evoked by PrL stimulation could be mediated via M2. For example, the longer latency of PrL evoked responses might be explained by one or more additional relays in deeper layers of M2 or regions of M2 that were not inactivated by the lidocaine. However, this seems unlikely to fully explain our findings because: (1) interconnections between PrL and M2 are sparse, if at all present (Conde et al., 1995
). (2) The gelfoam soaked with lidocaine was larger than the total cortical area occupied by M2 (cf. Neafsey et al., 1986
), and the local anaesthetic would have blocked the activity of both cells and fibres of passage. (3) A control experiment showed that the lidocaine was able to dramatically reduce neural activity at least 1 mm in depth from the point of application, suggesting that the deeper layers of M2 were also affected. And (4), similar differences in response latency were found in cases in which different parts of M2 and PrL were stimulated. Thus, it seems safe to conclude that the climbing fibre responses with distinct latencies evoked by PrL and M2 stimulation were mediated by cerebro-olivocerebellar pathways with different origins.
An additional feature of the single unit recordings was the finding that the PrL stimulation typically evoked rhythmic climbing fibre activity in lobule VII (see Figure 3
). The ∼7–9 Hz oscillations are reminiscent of those described by Schwarz and Welsh (2001)
, in which rhythmic complex spike activity was evoked by single pulse stimulation of motor cortex (M1), although at a somewhat higher frequency of ∼15 Hz. Such effects may be the result of a synchronous activation of fibres by the electrical stimulation, although more natural forms of peripheral stimulation can also evoke similar patterns of rhythmicity (Ebner and Bloedel, 1981
; Llinas and Sasaki, 1989
). Such a phenomenon, where the response far outlasts the initial stimulus, appears to be a feature of some climbing fibre pathways and presumably reflects regenerative firing due to intrinsic biophysical properties of inferior olive cells (Llinas and Yarom, 1981a
,b
, 1986
). The present study adds a new climbing fibre pathway to the list that display this phenomenon, though further studies will be required to determine the functional significance of such effects.
Comparison with Previous Physiological Studies
Previous electrophysiological mapping studies have evoked putative climbing fibre fields from a wide range of cerebral cortical sites in monkey (e.g. Curtis, 1940
; Dow, 1942
; Sasaki et al., 1977
) and cat (e.g. Andersson and Nyquist, 1983
; Belcari and Guglielmino, 1976
; Dow, 1942
; Jansen, 1957
; Kyuhou, 1992
; Oka et al., 1979
; Sasaki et al., 1975
). Although most studies have focused on projections arising from primary motor and sensorimotor cortices (M1 and S1 e.g. Ackerley et al., 2006
; Andersson and Nyquist, 1983
; Baker et al., 2001
; Miles and Wiesendanger, 1975
), experiments in cat have also revealed climbing fibre projections from parietal association areas to the anterior lobe and lateral cerebellum (Andersson and Nyquist, 1983
; Jansen, 1957
; Sasaki et al., 1975
). Taken together these earlier studies therefore suggest the existence of numerous polysynaptic climbing fibre projections originating in cerebral sensory, motor and association areas that tend to be directed towards the lateral cerebellum.
Much less information is available on cerebellar projections from prefrontal cortex. Electrical stimulation of the frontal pole in cat (partly equivalent to prefrontal cortex, Khokhryakova, 1978
; Markowitsch and Pritzel, 1979
; Room et al., 1985
), showed that unidentified cerebellar responses displayed a scattered topography and a latency to peak of ∼25 ms (Dow, 1942
). In addition, electrophysiological mapping of cerebro-cerebellar pathways in monkey found that electrical stimulation of prefrontal cortex (subdivisions 8, 9 and 10) evoked climbing fibre responses within the lateral cerebellum with an onset latency of 16–18 ms (Sasaki et al., 1977
). This contrasts with the localized PrL-lobule VII vermal projection shown here in rat. Given the highly conserved structure-function relations of the cerebellum, particularly its vermal compartment (e.g. Sillitoe et al., 2005
), it seems unlikely that this is a species difference, but clearly further studies will be required to determine if this cerebro-olivocerebellar pathway is also present in other species.
Comparison with Previous Anatomical Studies
Prelimbic cortex and M2 have been shown in previous anatomical tract tracing experiments to have different patterns of afferent and efferent connectivity (e.g. Heidbreder and Groenewegen, 2003
; Hoover and Vertes, 2007
; Reep et al., 1987
; Sesack et al., 1989
). Efferent targets of PrL include ventral striatum, amygdala, periaqueductal grey, cingulate and entorhinal cortices. By comparison, efferent targets of M2 include the dorsal striatum, superior colliculus and sensory and motor cortices (Sesack et al., 1989
). Different anatomical projections therefore exist that could account for the differences in latency of the M2 and PrL climbing fibre evoked responses. For example, the responses evoked by M2 stimulation may be explained by its direct projections to the superior colliculus. The superior colliculus, in turn, has been shown in a range of species to project to the caudal medial accessory olive (cMAO) (monkey: Frankfurter et al., 1976
, 1977
; Harting, 1977
, cat: Jeneskog, 1983
; Kyuhou and Matsuzaki, 1991
; Weber et al., 1978
, rabbit: Holstege and Collewijn, 1982
, rat: Akaike, 1985
; Hess, 1982
; Swenson and Castro, 1983
), and cMAO (subnucleus c) in turn provides the main climbing fibre input to vermal lobule VII (Apps, 1990
; Gwyn et al., 1977
; Sugita et al., 1989
, see also Akaike, 1985
, 1986
, 1992
; Hess, 1982
). On the other hand, the periaqueductal grey is a potential candidate as a site of relay between PrL and cerebellar vermal lobule VII because it also has connections with cMAO (Swenson and Castro, 1983
). This of course does not exclude the possibility of other indirect routes.
To account for the extra 5 ms conduction time for the climbing fibre responses evoked by PrL stimulaton, presumably means either additional synaptic relays and/or slower conducting fibres are involved. However, other methods, such as transneuronal tract tracing will be required to determine the underlying neural circuitry. In this respect transneuronal tracing has shown in monkey that an indirect projection exists between the dorsolateral prefrontal cortex (area 46) to the cerebellar cortex that has an intermediate relay within the pons (Kelly and Strick, 2003
). Of particular relevance to the present study was the finding that granule cells in vermal lobule VII exhibited strong staining following injections into area 46, suggesting a robust pontocerebellar mossy fibre projection to primate lobule VII arising from prefrontal cortex. A pontine input from PrL remains to be demonstrated in rat, although lobule VII has been shown to receive mossy fibre projections from pontine areas that receive input from other neocortical areas, including oculomotor and subcortical visual centres such as the superior colliculus, pretectum and nucleus of the optic tract (Mihailoff et al., 1989
; Torigoe et al., 1986
).
Functional Significance
The PrL (and related prefrontal cortical regions) in rat are neuroanatomically well positioned to interact with sensory, motor and limbic structures, thus allowing them to serve as a centre of integration (see Heidbreder and Groenewegen, 2003
; Kolb, 1984
). This includes a host of higher order functions such as selective attention, working memory, decision making, and goal-directed behaviours which require multi-system interaction (Dalley et al., 2004
; Fuster, 2001
; Kolb, 1984
; Kolb and Gibb, 1990
; Ongur and Price, 2000
; Vertes, 2006
). The finding that electrical stimulation of PrL can evoke eye movements under some conditions (Brecht et al., 2004
; Donoghue and Wise, 1982
), suggests that this higher order centre may also be part of the frontal eye field system in the rat, and play a role in the coordination of non-cognitive (but enabling) functions such as oculomotor control.
Whilst control and planning of any goal-directed behaviour is mediated by higher centres, the motor system must ultimately be engaged. Targeted eye movements are critical during the shifting of attention involved in such behaviour (cf. Glickstein, 2007
). Thus, coordination of eye movements may be mediated by PrL and executed downstream. The pathway described in the present experiments may therefore provide a neural substrate that allows PrL to influence a cerebellar centre heavily implicated in oculomotor control (e.g. Godschalk et al., 1994
; Keller et al., 1983
; Kralj-Hans et al., 2007
; Krauzlis and Miles, 1998
; Noda and Fujikado, 1987
; Ron and Robinson, 1973
). Indeed, abnormal PrL modulation of lobule VII motor output may underlie the manifestation of eye movement disorders in schizophrenic patients (Jacobsen et al., 1996
; Rommelse et al., 2008
).
However, the extent to which PrL-cerebellar connections contribute to coordination of eye movements in particular, rather than cognitive information processing in general, remains to be established. The functions of the ‘oculomotor vermis’ may not be restricted to eye movement control, but contribute to an altogether more complex integrative network involved in cognitive processing (see for example, Hayter et al., 2007
). In keeping with such a view is the suggestion that abnormal interactions between prefrontal cortex and cerebellar vermis are important in developmental disorders such as autism (Carper and Courchesne, 2000
; Pierce and Courchesne, 2001
). The possibility also remains that vermal lobule VII has output via fastigius that includes projections to higher order structures such as PrL. But transneuronal mapping experiments have so far only found such projections from the lateral cerebellum (Kelly and Strick, 2003
). Future work simultaneously recording PrL and lobule VII neural activity during goal-directed behaviours should help resolve this issue.
The authors declare that the research was conducted in the absence of any commercial or financial relationships that could be construed as a potential conflict of interest.
We thank Miss Rachel Bissett for her expert technical assistance. T.C. Watson was funded by a BBSRC studentship, and M.W. Jones is an RCUK Research Fellow.
Jacobsen, L. K., Hong, W. L., Hommer, D. W., Hamburger, S. D., Castellanos, F. X., Frazier, J. A., Giedd, J. N., Gordon, C. T., Karp, B. I., McKenna, K., and Rapoport, J. L. (1996). Smooth pursuit eye movements in childhood-onset schizophrenia: comparison with attention-deficit hyperactivity disorder and normal controls. Biol. Psychiatry 40, 1144–1154.