Dynamic Thromboembolic Risk Modelling to Target Appropriate Preventative Strategies for Patients with Non-Small Cell Lung Cancer

Abstract
:1. Introduction
2. Results
2.1. Patient Characteristics
2.2. Biomarker Profiles
2.2.1. Baseline
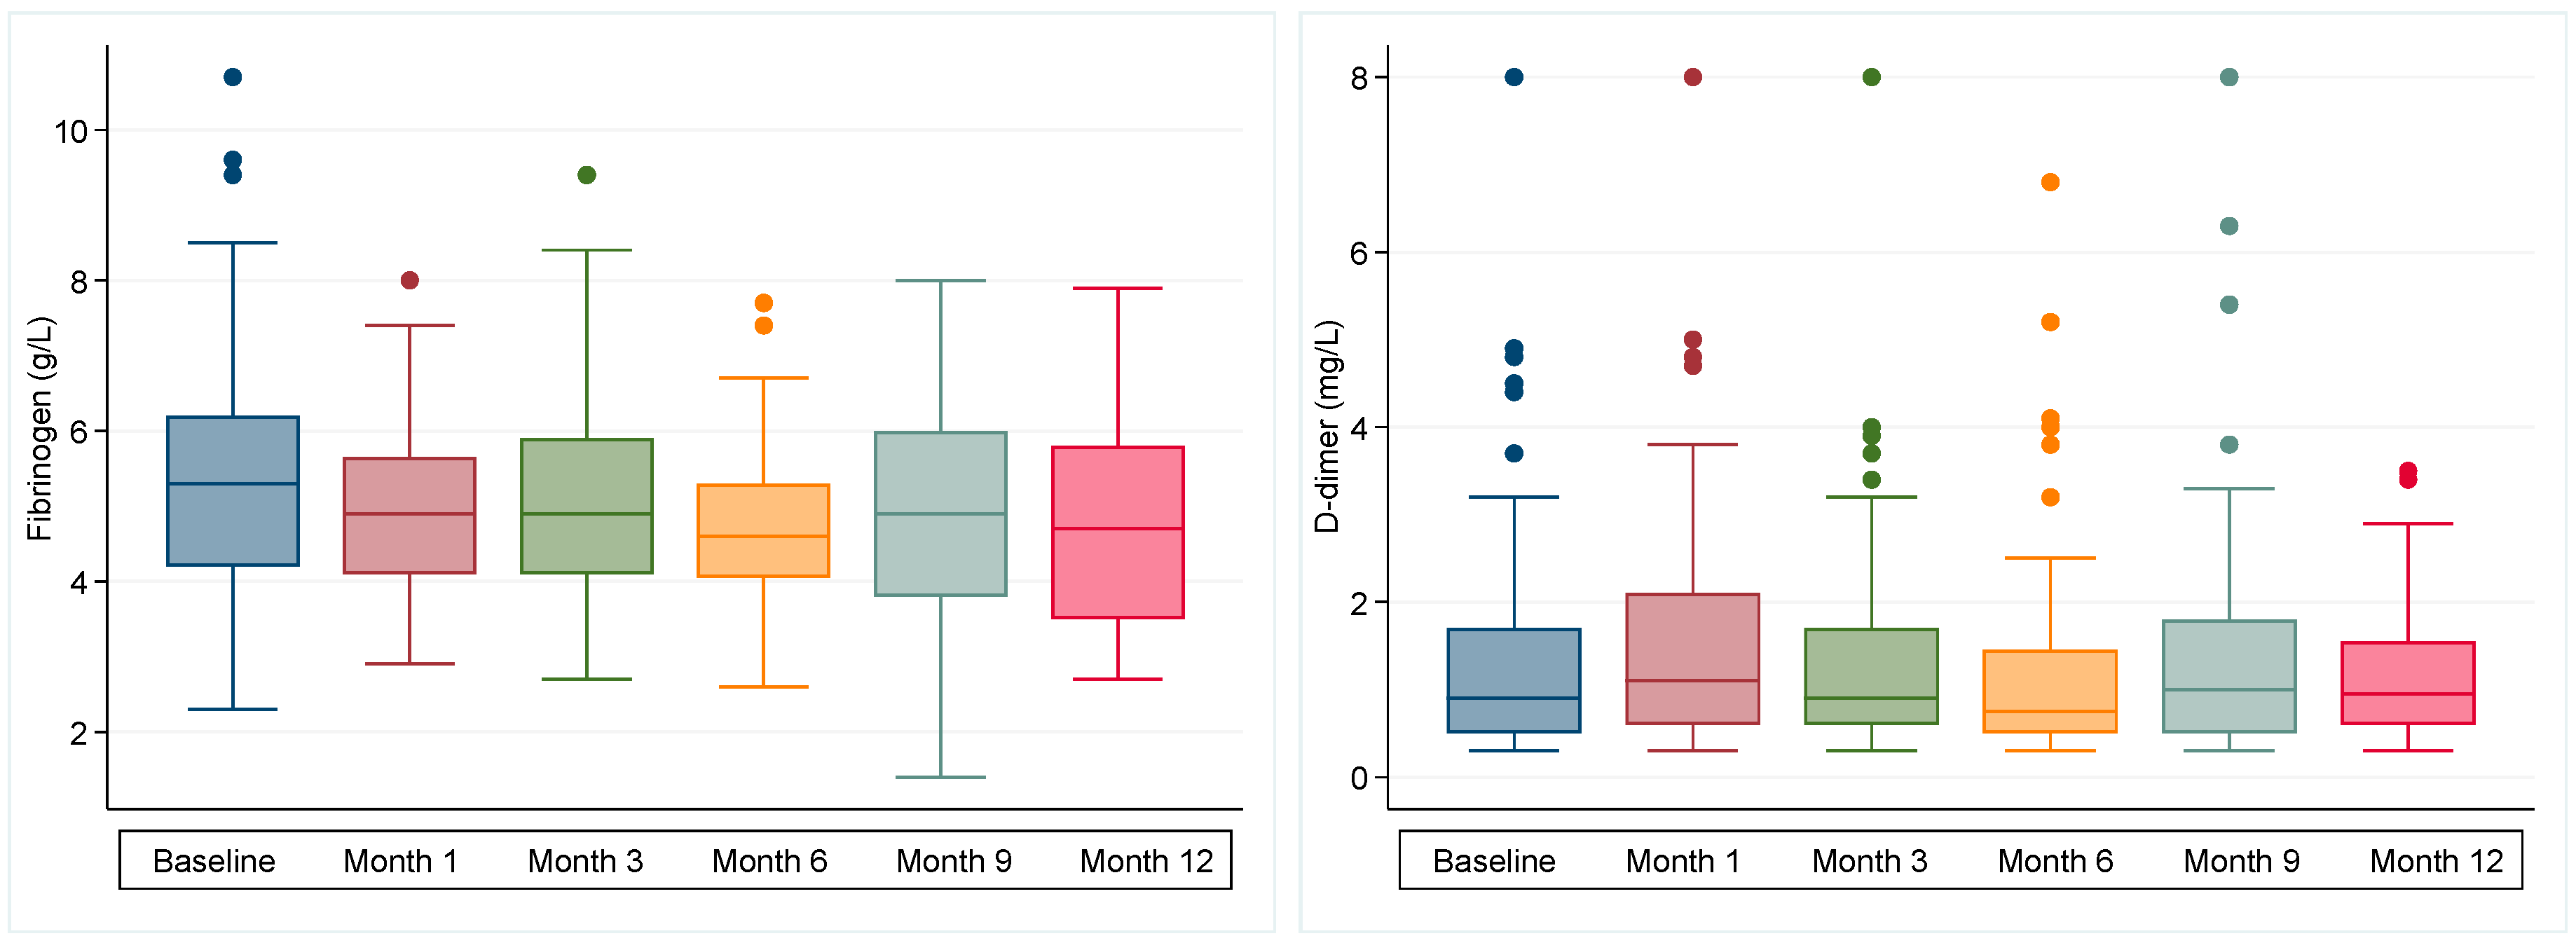
2.2.2. Longitudinal
2.3. Thrombotic Events
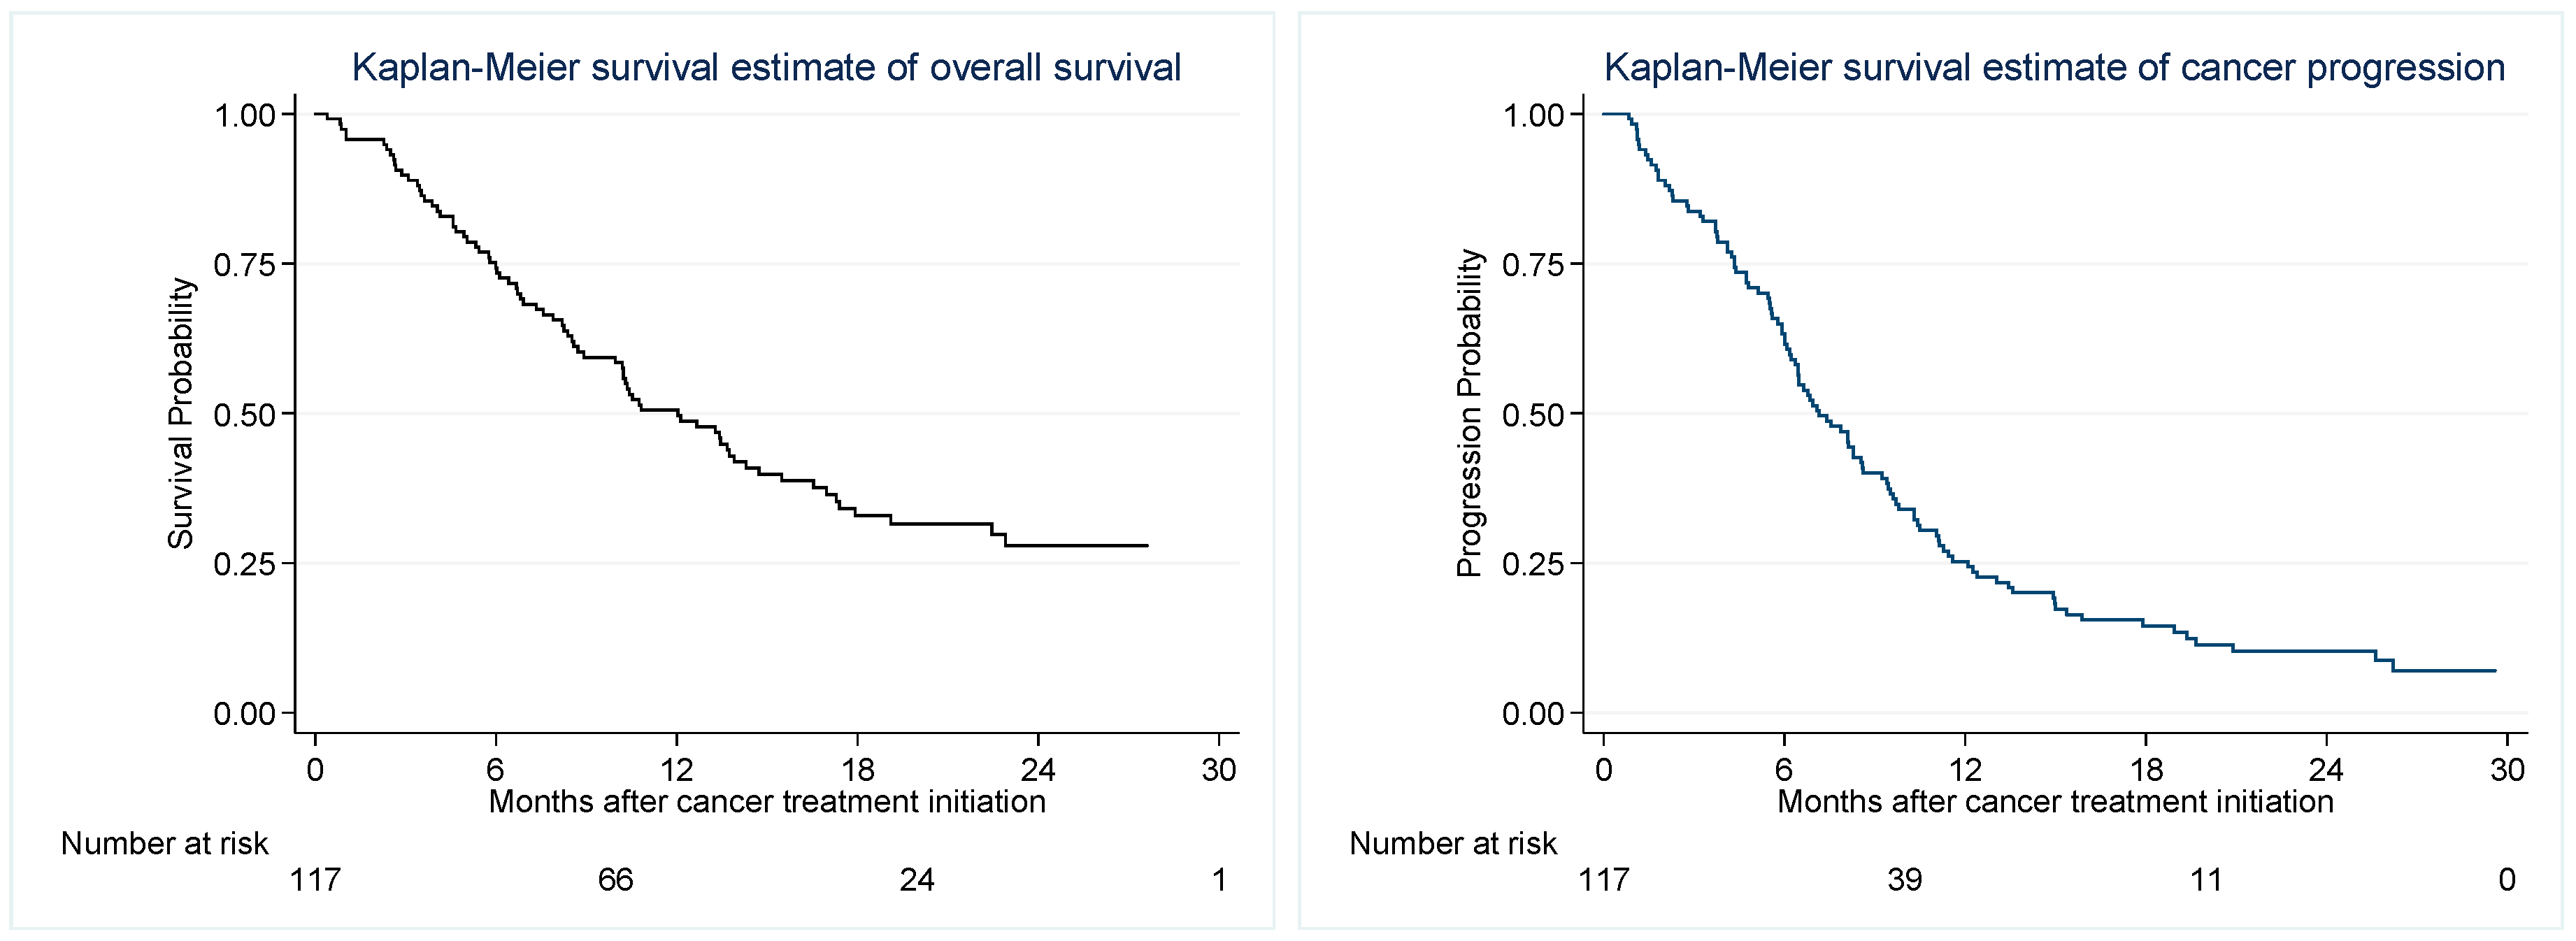
2.4. Progression Free and Overall Survival
2.5. Risk Model Development
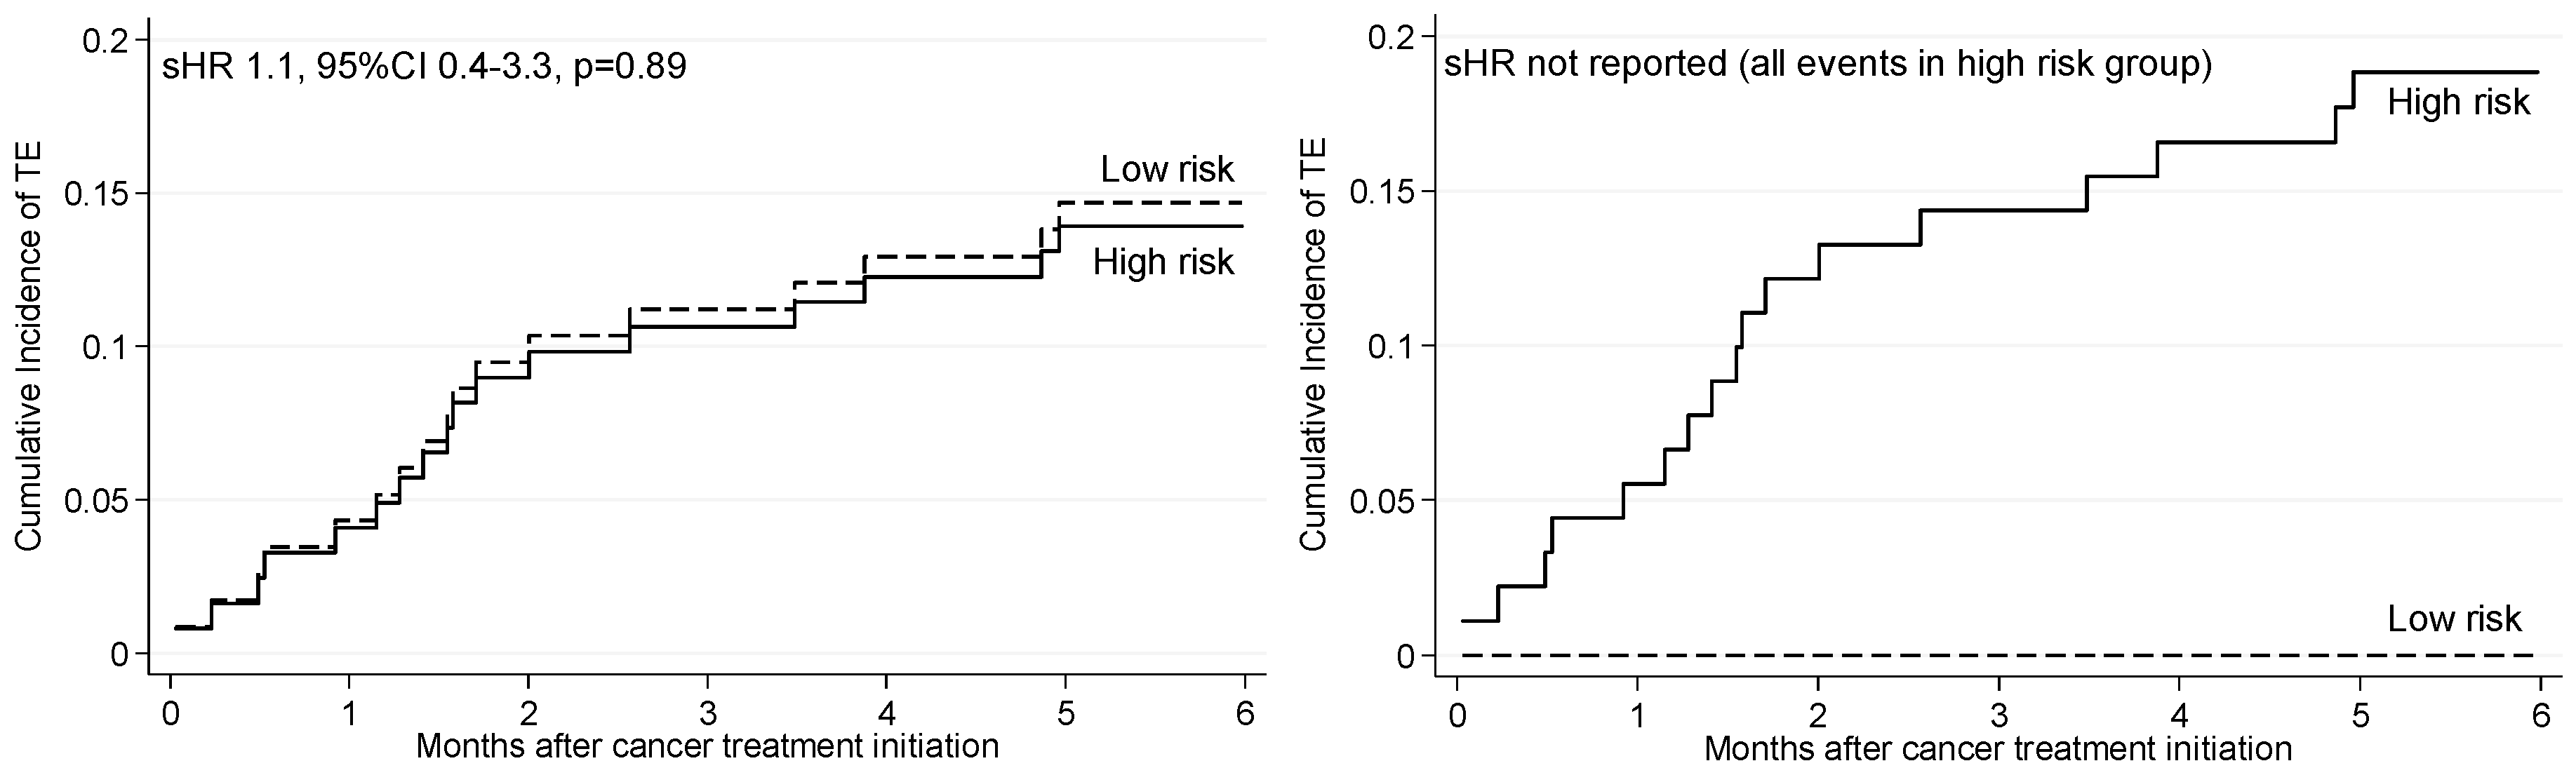
2.6. Risk and Rates of TE According to Published Risk Models
2.7. Progression and Mortality According to TE Risk Classification
3. Discussion
4. Materials and Methods
4.1. Biomarker Selection
4.2. Cohort Selection
4.3. Data Collection
4.4. Blood Samples
4.5. Outcomes
4.6. Sample Size
4.7. Statistical Analysis
5. Conclusions
Supplementary Materials
Author Contributions
Funding
Conflicts of Interest
References
- Ma, L.; Wen, Z. Risk factors and prognosis of pulmonary embolism in patients with lung cancer. Medicine 2017, 96, e6638. [Google Scholar] [CrossRef] [Green Version]
- Khorana, A.A.; Dalal, M.R.; Lin, J.; Connolly, G.C. Health care costs associated with venous thromboembolism in selected high-risk ambulatory patients with solid tumors undergoing chemotherapy in the United States. Clinicoecon. Outcomes Res. 2013, 5, 101–108. [Google Scholar] [CrossRef] [PubMed]
- Trujillo-Santos, J.; Nieto, J.A.; Tiberio, G.; Piccioli, A.; Di Micco, P.; Prandoni, P.; Monreal, M. Predicting recurrences or major bleeding in cancer patients with venous thromboembolism. Findings from the RIETE Registry. Thromb. Haemost. 2008, 100, 435–439. [Google Scholar] [CrossRef]
- Schulman, S.; Lindmarker, P.; Holmstrom, M.; Larfars, G.; Carlsson, A.; Nicol, P.; Svensson, E.; Ljungberg, B.; Viering, S.; Nordlander, S.; et al. Post-thrombotic syndrome, recurrence, and death 10 years after the first episode of venous thromboembolism treated with warfarin for 6 weeks or 6 months. J. Thromb. Haemost. 2006, 4, 734–742. [Google Scholar] [CrossRef] [PubMed]
- Alexander, M.; Kirsa, S.; Wolfe, R.; MacManus, M.; Ball, D.; Solomon, B.; Burbury, K. Thromboembolism in lung cancer—An area of urgent unmet need. Lung Cancer 2014, 84, 275–280. [Google Scholar] [CrossRef] [PubMed]
- Moore, R.A.; Adel, N.; Riedel, E.; Bhutani, M.; Feldman, D.R.; Tabbara, N.E.; Soff, G.; Parameswaran, R.; Hassoun, H. High incidence of thromboembolic events in patients treated with cisplatin-based chemotherapy: A large retrospective analysis. J. Clin. Oncol. 2011, 29, 3466–3473. [Google Scholar] [CrossRef]
- Mellema, W.W.; van der Hoek, D.; Postmus, P.E.; Smit, E.F. Retrospective evaluation of thromboembolic events in patients with non-small cell lung cancer treated with platinum-based chemotherapy. Lung Cancer 2014, 86, 73–77. [Google Scholar] [CrossRef] [PubMed]
- Bhat, A.; Surapaneni, R.; Hageboutros, A.; Milcarek, B.; Hunter, K.; Coakley, S.; Ferber, A. The Incidence and Outcome of Venous Thrombo-Embolism (VTE) In Non-Small Cell Lung Cancer Patients with Adenocarcinoma Histology In Comparison with Squamous Histology. Blood 2010, 116, 4221. [Google Scholar]
- Macbeth, F.; Noble, S.; Evans, J.; Ahmed, S.; Cohen, D.; Hood, K.; Knoyle, D.; Linnane, S.; Longo, M.; Moore, B.; et al. Randomized Phase III Trial of Standard Therapy Plus Low Molecular Weight Heparin in Patients With Lung Cancer: FRAGMATIC Trial. J. Clin. Oncol. 2016, 34, 488–494. [Google Scholar] [CrossRef] [Green Version]
- Haas, S.K.; Freund, M.; Heigener, D.; Heilmann, L.; Kemkes-Matthes, B.; von Tempelhoff, G.F.; Melzer, N.; Kakkar, A.K.; Investigators, T. Low-molecular-weight heparin versus placebo for the prevention of venous thromboembolism in metastatic breast cancer or stage III/IV lung cancer. Clin. Appl. Thromb. Hemost. 2012, 18, 159–165. [Google Scholar] [CrossRef]
- Agnelli, G.; George, D.J.; Kakkar, A.K.; Fisher, W.; Lassen, M.R.; Mismetti, P.; Mouret, P.; Chaudhari, U.; Lawson, F.; Turpie, A.G.; et al. Semuloparin for thromboprophylaxis in patients receiving chemotherapy for cancer. N. Engl. J. Med. 2012, 366, 601–609. [Google Scholar] [CrossRef]
- Agnelli, G.; Gussoni, G.; Bianchini, C.; Verso, M.; Tonato, M. A Randomized Double-Blind Placebo-Controlled Study on Nadroparin for Prophylaxis of Thromboembolic Events in Cancer Patients Receiving Chemotherapy: The PROTECHT Study. Blood 2008, 112, 6. [Google Scholar]
- Burbury, K.; MacManus, M. The Coagulome and the Oncomir: Impact of cancer-associated hemostatic dysregulation on the risk of metastasis. Clin. Exp. Metastasis 2018, 35, 237–246. [Google Scholar] [CrossRef] [PubMed]
- Amirkhosravi, A.; Mousa, S.A.; Amaya, M.; Francis, J.L. Antimetastatic effect of tinzaparin, a low-molecular-weight heparin. J. Thromb. Haemost. 2003, 1, 1972–1976. [Google Scholar] [CrossRef] [Green Version]
- Mousa, S.A.; Linhardt, R.; Francis, J.L.; Amirkhosravi, A. Anti-metastatic effect of a non-anticoagulant low-molecular-weight heparin versus the standar d low-molecular-weight heparin, enoxaparin. Thromb. Haemost. 2006, 96, 816–821. [Google Scholar] [PubMed]
- Di Nisio, M.; Porreca, E.; Candeloro, M.; De Tursi, M.; Russi, I.; Rutjes, A.W. Primary prophylaxis for venous thromboembolism in ambulatory cancer patients receiving chemotherapy. Cochrane Database Syst. Rev. 2016, 12, CD008500. [Google Scholar] [CrossRef]
- Fuentes, H.E.; Oramas, D.M.; Paz, L.H.; Casanegra, A.I.; Mansfield, A.S.; Tafur, A.J. Meta-analysis on anticoagulation and prevention of thrombosis and mortality among patients with lung cancer. Thromb. Res. 2017, 154, 28–34. [Google Scholar] [CrossRef]
- Lyman, G.H.; Bohlke, K.; Khorana, A.A.; Kuderer, N.M.; Lee, A.Y.; Arcelus, J.I.; Balaban, E.P.; Clarke, J.M.; Flowers, C.R.; Francis, C.W.; et al. Venous thromboembolism prophylaxis and treatment in patients with cancer: American society of clinical oncology clinical practice guideline update 2014. J. Clin. Oncol. 2015, 33, 654–656. [Google Scholar] [CrossRef]
- Mandala, M.; Falanga, A.; Roila, F.; Group, E.G.W. Management of venous thromboembolism (VTE) in cancer patients: ESMO Clinical Practice Guidelines. Ann. Oncol. 2011, 22 (Suppl. 6), vi85–vi92. [Google Scholar] [CrossRef]
- Streiff, M.B.; Holmstrom, B.; Angelini, D.; Ashrani, A.; Bockenstedt, P.L.; Chesney, C.; Fanikos, J.; Fenninger, R.B.; Fogerty, A.E.; Gao, S.; et al. NCCN Guidelines Insights: Cancer-Associated Venous Thromboembolic Disease, Version 2.2018. J. Natl. Compr. Canc. Netw. 2018, 16, 1289–1303. [Google Scholar] [CrossRef]
- Khorana, A.A.; Dalal, M.; Tangirala, K.; Miao, R. Higher Incidence of Venous Thromboembolism in the Outpatient Versus the Inpatient Setting among U.S. Cancer Patients. Blood 2011, 118, 674. [Google Scholar]
- Khorana, A.A.; Kuderer, N.M.; Culakova, E.; Lyman, G.H.; Francis, C.W. Development and validation of a predictive model for chemotherapy-associated thrombosis. Blood 2008, 111, 4902–4907. [Google Scholar] [CrossRef] [PubMed] [Green Version]
- Ay, C.; Dunkler, D.; Marosi, C.; Chiriac, A.L.; Vormittag, R.; Simanek, R.; Quehenberger, P.; Zielinski, C.; Pabinger, I. Prediction of venous thromboembolism in cancer patients. Blood 2010, 116, 5377–5382. [Google Scholar] [CrossRef] [PubMed] [Green Version]
- Verso, M.; Agnelli, G.; Barni, S.; Gasparini, G.; LaBianca, R. A modified Khorana risk assessment score for venous thromboembolism in cancer patients receiving chemotherapy: The Protecht score. Intern. Emerg. Med. 2012, 7, 291–292. [Google Scholar] [CrossRef] [PubMed]
- Pelzer, U.; Sinn, M.; Stieler, J.; Riess, H. Primary pharmacological prevention of thromboembolic events in ambulatory patients with advanced pancreatic cancer treated with chemotherapy? Dtsch. Med. Wochenschr. (1946) 2013, 138, 2084–2088. [Google Scholar]
- Pabinger, I.; van Es, N.; Heinze, G.; Posch, F.; Riedl, J.; Reitter, E.M.; Di Nisio, M.; Cesarman-Maus, G.; Kraaijpoel, N.; Zielinski, C.C.; et al. A clinical prediction model for cancer-associated venous thromboembolism: A development and validation study in two independent prospective cohorts. Lancet Haematol. 2018, 5, e289–e298. [Google Scholar] [CrossRef]
- Mansfield, A.S.; Tafur, A.J.; Wang, C.E.; Kourelis, T.V.; Wysokinska, E.M.; Yang, P. Predictors of active cancer thromboembolic outcomes: Validation of the Khorana score among patients with lung cancer. J. Thromb. Haemost. 2016, 14, 1773–1778. [Google Scholar] [CrossRef] [PubMed]
- Noble, S.; Alikhan, R.; Robbins, A.; Macbeth, F.; Hood, K. Predictors of active cancer thromboembolic outcomes: Validation of the Khorana score among patients with lung cancer: Comment. J. Thromb. Haemost. 2017, 15, 590–591. [Google Scholar] [CrossRef]
- Khorana, A.A.; Vadhan-Raj, S.; Kuderer, N.M.; Wun, T.; Liebman, H.; Soff, G.; Belani, C.; O’Reilly, E.M.; McBane, R.; Eikelboom, J.; et al. Rivaroxaban for Preventing Venous Thromboembolism in High-Risk Ambulatory Patients with Cancer: Rationale and Design of the CASSINI Trial. Rationale and Design of the CASSINI Trial. Thromb. Haemost. 2017, 117, 2135–2145. [Google Scholar]
- Kimpton, M.; Wells, P.S.; Carrier, M. Apixaban for the prevention of venous thromboembolism in high-risk ambulatory cancer patients receiving chemotherapy: Rational and design of the AVERT trial. Thromb. Res. 2018, 164 (Suppl. 1), S124–S129. [Google Scholar] [CrossRef]
- Walker, A.J.; Card, T.R.; West, J.; Crooks, C.; Grainge, M.J. Incidence of venous thromboembolism in patients with cancer—A cohort study using linked United Kingdom databases. Eur. J. Cancer 2013, 49, 1404–1413. [Google Scholar] [CrossRef] [PubMed]
- Connolly, G.C.; Dalal, M.; Lin, J.; Khorana, A.A. Incidence and predictors of venous thromboembolism (VTE) among ambulatory patients with lung cancer. Lung Cancer 2012, 78, 253–258. [Google Scholar] [CrossRef] [PubMed]
- Khorana, A.A.; Dalal, M.; Lin, J.; Connolly, G.C. Incidence and predictors of venous thromboembolism (VTE) among ambulatory high-risk cancer patients undergoing chemotherapy in the United States. Cancer 2013, 119, 648–655. [Google Scholar] [CrossRef] [PubMed]
- Sanford, D.; Naidu, A.; Alizadeh, N.; Lazo-Langner, A. The effect of low molecular weight heparin on survival in cancer patients: An updated systematic review and meta-analysis of randomized trials. J. Thromb. Haemost. 2014, 12, 1076–1085. [Google Scholar] [CrossRef] [PubMed]
- Carrier, M.; Abou-Nassar, K.; Mallick, R.; Tagalakis, V.; Shivakumar, S.; Schattner, A.; Kuruvilla, P.; Hill, D.; Spadafora, S.; Marquis, K.; et al. Apixaban to Prevent Venous Thromboembolism in Patients with Cancer. N. Engl. J. Med. 2018. [Google Scholar] [CrossRef] [PubMed]
- Khorana, A.A.; Soff, G.A.; Kakkar, A.K.; Vadhan-Raj, S.; Riess, H.; Wun, T.; Streiff, M.B.; Garcia, D.A.; Liebman, H.A.; Belani, C.; et al. Rivaroxaban Thromboprophylaxis in High-Risk Ambulatory Cancer Patients Receiving Systemic Therapy: Results of a Randomized Clinical Trial (CASSINI)—Abstract LBA-1. In Proceedings of the ASH Annual Meeting, San Diego, CA, USA, 4 December 2018; Available online: https://ash.confex.com/ash/2018/webprogram/Paper120738.html (accessed on 10 December 2018).
- Ettinger, D.S.; Wood, D.E.; Akerley, W.; Bazhenova, L.A.; Borghaei, H.; Camidge, D.R.; Cheney, R.T.; Chirieac, L.R.; D’Amico, T.A.; Dilling, T.J.; et al. NCCN Guidelines Insights: Non-Small Cell Lung Cancer, Version 4.2016. J. Natl. Compr. Cancer Netw. 2016, 14, 255–264. [Google Scholar] [CrossRef]
- Khorana, A.A.; Carrier, M.; Garcia, D.A.; Lee, A.Y. Guidance for the prevention and treatment of cancer-associated venous thromboembolism. J. Thromb. Thrombolysis 2016, 41, 81–91. [Google Scholar] [CrossRef] [Green Version]
- van Es, N.; Di Nisio, M.; Cesarman, G.; Kleinjan, A.; Otten, H.M.; Mahe, I.; Wilts, I.T.; Twint, D.C.; Porreca, E.; Arrieta, O.; et al. Comparison of risk prediction scores for venous thromboembolism in cancer patients: A prospective cohort study. Haematologica 2017, 102, 1494–1501. [Google Scholar] [CrossRef]
- Colinet, B.; Jacot, W.; Bertrand, D.; Lacombe, S.; Bozonnat, M.C.; Daures, J.P.; Pujol, J.L.; oncoLR Health Network. A new simplified comorbidity score as a prognostic factor in non-small-cell lung cancer patients: Description and comparison with the Charlson’s index. Br. J. Cancer 2005, 93, 1098–1105. [Google Scholar] [CrossRef]
- Charlson, M.E.; Pompei, P.; Ales, K.L.; MacKenzie, C.R. A new method of classifying prognostic comorbidity in longitudinal studies: Development and validation. J. Chronic Dis. 1987, 40, 373–383. [Google Scholar] [CrossRef]
- Ay, C.; Posch, F.; Kaider, A.; Zielinski, C.; Pabinger, I. Estimating risk of venous thromboembolism in patients with cancer in the presence of competing mortality. J. Thromb. Haemost. 2015, 13, 390–397. [Google Scholar] [CrossRef] [PubMed] [Green Version]
- Gu, X.; Sun, S.; Gao, X.S.; Xiong, W.; Qin, S.; Qi, X.; Ma, M.; Li, X.; Zhou, D.; Wang, W.; et al. Prognostic value of platelet to lymphocyte ratio in non-small cell lung cancer: Evidence from 3430 patients. Sci. Rep. 2016, 6, 23893. [Google Scholar] [CrossRef] [PubMed]
- Zhao, Q.T.; Yang, Y.; Xu, S.; Zhang, X.P.; Wang, H.E.; Zhang, H.; Wang, Z.K.; Yuan, Z.; Duan, G.C. Prognostic role of neutrophil to lymphocyte ratio in lung cancers: A meta-analysis including 7054 patients. OncoTargets Ther. 2015, 8, 2731–2738. [Google Scholar]
- Eisenhauer, E.A.; Therasse, P.; Bogaerts, J.; Schwartz, L.H.; Sargent, D.; Ford, R.; Dancey, J.; Arbuck, S.; Gwyther, S.; Mooney, M.; et al. New response evaluation criteria in solid tumours: Revised RECIST guideline (version 1.1). Eur. J. Cancer 2009, 45, 228–247. [Google Scholar] [CrossRef] [PubMed]
- StataCorp. Stata Statistical Software: Release 14; StataCorp LP: College Station, TX, USA, 2015. [Google Scholar]


| Characteristic | BIOTEL (n = 117) | BIOTEGIC (n = 71) |
|---|---|---|
| Patient characteristic | ||
| Male sex, n (%) | 74 (63) | 42 (59) |
| Median age (range), years | 67 (44—89) | 63 (31–90) |
| Stage I-IIIA, n (%) | 57 (49) | 43 (61) |
| Stage IV, n (%) | 60 (51) | 28 (39) |
| ECOG performance status ≥ 2, n (%) | 86 (74) | 10 (14) |
| Previous thromboembolism, n (%) | 9 (8) | 2 (3) |
| Primary treatment, n (%) | ||
| Chemoradiotherapy | 47 (36) | 50 (70) |
| Chemotherapy | 36 (28) | 18 (25) |
| Radiotherapy | 34 (26) | 3 (4) |
| Curative | 15 (44) | 3 (100) |
| Palliative | (56) | 0 (0) |
| Risk Factor | All (n = 117) | Chemotherapy (n = 83) | ||||
|---|---|---|---|---|---|---|
| sHR 1 | 95% CI | p | sHR1 | 95% CI | p | |
| Baseline Biomarkers | ||||||
| D-dimer, continuous | 1.8 | 0.7–4.7 | 0.23 | 2.1 | 0.8–5.6 | 0.14 |
| D-dimer ≥ 0.5 mg/L | All events in high risk group | All events in high risk group | ||||
| D-dimer ≥ 1.5 mg/L | 1.6 | 0.6–4.4 | 0.38 | 2.1 | 0.8–5.8 | 0.16 |
| Fibrinogen ≥ 4.0 g/L | 1.2 | 0.3–4.3 | 0.80 | 1.4 | 0.4–5.5 | 0.60 |
| Platelet count ≥ 350 × 109/L | 1.2 | 0.5–3.3 | 0.69 | 1.5 | 0.6–4.1 | 0.40 |
| Haemoglobin < 100 g/L | 0.7 | 0.1–4.6 | 0.70 | 1.2 | 0.2–7.3 | 0.84 |
| White cell count ≥ 11.0 × 10⁹/L | 0.9 | 0.3–2.4 | 0.82 | 0.9 | 0.3–2.5 | 0.86 |
| NLR ≥ 5.0 | 0.4 | 0.1–1.1 | 0.07 | 0.4 | 0.1–1.2 | 0.11 |
| PLR ≥ 300 | 0.7 | 0.2–2.5 | 0.59 | 0.9 | 0.3–2.9 | 0.90 |
| TEG-MA ≥ 76 mm | 0.8 | 0.3–2.4 | 0.68 | 1.2 | 0.4–3.7 | 0.71 |
| TEG-Angle ≥ 77 degrees | 1.7 | 0.6–4.7 | 0.34 | 1.7 | 0.6–5.0 | 0.34 |
| TEG-R ≤4.5 min | 1.8 | 0.7–4.9 | 0.20 | 1.3 | 0.5–3.7 | 0.60 |
| TEG-K ≤0.9 min | 1.5 | 0.5–4.4 | 0.47 | 1.5 | 0.5–4.8 | 0.46 |
| Month 1 Biomarkers | ||||||
| D-dimer ≥ 1.5 mg/L | 1.6 | 0.6–4.4 | 0.33 | 1.6 | 0.6–4.6 | 0.35 |
| Fibrinogen ≥ 6.0 g/L | 1.5 | 0.6–4.3 | 0.40 | 2.3 | 0.8–6.6 | 0.11 |
| Platelet count ≥ 350 × 109/L | 1.7 | 0.6–4.7 | 0.27 | 2.3 | 0.8–6.5 | 0.10 |
| Combined Biomarkers | ||||||
| Baseline d-dimer ≥ 0.5 mg/L and fibrinogen ≥ 4.0 g/L | 2.1 | 0.5–7.8 | 0.29 | 2.7 | 0.7–10.8 | 0.16 |
| Baseline d-dimer ≥ 1.5 mg/L or month 1 d-dimer ≥ 1.5 mg/L | 2.6 | 0.8–7.7 | 0.10 | 3.1 | 1.0–9.8 | 0.05 |
| TEG-R ≤4.5 min and TEG-K ≤0.9 min | 2.8 | 0.9–8.7 | 0.08 | 1.8 | 0.5–6.0 | 0.34 |
| Baseline d-dimer ≥ 0.5 mg/L and fibrinogen ≥ 4.0 g/L, or baseline d-dimer ≥ 1.5 mg/L | 6.1 | 0.8–49.0 | 0.09 | 8.5 | 1.0–71.4 | 0.05 |
| Baseline d-dimer ≥ 0.5 mg/L and fibrinogen ≥ 4.0 g/L, or baseline d-dimer ≥ 1.5 mg/L, or month 1 d-dimer ≥ 1.5 mg/L | All events in high risk group | All events in high risk group | ||||
| Clinical Factors | ||||||
| Treatment factors | ||||||
| Chemo (CRT/CHT) vs. RT | 6.7 | 0.8–53.3 | 0.07 | Not applicable | ||
| Disease factors | ||||||
| Stage IV (vs. I-III) | 1.1 | 0.3–4.2 | 0.83 | 1.1 | 0.3–4.2 | 0.85 |
| Stage IIIB/IV (vs. I-IIIA) | 1.7 | 0.6–5.0 | 0.30 | 1.2 | 0.4–3.5 | 0.71 |
| New (vs. recurrent) | 2.4 | 0.5–10.2 | 0.25 | 1.5 | 0.3–6.3 | 0.25 |
| Adenocarcinoma (vs. other) | 1.3 | 0.5–3.2 | 0.62 | 1.3 | 0.5–3.8 | 0.58 |
| Patient factors | ||||||
| Age ≥ 70 years | 2.6 | 1.0–7.0 | 0.06 | 0.4 | 0.2–1.2 | 0.11 |
| Female sex | 1.5 | 0.6–3.8 | 0.43 | 1.4 | 0.5–4.0 | 0.49 |
| BMI>30 kg/m2 2 | 0.7 | 0.2–3.2 | 0.66 | 0.5 | 0.1–4.2 | 0.52 |
| ECOG PS ≥ 2 | 5.9 | 0.8–41.9 | 0.08 | 8.6 | 1.2–63.0 | 0.03 |
| Ever smoker | 2.0 | 0.3–15.9 | 0.50 | 1.7 | 0.2–12.9 | 0.63 |
| Colinet score >9 | 1.7 | 0.4–4.0 | 0.68 | 1.2 | 0.4–3.8 | 0.74 |
| Charlson score >3 | 2.2 | 0.8–6.1 | 0.12 | 1.9 | 0.7–5.1 | 0.22 |
| Prognosis | ||||||
| Progression ≤6 months | 1.1 | 0.4–2.9 | 0.91 | 1.4 | 0.6–3.5 | 0.48 |
| Death ≤6 months | 1.2 | 0.5–3.1 | 0.64 | 1.4 | 0.5–4.1 | 0.59 |
| Model | Risk Assessment | Score | High Risk |
|---|---|---|---|
| Study Derived | Fibrinogen ≥ 4.0 and D-dimer ≥ 0.5 | 1 | Score ≥ 1 |
| D-dimer ≥ 1.5 | 1 | ||
| D-dimer ≥ 1.5 month 1 | 1 | ||
| Khorana | Very high risk tumour site (stomach, pancreas) | 2 | Score ≥ 3 1 or Score ≥ 2 2 |
| High risk tumour site (lung, lymphoma, gynecologic, genitourinary excluding prostate) | 1 | ||
| Platelet >350 × 109/L | 1 | ||
| Hb < 100 g/L or use of ESA | 1 | ||
| Leukocyte count > 11 × 109/L | 1 | ||
| BMI ≥ 35 kg/m2 | 1 | ||
| CATS | As for Khorana score but add: | Score ≥ 3 3 | |
| Soluble P-selectin ≥ 53.1 ng/mL | 1 | ||
| D-dimer ≥ 1.44 ug/mL | 1 | ||
| CONKO | As for Khorana score but remove BMI≥ 35 kg/m2 and add: | Score ≥ 3 3 | |
| ECOG PS ≥ 2 | 1 | ||
| PROTECHT | As for Khorana score and add: | Score ≥ 3 3 | |
| Gemcitabine chemotherapy | 1 | ||
| Platinum chemotherapy | 1 | ||
| CATS/MICA 5 | Tumour-site risk category (low or intermediate) | 0 | Score ≥ 110 4 |
| Tumour-site risk category (high) | 50 | ||
| Tumour-site risk category (very high) | 95 | ||
| D-dimer concentration (0.1–0.5 ug/mL) | 0–10 | ||
| D-dimer concentration (0.5–2.0 ug/mL) | 10–30 | ||
| D-dimer concentration (2.0–8.0 ug/mL) | 30–60 | ||
| D-dimer concentration (>8.0 ug/mL) | >60 |
| Risk Model | Cohort | High Risk | Low Risk | Prediction of Thromboembolism | Prediction of Mortality | Prediction of Progression | ||||||||
|---|---|---|---|---|---|---|---|---|---|---|---|---|---|---|
| No. (%) | Cum. TE % a | No. (%) | Cum. TE %a | Sensitivity (95% CI) | Specificity (95% CI) | PPV (95% CI) | NPV (95% CI) | sHR b (95% CI), p-Value | BIC c | AUC d (95% CI) | HR e (95% CI), p-Value f | HR e (95% CI), p-Value f | ||
| Model 1 g,i | CHT | 60 (72) | 26.5 | 23 (28) | 0.0 | 100 (79–100) | 34 (23–47) | 27 (16–40) | 100 (85–100) | All TE in high risk group | 127 | 0.67 (0.61–0.73) | 2.2 (1.2–4.2), 0.015 | 1.9 (1.2–3.2), p = 0.011 |
| Model 1 g,i | CHT/ RT | 60 (51) | 26.5 | 57 (49) | 3.1 | 100 (81–100) | 27 (19–37) | 19 (11–29) | 100 (87–100) | All TE in high risk group | NR e | 0.64 (0.59–0.68) | 1.5 (0.9–2.3), 0.096 | 1.6 (1.1–2.4), p = 0.018 |
| Model 2 g,j | CHT | 56 (67) | 26.6 | 27 (33) | 3.7 | 94 (70–100) | 39 (27–52) | 27 (16–40) | 96 (81–100) | 8.2 (1.1–61.6), p = 0.04 | 135 | 0.66 (0.58–0.75) | 1.6 (0.9–2.9), 0.078 | 1.5 (0.9–2.4), p = 0.081 |
| Model 3 g,k | CHT | 49 (59) | 30.6 | 34 (41) | 2.9 | 94 (70–100) | 49 (37–62) | 31 (18–45) | 97 (85–100) | 12.3 (1.7–91.8), p = 0.01 | 131 | 0.72 (0.62–0.80) | 2.4 (1.4–4.2), 0.0001 | 2.2 (1.5–3.4), p = 0.002 |
| Khorana g,l | CHT | 20 (24) | 20.2 | 63 (76) | 18.9 | 25 (7–52) | 76 (64–86) | 20 (6–44) | 81 (69–90) | 1.1 (0.4–3.3), p = 0.89 | 143 | 0.51 (0.39–0.63) | 2.01 (1.2–3.4), 0.005 | 1.9 (1.2–3.2), p = 0.002 |
| PROTECHT g,m | CHT | 53 (64) | 20.9 | 30 (36) | 16.3 | 69 (41–89) | 37 (26–50) | 21 (11–34) | 83 (65–94) | 1.3 (0.5–3.7), p = 0.60 | 142 | 0.53 (0.40–0.66) | 1.8 (1.1–2.9), 0.013 | 1.9 (1.2–2.8), 0.002 |
| CONKO g,n | CHT | 40 (48) | 25.0 | 43 (52) | 13.8 | 63 (35–85) | 55 (43–67) | 25 (13–41) | 86 (72–95) | 1.9 (0.7–5.3), p = 0.71 | 141 | 0.59 (0.45–0.73) | 2.6 (1.7–4.2), <0.001 | 2.8 (1.9–4.2), <0.001 |
| CATS h,o | CHT | - | - | - | - | 64 (NR) | 82 (NR) | 20 (NR) | 97 (NR) | - | - | - | - | - |
© 2019 by the authors. Licensee MDPI, Basel, Switzerland. This article is an open access article distributed under the terms and conditions of the Creative Commons Attribution (CC BY) license (http://creativecommons.org/licenses/by/4.0/).
Share and Cite
Alexander, M.; Ball, D.; Solomon, B.; MacManus, M.; Manser, R.; Riedel, B.; Westerman, D.; Evans, S.M.; Wolfe, R.; Burbury, K. Dynamic Thromboembolic Risk Modelling to Target Appropriate Preventative Strategies for Patients with Non-Small Cell Lung Cancer. Cancers 2019, 11, 50. https://doi.org/10.3390/cancers11010050
Alexander M, Ball D, Solomon B, MacManus M, Manser R, Riedel B, Westerman D, Evans SM, Wolfe R, Burbury K. Dynamic Thromboembolic Risk Modelling to Target Appropriate Preventative Strategies for Patients with Non-Small Cell Lung Cancer. Cancers. 2019; 11(1):50. https://doi.org/10.3390/cancers11010050
Chicago/Turabian StyleAlexander, Marliese, David Ball, Benjamin Solomon, Michael MacManus, Renee Manser, Bernhard Riedel, David Westerman, Sue M. Evans, Rory Wolfe, and Kate Burbury. 2019. "Dynamic Thromboembolic Risk Modelling to Target Appropriate Preventative Strategies for Patients with Non-Small Cell Lung Cancer" Cancers 11, no. 1: 50. https://doi.org/10.3390/cancers11010050