JAK/STAT-Activating Genomic Alterations Are a Hallmark of T-PLL

 , , , , and
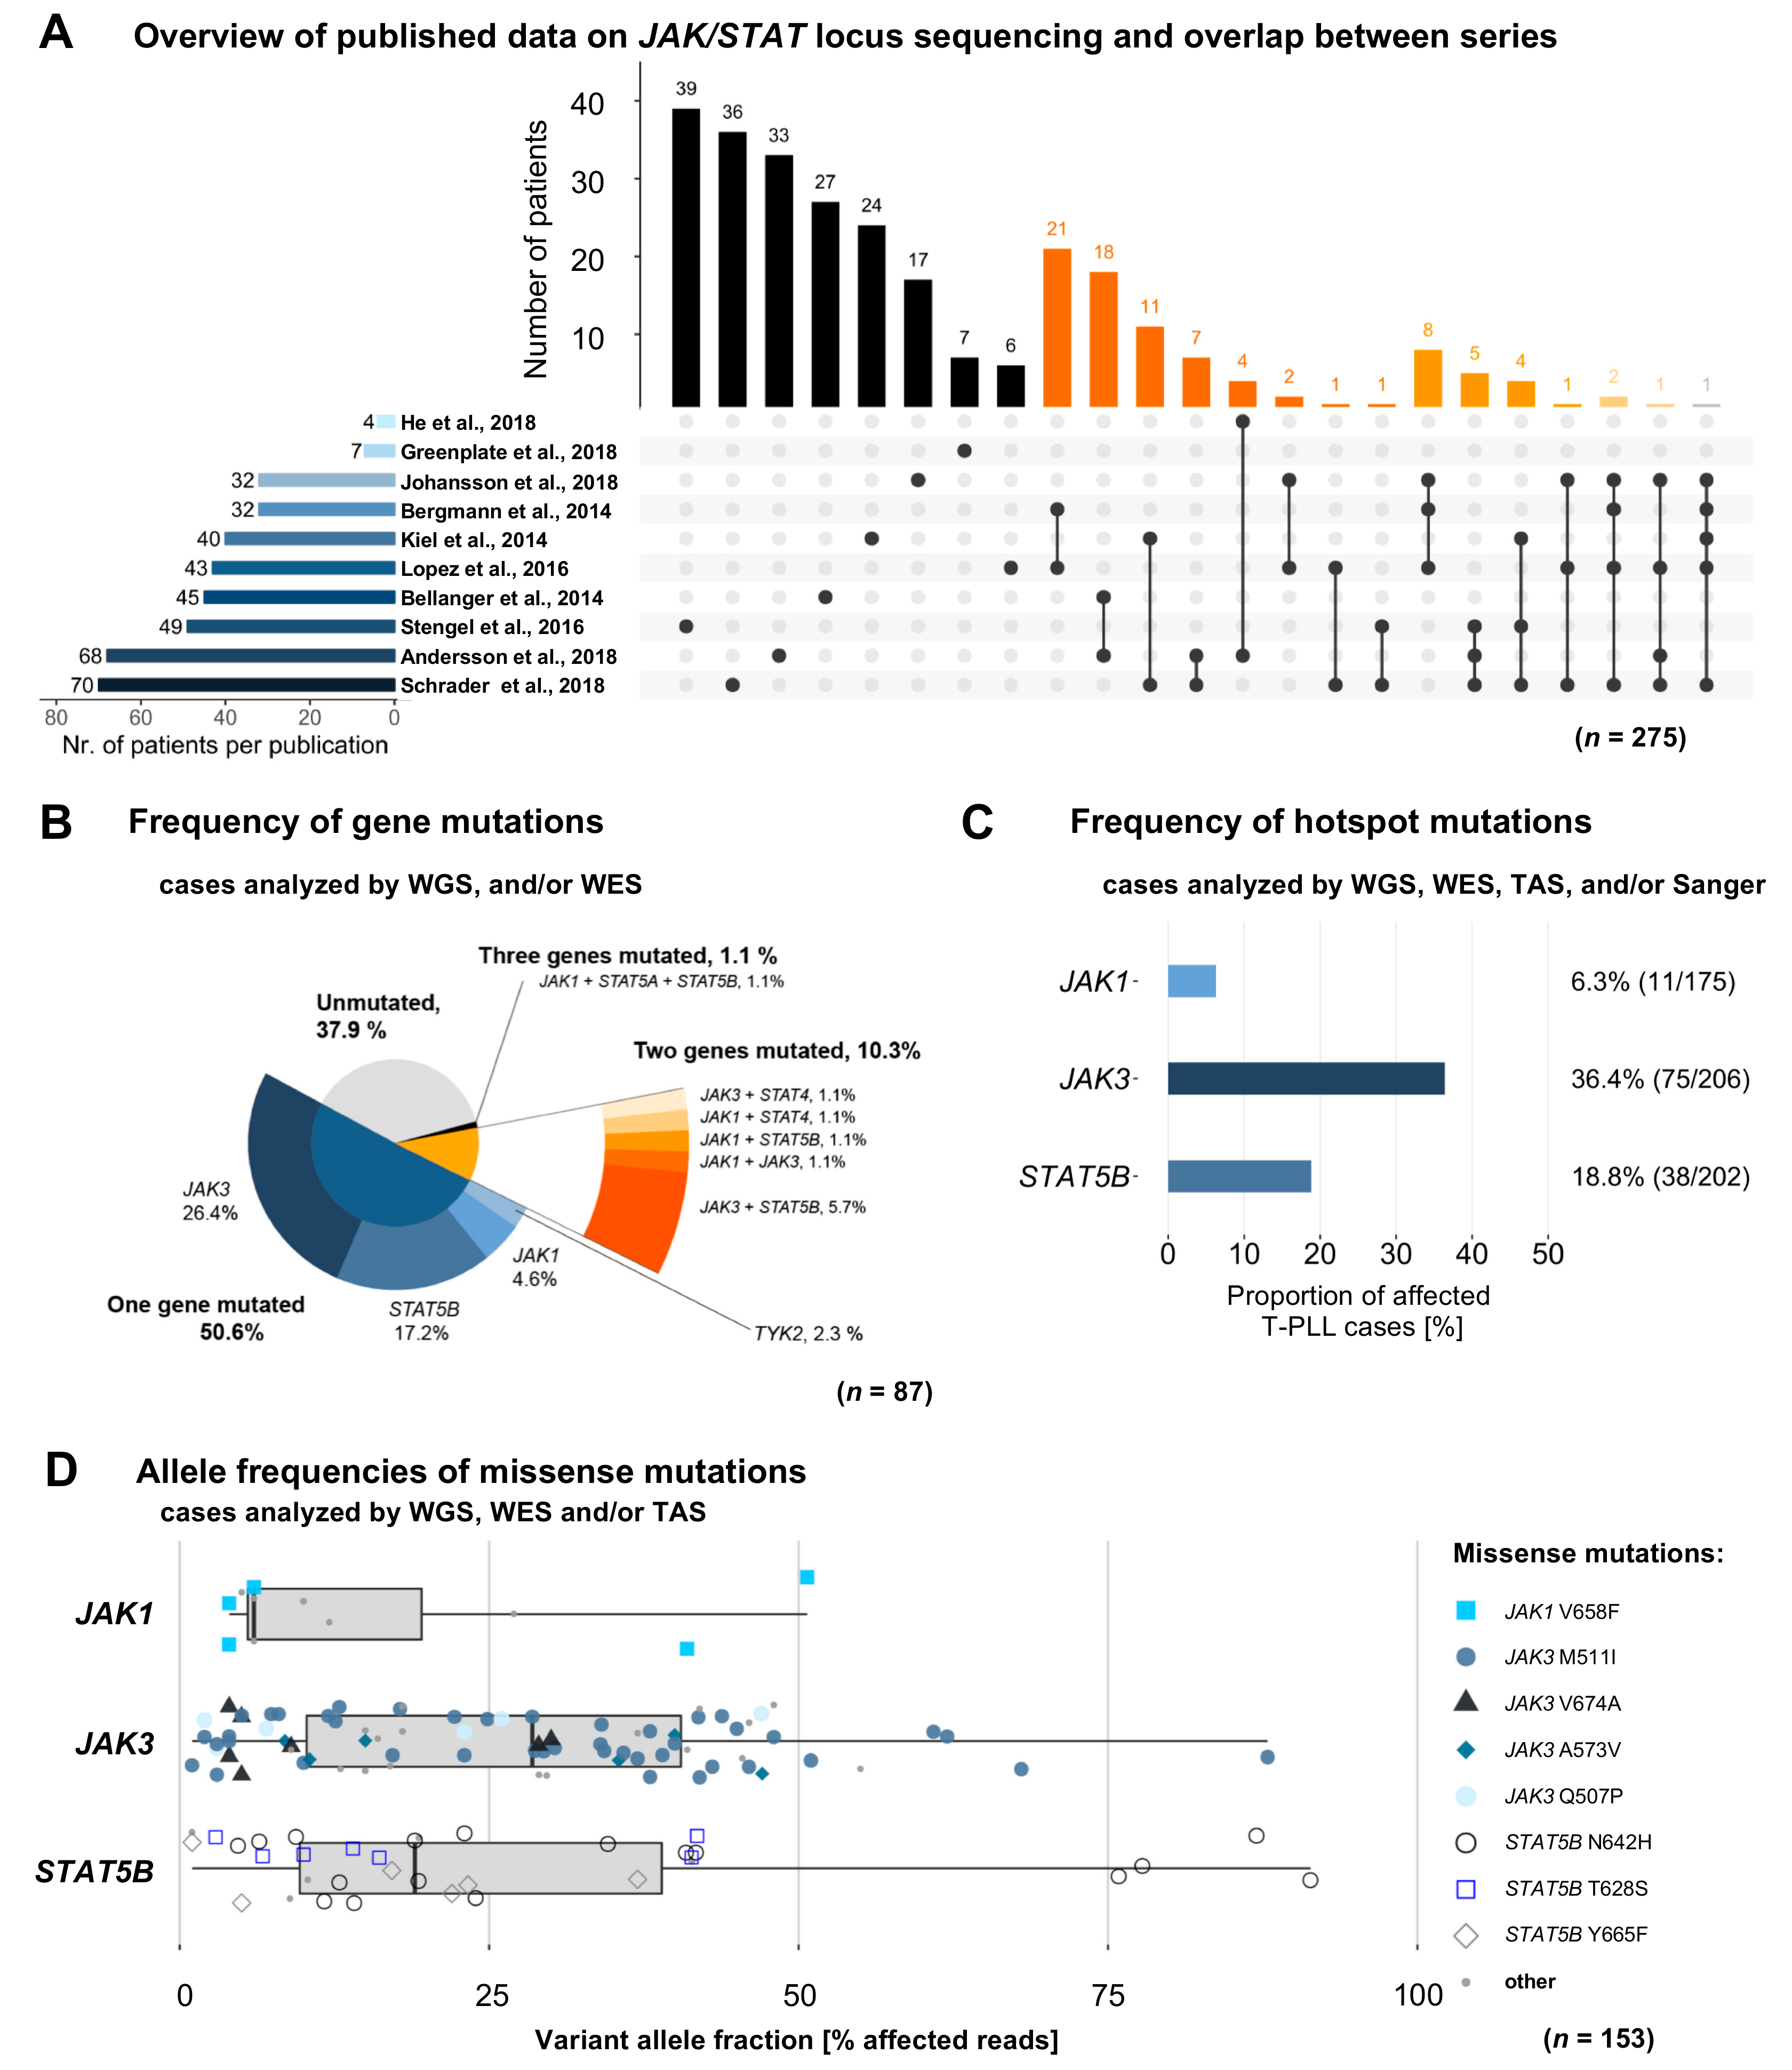
Abstract
:1. Introduction
2. Results
2.1. Characteristics and Overlaps of Included Studies
2.2. Mutations in JAK and STAT Genes are Predominantly Found at Subclonal Levels
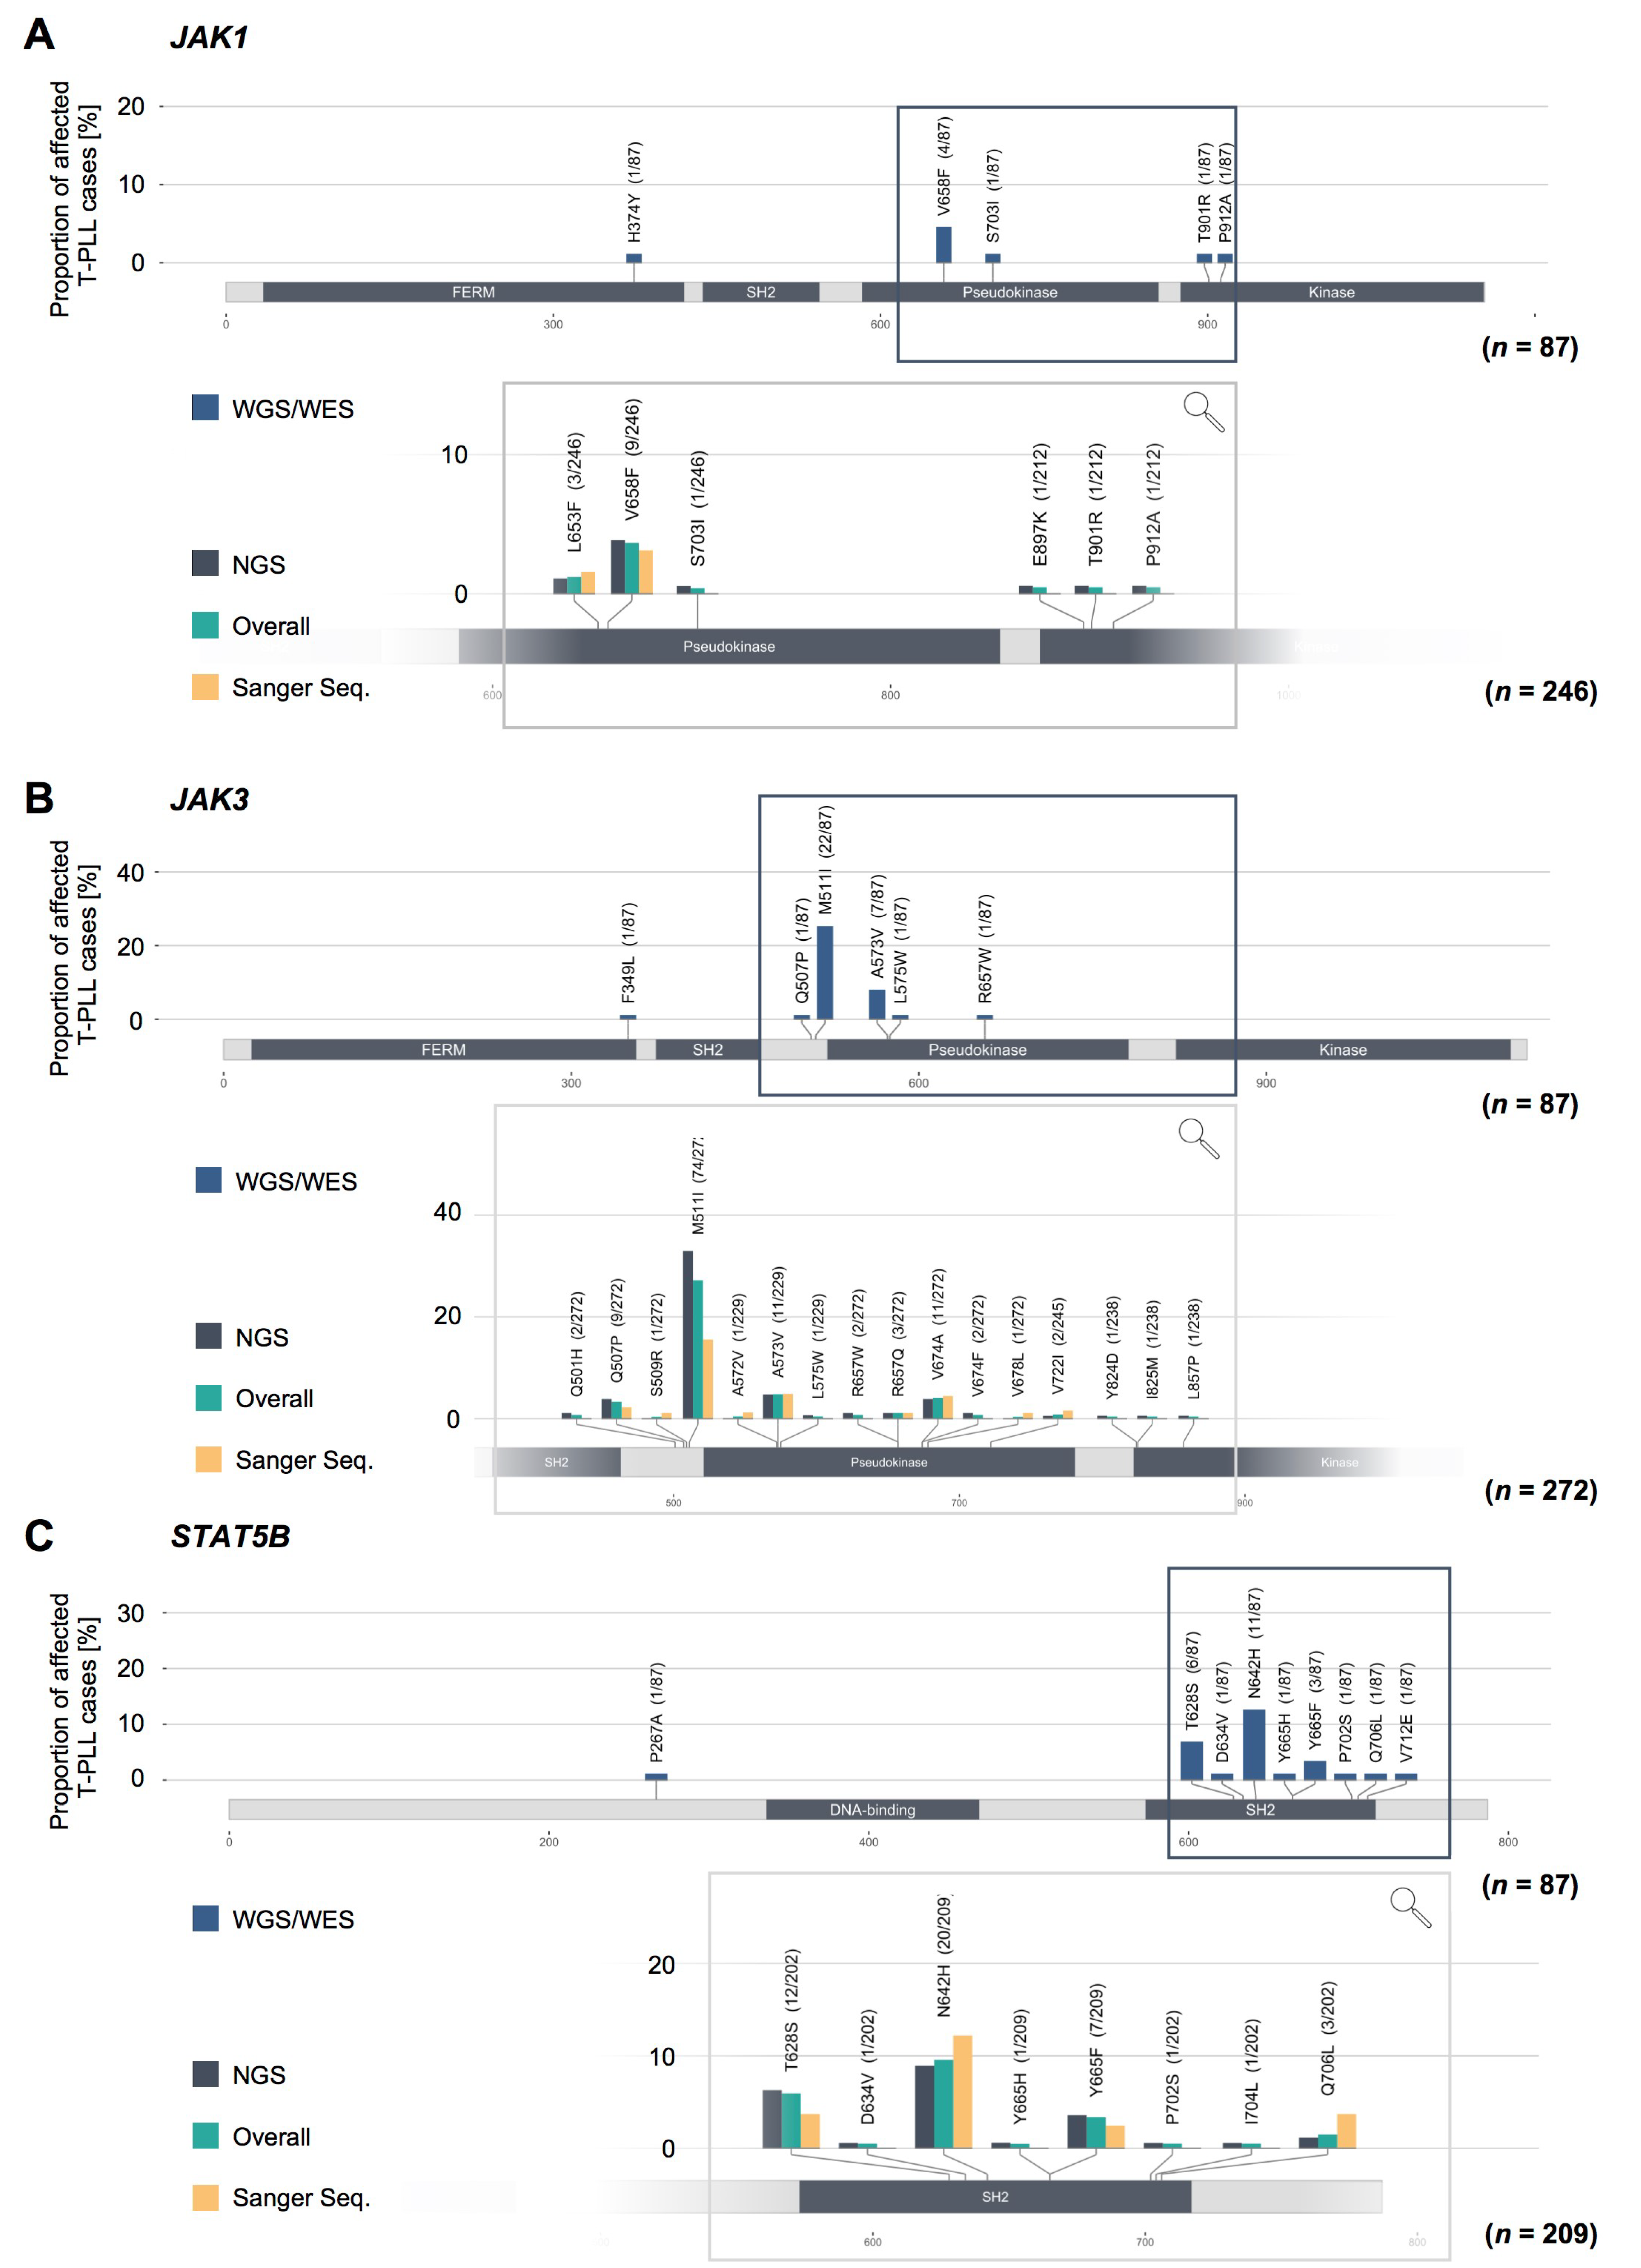
2.3. Missense Mutations in JAK1, JAK3, and STAT5B Cluster Within the Conserved Pseudokinase and SH2 Domains
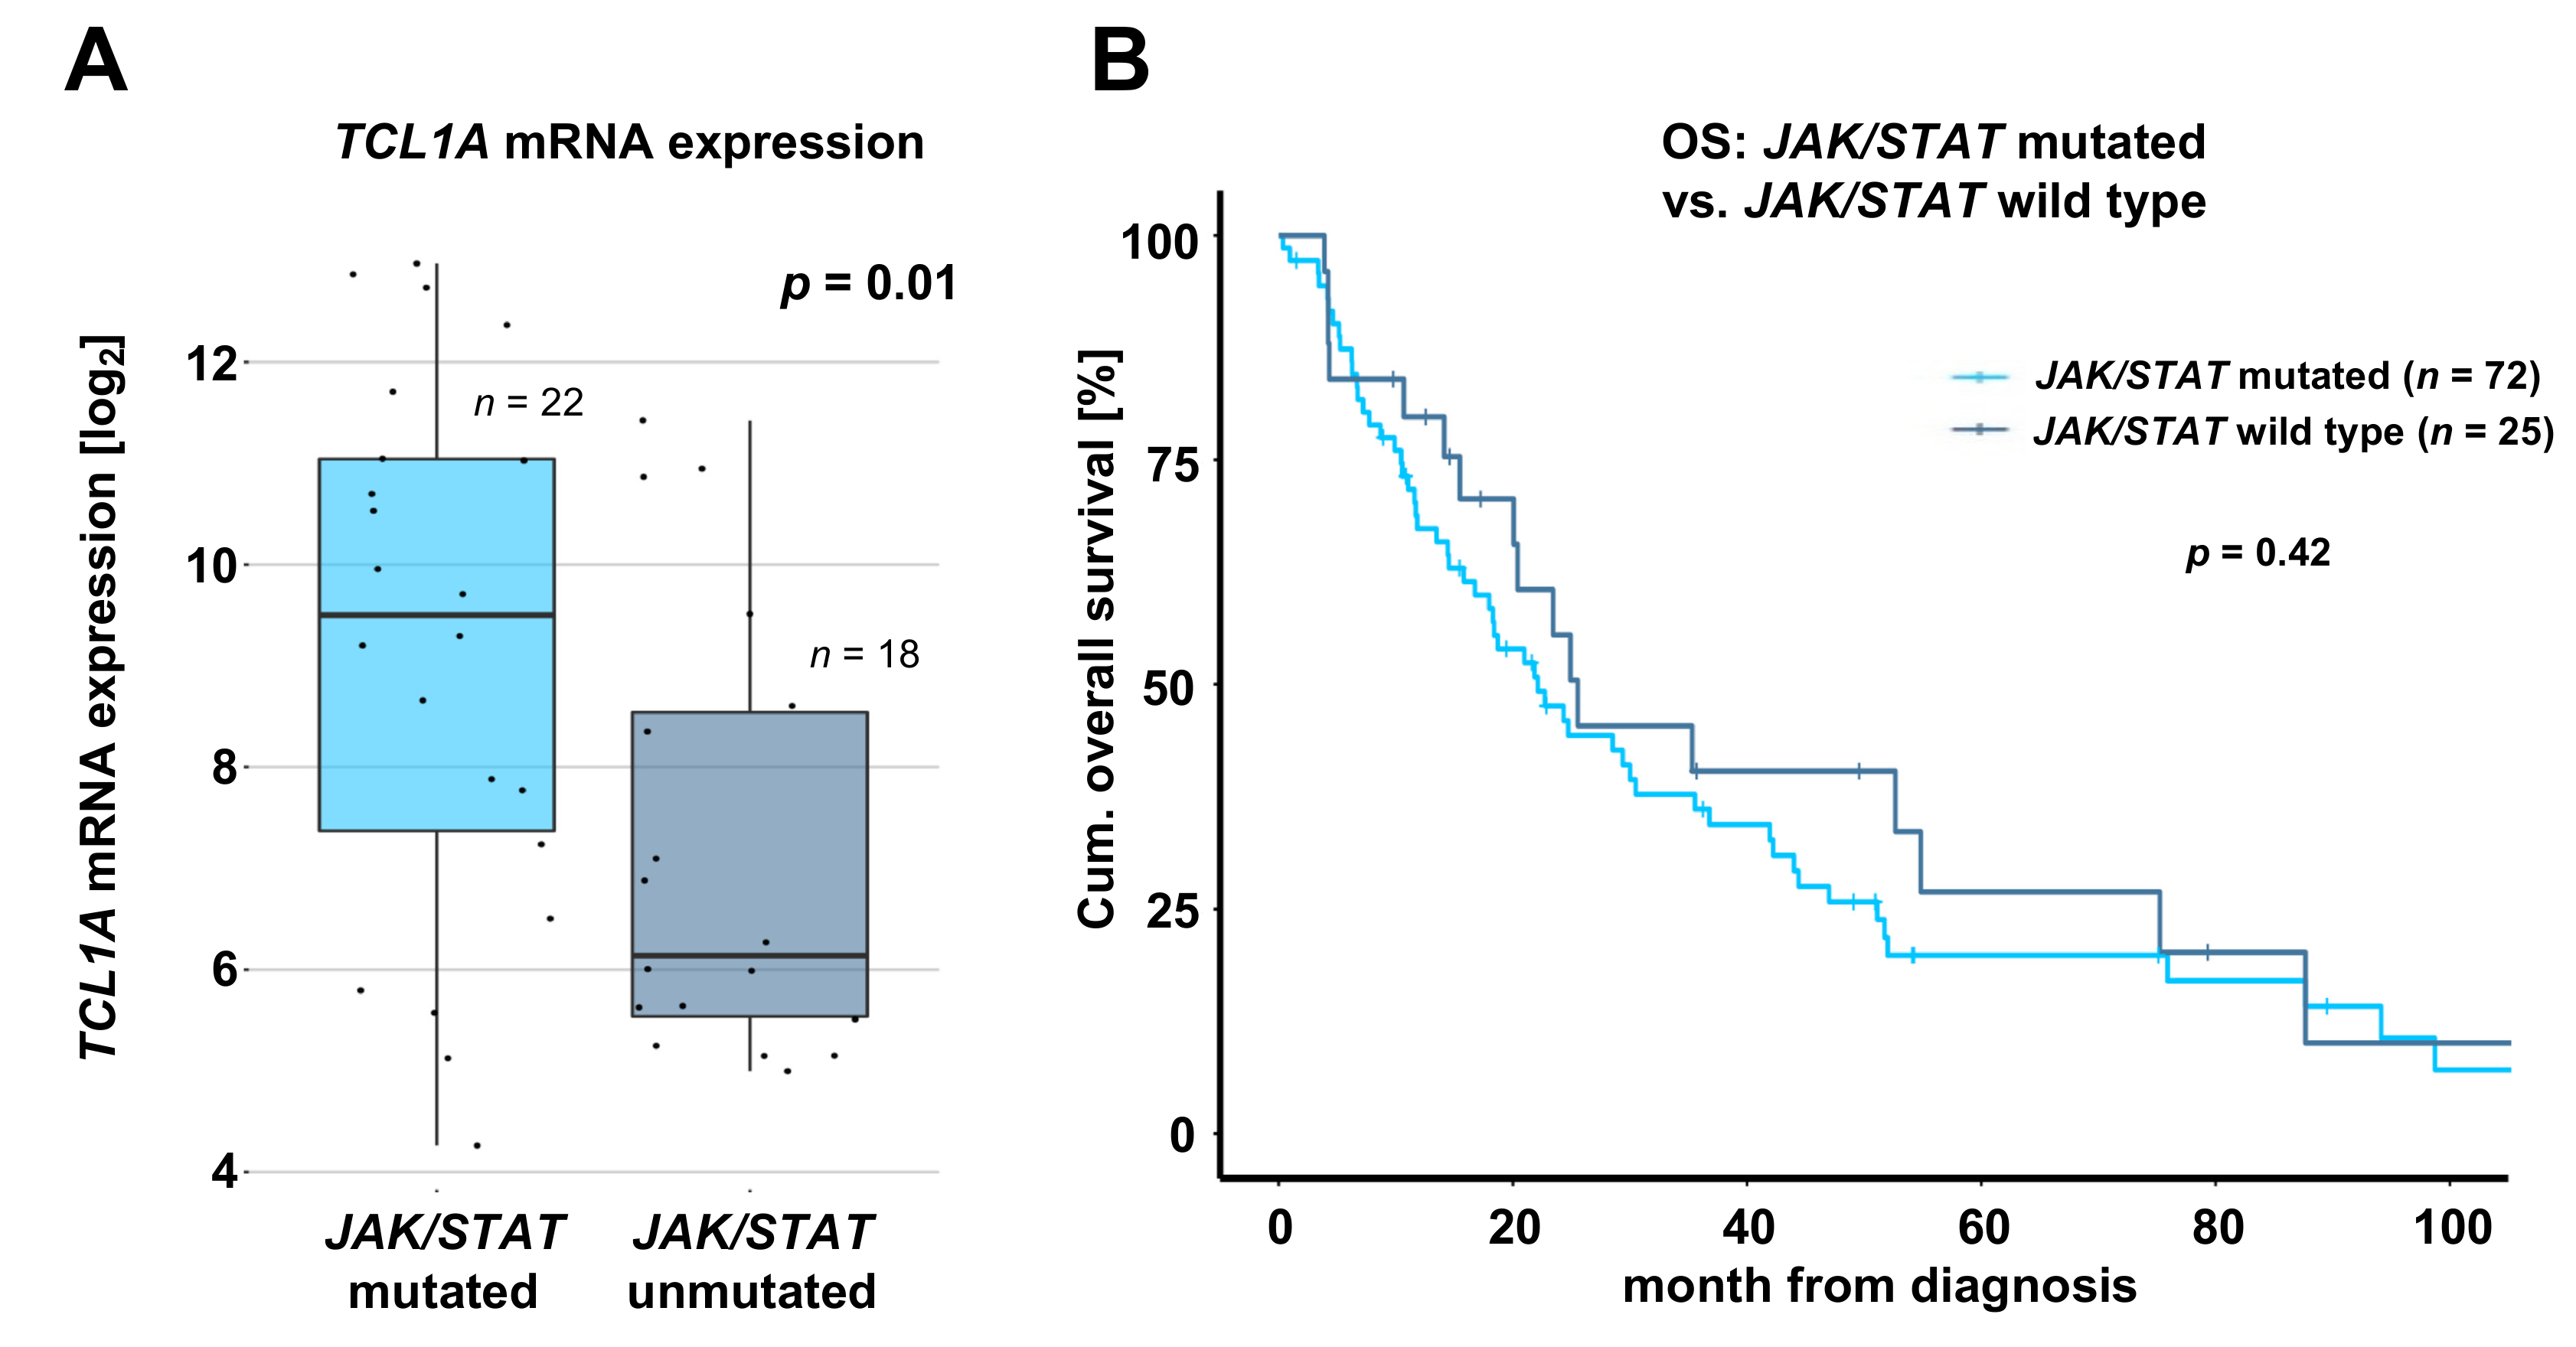
2.4. T-PLL Harboring any JAK or STAT Mutation Show Elevated TCL1A mRNA Level, but Present Comparable Clinical Outcomes
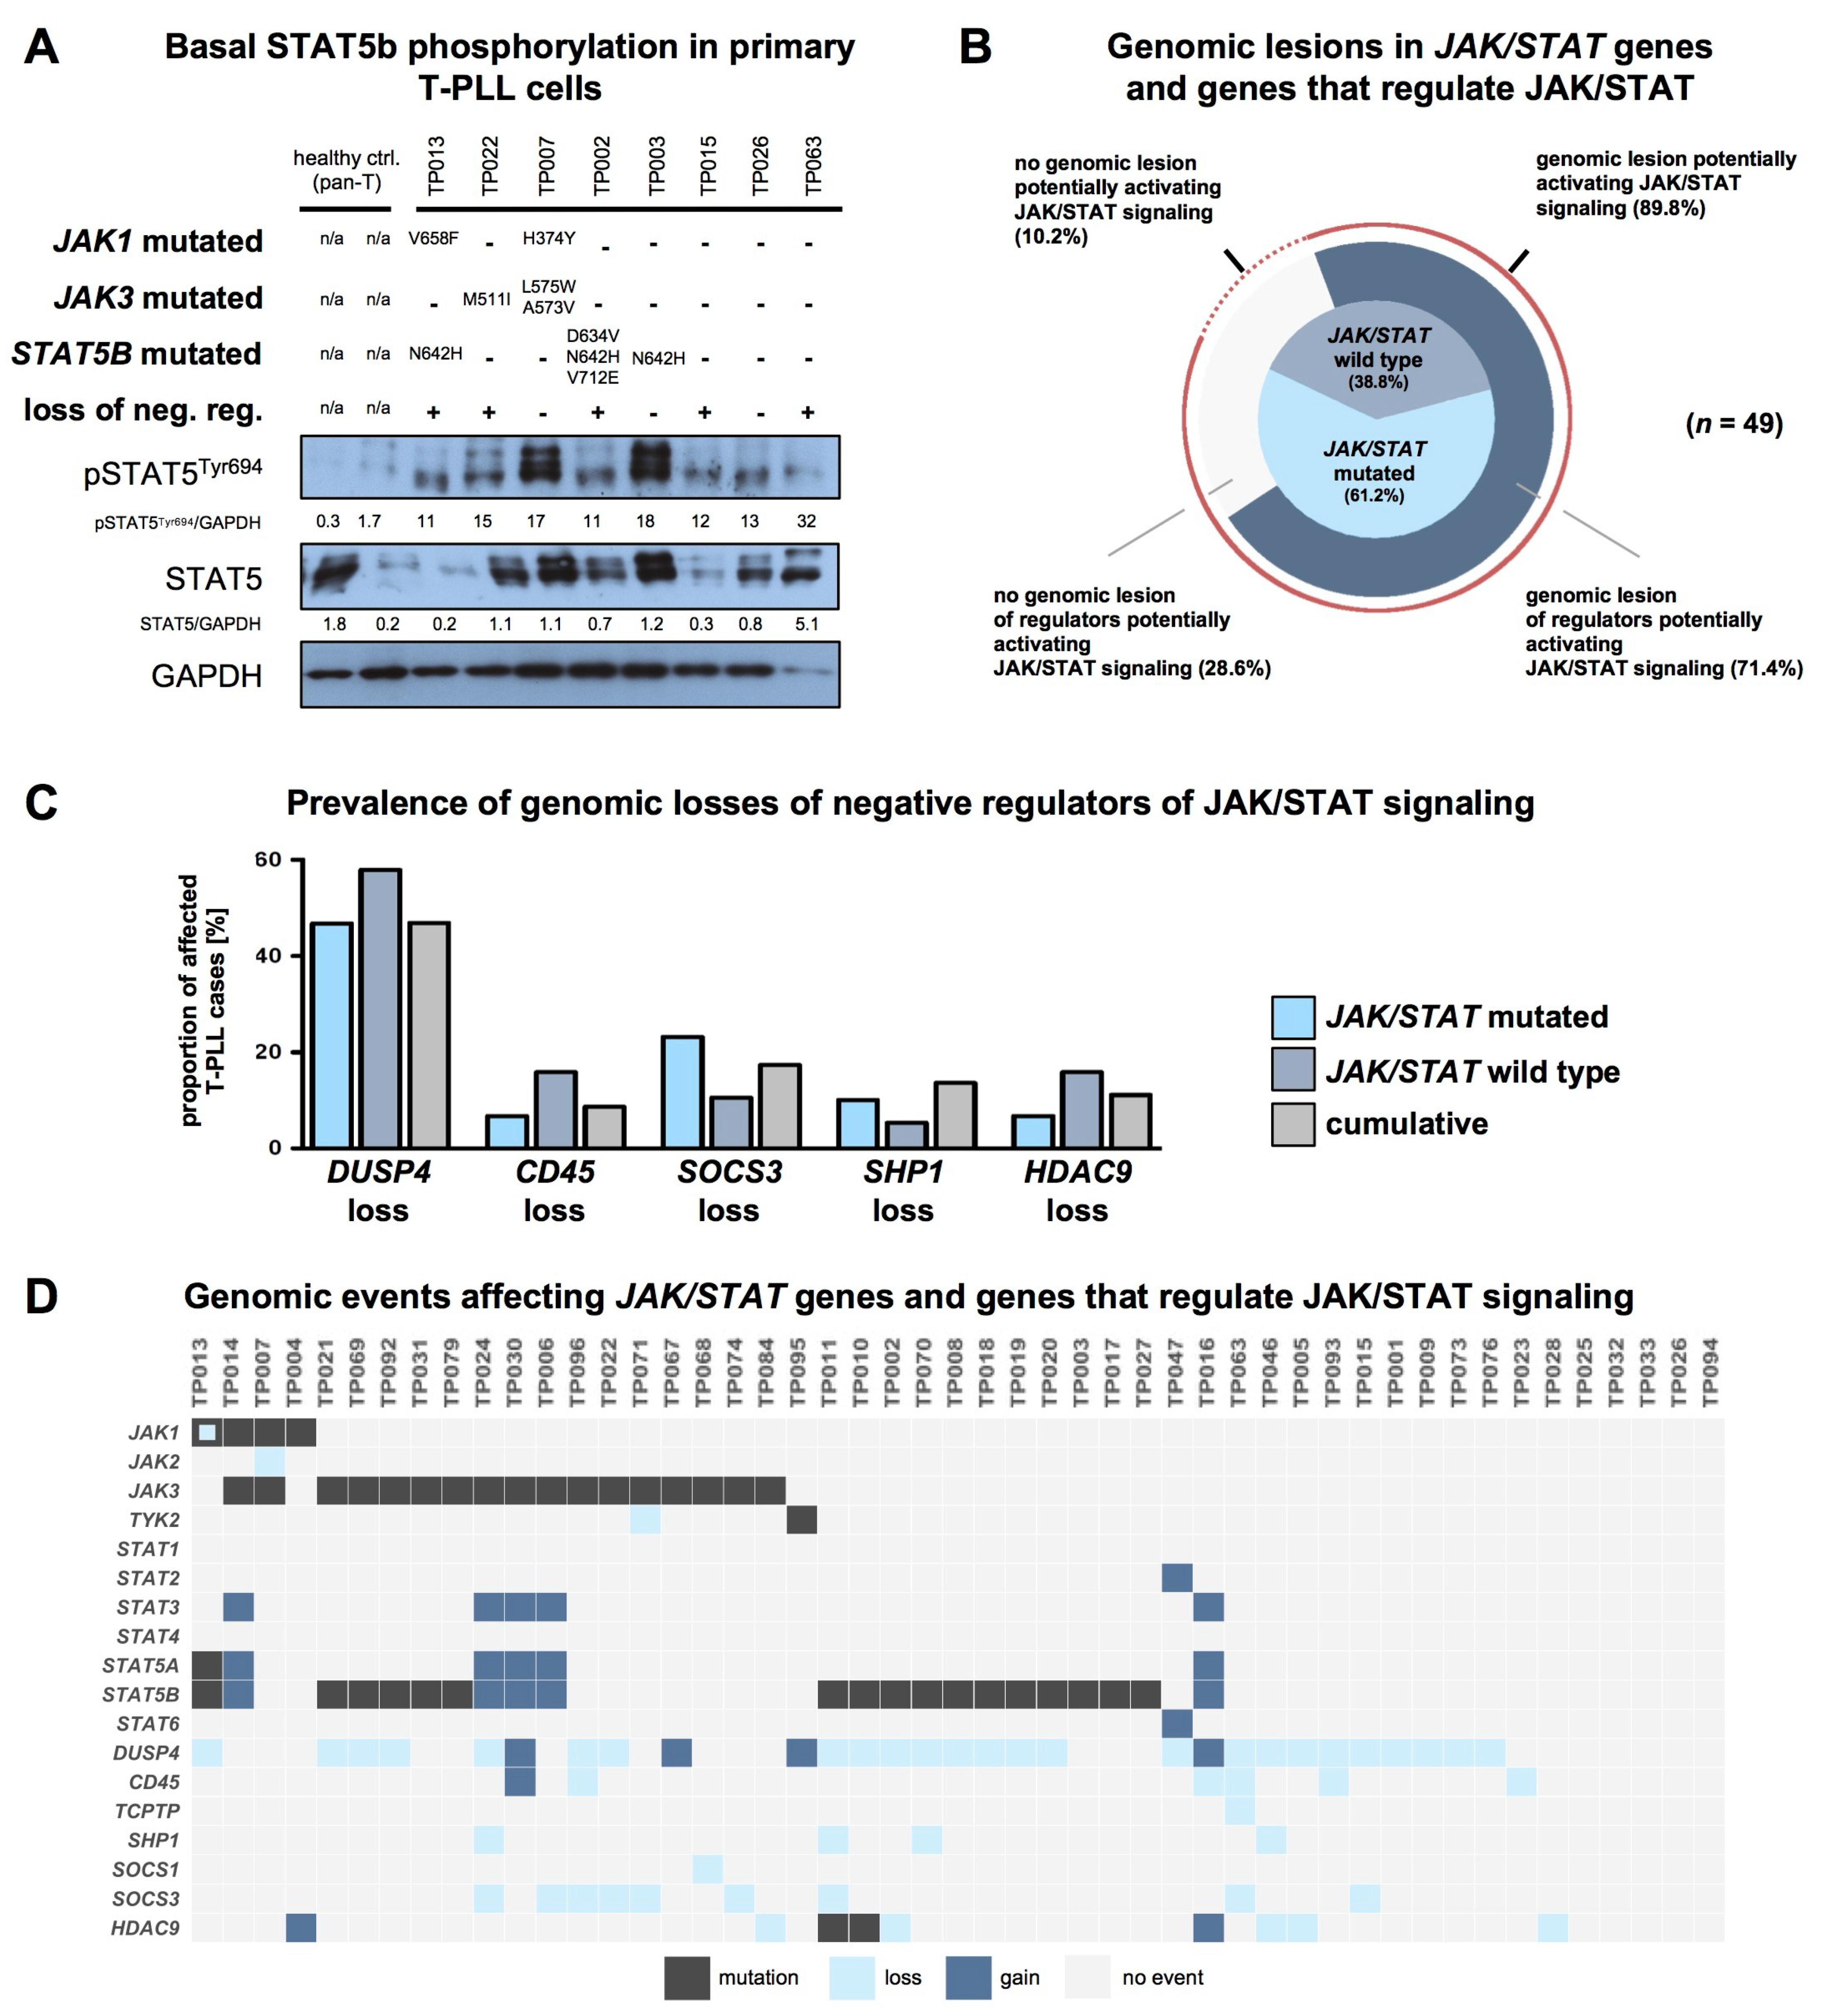
2.5. T-PLL Cells Show Basal STAT5B Phosphorylation, Regardless of Their JAK/STAT Mutation Status
3. Discussion
4. Materials and Methods
4.1. Data Acquisition
4.2. Data Merging
4.3. Raw Data Analysis
4.3.1. Whole-Exome Sequencing (WES)
4.3.2. Somatic Copy-Number Alterations (sCNAs)
4.3.3. Gene Expression Profiling (GEP)
4.4. Clinical Data and Statistical Analyses
4.5. Immunoblots
4.6. Data Accessibility
5. Conclusions
Supplementary Materials
Author Contributions
Funding
Acknowledgments
Conflicts of Interest
References
- Staber, P.B.; Herling, M.; Bellido, M.; Jacobsen, E.D.; Davids, M.S.; Kadia, T.M.; Shustov, A.; Tournilhac, O.; Bachy, E.; Zaja, F.; et al. Consensus criteria for diagnosis, staging, and treatment response assessment of T-cell prolymphocytic leukemia. Blood 2019, 134, 1132–1143. [Google Scholar] [CrossRef] [PubMed]
- Herling, M.; Khoury, J.D.; Washington, L.T.; Duvic, M.; Keating, M.J.; Jones, D. A systematic approach to diagnosis of mature T-cell leukemias reveals heterogeneity among WHO categories. Blood 2004, 104, 328–335. [Google Scholar] [CrossRef] [PubMed]
- Dearden, C. How i treat prolymphocytic leukemia. Blood 2012, 120, 538–551. [Google Scholar] [CrossRef] [PubMed]
- Hopfinger, G.; Busch, R.; Pflug, N.; Weit, N.; Westermann, A.; Fink, A.M.; Cramer, P.; Reinart, N.; Winkler, D.; Fingerle-Rowson, G.; et al. Sequential chemoimmunotherapy of fludarabine, mitoxantrone, and cyclophosphamide induction followed by alemtuzumab consolidation is effective in T-cell prolymphocytic leukemia. Cancer 2013, 119, 2258–2267. [Google Scholar] [CrossRef] [PubMed]
- Herling, M.; Patel, K.A.; Teitell, M.A.; Konopleva, M.; Ravandi, F.; Kobayashi, R.; Jones, D. High TCL1 expression and intact T-cell receptor signaling define a hyperproliferative subset of T-cell prolymphocytic leukemia. Blood 2008, 111, 328–337. [Google Scholar] [CrossRef] [PubMed]
- Ravandi, F.; O’Brien, S.; Jones, D.; Lerner, S.; Faderl, S.; Ferrajoli, A.; Wierda, W.; Garcia-Manero, G.; Thomas, D.; Koller, C.; et al. T-cell prolymphocytic leukemia: A single-institution experience. Clin. Lymhoma Myeloma 2005, 6, 234–239. [Google Scholar] [CrossRef]
- Dearden, C.E.; Khot, A.; Else, M.; Hamblin, M.; Grand, E.; Roy, A.; Hewamana, S.; Matutes, E.; Catovsky, D. Alemtuzumab therapy in T-cell prolymphocytic leukemia: Comparing efficacy in a series treated intravenously and a study piloting the subcutaneous route. Blood 2011, 118, 5799–5802. [Google Scholar] [CrossRef]
- Hoh, F.; Yang, Y.-S.; Guignard, L.; Padilla, A.; Stern, M.-H.; Lhoste, J.-M.; van Tilbeurgh, H. Crystal structure of p14TCL1, an oncogene product involved in T-cell prolymphocytic leukemia, reveals a novel β-barrel topology. Structure 1998, 6, 147–155. [Google Scholar] [CrossRef]
- Schrader, A.; Crispatzu, G.; Oberbeck, S.; Mayer, P.; Pützer, S.; von Jan, J.; Vasyutina, E.; Warner, K.; Weit, N.; Pflug, N.; et al. Actionable perturbations of damage responses by TCL1/ATM and epigenetic lesions form the basis of T-PLL. Nat. Commun. 2018, 9, 697. [Google Scholar] [CrossRef]
- Kiel, M.J.; Velusamy, T.; Rolland, D.; Sahasrabuddhe, A.A.; Chung, F.; Bailey, N.G.; Schrader, A.; Li, B.; Li, J.Z.; Ozel, A.B.; et al. Integrated genomic sequencing reveals mutational landscape of T-cell prolymphocytic leukemia. Blood 2014, 124, 1460–1472. [Google Scholar] [CrossRef]
- Bellanger, D.; Jacquemin, V.; Chopin, M.; Pierron, G.; Bernard, O.A.; Ghysdael, J.; Stern, M.-H. Recurrent JAK1 and JAK3 somatic mutations in T-cell prolymphocytic leukemia. Leukemia 2013, 28, 417. [Google Scholar] [CrossRef] [PubMed]
- Stengel, A.; Kern, W.; Zenger, M.; Perglerová, K.; Schnittger, S.; Haferlach, T.; Haferlach, C. Genetic characterization of T-PLL reveals two major biologic subgroups and JAK3 mutations as prognostic marker. Genes Chromosom. Cancer 2016, 55, 82–94. [Google Scholar] [CrossRef] [PubMed]
- López, C.; Bergmann, A.K.; Paul, U.; Murga Penas, E.M.; Nagel, I.; Betts, M.J.; Johansson, P.; Ritgen, M.; Baumann, T.; Aymerich, M.; et al. Genes encoding members of the JAK-STAT pathway or epigenetic regulators are recurrently mutated in T-cell prolymphocytic leukaemia. Br. J. Haematol. 2016, 173, 265–273. [Google Scholar] [CrossRef] [PubMed]
- He, L.; Tang, J.; Andersson, E.I.; Timonen, S.; Koschmieder, S.; Wennerberg, K.; Mustjoki, S.; Aittokallio, T. Patient-customized drug combination prediction and testing for T-cell prolymphocytic leukemia patients. Cancer Res. 2018, 78, 2407–2418. [Google Scholar] [CrossRef]
- Dietrich, S.; Oleś, M.; Lu, J.; Sellner, L.; Anders, S.; Velten, B.; Wu, B.; Hüllein, J.; da Silva Liberio, M.; Walther, T.; et al. Drug-perturbation-based stratification of blood cancer. J. Clin. Investig. 2018, 128, 427–445. [Google Scholar] [CrossRef]
- Andersson, E.I.; Pützer, S.; Yadav, B.; Dufva, O.; Khan, S.; He, L.; Sellner, L.; Schrader, A.; Crispatzu, G.; Oleś, M.; et al. Discovery of novel drug sensitivities in T-PLL by high-throughput ex vivo drug testing and mutation profiling. Leukemia 2017, 32, 774. [Google Scholar] [CrossRef]
- Greenplate, A.; Wang, K.; Tripathi, R.M.; Palma, N.; Ali, S.M.; Stephens, P.J.; Miller, V.A.; Shyr, Y.; Guo, Y.; Reddy, N.M.; et al. Genomic profiling of T-Cell neoplasms reveals frequent JAK1 and JAK3 mutations with clonal evasion from targeted therapies. JCO Precis. Oncol. 2018. [Google Scholar] [CrossRef]
- Johansson, P.; Klein-Hitpass, L.; Choidas, A.; Habenberger, P.; Mahboubi, B.; Kim, B.; Bergmann, A.; Scholtysik, R.; Brauser, M.; Lollies, A.; et al. SAMHD1 is recurrently mutated in T-cell prolymphocytic leukemia. Blood Cancer J. 2018, 8, 11. [Google Scholar] [CrossRef]
- Rawlings, J.S.; Rosler, K.M.; Harrison, D.A. The JAK/STAT signaling pathway. J. Cell Sci. 2004, 117, 1281–1283. [Google Scholar] [CrossRef]
- Villarino, A.V.; Kanno, Y.; O’Shea, J.J. Mechanisms and consequences of Jak-STAT signaling in the immune system. Nat. Immunol. 2017, 18, 374–384. [Google Scholar] [CrossRef]
- Furqan, M.; Mukhi, N.; Lee, B.; Liu, D. Dysregulation of JAK-STAT pathway in hematological malignancies and JAK inhibitors for clinical application. Biomark. Res. 2013, 1, 5. [Google Scholar] [CrossRef] [PubMed]
- Heinrich, T.; Rengstl, B.; Muik, A.; Petkova, M.; Schmid, F.; Wistinghausen, R.; Warner, K.; Crispatzu, G.; Hansmann, M.-L.; Herling, M.; et al. Mature T-cell lymphomagenesis induced by retroviral insertional activation of Janus kinase 1. Mol. Ther. 2013, 21, 1160–1168. [Google Scholar] [CrossRef] [PubMed]
- Maurer, B.; Nivarthi, H.; Wingelhofer, B.; Pham, H.T.T.; Schlederer, M.; Suske, T.; Grausenburger, R.; Schiefer, A.-I.; Prchal-Murphy, M.; Chen, D.; et al. High activation of STAT5A drives peripheral T-cell lymphoma and leukemia. Haematologica 2019. [Google Scholar] [CrossRef] [PubMed]
- Taylor, P.C. Clinical efficacy of launched JAK inhibitors in rheumatoid arthritis. Rheumatology 2019, 58 (Suppl. 1), i17–i26. [Google Scholar] [CrossRef]
- Mannina, D.; Kröger, N. Janus Kinase inhibition for graft-versus-host disease: Current status and future prospects. Drugs 2019, 79, 1499–1509. [Google Scholar] [CrossRef]
- Schwartz, D.M.; Bonelli, M.; Gadina, M.; O’Shea, J.J. Type I/II cytokines, JAKs, and new strategies for treating autoimmune diseases. Nat. Rev. Rheumatol. 2016, 12, 25–36. [Google Scholar] [CrossRef]
- Gomez-Arteaga, A.; Margolskee, E.; Wei, M.T.; van Besien, K.; Inghirami, G.; Horwitz, S. Combined use of tofacitinib (pan-JAK inhibitor) and ruxolitinib (a JAK1/2 inhibitor) for refractory T-cell prolymphocytic leukemia (T-PLL) with a JAK3 mutation. Leuk. Lymphoma 2019, 60, 1626–1631. [Google Scholar] [CrossRef]
- Wei, M.; Koshy, N.; van Besien, K.; Inghirami, G.; Horwitz, S.M. Refractory T-cell prolymphocytic leukemia with JAK3 mutation: In Vitro and clinical synergy of Tofacitinib and Ruxolitinib. Blood 2015, 126, 5486. [Google Scholar] [CrossRef]
- Kiel, M.J.; Sahasrabuddhe, A.A.; Rolland, D.C.M.; Velusamy, T.; Chung, F.; Schaller, M.; Bailey, N.G.; Betz, B.L.; Miranda, R.N.; Porcu, P.; et al. Genomic analyses reveal recurrent mutations in epigenetic modifiers and the JAK–STAT pathway in Sézary syndrome. Nat. Commun. 2015, 6, 8470. [Google Scholar] [CrossRef]
- Nicolae, A.; Xi, L.; Pham, T.H.; Pham, T.-A.; Navarro, W.; Meeker, H.G.; Pittaluga, S.; Jaffe, E.S.; Raffeld, M. Mutations in the JAK/STAT and RAS signaling pathways are common in intestinal T-cell lymphomas. Leuemia 2016, 30, 2245. [Google Scholar] [CrossRef]
- Lone, W.; Alkhiniji, A.; Manikkam Umakanthan, J.; Iqbal, J. Molecular Insights into pathogenesis of peripheral T cell lymphoma: A review. Curr. Hematol. Malig. Rep. 2018, 13, 318–328. [Google Scholar] [CrossRef] [PubMed]
- Maljaei, S.H.; Brito-Babapulle, V.; Hiorns, L.R.; Catovsky, D. Abnormalities of chromosomes 8, 11, 14, and X in T-prolymphocytic leukemia studied by fluorescence in situ hybridization. Cancer Genet. Cytogenet. 1998, 103, 110–116. [Google Scholar] [CrossRef]
- Prinz, C.; Vasyutina, E.; Lohmann, G.; Schrader, A.; Romanski, S.; Hirschhäuser, C.; Mayer, P.; Frias, C.; Herling, C.D.; Hallek, M.; et al. Organometallic nucleosides induce non-classical leukemic cell death that is mitochondrial-ROS dependent and facilitated by TCL1-oncogene burden. Mol. Cancer 2015, 14, 114. [Google Scholar] [CrossRef] [PubMed] [Green Version]
- Jeong, E.G.; Kim, M.S.; Nam, H.K.; Min, C.K.; Lee, S.; Chung, Y.J.; Yoo, N.J.; Lee, S.H. Somatic mutations of JAK1 and JAK3 in acute leukemias and solid cancers. Clin. Cancer Res. 2008, 14, 3716–3721. [Google Scholar] [CrossRef] [PubMed] [Green Version]
- Gordon, G.M.; Lambert, Q.T.; Daniel, K.G.; Reuther, G.W. Transforming JAK1 mutations exhibit differential signalling, FERM domain requirements and growth responses to interferon-γ. Biochem. J. 2010, 432, 255–265. [Google Scholar] [CrossRef] [Green Version]
- Hornakova, T.; Staerk, J.; Royer, Y.; Flex, E.; Tartaglia, M.; Constantinescu, S.N.; Knoops, L.; Renauld, J.-C. Acute lymphoblastic leukemia-associated JAK1 mutants activate the Janus kinase/STAT pathway via interleukin-9 receptor alpha homodimers. J. Biol. Chem. 2009, 284, 6773–6781. [Google Scholar] [CrossRef] [PubMed] [Green Version]
- Flex, E.; Petrangeli, V.; Stella, L.; Chiaretti, S.; Hornakova, T.; Knoops, L.; Ariola, C.; Fodale, V.; Clappier, E.; Paoloni, F.; et al. Somatically acquired JAK1 mutations in adult acute lymphoblastic leukemia. J. Exp. Med. 2008, 205, 751–758. [Google Scholar] [CrossRef]
- Yang, S.; Luo, C.; Gu, Q.; Xu, Q.; Wang, G.; Sun, H.; Qian, Z.; Tan, Y.; Qin, Y.; Shen, Y.; et al. Activating JAK1 mutation may predict the sensitivity of JAK-STAT inhibition in hepatocellular carcinoma. Oncotarget 2016, 7, 5461–5469. [Google Scholar] [CrossRef] [Green Version]
- Degryse, S.; de Bock, C.E.; Demeyer, S.; Govaerts, I.; Bornschein, S.; Verbeke, D.; Jacobs, K.; Binos, S.; Skerrett-Byrne, D.A.; Murray, H.C.; et al. Mutant JAK3 phosphoproteomic profiling predicts synergism between JAK3 inhibitors and MEK/BCL2 inhibitors for the treatment of T-cell acute lymphoblastic leukemia. Leukemia 2018, 32, 788. [Google Scholar] [CrossRef]
- Martinez, G.S.; Ross, J.A.; Kirken, R.A. Transforming mutations of Jak3 (A573V and M511I) show differential sensitivity to selective JAK3 inhibitors. Clin. Cancer Drugs 2016, 3, 131–137. [Google Scholar] [CrossRef] [Green Version]
- Degryse, S.; de Bock, C.E.; Cox, L.; Demeyer, S.; Gielen, O.; Mentens, N.; Jacobs, K.; Geerdens, E.; Gianfelici, V.; Hulselmans, G.; et al. JAK3 mutants transform hematopoietic cells through JAK1 activation, causing T-cell acute lymphoblastic leukemia in a mouse model. Blood 2014, 124, 3092–3100. [Google Scholar] [CrossRef] [PubMed]
- Vicente, C.; Schwab, C.; Broux, M.; Geerdens, E.; Degryse, S.; Demeyer, S.; Lahortiga, I.; Elliott, A.; Chilton, L.; Starza, R.L.; et al. Targeted sequencing identifies associations between IL7R-JAK mutations and epigenetic modulators in T-cell acute lymphoblastic leukemia. Haematologica 2015, 100, 1301–1310. [Google Scholar] [CrossRef] [PubMed] [Green Version]
- Rajala, H.L.M.; Eldfors, S.; Kuusanmäki, H.; van Adrichem, A.J.; Olson, T.; Lagström, S.; Andersson, E.I.; Jerez, A.; Clemente, M.J.; Yan, Y.; et al. Discovery of somatic STAT5b mutations in large granular lymphocytic leukemia. Blood 2013, 121, 4541–4550. [Google Scholar] [CrossRef] [PubMed] [Green Version]
- Küçük, C.; Jiang, B.; Hu, X.; Zhang, W.; Chan, J.K.C.; Xiao, W.; Lack, N.; Alkan, C.; Williams, J.C.; Avery, K.N.; et al. Activating mutations of STAT5B and STAT3 in lymphomas derived from γδ-T or NK cells. Nat. Commun. 2015, 6, 6025. [Google Scholar] [CrossRef] [Green Version]
- de Araujo, E.D.; Erdogan, F.; Neubauer, H.A.; Meneksedag-Erol, D.; Manaswiyoungkul, P.; Eram, M.S.; Seo, H.S.; Qadree, A.K.; Israelian, J.; Orlova, A.; et al. Structural and functional consequences of the STAT5BN642H driver mutation. Nat. Commun. 2019, 10, 2517. [Google Scholar] [CrossRef] [Green Version]
- Pham, H.T.T.; Maurer, B.; Prchal-Murphy, M.; Grausenburger, R.; Grundschober, E.; Javaheri, T.; Nivarthi, H.; Boersma, A.; Kolbe, T.; Elabd, M.; et al. STAT5BN642H is a driver mutation for T cell neoplasia. J. Clin. Investig. 2018, 128, 387–401. [Google Scholar] [CrossRef] [Green Version]
- Andersson, E.I.; Tanahashi, T.; Sekiguchi, N.; Gasparini, V.R.; Bortoluzzi, S.; Kawakami, T.; Matsuda, K.; Mitsui, T.; Eldfors, S.; Bortoluzzi, S.; et al. High incidence of activating STAT5B mutations in CD4-positive T-cell large granular lymphocyte leukemia. Blood 2016, 128, 2465–2468. [Google Scholar] [CrossRef] [Green Version]
- McKinney, M.; Moffitt, A.B.; Gaulard, P.; Travert, M.; de Leval, L.; Raffeld, A.N.M.; Jaffe, E.S.; Pittaluga, S.; Xi, L.; Heavican, T.; et al. The genetic basis of hepatosplenic T-cell lymphoma. Cancer Discov. 2017, 7, 369–379. [Google Scholar] [CrossRef]
- O’Shea, J.J.; Schwartz, D.M.; Villarino, A.V.; Gadina, M.; McInnes, I.B.; Laurence, A. The JAK-STAT pathway: impact on human disease and therapeutic intervention. Annu. Rev. Med. 2015, 66, 311–328. [Google Scholar] [CrossRef] [Green Version]
- Schrader, A.; Braun, T.; Herling, M. The dawn of a new era in treating T-PLL. Oncotarget 2019, 10, 626–628. [Google Scholar] [CrossRef]
- Wingelhofer, B.; Maurer, B.; Heyes, E.C.; Cumaraswamy, A.A.; Berger-Becvar, A.; de Araujo, E.D.; Orlova, A.; Freund, P.; Ruge, F.; Park, J.; et al. Pharmacologic inhibition of STAT5 in acute myeloid leukemia. Leukemia 2018, 32, 1135–1146. [Google Scholar] [CrossRef] [PubMed] [Green Version]
- Kanai, T.; Seki, S.; Jenks, J.A.; Kohli, A.; Kawli, T.; Martin, D.P.; Snyder, M.; Bacchetta, R.; Nadeau, K.C. Identification of STAT5A and STAT5B target genes in human T cells. PLoS ONE 2014, 9, e86790. [Google Scholar] [CrossRef] [PubMed]


© 2019 by the authors. Licensee MDPI, Basel, Switzerland. This article is an open access article distributed under the terms and conditions of the Creative Commons Attribution (CC BY) license (http://creativecommons.org/licenses/by/4.0/).
Share and Cite
Wahnschaffe, L.; Braun, T.; Timonen, S.; Giri, A.K.; Schrader, A.; Wagle, P.; Almusa, H.; Johansson, P.; Bellanger, D.; López, C.; et al. JAK/STAT-Activating Genomic Alterations Are a Hallmark of T-PLL. Cancers 2019, 11, 1833. https://doi.org/10.3390/cancers11121833
Wahnschaffe L, Braun T, Timonen S, Giri AK, Schrader A, Wagle P, Almusa H, Johansson P, Bellanger D, López C, et al. JAK/STAT-Activating Genomic Alterations Are a Hallmark of T-PLL. Cancers. 2019; 11(12):1833. https://doi.org/10.3390/cancers11121833
Chicago/Turabian StyleWahnschaffe, Linus, Till Braun, Sanna Timonen, Anil K. Giri, Alexandra Schrader, Prerana Wagle, Henrikki Almusa, Patricia Johansson, Dorine Bellanger, Cristina López, and et al. 2019. "JAK/STAT-Activating Genomic Alterations Are a Hallmark of T-PLL" Cancers 11, no. 12: 1833. https://doi.org/10.3390/cancers11121833