Radiomics of Liver Metastases: A Systematic Review

 , , , , ,
Abstract
:Simple Summary
Abstract
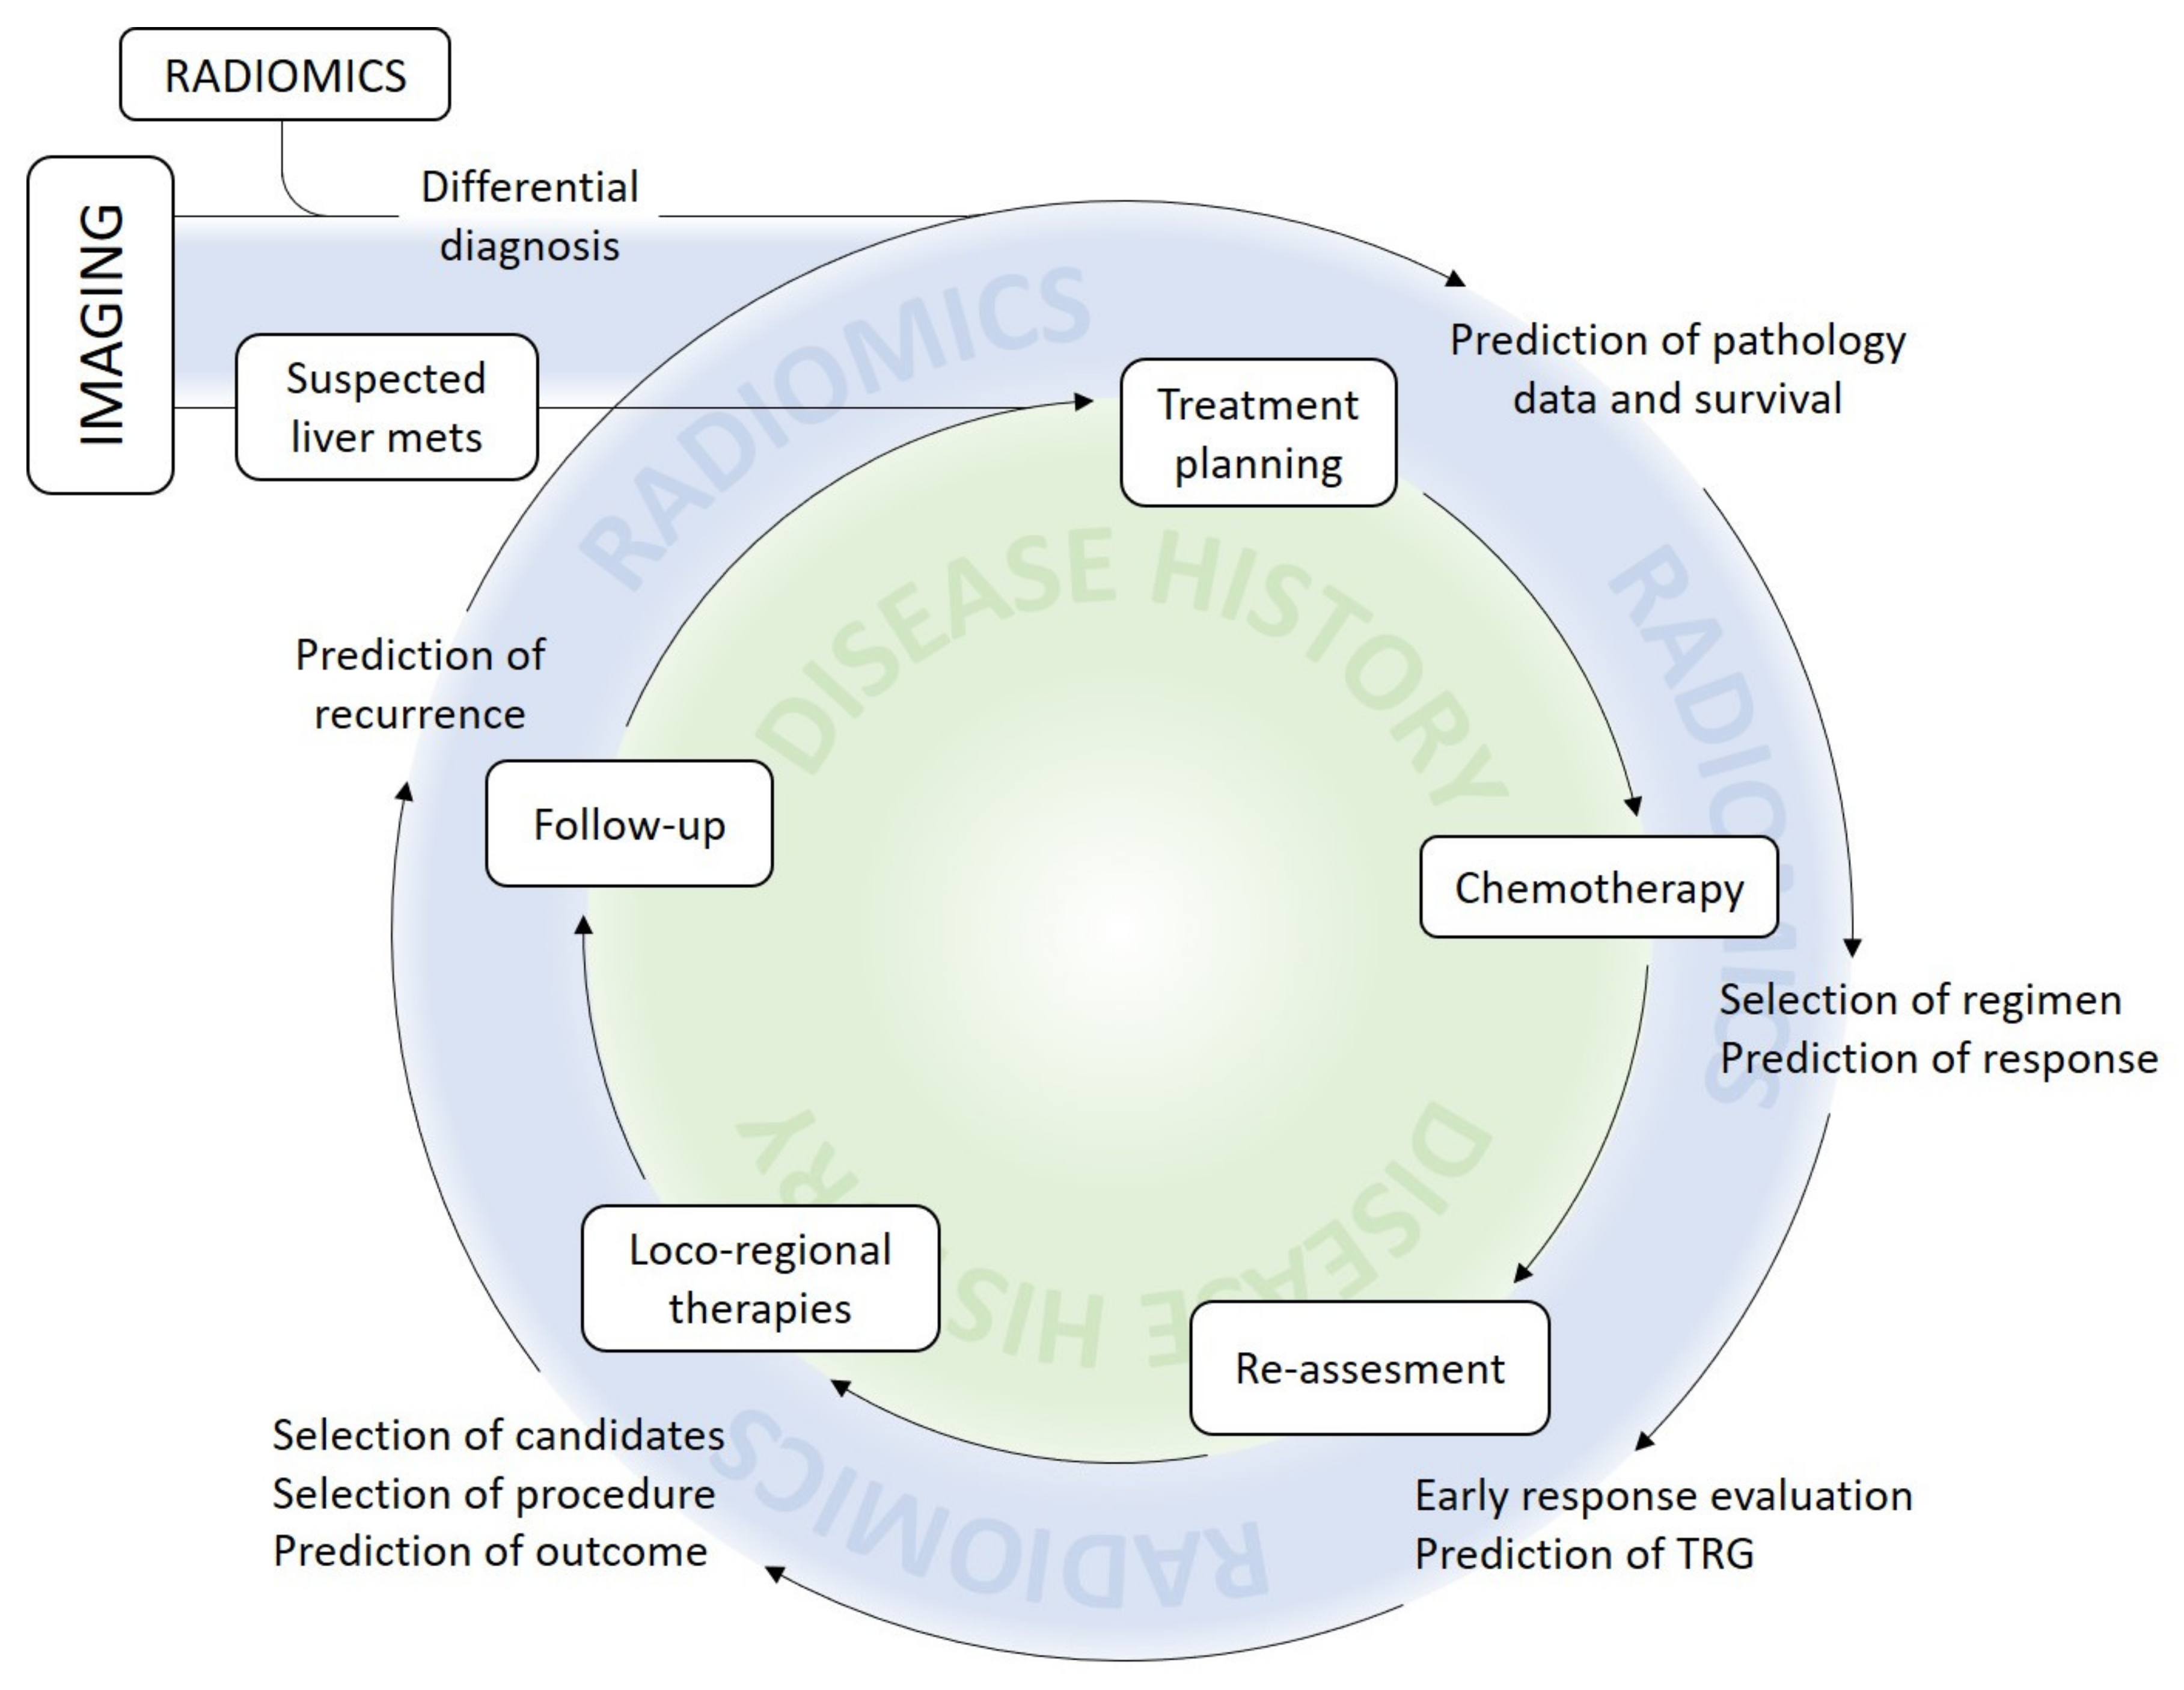
1. Introduction
2. Results
2.1. General Characteristics of the Studies
2.2. Assessment of Study Quality
2.3. Radiomics of LM from Colorectal Cancer
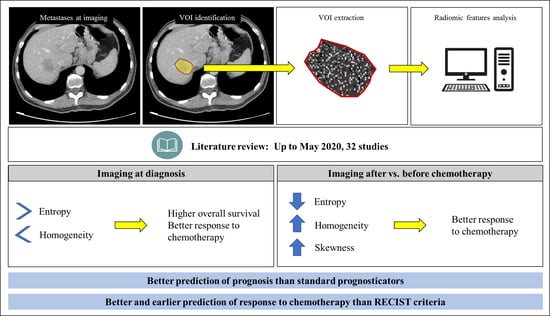
2.3.1. Prediction of Survival
2.3.2. Prediction of Response to Systemic Chemotherapy
2.3.3. Prediction of Pathology Data
2.3.4. Other Papers
2.4. Radiomics of Non-Colorectal LM
2.5. Differentiation of LM from Other Hepatic Lesions
2.6. Influence of Technical Features on Radiomic Analyses
3. Discussion
4. Materials and Methods
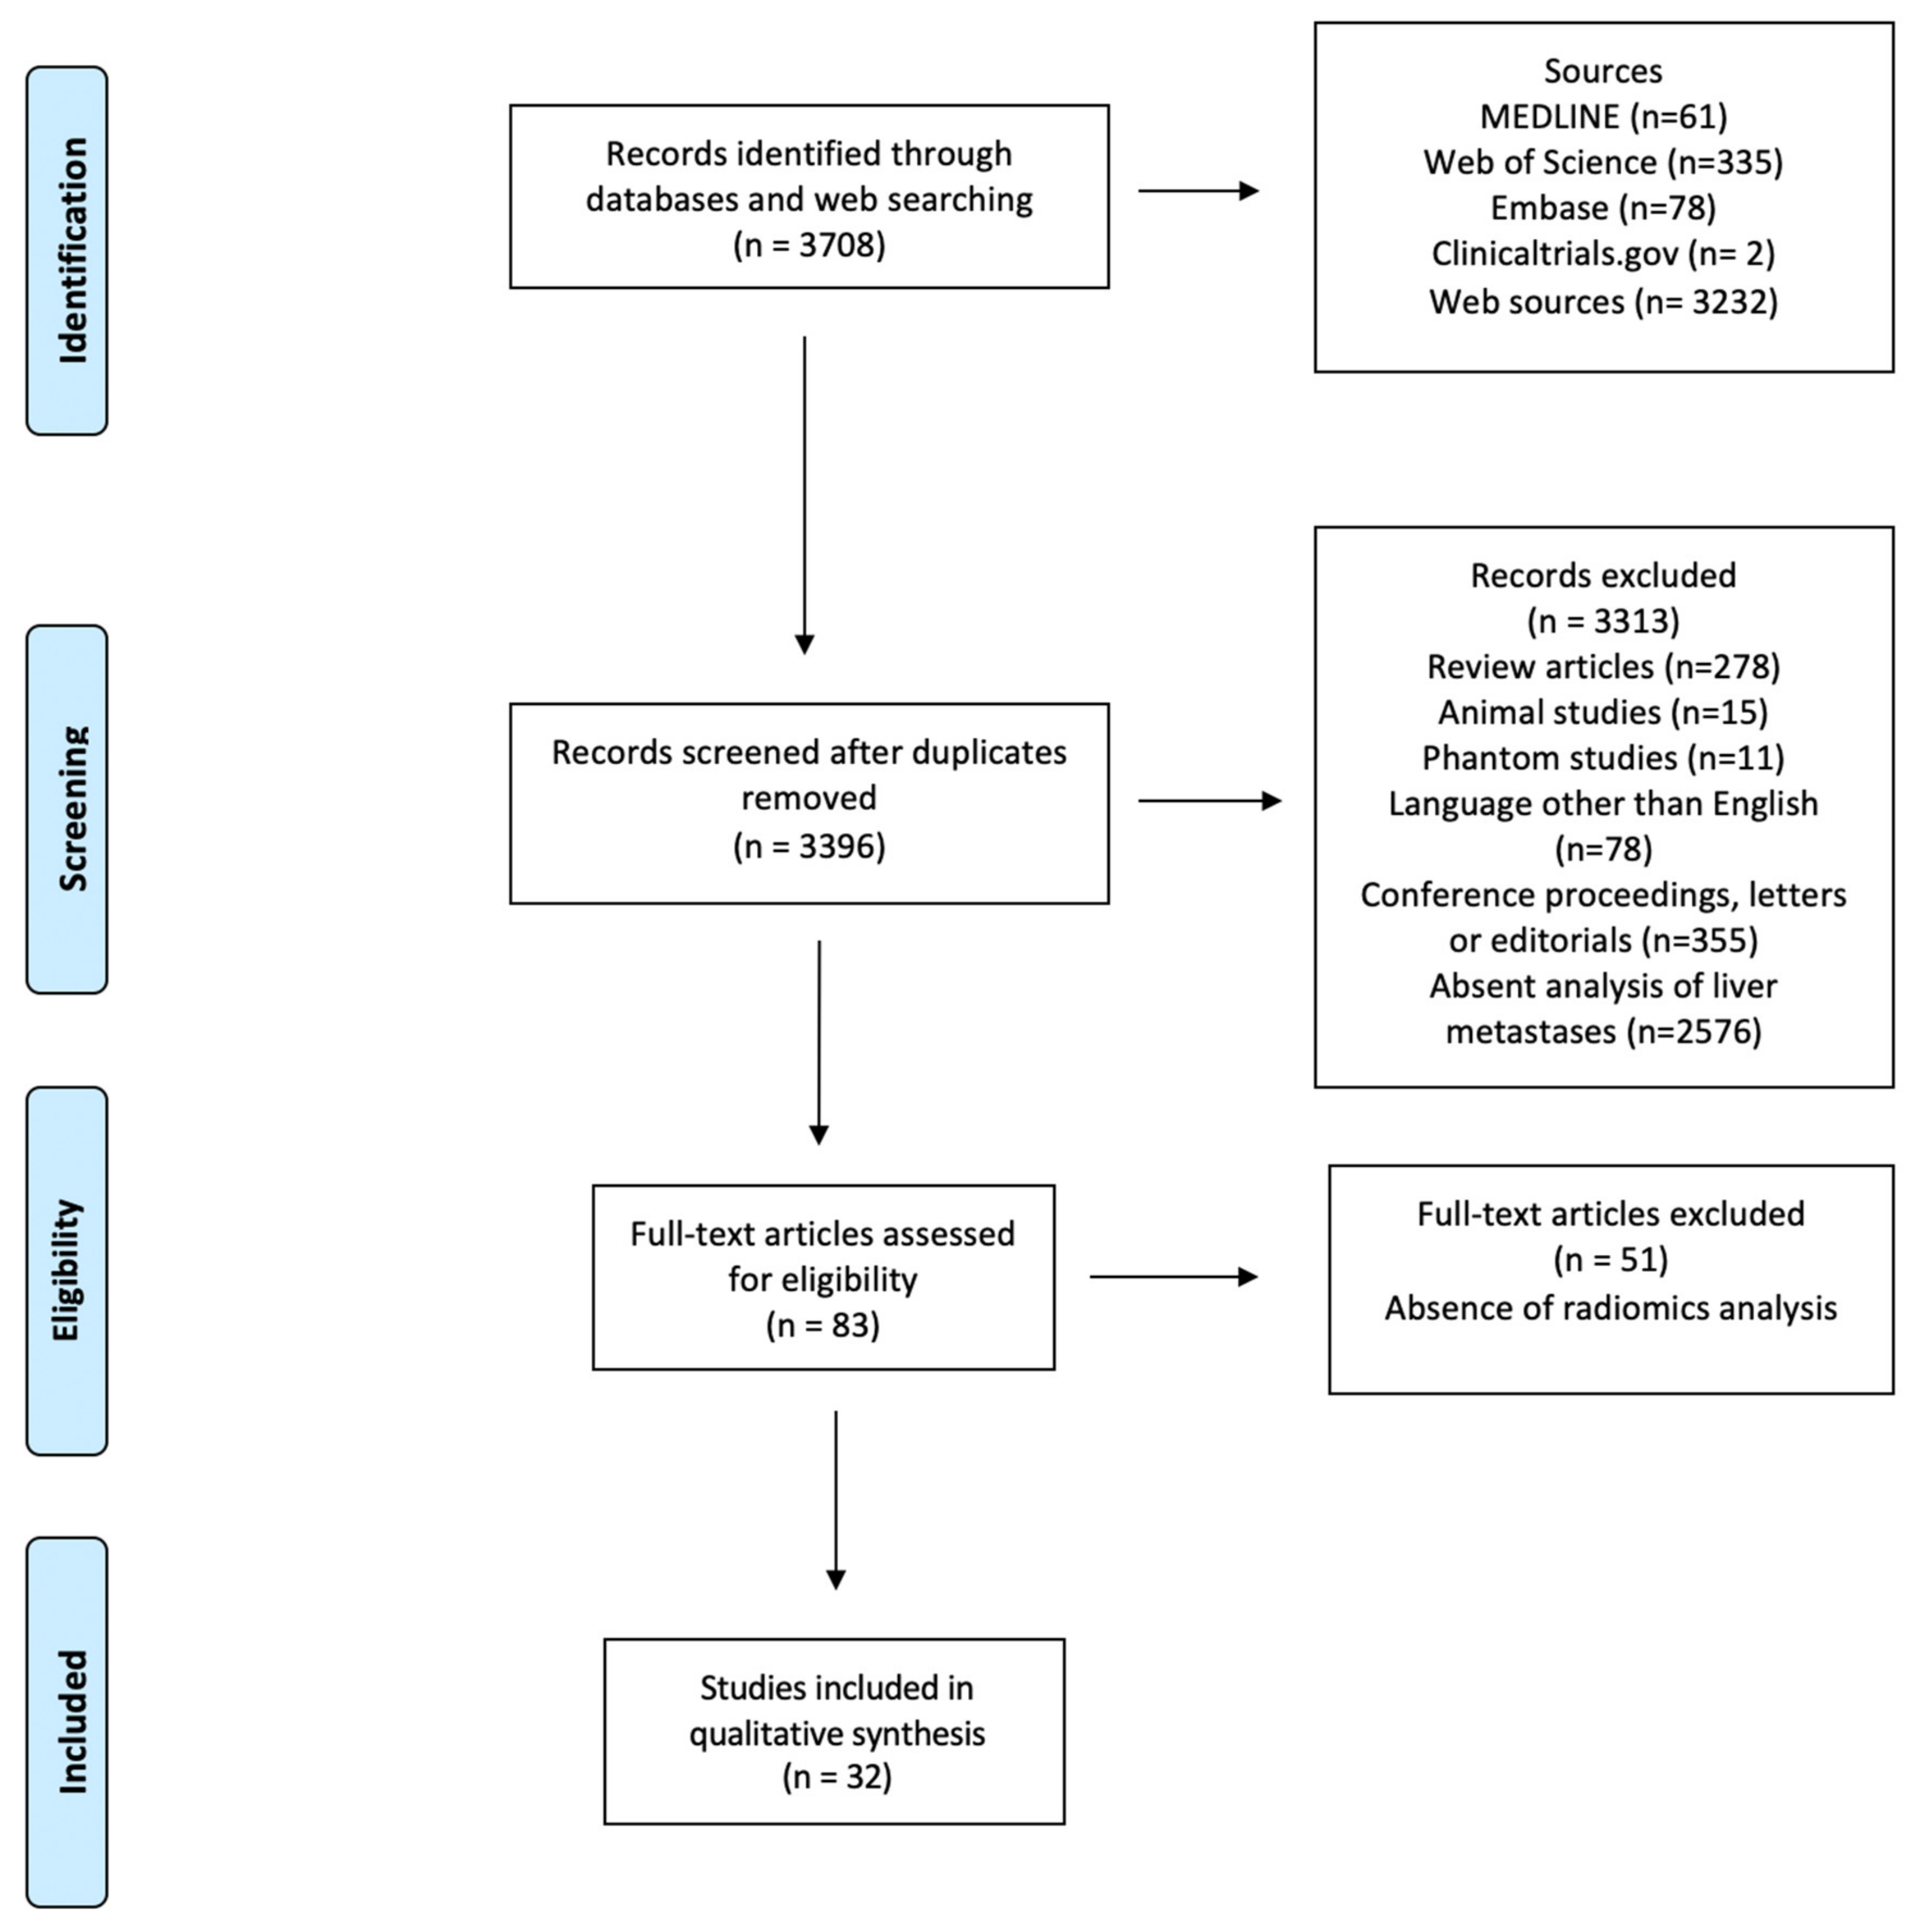
4.1. Database Search Strategy
4.2. Study Selection and Quality Appraisal
- Articles not matching the field of interest of the current review.
- Other review articles (however, these articles were screened for references).
- Editorial, letters, or conference proceedings.
- Reports of single cases.
- Reports on ultrasound imaging or other operator-dependent technique.
- Phantom, simulation or small animal studies.
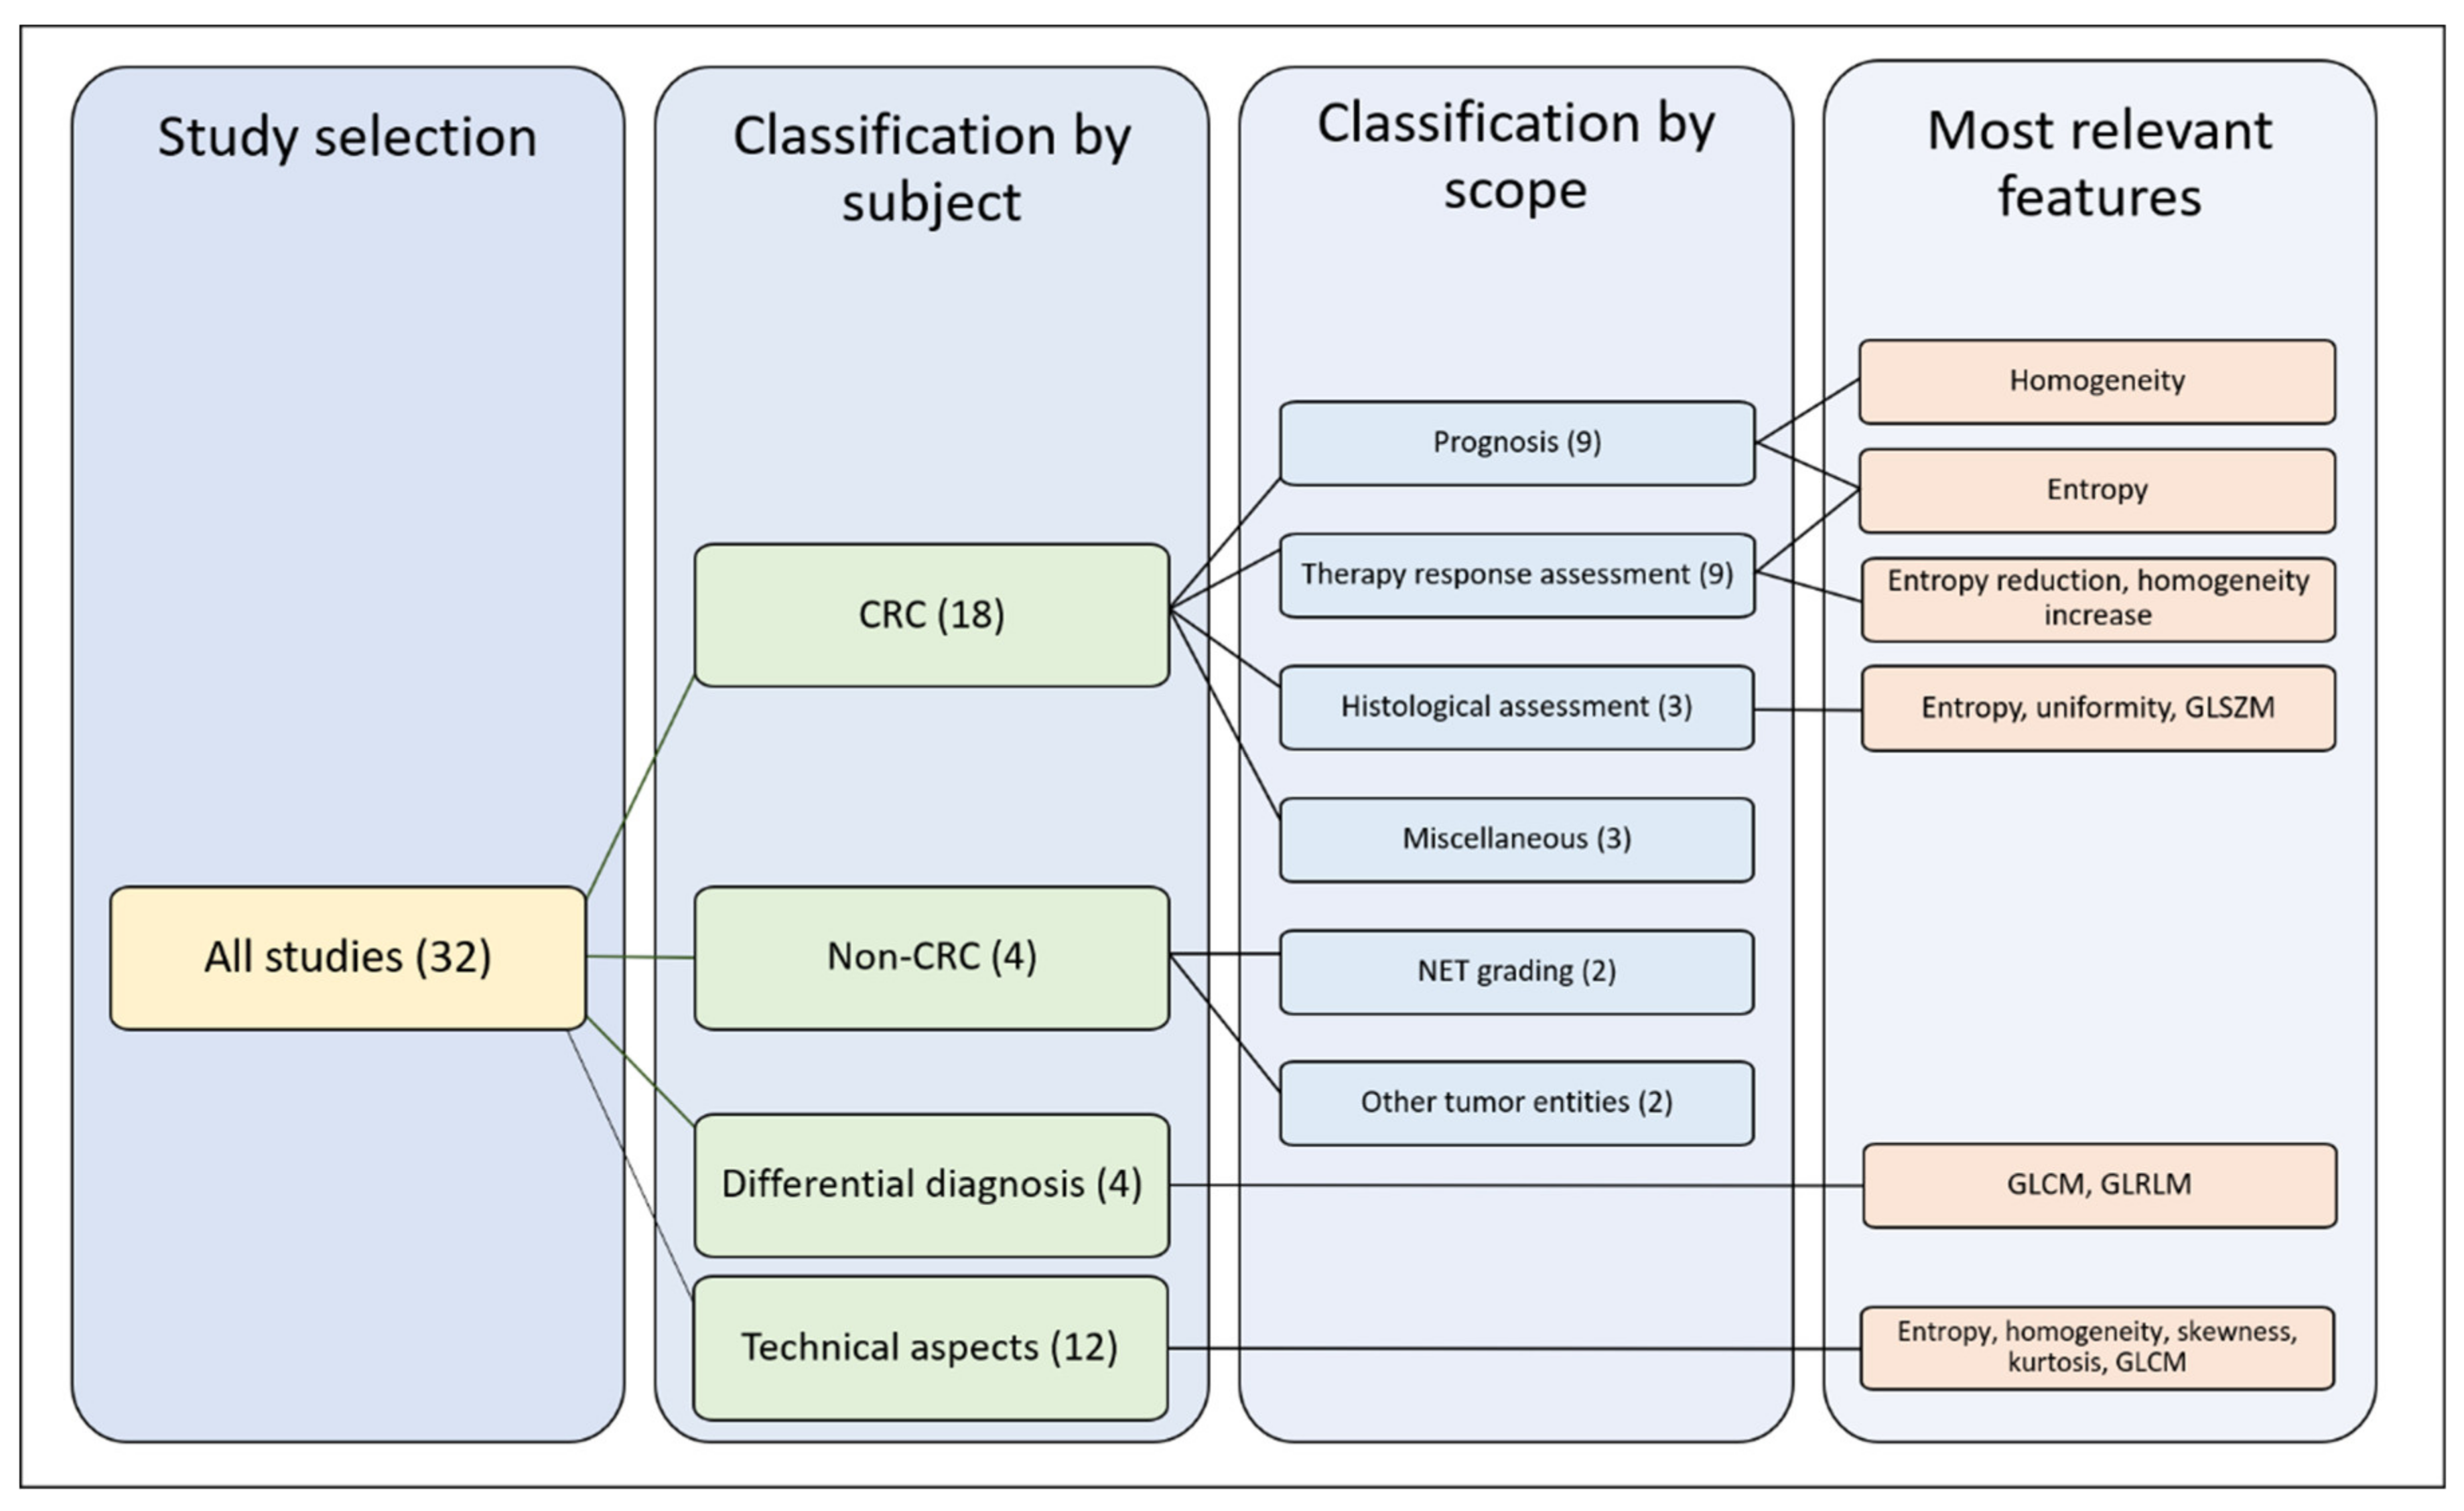
4.3. Articles and Features Classification
5. Conclusions
Supplementary Materials
Author Contributions
Funding
Conflicts of Interest
References
- Massagué, J.; Obenauf, A.C. Metastatic colonization by circulating tumour cells. Nature 2016, 529, 298–306. [Google Scholar] [CrossRef] [PubMed]
- Van Cutsem, E.; Cervantes, A.; Adam, R.; Sobrero, A.; Van Krieken, J.H.; Aderka, D.; Aguilar, E.A.; Bardelli, A.; Benson, A.; Bodoky, G.; et al. ESMO consensus guidelines for the management of patients with metastatic colorectal cancer. Ann. Oncol. 2016, 27, 1386–1422. [Google Scholar] [CrossRef] [PubMed]
- Pavel, M.; Öberg, K.; Falconi, M.; Krenning, E.; Sundin, A.; Perren, A.; Berruti, A. Gastroenteropancreatic neuroendocrine neoplasms: ESMO Clinical Practice Guidelines for diagnosis, treatment and follow-up. Ann. Oncol. 2020, 31, 844–860. [Google Scholar] [CrossRef] [PubMed]
- Cardoso, F.; Senkus, E.; Costa, A.; Papadopoulos, E.; Aapro, M.; André, F.; Harbeck, N.; Lopez, B.A.; Barrios, C.; Bergh, J.; et al. 4th ESO–ESMO International Consensus Guidelines for Advanced Breast Cancer (ABC 4) dagger. Ann. Oncol. 2018, 29, 1634–1657. [Google Scholar] [CrossRef]
- Riihimäki, M.; Hemminki, A.; Sundquist, K.; Sundquist, J.; Hemminki, K. Metastatic spread in patients with gastric cancer. Oncotarget 2016, 7, 52307–52316. [Google Scholar] [CrossRef] [Green Version]
- Loupakis, F.; Cremolini, C.; Masi, G.; Lonardi, S.; Zagonel, V.; Salvatore, L.; Cortesi, E.; Tomasello, G.; Ronzoni, M.; Spadi, R.; et al. Initial Therapy with FOLFOXIRI and Bevacizumab for Metastatic Colorectal Cancer. N. Engl. J. Med. 2014, 371, 1609–1618. [Google Scholar] [CrossRef] [Green Version]
- Kopetz, S.; Chang, G.J.; Overman, M.J.; Eng, C.; Sargent, D.J.; Larson, D.W.; Grothey, A.; Vauthey, J.-N.; Nagorney, D.M.; McWilliams, R.R. Improved Survival in Metastatic Colorectal Cancer Is Associated with Adoption of Hepatic Resection and Improved Chemotherapy. J. Clin. Oncol. 2009, 27, 3677–3683. [Google Scholar] [CrossRef]
- Gruenberger, T.; Bridgewater, J.; Chau, I.; Alfonso, P.G.; Rivoire, M.; Mudan, S.; Lasserre, S.; Hermann, F.; Waterkamp, D.; Adam, R. Bevacizumab plus mFOLFOX-6 or FOLFOXIRI in patients with initially unresectable liver metastases from colorectal cancer: The OLIVIA multinational randomised phase II trial. Ann. Oncol. 2015, 26, 702–708. [Google Scholar] [CrossRef]
- Brudvik, K.W.; Jones, R.P.; Giuliante, F.; Shindoh, J.; Passot, G.; Chung, M.H.; Song, J.; Li, L.; Dagenborg, V.J.; Fretland, A.A.; et al. RAS Mutation Clinical Risk Score to Predict Survival after Resection of Colorectal Liver Metastases. Ann. Surg. 2019, 269, 120–126. [Google Scholar] [CrossRef]
- Viganò, L.; Russolillo, N.; Ferrero, A.; Langella, S.; Sperti, E.; Capussotti, L. Evolution of Long-Term Outcome of Liver Resection for Colorectal Metastases: Analysis of Actual 5-Year Survival Rates over Two Decades. Ann. Surg. Oncol. 2012, 19, 2035–2044. [Google Scholar] [CrossRef]
- Creasy, J.M.; Sadot, E.; Blumgart, L.H.; Jarnagin, W.R.; D’Angelica, M.I.; Koerkamp, B.G.; Chou, J.F.; Gonen, M.; Kemeny, N.E.; Balachandran, V.P.; et al. Actual 10-year survival after hepatic resection of colorectal liver metastases: What factors preclude cure? Surgery 2018, 163, 1238–1244. [Google Scholar] [CrossRef] [PubMed]
- Viganò, L.; Procopio, F.; Cimino, M.; Donadon, M.; Gatti, A.; Costa, G.; Del Fabbro, D.; Torzilli, G. Is Tumor Detachment from Vascular Structures Equivalent to R0 Resection in Surgery for Colorectal Liver Metastases? An Observational Cohort. Ann. Surg. Oncol. 2016, 23, 1352–1360. [Google Scholar] [CrossRef] [PubMed]
- Gennaro, N.; Mauri, G.; Varano, G.M.; Monfardini, L.; Pedicini, V.; Poretti, D.; Solbiati, L.A. Thermal Ablations for Colorectal Liver Metastases. Dig. Dis. Interv. 2019, 3, 117–125. [Google Scholar] [CrossRef]
- Chung, C. Management of neuroendocrine tumors. Am. J. Health Syst. Pharm. 2016, 73, 1729–1744. [Google Scholar] [CrossRef]
- Scorsetti, M.; Franceschini, D.; De Rose, F.; Comito, T.; Franzese, C.; Masci, G.; Torrisi, R.; Viganò, L.; Torzilli, G. The role of SBRT in oligometastatic patients with liver metastases from breast cancer. Rep. Pr. Oncol. Radiother. 2017, 22, 163–169. [Google Scholar] [CrossRef] [Green Version]
- Andreou, A.; Viganò, L.; Zimmitti, G.; Seehofer, D.; Dreyer, M.; Pascher, A.; Bahra, M.; Schoening, W.; Schmitz, V.; Thuss-Patience, P.C.; et al. Response to Preoperative Chemotherapy Predicts Survival in Patients Undergoing Hepatectomy for Liver Metastases from Gastric and Esophageal Cancer. J. Gastrointest. Surg. 2014, 18, 1974–1986. [Google Scholar] [CrossRef]
- Adam, R.; Pascal, G.; Castaing, D.; Azoulay, D.; Delvart, V.; Paule, B.; Levi, F.; Bismuth, H. Tumor Progression while on Chemotherapy: A contraindication to liver resection for multiple colorectal metastases? Ann. Surg. 2004, 240, discussion 1061–1064. [Google Scholar] [CrossRef]
- Viganò, L.; Capussotti, L.; Barroso, E.; Nuzzo, G.; Laurent, C.; Ijzermans, J.N.M.; Gigot, J.-F.; Figueras, J.; Gruenberger, T.; Mirza, D.F.; et al. Progression while Receiving Preoperative Chemotherapy Should Not Be an Absolute Contraindication to Liver Resection for Colorectal Metastases. Ann. Surg. Oncol. 2012, 19, 2786–2796. [Google Scholar] [CrossRef]
- Brouquet, A.; Blot, C.; Allard, M.A.; Lazure, T.; Sebbagh, M.; Gayet, M.; Lewin, M.; Adam, R.; Penna, C.; Sa Cunha, A.; et al. What is the Prognostic Value of a Discordant Radiologic and Pathologic Response in Patients Undergoing Resection of Colorectal Liver Metastases after Preoperative Chemotherapy? Ann. Surg. Oncol. 2020. [Google Scholar] [CrossRef]
- Viganò, L.; Capussotti, L.; De Rosa, G.; De Saussure, W.O.; Mentha, G.; Rubbia-Brandt, L. Liver Resection for Colorectal Metastases after Chemotherapy: Impact of chemotherapy-related liver injuries, pathological tumor response, and micrometastases on long-term survival. Ann. Surg. 2013, 258, discussion 741–742. [Google Scholar] [CrossRef]
- Viganò, L.; Darwish, S.S.; Rimassa, L.; Cimino, M.; Carnaghi, C.; Donadon, M.; Procopio, F.; Personeni, N.; Del Fabbro, D.; Santoro, A.; et al. Progression of Colorectal Liver Metastases from the End of Chemotherapy to Resection: A New Contraindication to Surgery? Ann. Surg. Oncol. 2018, 25, 1676–1685. [Google Scholar] [CrossRef] [PubMed]
- Sayagués, J.M.; Corchete, L.A.; Gutiérrez, M.L.; Sarasquete, M.E.; Abad, M.D.M.; Bengoechea, O.; Fermiñán, E.; Anduaga, M.F.; Del Carmen, S.; Iglesias, M.; et al. Genomic characterization of liver metastases from colorectal cancer patients. Oncotarget 2016, 7, 72908–72922. [Google Scholar] [CrossRef] [PubMed] [Green Version]
- Brudvik, K.W.; Kopetz, S.; Li, L.; Conrad, C.; Aloia, T.A.; Vauthey, J.-N. Meta-analysis of KRAS mutations and survival after resection of colorectal liver metastases. Br. J. Surg. 2015, 102, 1175–1183. [Google Scholar] [CrossRef] [PubMed] [Green Version]
- Gillies, R.J.; Kinahan, P.E.; Hricak, H. Radiomics: Images Are More than Pictures, They Are Data. Radiology 2016, 278, 563–577. [Google Scholar] [CrossRef] [Green Version]
- Lambin, P.; Rios-Velazquez, E.; Leijenaar, R.; Carvalho, S.; Van Stiphout, R.G.P.M.; Granton, P.; Zegers, C.M.L.; Gillies, R.; Boellard, R.; Dekker, A.; et al. Radiomics: Extracting more information from medical images using advanced feature analysis. Eur. J. Cancer 2012, 48, 441–446. [Google Scholar] [CrossRef] [Green Version]
- Sollini, M.; Antunovic, L.; Chiti, A.; Kirienko, M. Towards clinical application of image mining: A systematic review on artificial intelligence and radiomics. Eur. J. Nucl. Med. Mol. Imaging 2019, 46, 2656–2672. [Google Scholar] [CrossRef] [Green Version]
- Zwanenburg, A.; Vallières, M.; Abdalah, M.A.; Aerts, H.J.W.L.; Andrearczyk, V.; Apte, A.; Ashrafinia, S.; Bakas, S.; Beukinga, R.J.; Boellaard, R.; et al. The Image Biomarker Standardization Initiative: Standardized Quantitative Radiomics for High-Throughput Image-based Phenotyping. Radiology 2020, 295, 328–338. [Google Scholar] [CrossRef] [Green Version]
- Sollini, M.; Cozzi, L.; Antunovic, L.; Chiti, A.; Kirienko, M. PET Radiomics in NSCLC: State of the art and a proposal for harmonization of methodology. Sci. Rep. 2017, 7, 358. [Google Scholar] [CrossRef] [Green Version]
- Thawani, R.; McLane, M.; Beig, N.; Ghose, S.; Prasanna, P.; Velcheti, V.; Madabhushi, A. Radiomics and radiogenomics in lung cancer: A review for the clinician. Lung Cancer 2018, 115, 34–41. [Google Scholar] [CrossRef]
- Wakabayashi, T.; Ouhmich, F.; Gonzalez-Cabrera, C.; Felli, E.; Saviano, A.; Agnus, V.; Savadjiev, P.; Baumert, T.F.; Pessaux, P.; Marescaux, J.; et al. Radiomics in hepatocellular carcinoma: A quantitative review. Hepatol. Int. 2019, 13, 546–559. [Google Scholar] [CrossRef] [Green Version]
- Cozzi, L.; Dinapoli, N.; Fogliata, A.; Hsu, W.-C.; Reggiori, G.; Lobefalo, F.; Kirienko, M.; Sollini, M.; Franceschini, D.; Comito, T.; et al. Radiomics based analysis to predict local control and survival in hepatocellular carcinoma patients treated with volumetric modulated arc therapy. BMC Cancer 2017, 17, 829. [Google Scholar] [CrossRef] [PubMed] [Green Version]
- Andersen, I.R.; Thorup, K.; Andersen, M.B.; Olesen, R.; Mortensen, F.V.; Nielsen, D.T.; Rasmussen, F. Texture in the monitoring of regorafenib therapy in patients with colorectal liver metastases. Acta Radiol. 2019, 60, 1084–1093. [Google Scholar] [CrossRef] [PubMed]
- Dohan, A.; Gallix, B.; Guiu, B.; Le Malicot, K.; Reinhold, C.; Soyer, P.; Bennouna, J.; Ghiringhelli, F.; Barbier, E.; Boige, V.; et al. Early evaluation using a radiomic signature of unresectable hepatic metastases to predict outcome in patients with colorectal cancer treated with FOLFIRI and bevacizumab. Gut 2020, 69, 531–539. [Google Scholar] [CrossRef]
- Meyer, M.; Ronald, J.; Vernuccio, F.; Nelson, R.C.; Ramirez-Giraldo, J.C.; Solomon, J.; Patel, B.N.; Samei, E.; Marin, D. Reproducibility of CT Radiomic Features within the Same Patient: Influence of Radiation Dose and CT Reconstruction Settings. Radiology 2019, 293, 583–591. [Google Scholar] [CrossRef] [PubMed]
- Dercle, L.; Ammari, S.; Bateson, M.; Durand, P.B.; Haspinger, E.; Massard, C.; Jaudet, C.; Varga, A.; Deutsch, E.; Soria, J.-C.; et al. Limits of radiomic-based entropy as a surrogate of tumor heterogeneity: ROI-area, acquisition protocol and tissue site exert substantial influence. Sci. Rep. 2017, 7, 7952. [Google Scholar] [CrossRef]
- Ahn, S.J.; Kim, J.H.; Lee, S.M.; Park, S.J.; Han, J.K. CT reconstruction algorithms affect histogram and texture analysis: Evidence for liver parenchyma, focal solid liver lesions, and renal cysts. Eur. Radiol. 2019, 29, 4008–4015. [Google Scholar] [CrossRef]
- Ahn, S.J.; Kim, J.H.; Park, S.J.; Han, J.K. Prediction of the therapeutic response after FOLFOX and FOLFIRI treatment for patients with liver metastasis from colorectal cancer using computerized CT texture analysis. Eur. J. Radiol. 2016, 85, 1867–1874. [Google Scholar] [CrossRef] [PubMed]
- Beckers, R.; Trebeschi, S.; Maas, M.; Schnerr, R.; Sijmons, J.; Beets, G.; Houwers, J.; Beets-Tan, R.; Lambregts, D.M.J. CT texture analysis in colorectal liver metastases and the surrounding liver parenchyma and its potential as an imaging biomarker of disease aggressiveness, response and survival. Eur. J. Radiol. 2018, 102, 15–21. [Google Scholar] [CrossRef] [PubMed]
- Cheng, J.; Wei, J.; Tong, T.; Sheng, W.; Zhang, Y.; Han, Y.; Gu, D.; Hong, N.; Ye, Y.; Tian, J.; et al. Prediction of Histopathologic Growth Patterns of Colorectal Liver Metastases with a Noninvasive Imaging Method. Ann. Surg. Oncol. 2019, 26, 4587–4598. [Google Scholar] [CrossRef] [PubMed]
- Dercle, L.; Lu, L.; Schwartz, L.H.; Qian, M.; Tejpar, S.; Eggleton, P.; Zhao, B.; Piessevaux, H. Radiomics Response Signature for Identification of Metastatic Colorectal Cancer Sensitive to Therapies Targeting EGFR Pathway. J. Natl. Cancer Inst. 2020. [Google Scholar] [CrossRef]
- Klaassen, R.; LaRue, R.T.H.M.; Mearadji, B.; Van Der Woude, S.O.; Stoker, J.; Lambin, P.; Van Laarhoven, H.W.M. Feasibility of CT radiomics to predict treatment response of individual liver metastases in esophagogastric cancer patients. PLoS ONE 2018, 13, e0207362. [Google Scholar] [CrossRef] [PubMed] [Green Version]
- Li, Y.; Eresen, A.; Shangguan, J.; Yang, J.; Lu, Y.; Chen, D.; Wang, J.; Velichko, Y.; Yaghmai, V.; Zhang, Z. Establishment of a new non-invasive imaging prediction model for liver metastasis in colon cancer. Am. J. Cancer Res. 2019, 9, 2482–2492. [Google Scholar] [PubMed]
- Lubner, M.G.; Stabo, N.; Lubner, S.J.; Del Rio, A.M.; Song, C.; Halberg, R.B.; Pickhardt, P.J. CT textural analysis of hepatic metastatic colorectal cancer: Pre-treatment tumor heterogeneity correlates with pathology and clinical outcomes. Abdom. Imaging 2015, 40, 2331–2337. [Google Scholar] [CrossRef] [PubMed]
- Martini, I.; Polici, M.; Zerunian, M.; Panzuto, F.; Rinzivillo, M.; Landolfi, F.; Magi, L.; Caruso, D.; Eid, M.; Annibale, B.; et al. CT texture analysis of liver metastases in PNETs versus NPNETs: Correlation with histopathological findings. Eur. J. Radiol. 2020, 124, 108812. [Google Scholar] [CrossRef] [PubMed]
- Rao, S.-X.; Lambregts, D.M.J.; Schnerr, R.S.; Beckers, R.C.; Maas, M.; Albarello, F.; Riedl, R.G.; DeJong, C.H.; Martens, M.H.; Heijnen, L.A.; et al. CT texture analysis in colorectal liver metastases: A better way than size and volume measurements to assess response to chemotherapy? United Eur. Gastroenterol. J. 2016, 4, 257–263. [Google Scholar] [CrossRef]
- Ravanelli, M.; Agazzi, G.M.; Tononcelli, E.; Roca, E.; Cabassa, P.; Baiocchi, G.; Berruti, A.; Maroldi, R.; Farina, D. Texture features of colorectal liver metastases on pretreatment contrast-enhanced CT may predict response and prognosis in patients treated with bevacizumab-containing chemotherapy: A pilot study including comparison with standard chemotherapy. La Radiol. Med. 2019, 124, 877–886. [Google Scholar] [CrossRef]
- Simpson, A.L.; Doussot, A.; Creasy, J.M.; Adams, L.B.; Allen, P.J.; DeMatteo, R.P.; Gönen, M.; Kemeny, N.E.; Kingham, T.P.; Shia, J.; et al. Computed Tomography Image Texture: A Noninvasive Prognostic Marker of Hepatic Recurrence After Hepatectomy for Metastatic Colorectal Cancer. Ann. Surg. Oncol. 2017, 24, 2482–2490. [Google Scholar] [CrossRef]
- Song, S.; Li, Z.; Niu, L.; Zhou, X.; Wang, G.; Gao, Y.; Wang, J.; Liu, F.; Sui, Q.; Jiao, L.; et al. Hypervascular hepatic focal lesions on dynamic contrast-enhanced CT: Preliminary data from arterial phase scans texture analysis for classification. Clin. Radiol. 2019, 74, 653.e11–653.e18. [Google Scholar] [CrossRef]
- Trebeschi, S.; Drago, S.; Birkbak, N.; Kurilova, I.; Cǎlin, A.; Pizzi, A.D.; Lalezari, F.; Lambregts, D.; Rohaan, M.; Parmar, C.; et al. Predicting response to cancer immunotherapy using noninvasive radiomic biomarkers. Ann. Oncol. 2019, 30, 998–1004. [Google Scholar] [CrossRef] [Green Version]
- Velichko, Y.S.; Mozafarykhamseh, A.; Trabzonlu, T.A.; Zhang, Z.; Rademaker, A.W.; Yaghmai, V. Association Between the Size and 3D CT-Based Radiomic Features of Breast Cancer Hepatic Metastasis. Acad. Radiol. 2020. [Google Scholar] [CrossRef]
- Gatos, I.; Tsantis, S.; Karamesini, M.; Spiliopoulos, S.; Karnabatidis, D.; Hazle, J.D.; Kagadis, G.C. Focal liver lesions segmentation and classification in nonenhanced T2-weighted MRI. Med. Phys. 2017, 44, 3695–3705. [Google Scholar] [CrossRef] [PubMed]
- Jansen, M.J.A.; Kuijf, H.J.; Veldhuis, W.B.; Wessels, F.J.; Viergever, M.A.; Pluim, J.P.W. Automatic classification of focal liver lesions based on MRI and risk factors. PLoS ONE 2019, 14, e0217053. [Google Scholar] [CrossRef] [PubMed] [Green Version]
- Li, Z.; Mao, Y.; Huang, W.; Li, H.; Zhu, J.; Li, W.; Li, B. Texture-based classification of different single liver lesion based on SPAIR T2W MRI images. BMC Med. Imaging 2017, 17, 42. [Google Scholar] [CrossRef] [PubMed] [Green Version]
- Liang, H.-Y.; Huang, Y.-Q.; Yang, Z.-X.; Ding, Y.; Zeng, M.-S.; Rao, S.-X. Potential of MR histogram analyses for prediction of response to chemotherapy in patients with colorectal hepatic metastases. Eur. Radiol. 2016, 26, 2009–2018. [Google Scholar] [CrossRef] [PubMed]
- Reimer, R.P.; Reimer, P.; Mahnken, A.H. Assessment of Therapy Response to Transarterial Radioembolization for Liver Metastases by Means of Post-treatment MRI-Based Texture Analysis. Cardiovasc. Interv. Radiol. 2018, 41, 1545–1556. [Google Scholar] [CrossRef]
- Zhang, H.; Li, W.; Hu, F.; Sun, Y.; Hu, T.; Tong, T. MR texture analysis: Potential imaging biomarker for predicting the chemotherapeutic response of patients with colorectal liver metastases. Abdom. Radiol. 2019, 44, 65–71. [Google Scholar] [CrossRef]
- Chatterjee, A.; Vallieres, M.; Dohan, A.; Levesque, I.R.; Ueno, Y.; Bist, V.; Saif, S.; Reinhold, C.; Seuntjens, J. An Empirical Approach for Avoiding False Discoveries When Applying High-Dimensional Radiomics to Small Datasets. IEEE Trans. Radiat. Plasma Med. Sci. 2018, 3, 201–209. [Google Scholar] [CrossRef]
- Peerlings, J.; Woodruff, H.C.; Winfield, J.M.; Ibrahim, A.; Van Beers, B.E.; Heerschap, A.; Jackson, A.; Wildberger, J.E.; Mottaghy, F.M.; DeSouza, N.M.; et al. Stability of radiomics features in apparent diffusion coefficient maps from a multi-centre test-retest trial. Sci. Rep. 2019, 9, 4800. [Google Scholar] [CrossRef] [Green Version]
- Rahmim, A.; Bak-Fredslund, K.P.; Ashrafinia, S.; Lu, L.; Schmidtlein, C.R.; Subramaniam, R.M.; Morsing, A.; Keiding, S.; Horsager, J.; Munk, O.L. Prognostic modeling for patients with colorectal liver metastases incorporating FDG PET radiomic features. Eur. J. Radiol. 2019, 113, 101–109. [Google Scholar] [CrossRef]
- Wagner, F.; Hakami, Y.A.; Warnock, G.; Fischer, G.; Veit-Haibach, P.; Huellner, M. Comparison of Contrast-Enhanced CT and [(18)F]FDG PET/CT Analysis Using Kurtosis and Skewness in Patients with Primary Colorectal Cancer. Mol. Imaging Biol. 2017, 19, 795–803. [Google Scholar] [CrossRef]
- Van Helden, E.J.; Vacher, Y.J.L.; Van Wieringen, W.N.; Van Velden, F.H.P.; Verheul, H.M.W.; Hoekstra, O.S.; Boellaard, R.; Oordt, C.W.M.-V.D.H.V. Radiomics analysis of pre-treatment [(18)F]FDG PET/CT for patients with metastatic colorectal cancer undergoing palliative systemic treatment. Eur. J. Nucl. Med. Mol. Imaging 2018, 45, 2307–2317. [Google Scholar] [CrossRef] [PubMed] [Green Version]
- Shur, J.; Orton, M.; Connor, A.; Fischer, S.; Moulton, C.; Gallinger, S.; Koh, D.; Jhaveri, K.S. A clinical-radiomic model for improved prognostication of surgical candidates with colorectal liver metastases. J. Surg. Oncol. 2019, 121, 357–364. [Google Scholar] [CrossRef] [PubMed]
- Weber, M.; Kessler, L.; Schaarschmidt, B.; Fendler, W.P.; Lahner, H.; Antoch, G.; Umutlu, L.; Herrmann, K.; Rischpler, C. Textural analysis of hybrid DOTATOC-PET/MRI and its association with histological grading in patients with liver metastases from neuroendocrine tumors. Nucl. Med. Commun. 2020, 41, 363–369. [Google Scholar] [CrossRef] [PubMed]
- Lambin, P.; Leijenaar, R.T.; Deist, T.M.; Peerlings, J.; De Jong, E.E.; Van Timmeren, J.; Sanduleanu, S.; LaRue, R.T.H.M.; Even, A.J.; Jochems, A.; et al. Radiomics: The bridge between medical imaging and personalized medicine. Nat. Rev. Clin. Oncol. 2017, 14, 749–762. [Google Scholar] [CrossRef]
- Park, J.E.; Kim, D.; Kim, H.S.; Park, S.Y.; Kim, J.Y.; Cho, S.J.; Shin, J.H.; Kim, J.H. Quality of science and reporting of radiomics in oncologic studies: Room for improvement according to radiomics quality score and TRIPOD statement. Eur. Radiol. 2020, 30, 523–536. [Google Scholar] [CrossRef]
- Whiting, P.; Rutjes, A.W.; Westwood, M.E.; Mallett, S.; Deeks, J.J.; Reitsma, J.B.; Leeflang, M.M.; Sterne, J.A.; Bossuyt, P. QUADAS-2: A Revised Tool for the Quality Assessment of Diagnostic Accuracy Studies. Ann. Intern. Med. 2011, 155, 529–536. [Google Scholar] [CrossRef]
- Schwier, M.; Van Griethuysen, J.; Vangel, M.G.; Pieper, S.; Peled, S.; Tempany, C.; Aerts, H.J.W.L.; Kikinis, R.; Fennessy, F.M.; Fedorov, A. Repeatability of Multiparametric Prostate MRI Radiomics Features. Sci. Rep. 2019, 9, 9441. [Google Scholar] [CrossRef]
- Sollini, M.; Gelardi, F.; Matassa, G.; Delgado Bolton, R.C.; Chiti, A.; Kirienko, M. Interdisciplinarity: An essential requirement for translation of radiomics research into clinical practice—A systematic review focused on thoracic oncology. Rev. Esp. Med. Nucl. Imagen Mol. 2020, 39, 146–156. [Google Scholar] [CrossRef]
- Fiset, S.; Welch, M.L.; Weiss, J.; Pintilie, M.; Conway, J.L.; Milosevic, M.; Fyles, A.; Traverso, A.; Jaffray, D.; Metser, U.; et al. Repeatability and reproducibility of MRI-based radiomic features in cervical cancer. Radiother. Oncol. 2019, 135, 107–114. [Google Scholar] [CrossRef]
- Nioche, C.; Orlhac, F.; Boughdad, S.; Reuzé, S.; Goya-Outi, J.; Robert, C.; Pellot-Barakat, C.; Soussan, M.; Frouin, F.; Buvat, I. LIFEx: A Freeware for Radiomic Feature Calculation in Multimodality Imaging to Accelerate Advances in the Characterization of Tumor Heterogeneity. Cancer Res. 2018, 78, 4786–4789. [Google Scholar] [CrossRef] [Green Version]
- Yan, J.; Schwartz, L.H.; Zhao, B. Semiautomatic segmentation of liver metastases on volumetric CT images. Med. Phys. 2015, 42, 6283–6293. [Google Scholar] [CrossRef] [PubMed]
- Azer, S.A. Deep learning with convolutional neural networks for identification of liver masses and hepatocellular carcinoma: A systematic review. World J. Gastrointest. Oncol. 2019, 11, 1218–1230. [Google Scholar] [CrossRef] [PubMed]
- Munir, K.; Elahi, H.; Ayub, A.; Frezza, F.; Rizzi, A. Cancer Diagnosis Using Deep Learning: A Bibliographic Review. Cancers 2019, 11, 1235. [Google Scholar] [CrossRef] [PubMed] [Green Version]


| First Author | Year | Diagnosis | # | Radiological Technique | Analyzed Series | Radiomics Software Program | Analysis of Second-Order Radiomic Features | Relevant Radiomics Features | RQS (%) | TRIPOD (%) |
|---|---|---|---|---|---|---|---|---|---|---|
| Ahn S.J. [37] | 2016 | CRC | 235 | CT | PVP | C++ based | N | Skewness | 4 (11%) | 18 (58%) |
| Ahn S.J. [36] | 2019 | NS | 259 | CT | PVP | Custom C++ | Y | Skewness, kurtosis, entropy, uniformity, and GLCM | 4 (11%) | 20 (65%) |
| Andersen I.R. [32] | 2019 | CRC | 27 | CT | Dynamic contrast, PVP | MatLab-based | N | Skewness, entropy, and uniformity | 12 (33%) | 19 (61%) |
| Beckers R.C.J. [38] | 2018 | CRC | 70 | CT | PVP | MatLab-based | N | Entropy and uniformity | 5 (14%) | 21 (68%) |
| Chatterjee A. [57] | 2018 | NS | 69 | MRI | T1, Fast spin-echo T2, DWI | NS | Y | GLCM, GLRLM | 17 (47%) | 15 (48%) |
| Cheng J. [39] | 2019 | CRC | 94 | CT | Arterial, PVP | NS | Y | GLSZM, GLNU | 21 (58%) | 20 (65%) |
| Dercle L. [40] | 2020 | CRC | 667 | CT | PVP | NS | Y | Entropy, GTDM, Shape | 22 (61%) | 13 (42%) |
| Dercle L. [35] | 2017 | NS | 14 | CT | PVP | TexRAD | N | Entropy | 11 (31%) | 22 (71%) |
| Dohan A. [33] | 2019 | CRC | 230 | CT | PVP | TexRAD | N | Kurtosis | 21 (58%) | 20 (65%) |
| Gatos I. [51] | 2017 | Multiple | 22 | MRI 1,5 T | T2- and DWI | NS | Y | GLCM, GLRLM | 7 (19%) | 14 (14%) |
| Jansen M.J.A. [52] | 2019 | Multiple | 95 | MRI 1,5 T | T2-weighted | NS | Y | Entropy, GLCM | 15 (42%) | 16 (52%) |
| Klaassen R. [41] | 2018 | EC | 18 | CT | Late contrast phase | MatLab-based | Y | GLCM | 14 (39%) | 23 (74%) |
| Li Y. [42] | 2019 | CRC | 24 | CT | PVP | ITK-SNAP | Y | Entropy, uniformity, and GLRLM | 15 (42%) | 18 (58%) |
| LI Z. [53] | 2017 | NS | 67 | MRI 3 T | T2-weighted SPAIR | NS | Y | GLCM, GLRLM, GLSZM | 14 (39%) | 17 (55%) |
| Liang H.Y. [54] | 2016 | CRC | 53 | MRI 1,5 T | ADC maps, arterial, PVP | MaZda | N | None significant | 2 (5%) | 16 (52%) |
| Lubner M.G. [43] | 2015 | CRC | 77 | CT | PVP | TexRAD | N | Entropy, Energy | 5 (14%) | 18 (58%) |
| Martini I. [44] | 2019 | NET | 48 | CT | Arterial and PVP | TexRAD | N | Skewness, Kurtosis, and Entropy | 1 (3%) | 16 (52%) |
| Meyer M. [34] | 2019 | CRC | 78 | CT | PVP | Radiomics | Y | Kurtosis, energy, GLCM, GLRLM, and GLSZM | 20 (56%) | 16 (52%) |
| Peerlings [58] | 2019 | Multiple | 30 | MRI 1,5 and 3 T | DWI | MatLab-based | Y | GLCM, GLRLM, GTDM, GLSZM | 6 (16%) | 18 (58%) |
| Rahmim A. [59] | 2019 | CRC | 52 | PET/CT | 18F-FDG PET | NS | N | Uniformity | 6 (16%) | 19 (61%) |
| Rao S.X. [45] | 2015 | CRC | 21 | CT | PVP | MatLab-based | N | Entropy and uniformity | 1 (3%) | 19 (61%) |
| Ravanelli M. [46] | 2019 | CRC | 43 | CT | PVP | MatLab-based | N | Uniformity | 16 (45%) | 17 (55%) |
| Reimer R.P. [55] | 2018 | Multiple | 37 | MRI 1,5 T | T1, PVP and hepatocellular | Mint Lesion | N | Skewness and Kurtosis | 5 (14%) | 17 (55%) |
| Shur J. [62] | 2019 | CRC | 102 | CT; 1,5/3 T MRI | PVP (CT); T1 FS and hepatocellular MRI | Pyradiomics | Y | GLSZM | 7 (19%) | 29 (94%) |
| Simpson A.L. [47] | 2017 | CRC | 198 | CT | PVP | NS | Y | GLCM | 5 (14%) | 19 (61%) |
| Song S. [48] | 2019 | Multiple | 20 | CT | Arterial phase | Omni-Kinetic | Y | Kurtosis, GLCM | 15 (42%) | 15 (48%) |
| Trebeschi [49] | 2019 | Multiple | NS | CT | NS | NS | Y | GLSZM | 17 (47%) | 16 (52%) |
| Van Helden E.J. [61] | 2018 | CRC | 47 | PET/CT | 18F-FDG PET | NS | Entropy and Shape | 8 (25%) | 17 (55%) | |
| Velichko Y.S. [50] | 2020 | BC | 54 | CT | PVP | LIFEX | Y | Uniformity and GLCM | 5 (14%) | 15 (48°%) |
| Wagner F. [60] | 2017 | CRC | 18 | CT; PET/CT | PVP (CT), 18F-FDG PET | Pmod 3.5 | N | Skewness and kurtosis | 1 (3%) | 19 (61%) |
| Weber M. [63] | 2019 | NET | 100 | PET/MRI | 68Ga-DOTAPET; MRI ADC | LIFEX | Y | Entropy, uniformity, and GLCM | 5 (14%) | 16 (52%) |
| Zhang H. [56] | 2018 | CRC | 26 | MRI 3 T | T2-weighted | MatLab-based | Y | GLCM | 9 (25%) | 17 (55%) |
| Evaluation | Risk of Bias | Applicability Concerns | |||||
|---|---|---|---|---|---|---|---|
| Patient Selection | Index Test | Reference Standard | Flow and Timing | Patient Selection | Index Test | Reference Standard | |
| Low Risk | 15 (47%) | 18 (56%) | 18 (56%) | 28 (87%) | 21 (65%) | 21 (65%) | 19 (59%) |
| High Risk | 11 (34%) | 8 (25%) | 8 (25%) | 1 (3%) | 8 (25%) | 6 (19%) | 6 (19%) |
| Unclear | 6 (19%) | 6 (19%) | 6 (19%) | 3 (10%) | 3 (10%) | 5 (16%) | 7 (22%) |
| Feature Family | General Descriptio | Common Features | Specific Description |
|---|---|---|---|
| Shape & Size | 2D/3D geometric properties of the region of interest | Area | |
| Volume | Number of voxels in the ROI | ||
| Maximum 3D diameter | The maximum distance between any two voxels on the surface of the ROI | ||
| Major axis length | |||
| Minor axis length | |||
| Surface Area | |||
| Compactness | How compact the region is independent of scale and orientation | ||
| Elongation | The inverse of compactness | ||
| Flatness | Absence of curvature in an ROI | ||
| Sphericity | The roundness of the shape of the ROI relative to a sphere | ||
| Spherical disproportion | ROI surface area/surface area of a sphere based on ROI radius | ||
| First Order Statistics | Intensity distribution in the ROI based on the intensity histogram, regardless of the spatial relationships | Intensity | Includes mean, min, max, SD, and percentiles |
| Energy | The magnitude of voxel intensities (sum of square voxel values) | ||
| Uniformity/homogeneity | The sum of the squares of each intensity value in the ROI | ||
| Entropy | Amount of information in voxel values | ||
| Skewness | Asymmetry of values. Negative skewness: data are skewness to the right of the mean (higher values). Positive skewness: data are skewed to the left of the mean (lower values). | ||
| Kurtosis | Distribution of voxel values. Low kurtosis: most data points are close to the mean (few outliers). High kurtosis: data are spread far from the mean (more outliers). | ||
| Second-Order Statistics | Textural features quantifying tumor heterogeneity by analyzing the spatial distribution of pixel/voxel intensities | Gray level co-occurrence matrix (GLC M) | Measures the arrangements of voxel pairs along a fixed direction (homogeneity, contrast, correlation, entropy, dissimilarity, and angular second moment/energy) |
| Gray level run length matrix (GLRLM) | Consecutive voxels with the same intensity along with fixed directions (can have long- or short-run, as well as low- and high-gray level emphasis). | ||
| Gray level size zone matrix (GLSZM) | Clusters of connected pixels with the same grey value. They can have small- and large-area as well as low- or high-gray emphasis. | ||
| Neighborhood gray tone/level difference matrix (NGTDM/NGLDM) | The difference in gray level between one voxel and its 8/26directions (in 2D/3D). Includes rate, intensity, and frequency of intensity change. | ||
| Model-or transform-based Statistics | Relationship between three or more pixels or voxels | Autoregressive model | Filters or mathematical transforms to the images identifying repetitive or non-repetitive patterns, suppressing noise, or highlighting details, extract areas with increasingly coarse texture patterns |
| Wavelet transform | |||
| Fractal analysis | |||
| Minkowski functionals | |||
| Fourier transform |
| First Author | Year | Design | # | Imaging | Analyzed Imaging | Main Intervention | Intervention Type | Pathology Data | Validation Cohort | Outcome Measures | Synopsis of Findings |
|---|---|---|---|---|---|---|---|---|---|---|---|
| Survival | |||||||||||
| Lubner M.G. [43] | 2015 | R | 77 | CT | Pre-therapy | Systemic therapy | NS | Y | N | OS | Entropy correlated with longer OS |
| Simpson A.L. [47] | 2017 | R | 198 | CT | Pre-therapy | Surgery | Metastasectomy | N | N | OS/HDFS | Tumor correlation and contrast were associated with OS; future liver remnant energy and entropy were associated with OS and HDFS |
| Andersen I.R. [32] | 2019 | P | 27 | CT | Pre/post-therapy | Systemic therapy | Regorafenib | N | N | OS | LM uniformity predicted shorter OS; LM entropy predicted longer OS |
| Beckers R.C.J. [38] | 2018 | R | 70 | CT | Pre-therapy | Systemic therapy or surgery | XELOX with or w/o Bevacizumab | N | N | OS | LM/parenchyma entropy ratio correlated with disease burden and OS. |
| Dercle L. [40] | 2020 | R | 667 | CT | Pre/post-therapy | Systemic therapy | FOLFIRI with-w/o Cetuximab | N | Y | OS | A signature using Shape SI4, Log Z/X Entropy, GTDM Contrast can predict OS. |
| Dohan A. [33] | 2019 | P | 230 | CT | Pre/post-therapy | Systemic therapy | FOLFIRI and Bevacizumab | N | Y | OS | A radiomic score granted earlier OS prediction than RECIST 1.1 |
| Rahmim A. [59] | 2019 | R | 52 | FDG PET | Pre-therapy | Mixed | Systemic, RF, or Metastasectomy | N | N | OS, EFS | LM heterogeneity predicts OS; histogram uniformity predicts EFS |
| Ravanelli M. [46] | 2019 | R | 43 | CT | Pre/post-therapy | Systemic therapy | FOLFIRI/FOLFOX with-w/o Bevacizumab | N | N | OS, PFS | Uniformity was related to PFS; uniformity and CT density were associated with OS in the EGFR group |
| Shur J. [62] | 2019 | R | 102 | CT; MRI | Pre-surgery | Neoadjuvant therapy and surgery | NS, Metastasectomy | N | N | DFS | Minimum pixel value and GLSZM small area emphasis are associated with DFS. |
| Van Helden E.J. [61] | 2018 | R | 47 | FDG PET | Pre-therapy | Systemic therapy | XELOX with or w/o Bevacizumab or Cetuximab | N | N | OS, PFS | AUC-ISH predicted OS and PFS |
| Response to Chemotherapy | |||||||||||
| Ahn S.J. [36] | 2016 | R | 235 | CT | Pre-therapy | Systemic therapy | FOLFIRI or FOLFOX | N | Y | RECIST | Lower skewness on 2D, higher attenuation in 3D, narrower SD on 3D predict the therapy response |
| Andersen I.R. [32] | 2019 | P | 27 | CT | Pre/post-therapy | Systemic therapy | Regorafenib | N | N | RECIST | Entropy and skewness increased; uniformity decreased after treatment |
| Beckers R.C.J. [38] | 2018 | R | 56 | CT | Pre-therapy | Systemic therapy | XELOX with-w/o Bevacizumab | N | N | RECIST | LM entropy showed a trend for being higher in responders |
| Dercle L. [40] | 2020 | R | 667 | CT | Pre/post-therapy | Systemic therapy | FOLFIRI with-w/o Cetuximab | N | Y | RECIST | Shape SI4, Log Z/X Entropy, GTDM Contrast can predict Cetuximab sensitivity. |
| Dohan A. [33] | 2019 | P | 230 | CT | Pre/post-therapy | Systemic therapy | FOLFIRI and Bevacizumab | N | Y | RECIST | LM density, integrated into a radiomics score, identified responders. |
| Liang H.Y. [54] | 2015 | R | 53 | MRI | Pre-therapy | Systemic therapy | Fluorouracil-based chemotherapy | N | N | RECIST | Mean ADC values are lower in responders. |
| Rao S.X. [45] | 2015 | R | 21 | CT | Pre/post-therapy | Systemic therapy | XELOX with-w/o Bevacizumab | Y | N | TRG | A decrease in entropy and uniformity increase after treatment correlates with response. |
| Ravanelli M. [46] | 2019 | R | 43 | CT | Pre/post-therapy | Systemic therapy | FOLFIRI/FOX with-w/o Bevacizumab | N | N | RECIST | Uniformity discriminated EGFR responders from non-responders |
| Van Helden E.J. [61] | 2018 | R | 47 | FDG PET | Pre-therapy | Systemic therapy | XELOX with or w/o Bevacizumab or Cetuximab | N | N | RECIST | Entropy was higher in patient non-responders |
| Zhang H. [56] | 2018 | R | 26 | MRI | Pre-therapy | Systemic therapy | FOLFORI or FOLFOX or XELOX | N | N | Size change | Responding LM had a higher variance and lower angular second moment |
| Miscellaneous | |||||||||||
| Cheng J. [39] | 2019 | R | 94 | CT | Pre-therapy | Surgery | Partial hepatectomy | Y | Y | HGP | A clinic-radiomics model (GLSZM and gray level non-uniformity) can predict growth patterns. |
| Li Y. [42] | 2019 | R | 24 | CT | Pre-therapy | Surgery | Colectomy, lymphadenectomy, metastasectomy | N | Y | LM occurrence | Heterogeneity, entropy, energy, and GLRLM_LGE predicted the risk of LM |
| Reimer R.P. [55] | 2018 | R | 16 | MRI | Post-therapy | TARE | TARE with 90Y-microspheres | N | N | RECIST | High kurtosis (arterial/venous) and low skewness (venous) identified progression |
| Wagner F. [60] | 2017 | R | 18 | CT; FDG PET | Pre-therapy | Systemic therapy | NS | N | N | Primary/LM | Skewness and kurtosis (CT) and kurtosis (PET) are different in primary and LM |
© 2020 by the authors. Licensee MDPI, Basel, Switzerland. This article is an open access article distributed under the terms and conditions of the Creative Commons Attribution (CC BY) license (http://creativecommons.org/licenses/by/4.0/).
Share and Cite
Fiz, F.; Viganò, L.; Gennaro, N.; Costa, G.; La Bella, L.; Boichuk, A.; Cavinato, L.; Sollini, M.; Politi, L.S.; Chiti, A.; et al. Radiomics of Liver Metastases: A Systematic Review. Cancers 2020, 12, 2881. https://doi.org/10.3390/cancers12102881
Fiz F, Viganò L, Gennaro N, Costa G, La Bella L, Boichuk A, Cavinato L, Sollini M, Politi LS, Chiti A, et al. Radiomics of Liver Metastases: A Systematic Review. Cancers. 2020; 12(10):2881. https://doi.org/10.3390/cancers12102881
Chicago/Turabian StyleFiz, Francesco, Luca Viganò, Nicolò Gennaro, Guido Costa, Ludovico La Bella, Alexandra Boichuk, Lara Cavinato, Martina Sollini, Letterio S. Politi, Arturo Chiti, and et al. 2020. "Radiomics of Liver Metastases: A Systematic Review" Cancers 12, no. 10: 2881. https://doi.org/10.3390/cancers12102881