
Papillary Thyroid Carcinoma Tissue miR-146b, -21, -221, -222, -181b Expression in Relation with Clinicopathological Features

 , , , ,
  ,
,
Abstract
:1. Introduction
2. Materials and Methods
2.1. Human Tissue Samples
2.2. microRNA Isolation and Reverse Transcription-Quantitative PCR
2.3. Statistical Analysis
2.4. The Cancer Genome Atlas (TCGA) Database Analysis
3. Results
3.1. Study Population
3.2. Papillary Thyroid Carcinoma Tissue miR-146b, -21, -221, -222, -181b Expression in Relation with Clinicopathological Features
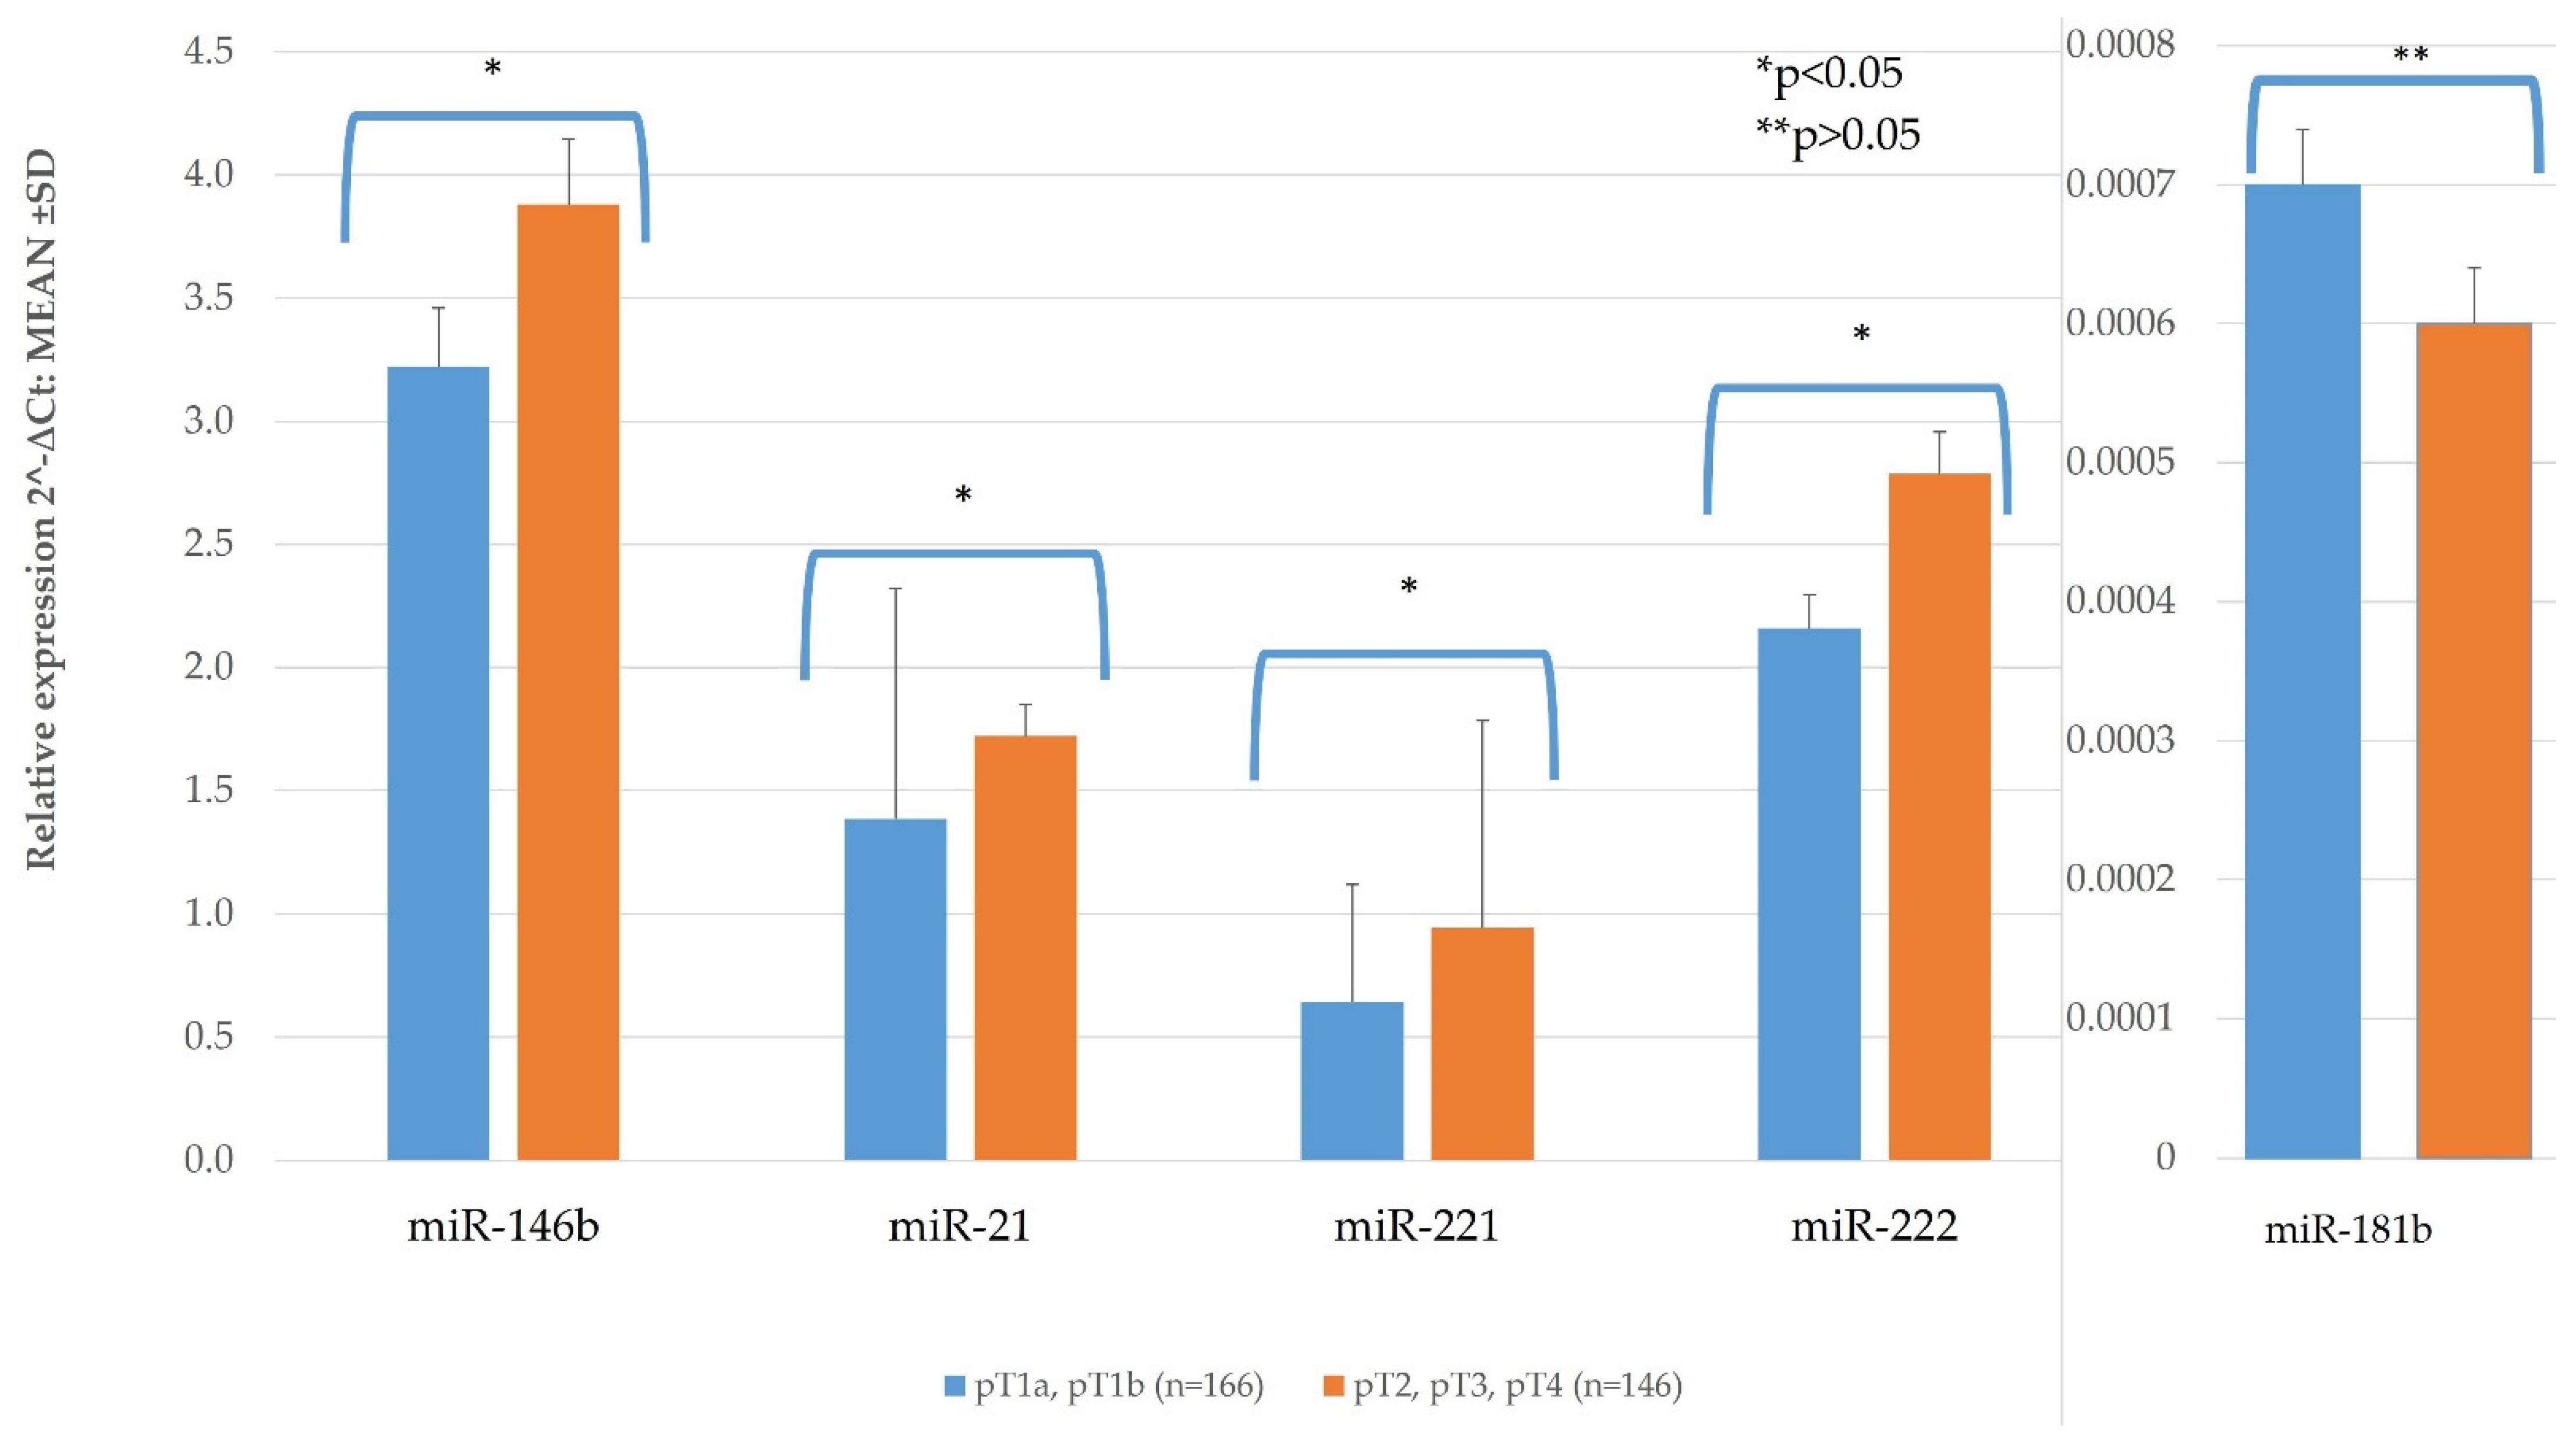
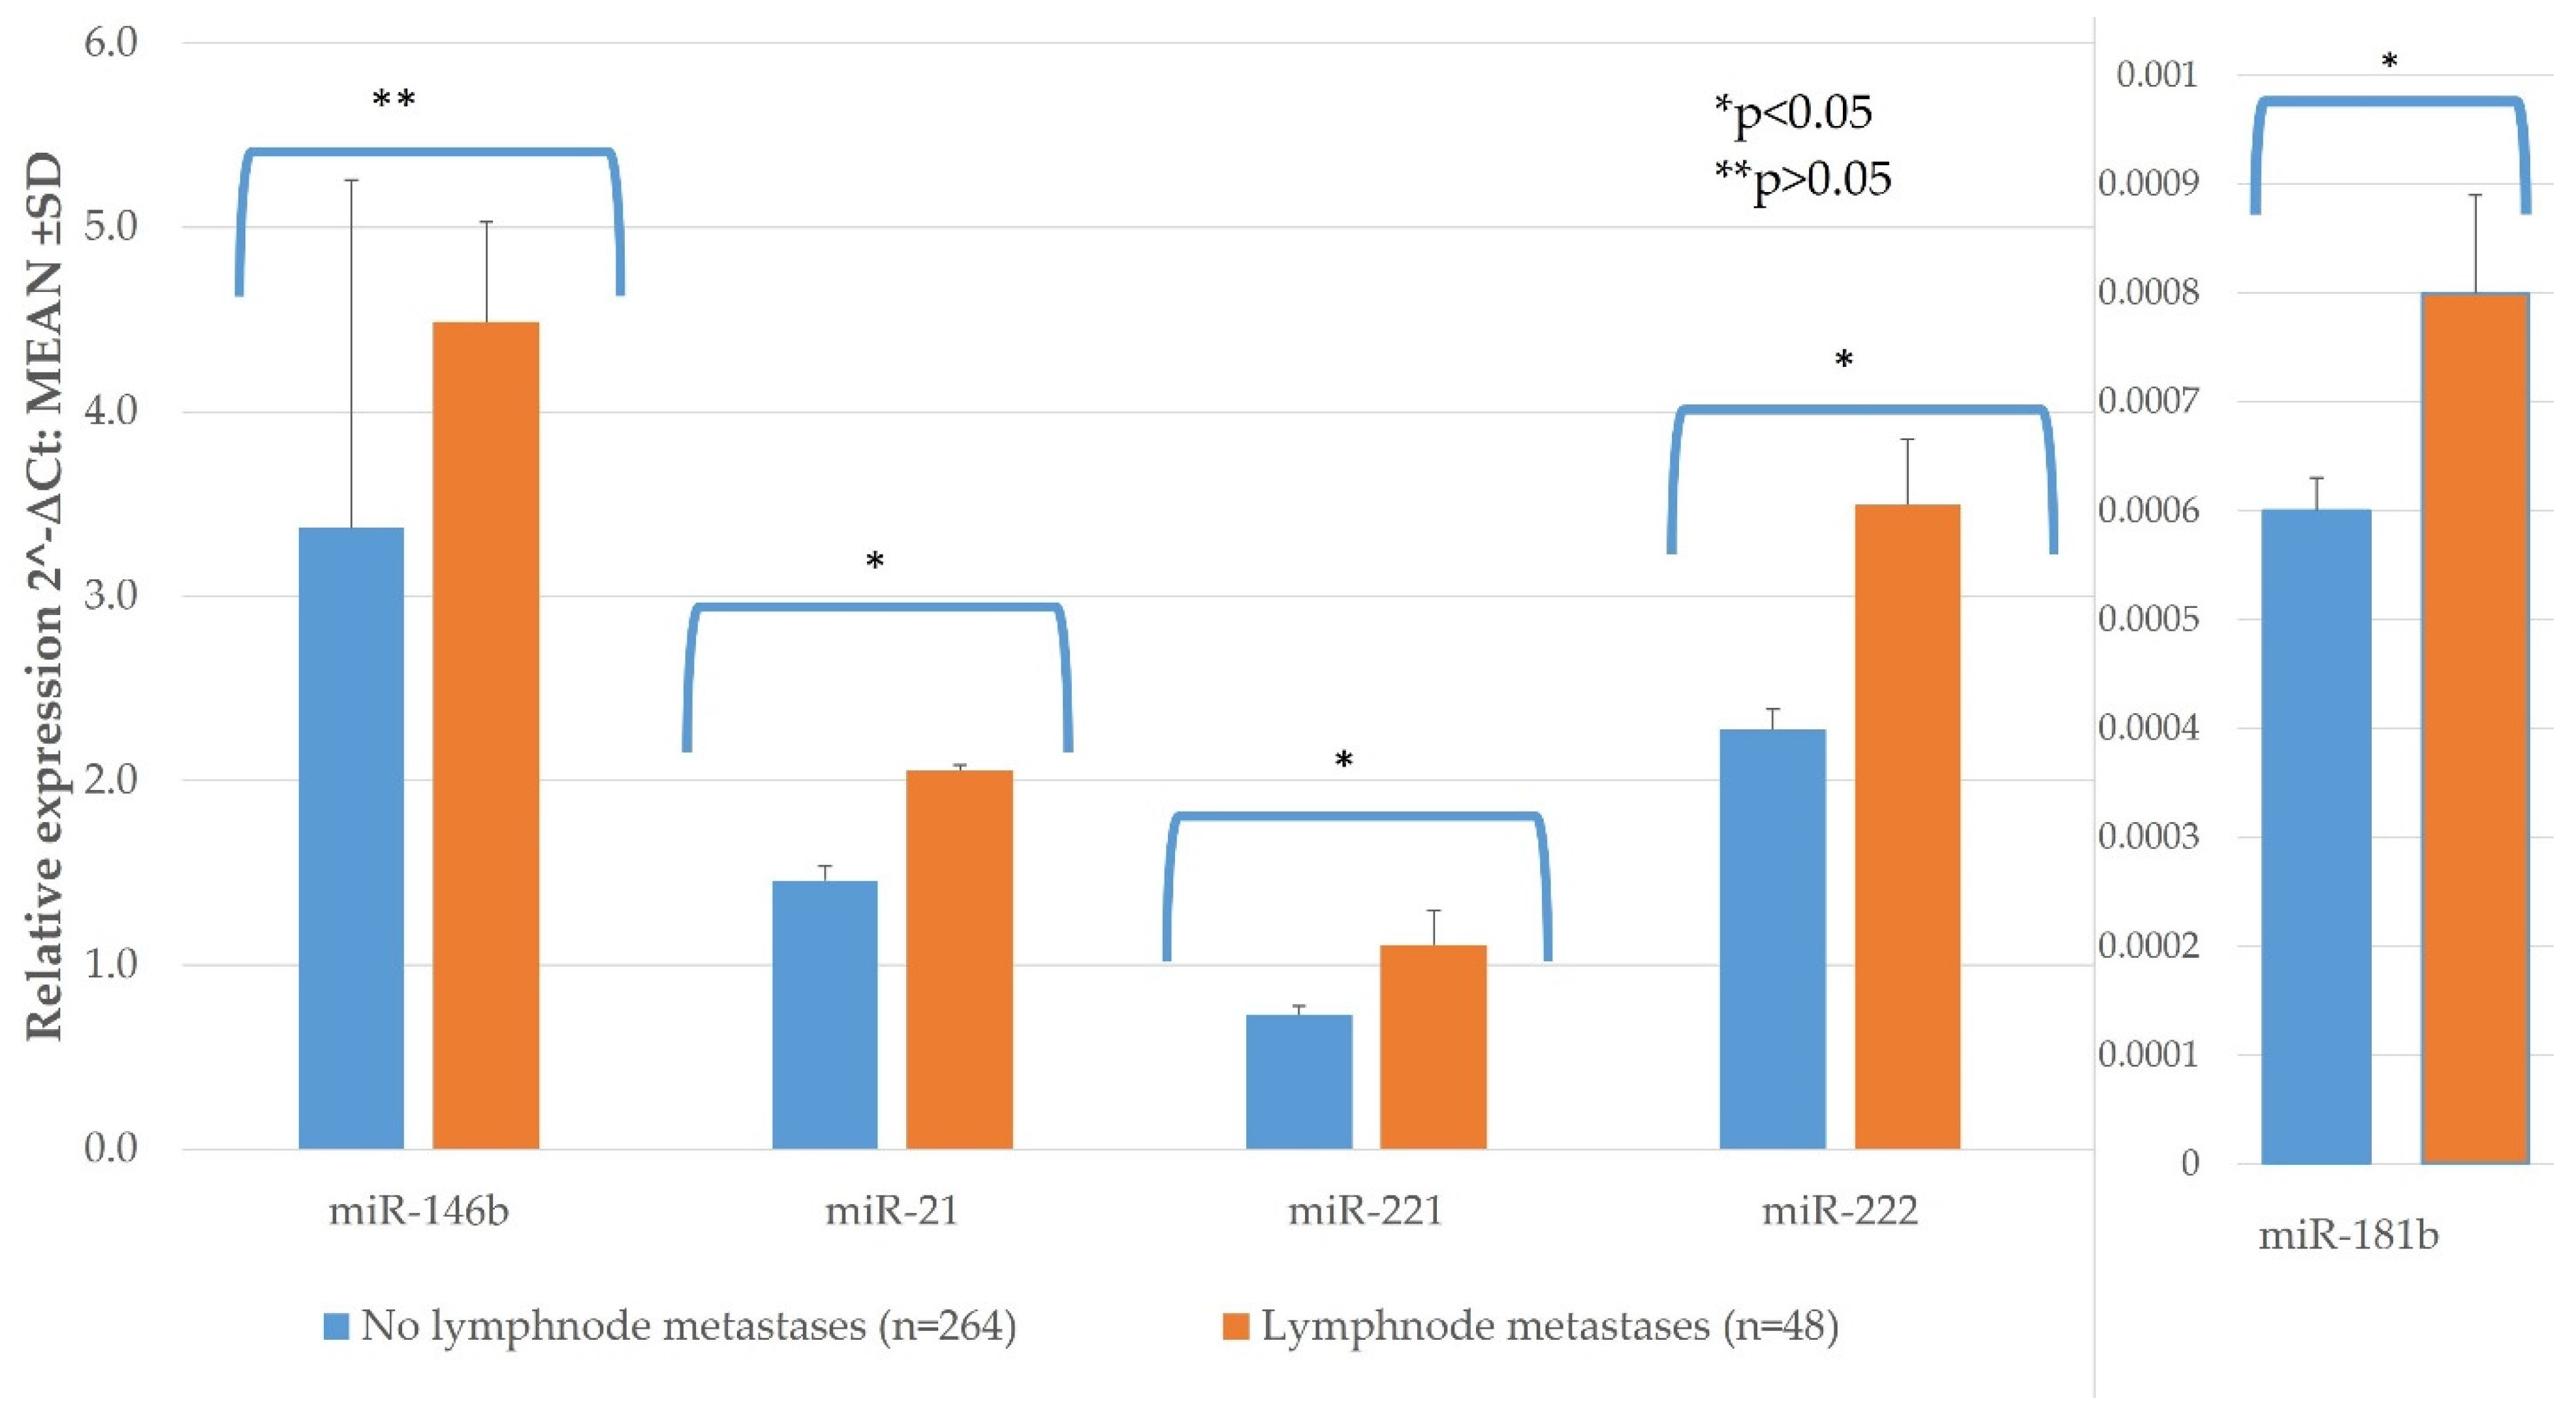
3.2.1. TNM and miR Expression
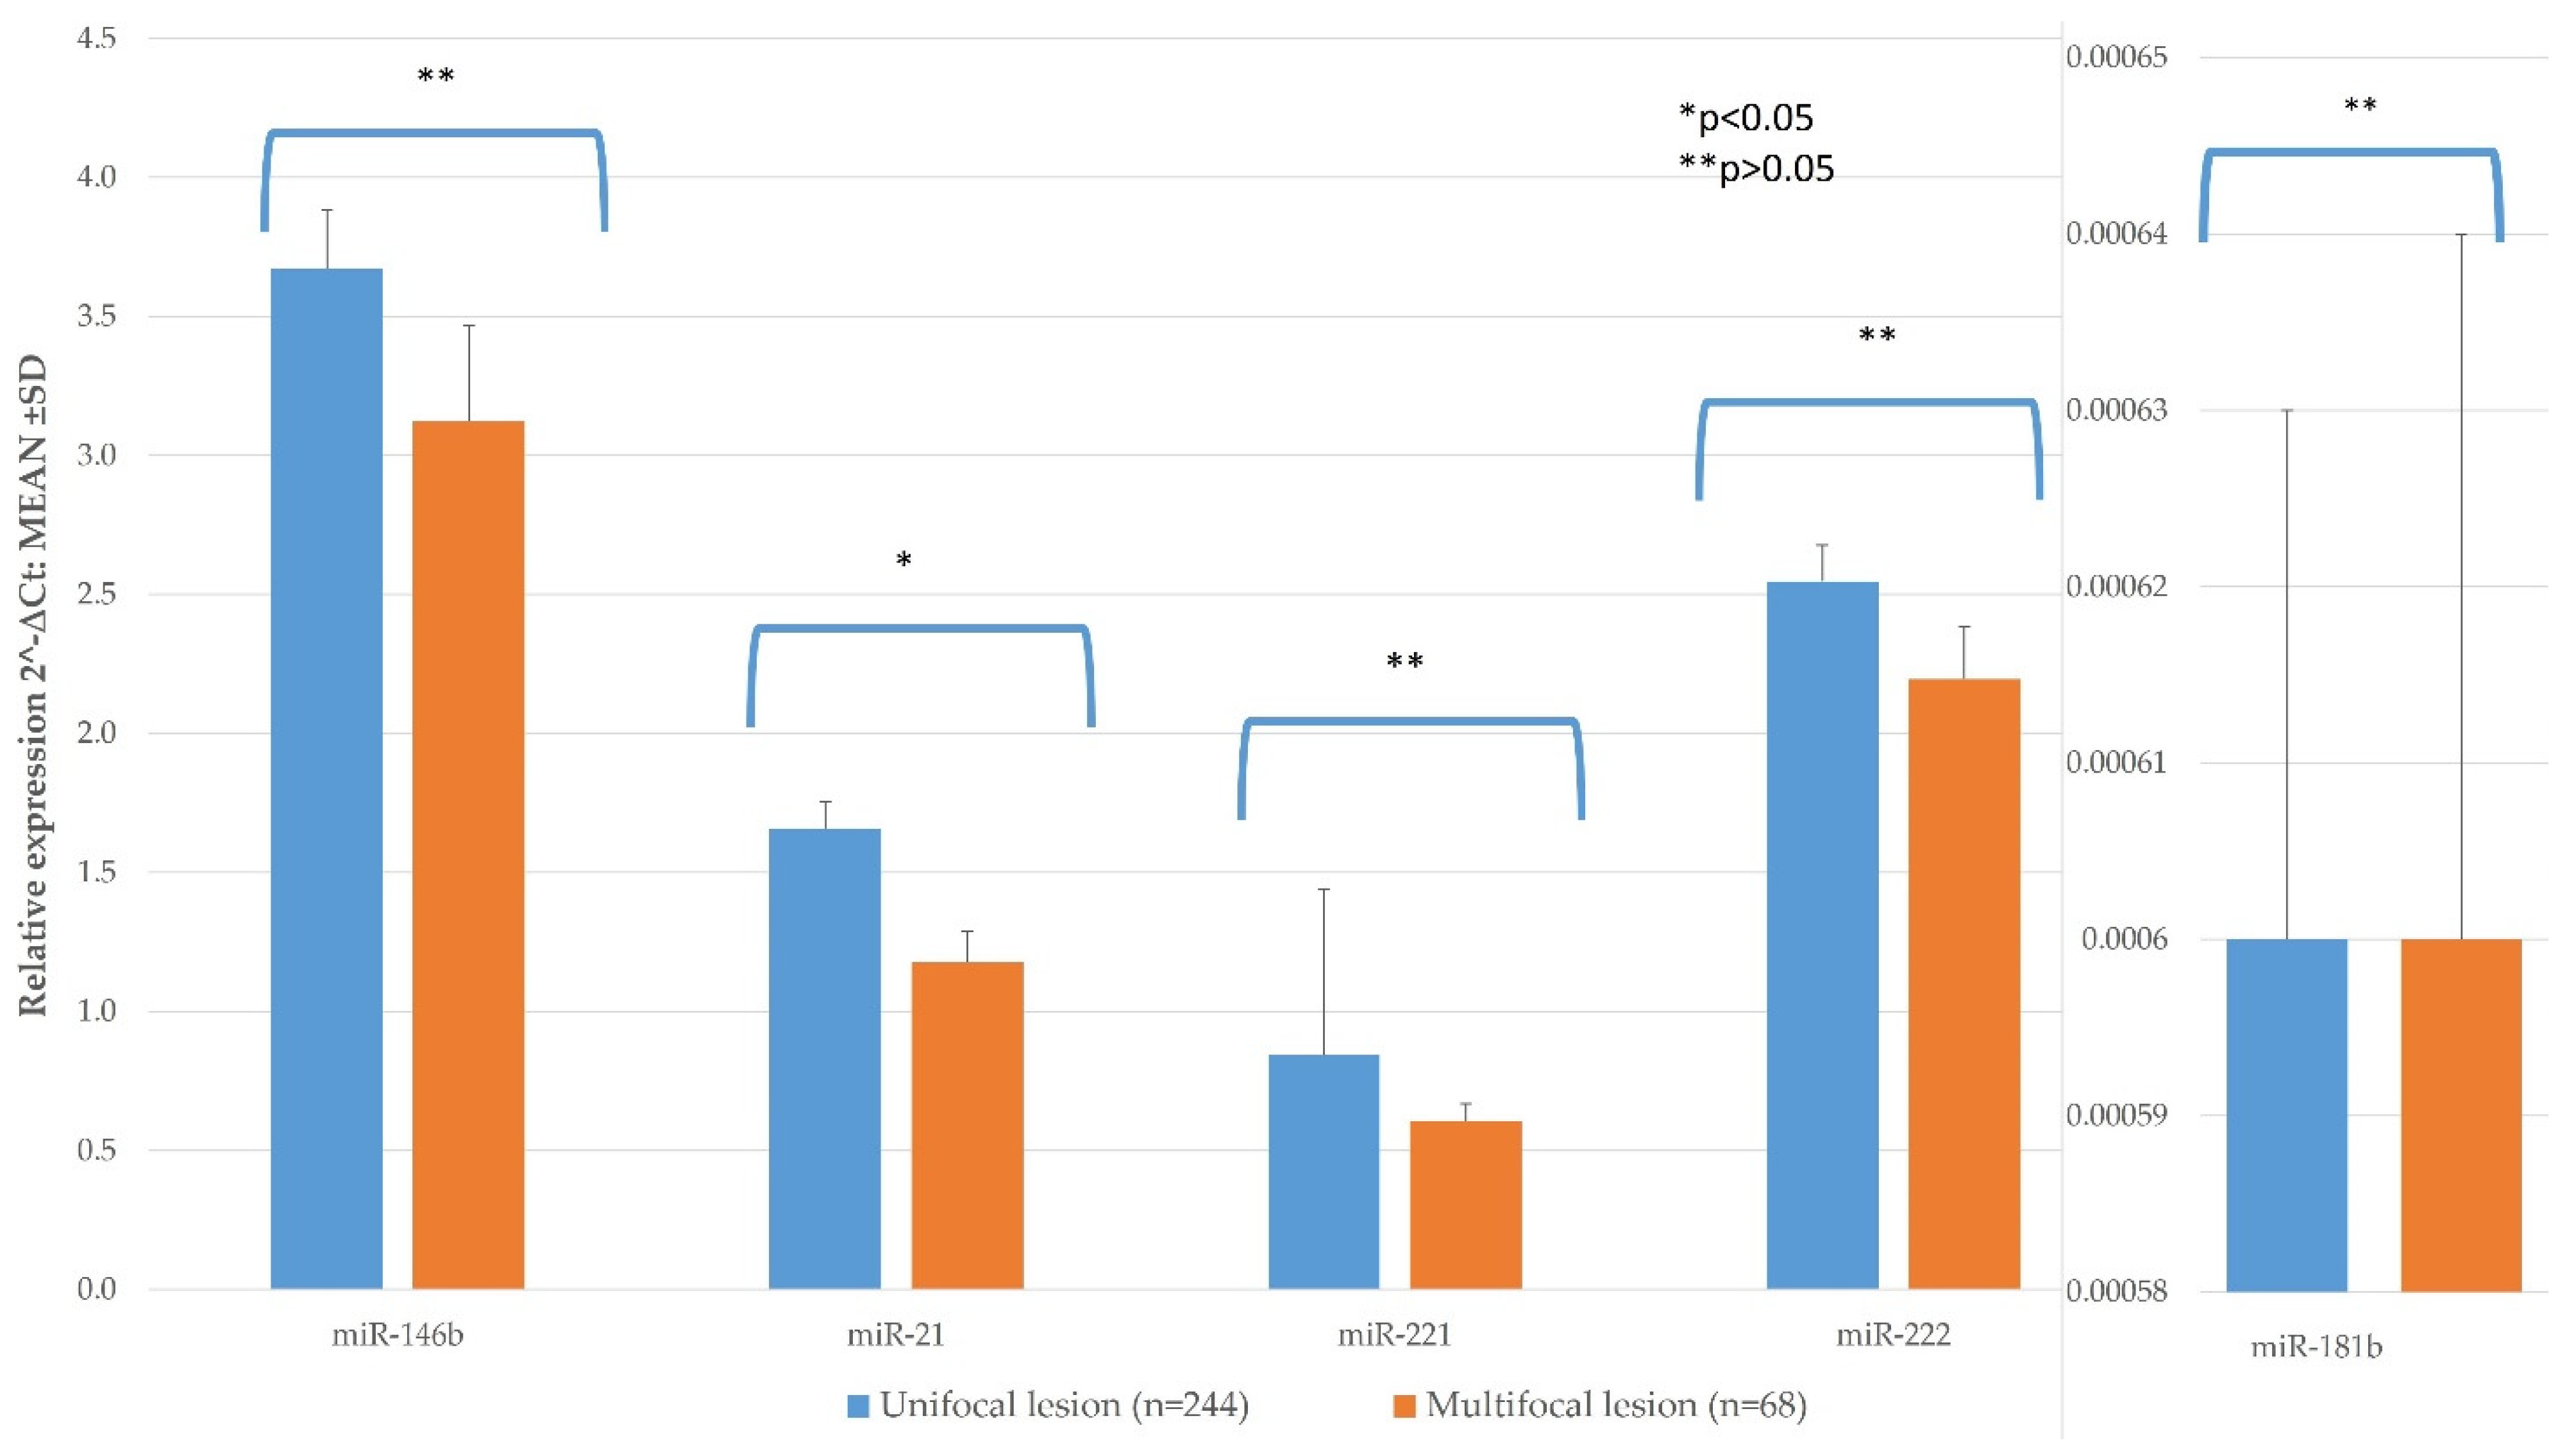
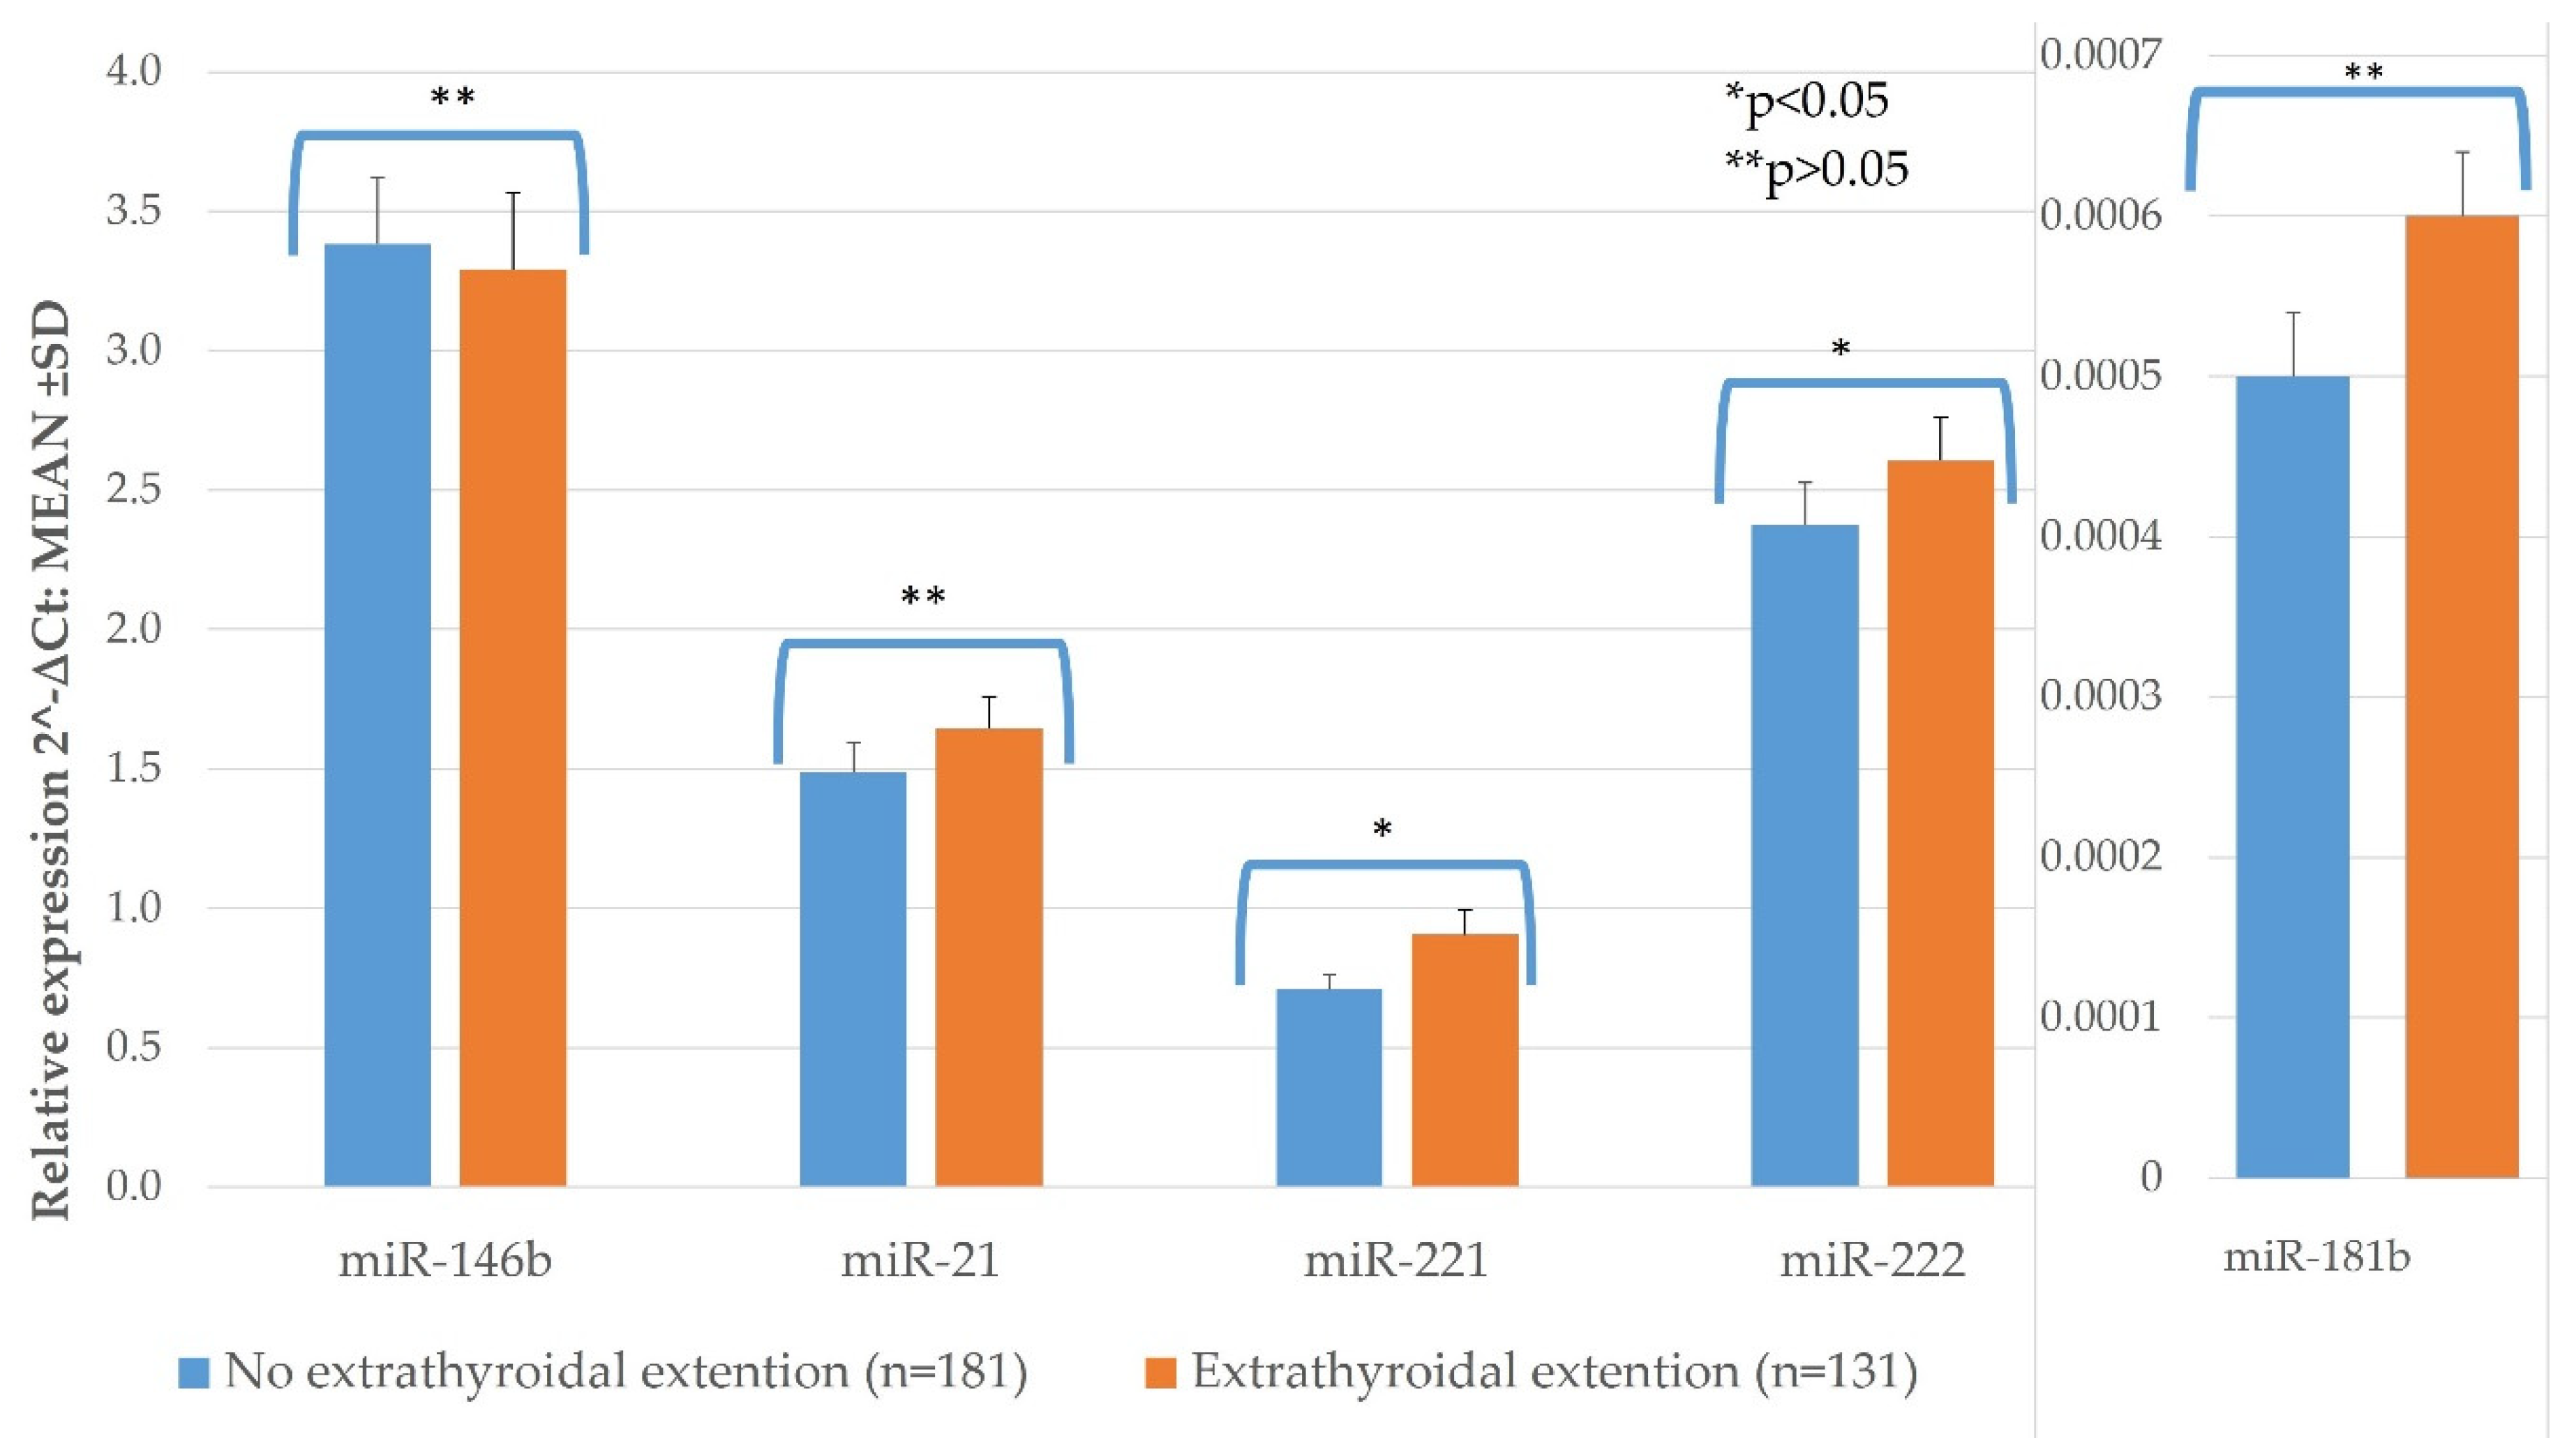
3.2.2. Histological Features and miR Expression
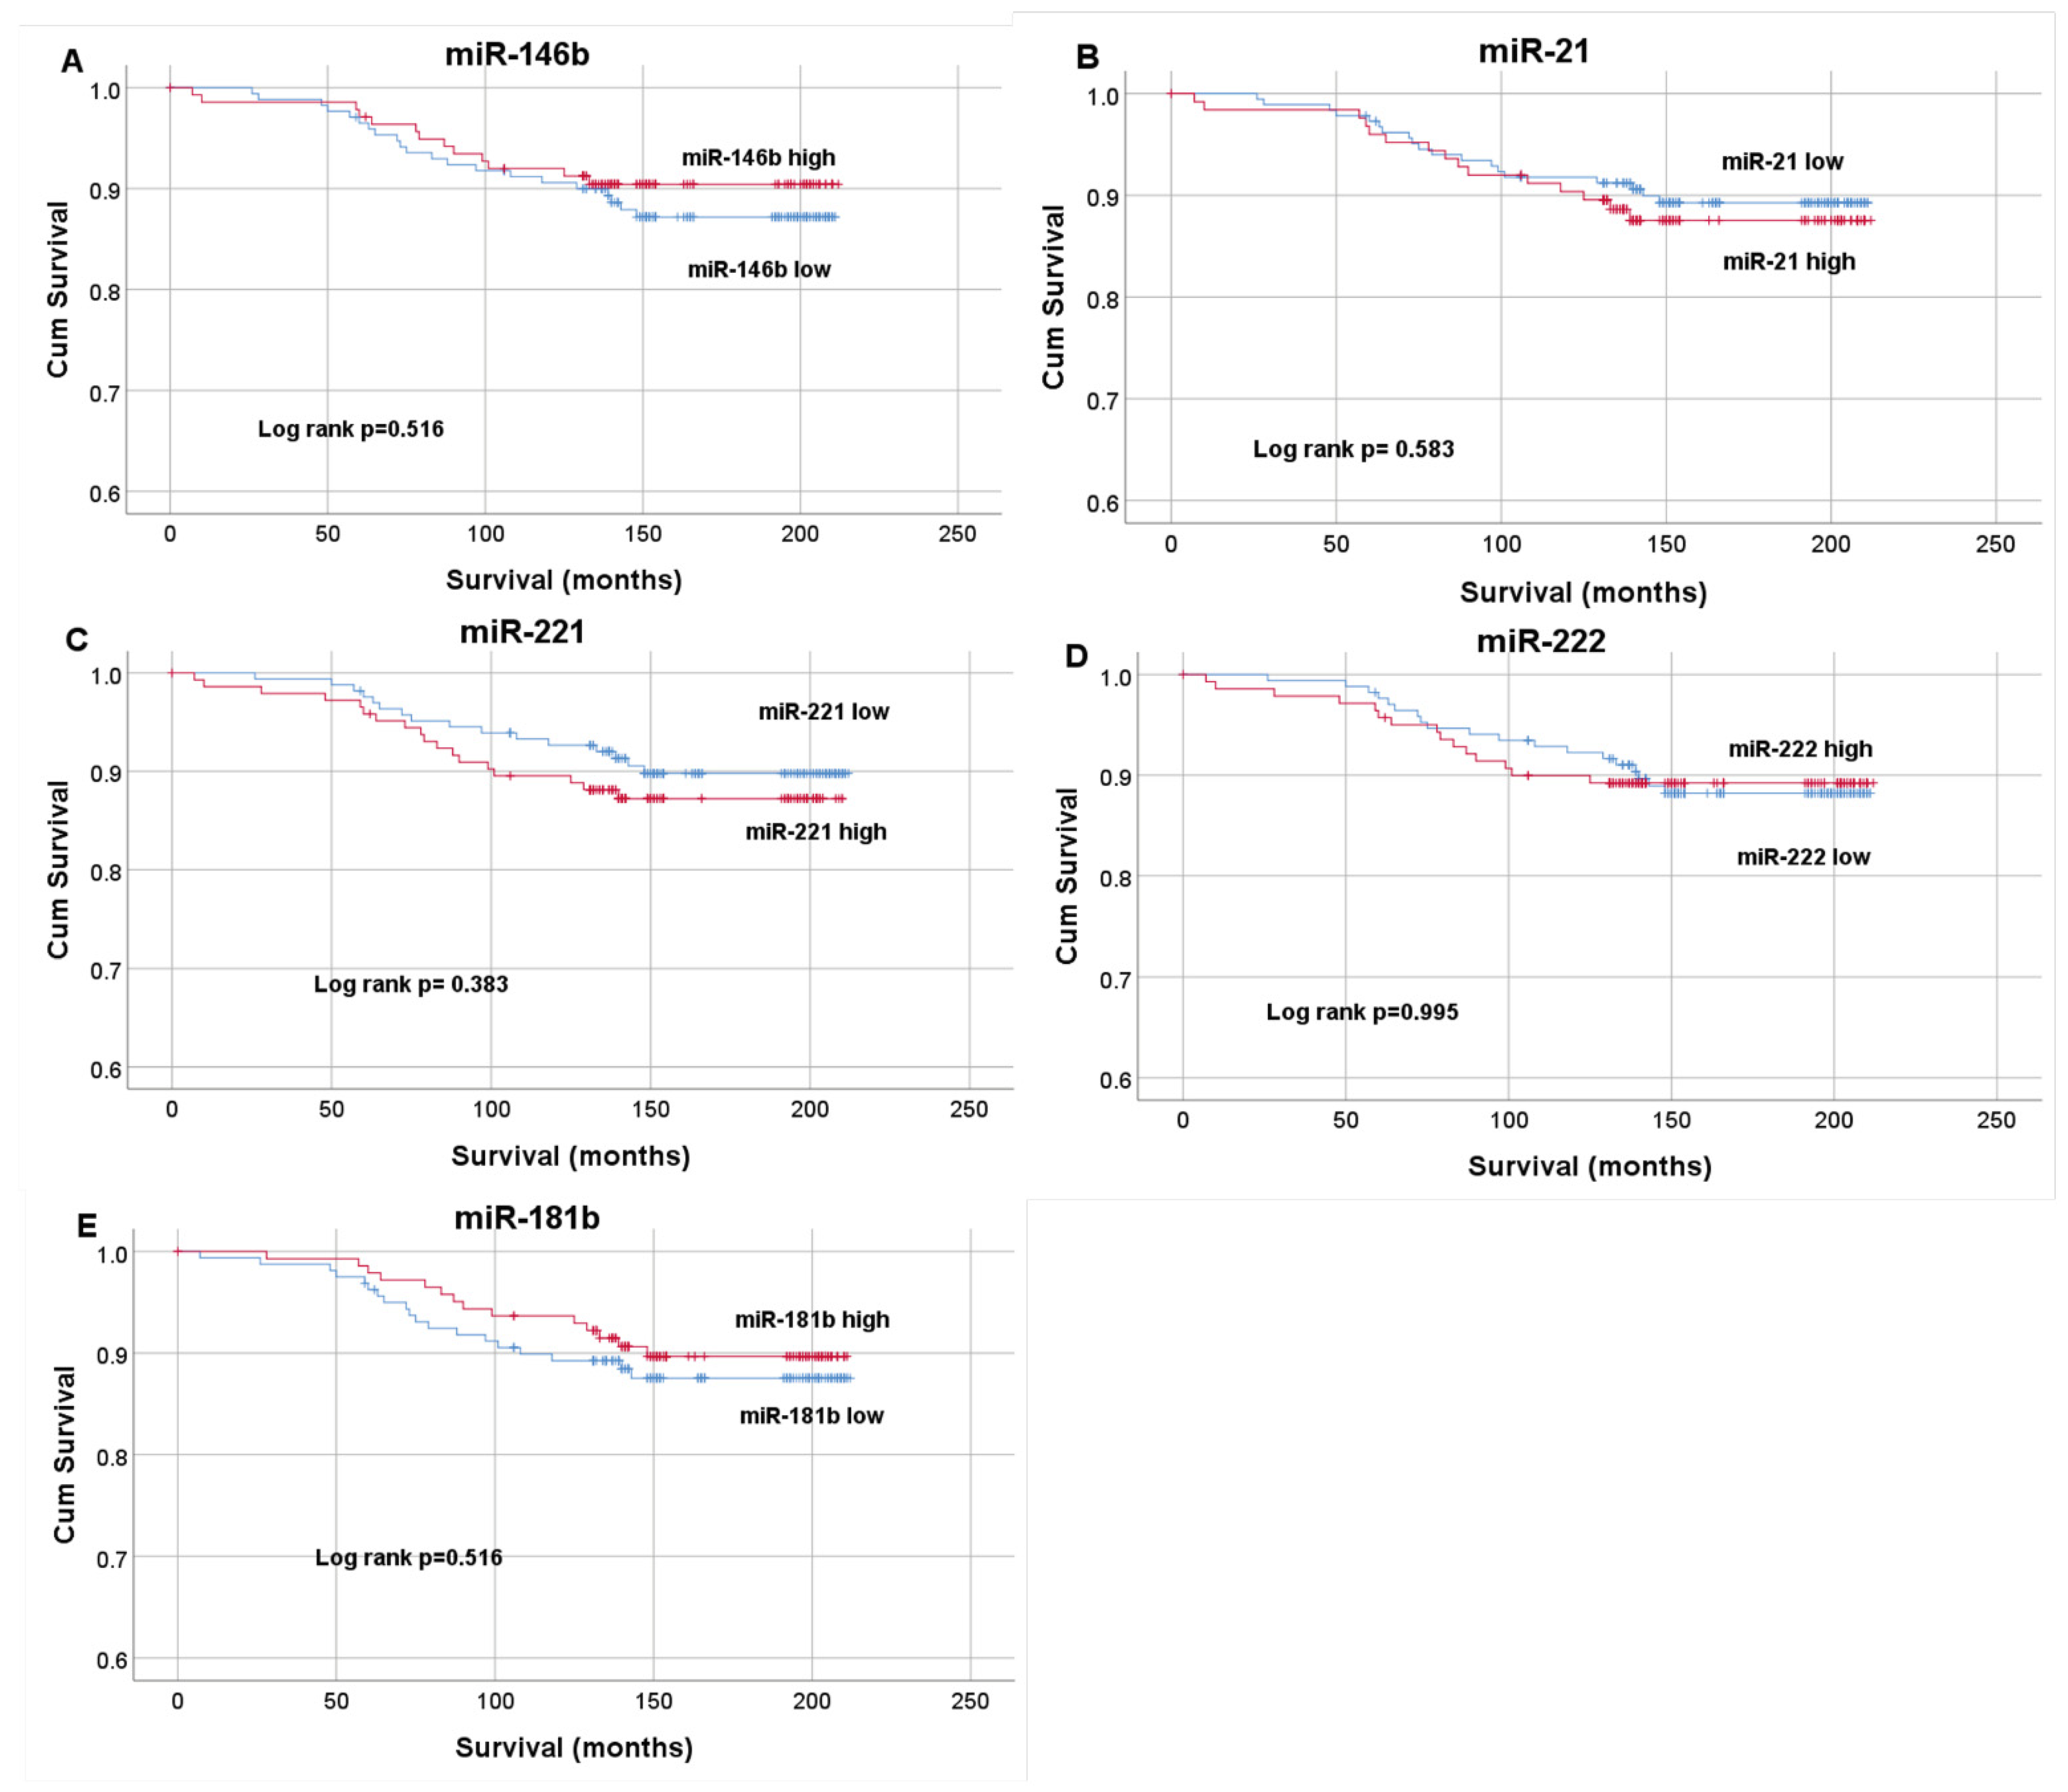
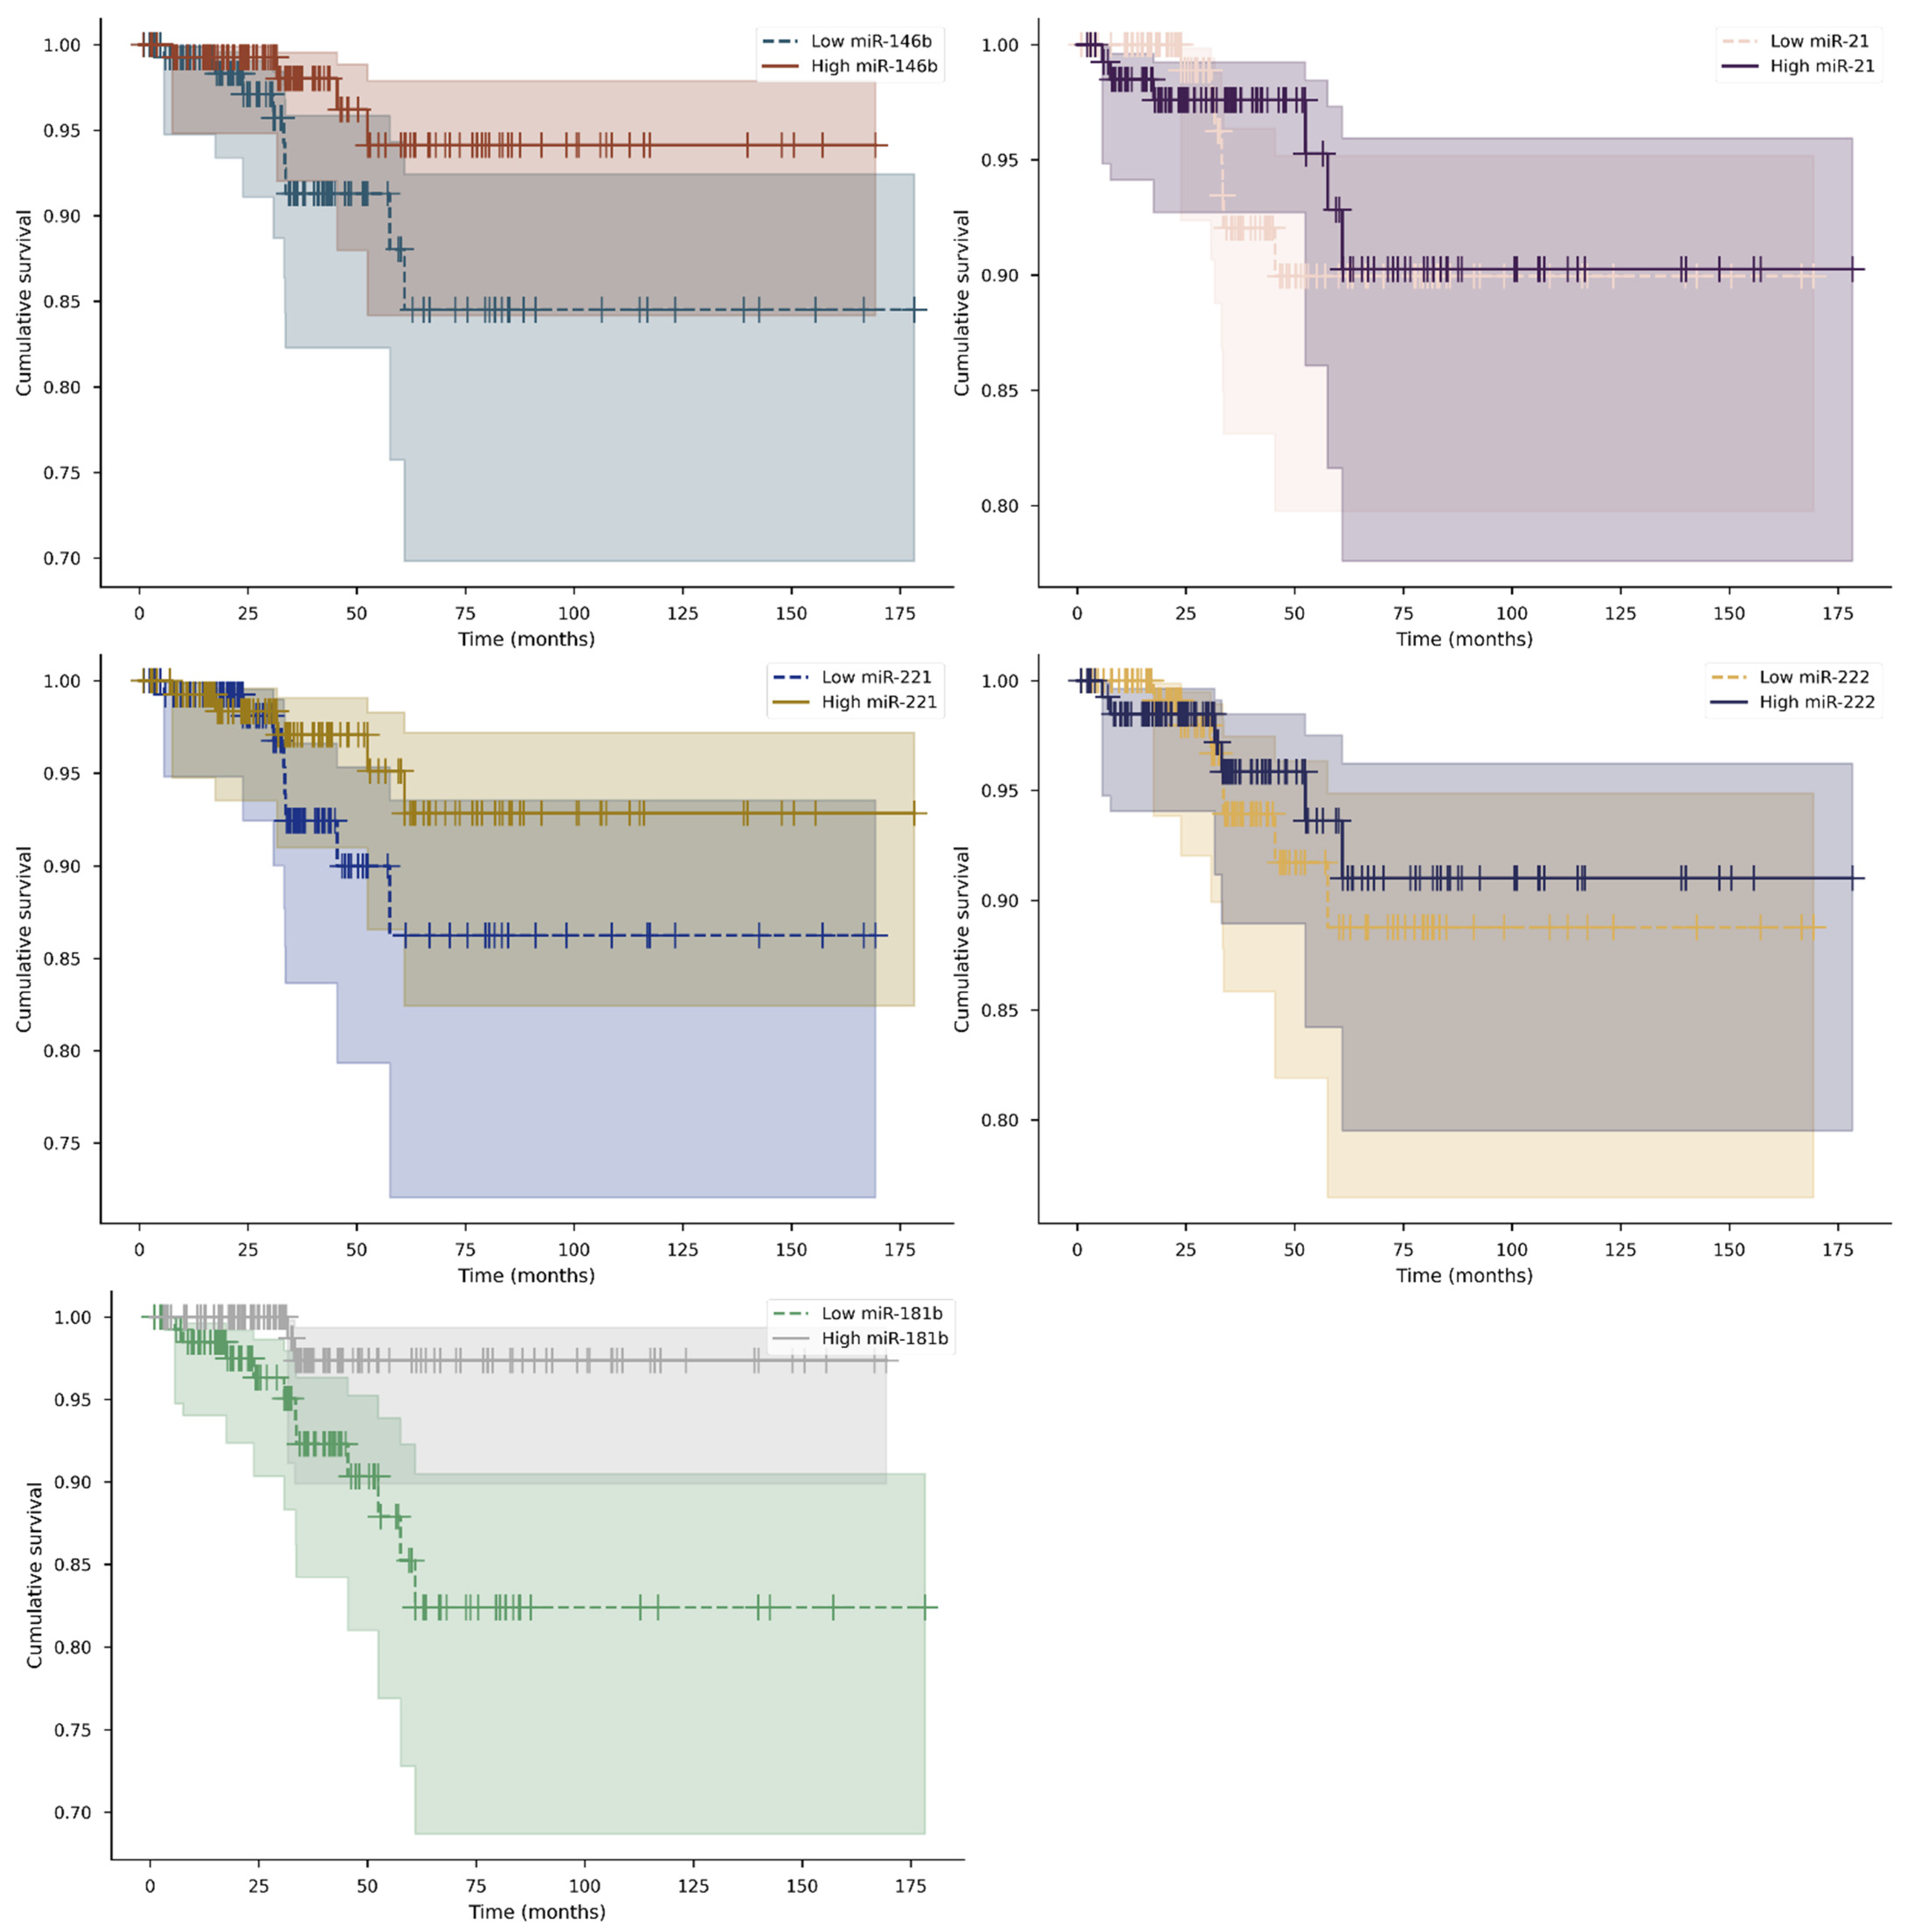
3.3. Influence of Clinicopathological Features and miR Expression on OS.
3.4. TCGA Database Analysis
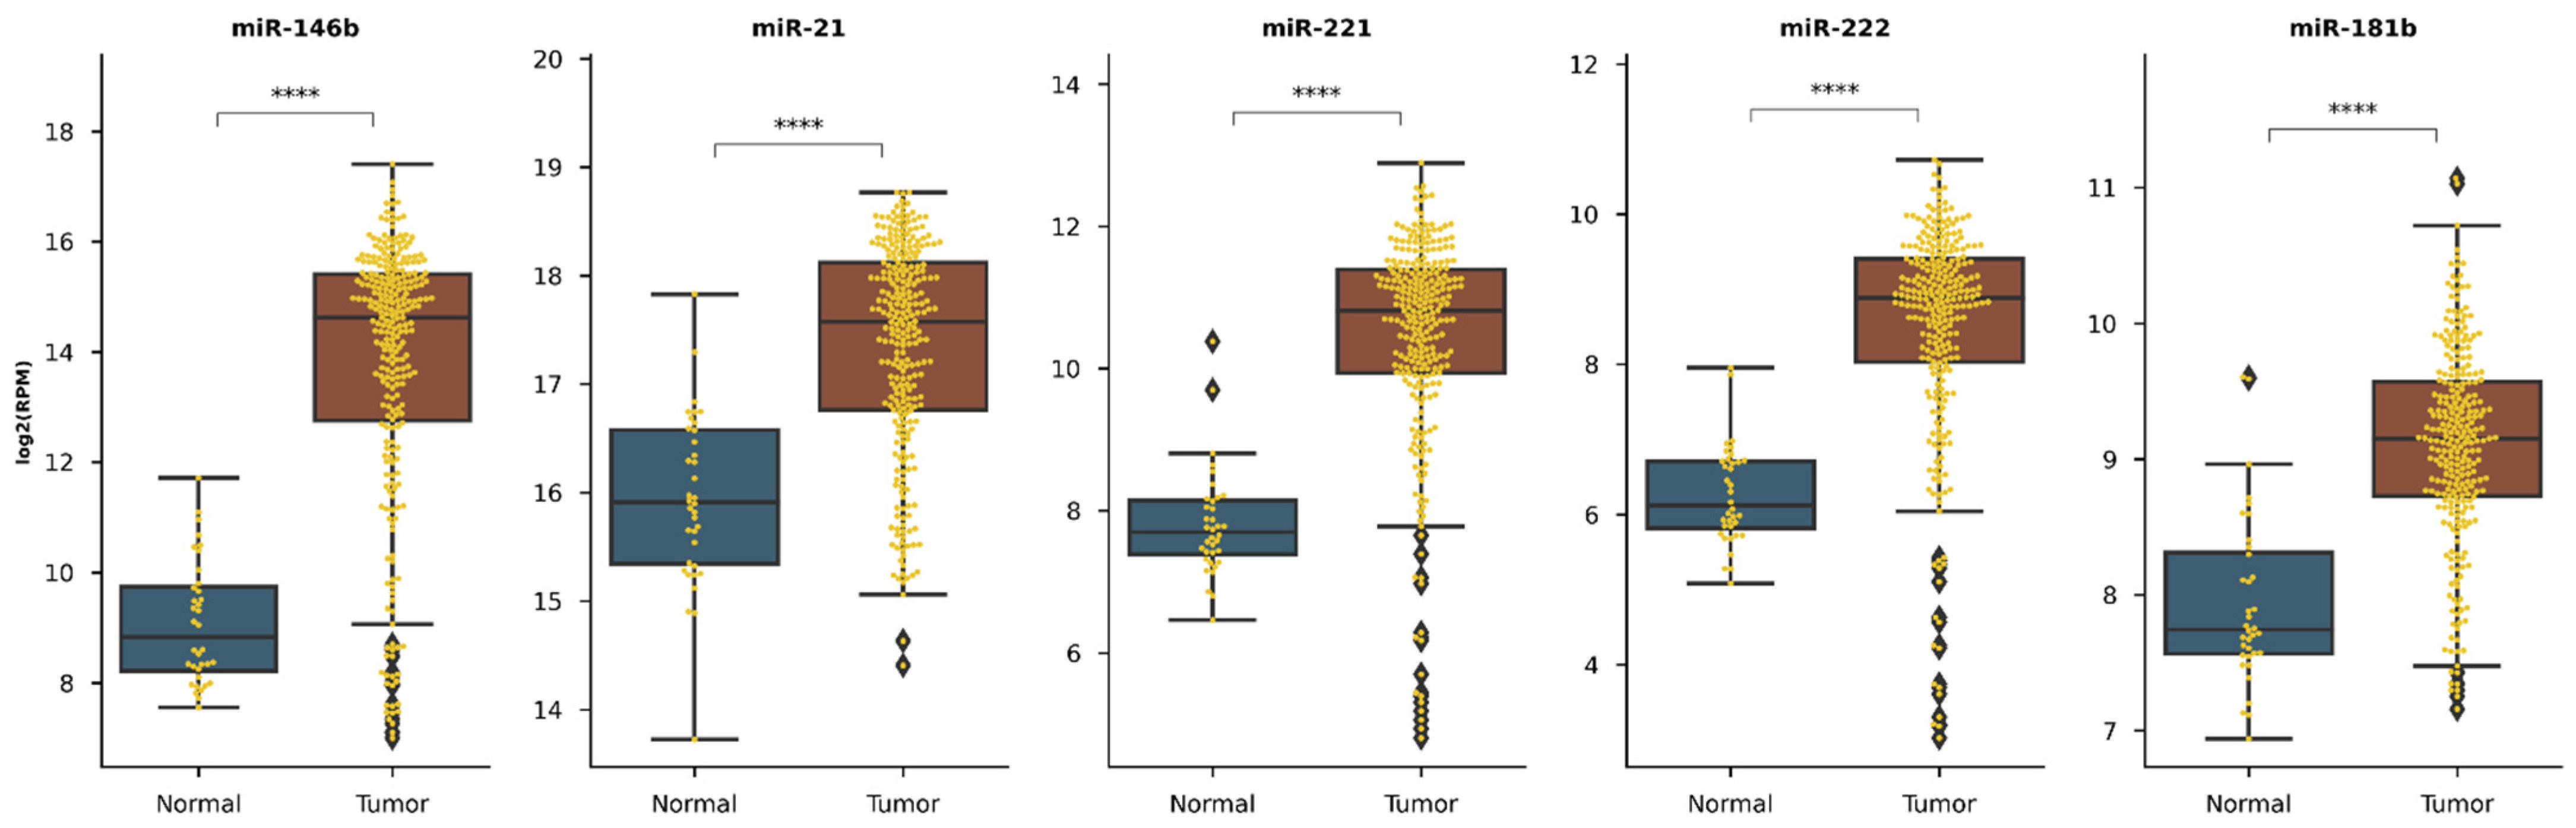
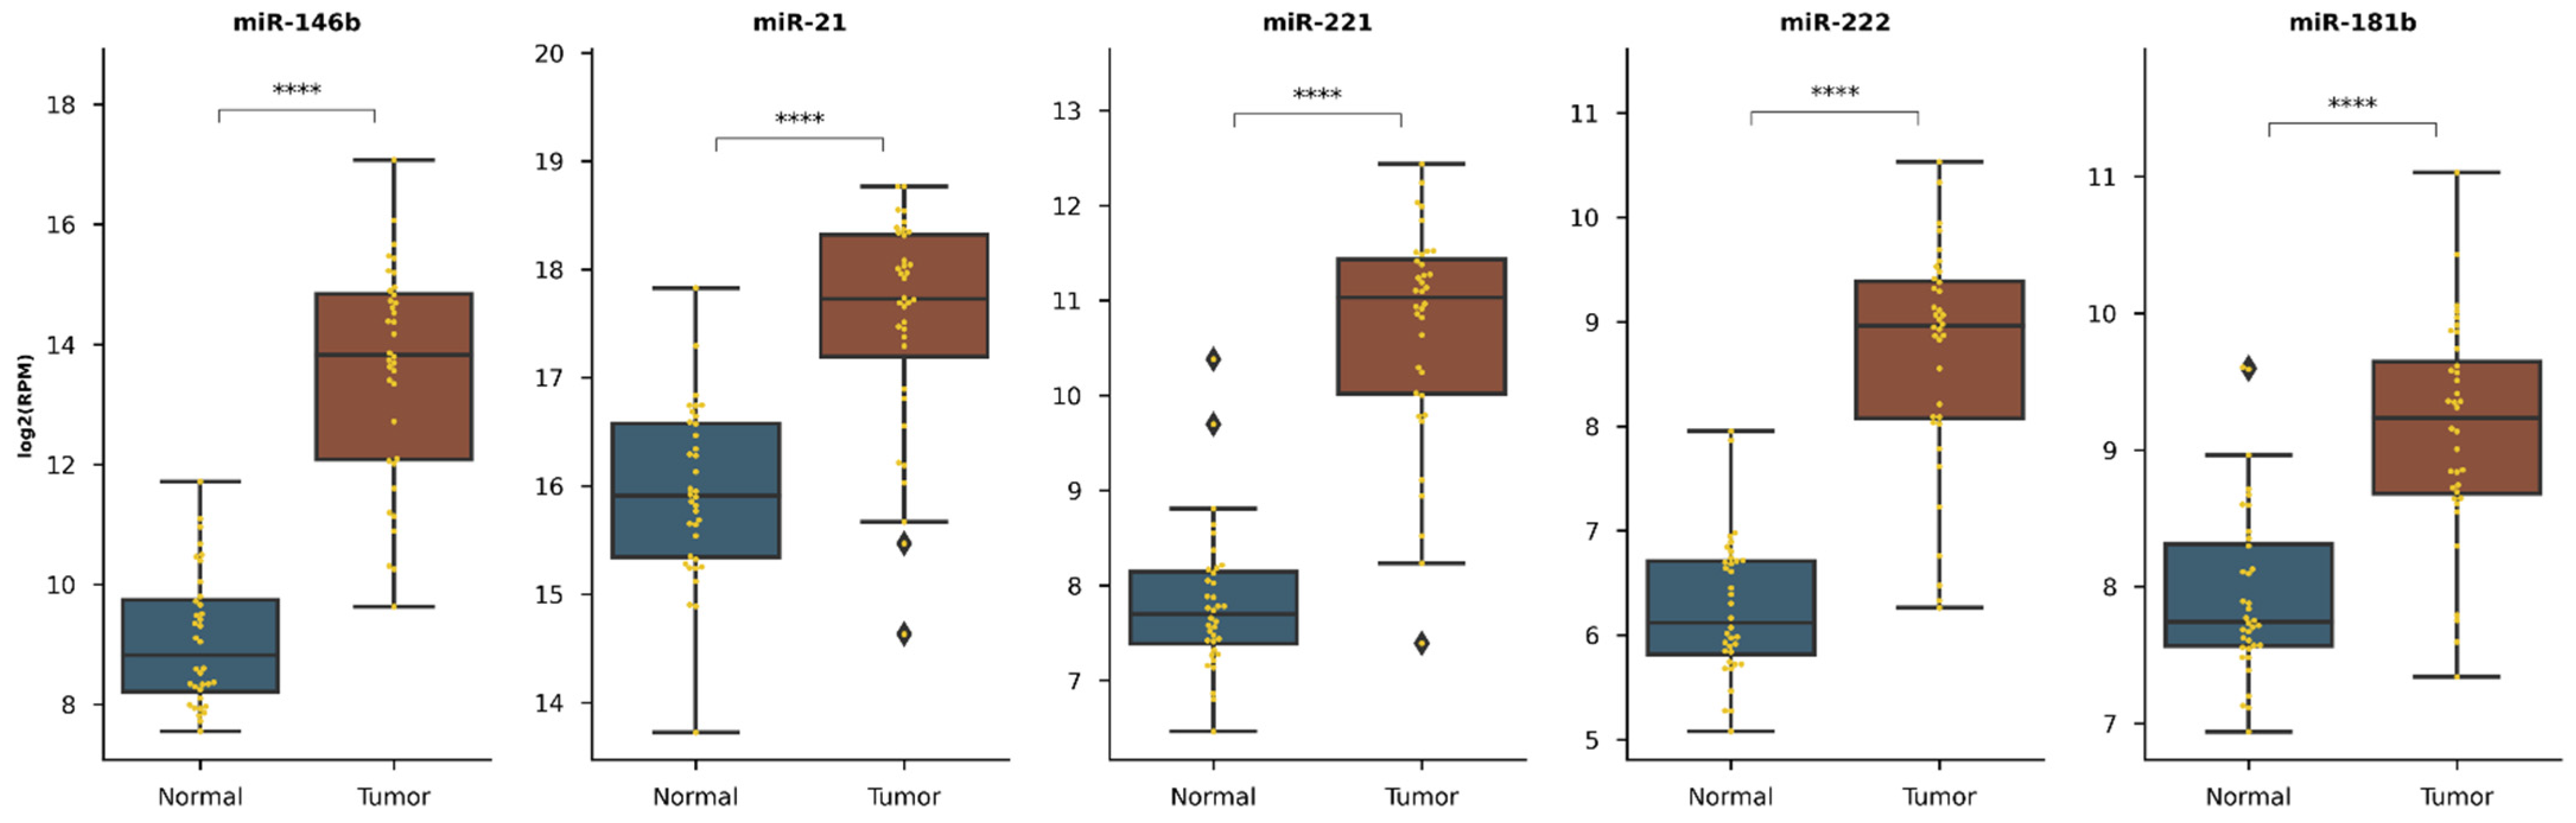
3.4.1. Selected miR Expression between Healthy and Cancerous Tissue
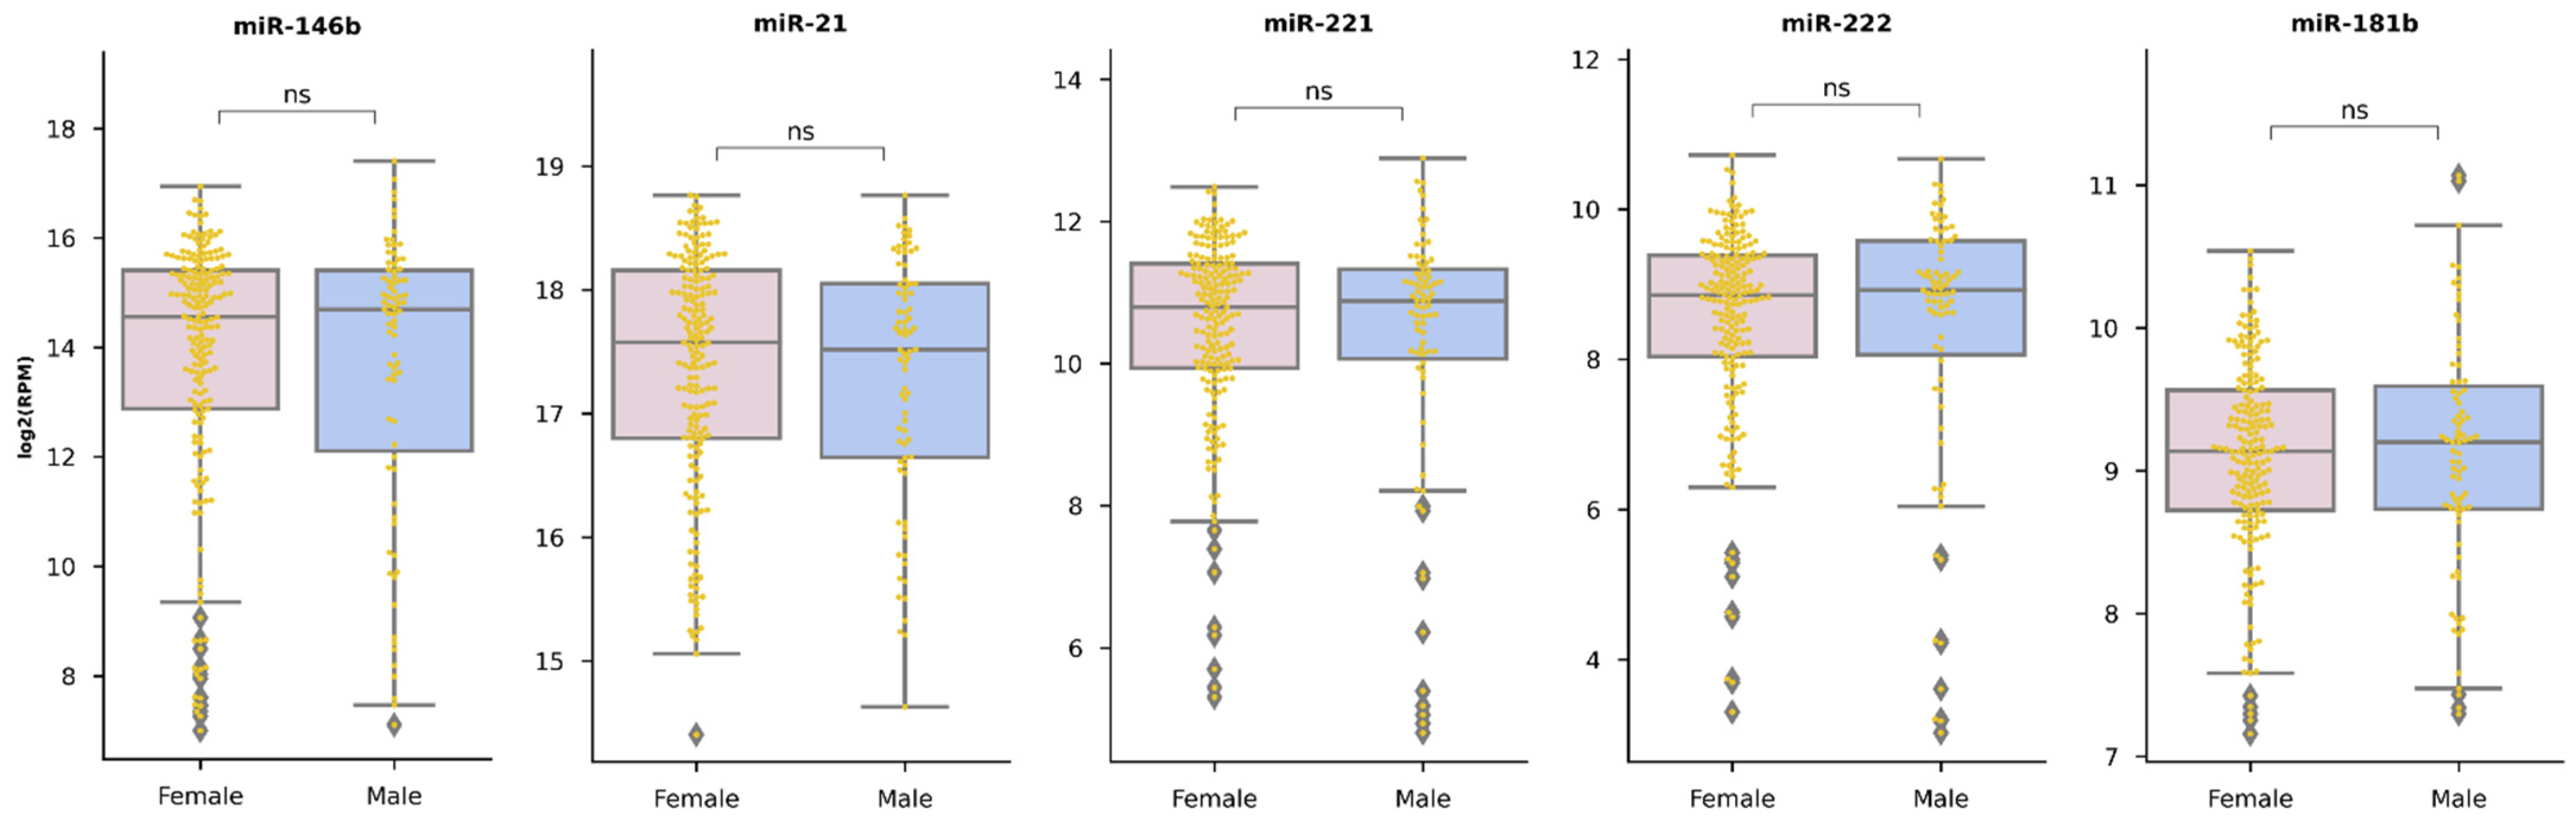
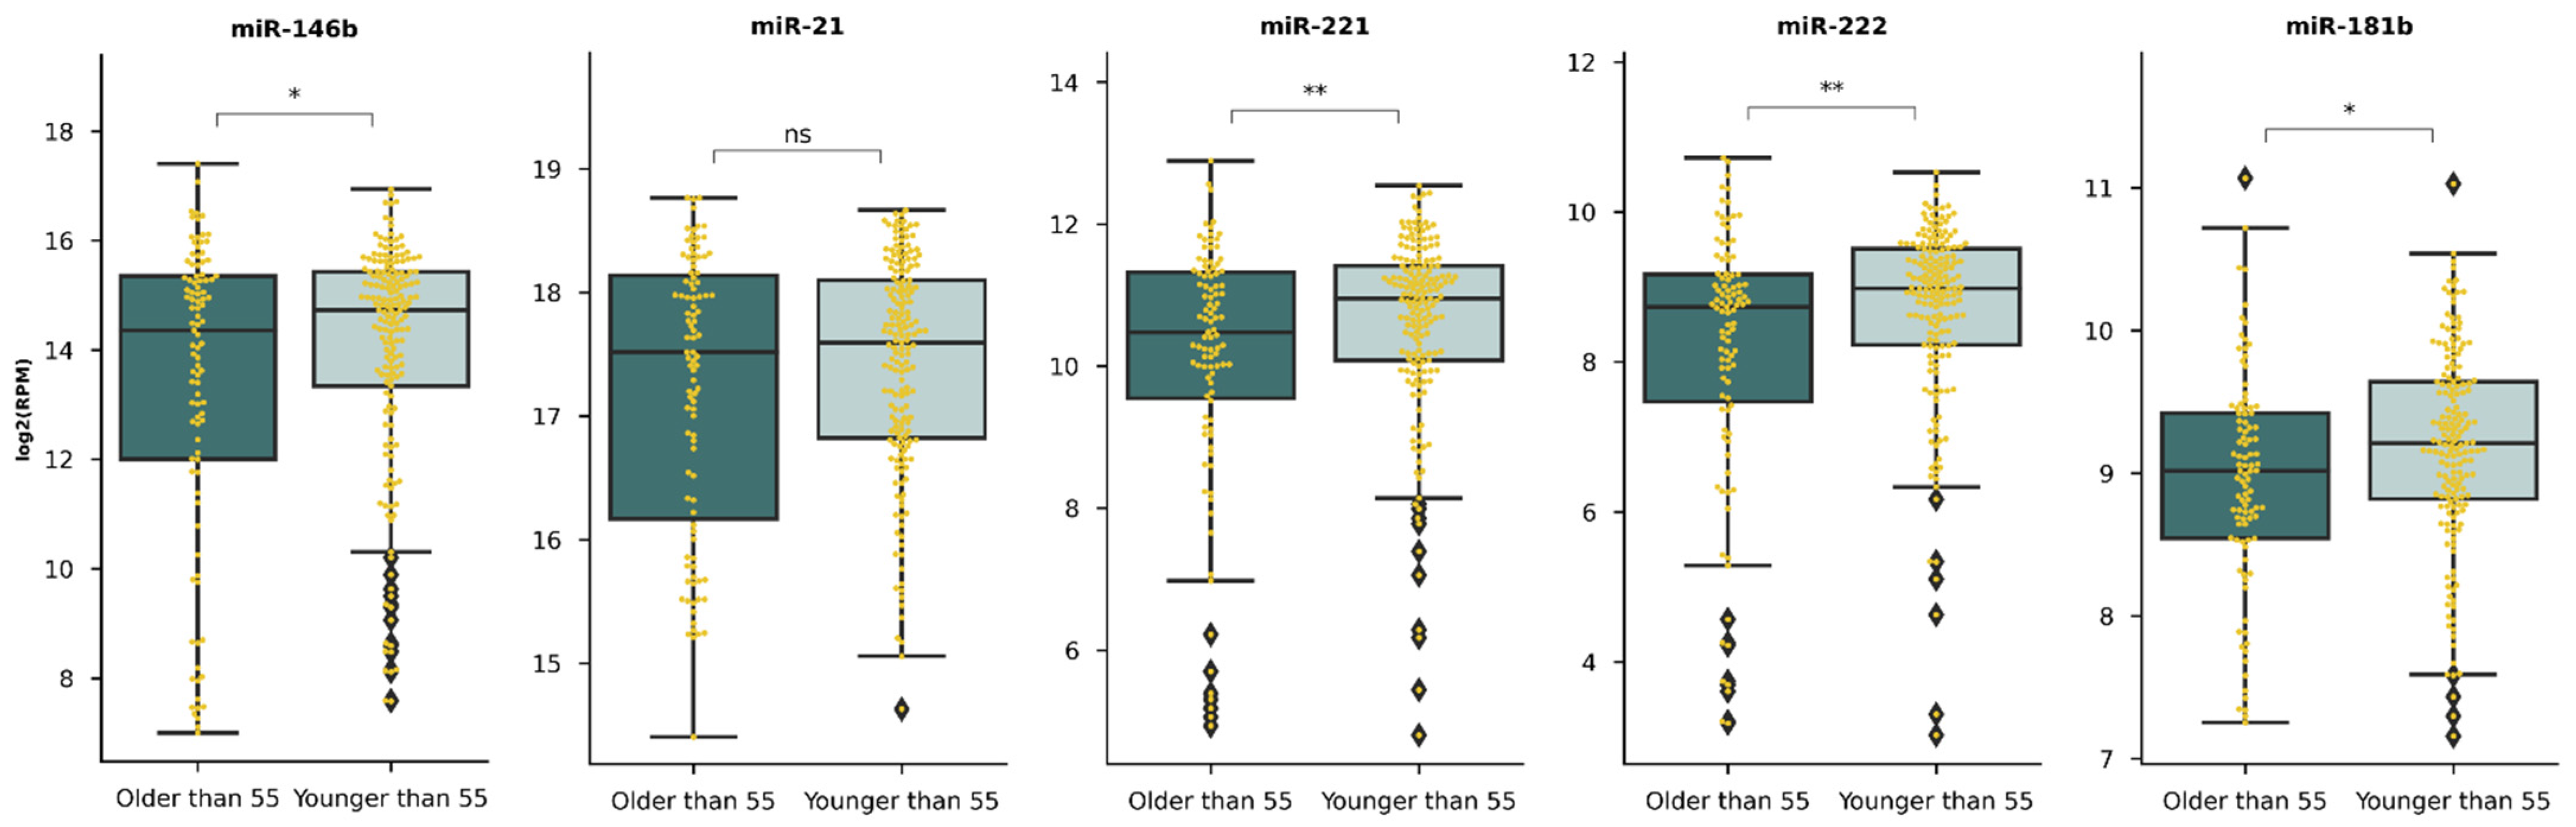
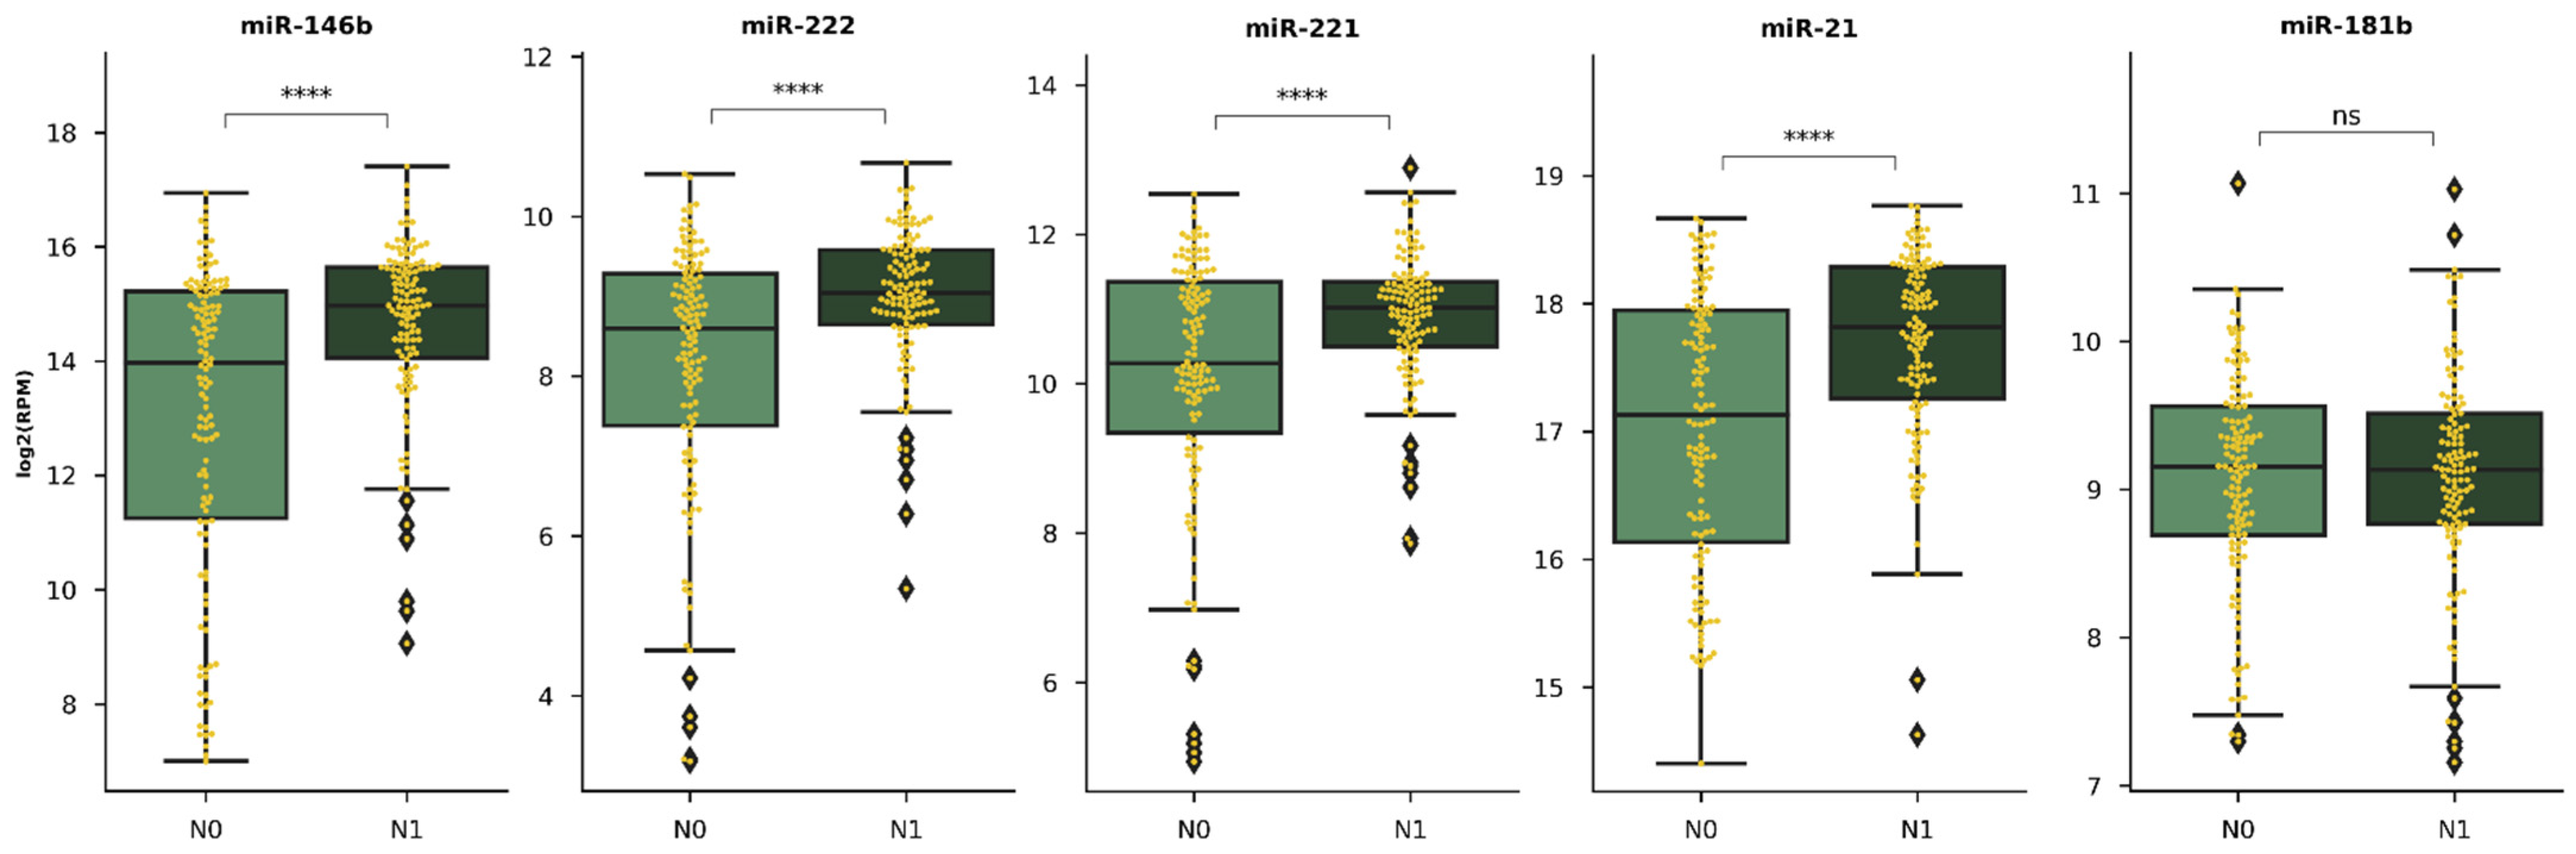
3.4.2. Selected miR Expression in Relation with Clinicopathological Features
4. Discussion
Author Contributions
Funding
Institutional Review Board Statement
Informed Consent Statement
Data Availability Statement
Conflicts of Interest
Appendix A

| Relative Expression 2-∆Ct: MEAN ± SD | |||||
|---|---|---|---|---|---|
| PTC Clinicopathological Feature | miR-146b | miR-21 | miR-221 | miR-222 | miR-181b |
| Age | |||||
| <55 years (n= 174; 55.77%) | 3.414 ± 0.229 | 1.486 ± 0.096 | 0.749 ± 0.061 | 2.496 ± 0.155 | 0.0006 ± 0.00004 |
| ≥55 years (n = 138; 44.23%) | 3.701 ± 0.291 | 1.630 ± 1.132 | 0.838 ± 0.078 | 2.423 ± 0.153 | 0.0006 ± 0.00004 |
| p | 0.576 | 0.439 | 0.343 | 0.764 | 0.300 |
| Sex | |||||
| Male (n = 33; 10.58%) | 3.544 ± 0.588 | 1.465 ± 0.174 | 0.646 ± 0.104 | 2.478 ± 0.336 | 0.0006 ± 0.00006 |
| Female (n = 279; 89.42%) | 3.541 ± 0.191 | 1.560 ± 0.086 | 0.806 ± 0.053 | 2.462 ± 0.116 | 0.0006 ± 0.00003 |
| p | 0.910 | 0.794 | 0.433 | 0.992 | 0.518 |
| Multifocality | |||||
| Single (n = 244; 79.20%) | 3.673 ± 0.211 | 1.658 ± 0.096 | 0.843 ± 0.595 | 2.548 ± 0.130 | 0.0006 ± 0.00003 |
| Multiple (≥2) (n = 68; 21.80%) | 3.123 ± 0.343 | 1.177 ± 0109 | 0.605 ± 0.0629 | 2.196 ± 0.188 | 0.0006 ± 0.00004 |
| p | 0.327 | 0.011 | 0.054 | 0.416 | 0.850 |
| Extrathyroidal extension | |||||
| Yes (n = 131; 41.99%) | 3.289 ± 0.280 | 1.644 ± 0.113 | 0.905 ± 0.087 | 2.606 ± 0.156 | 0.0005 ± 0.00004 |
| No (n = 181; 58.01%) | 3.383 ± 0.237 | 1.487 ± 0.109 | 0.709 ± 0.055 | 2.374 ± 0.152 | 0.0006 ± 0.00004 |
| p | 0.086 | 0.082 | 0.049 | 0.030 | 0.108 |
| Lymphovascular invasion | |||||
| Yes (n = 139; 44.55%) | 3.647 ± 0.245 | 1.583 ± 0.091 | 0.826 ± 0.067 | 2.528 ± 1.328 | 0.0006 ± 0.00004 |
| No (n = 173; 55.45%) | 3.434 ± 0.271 | 1.515 ± 1.283 | 0.746 ± 0.071 | 2.399 ± 0.181 | 0.0006 ± 0.00004 |
| p | 0.420 | 0.204 | 0.300 | 0.103 | 0.462 |
| T (TNM) | |||||
| pT1a, pT1b (n = 166; 53.2%) | 3.220 ± 0.241 | 1.386 ± 0.933 | 0.642 ± 0.477 | 2.158 ± 0.136 | 0.0007 ± 0.00004 |
| pT2, pT3, pT4 (n = 146; 46.8%) | 3.880 ± 0.269 | 1.721 ± 0.128 | 0.943 ± 0.842 | 2.786 ± 0.171 | 0.0006 ± 0.00004 |
| p | 0.032 | 0.044 | 0.003 | 0.001 | 0.317 |
| Lymph node metastases | |||||
| Yes (n = 48; 15.38%) | 4.488 ± 0.539 | 2.054 ± 0.0288 | 1.108 ± 0.188 | 3.496 ± 0.355 | 0.0008 ± 0.00009 |
| No (n=264; 84.62%) | 3.370 ± 1.889 | 1.458 ± 0.077 | 0.731 ± 0.046 | 2.276 ± 0.109 | 0.0006 ± 0.00003 |
| p | 0.057 | 0.014 | 0.037 | <0.0001 | 0.01 |
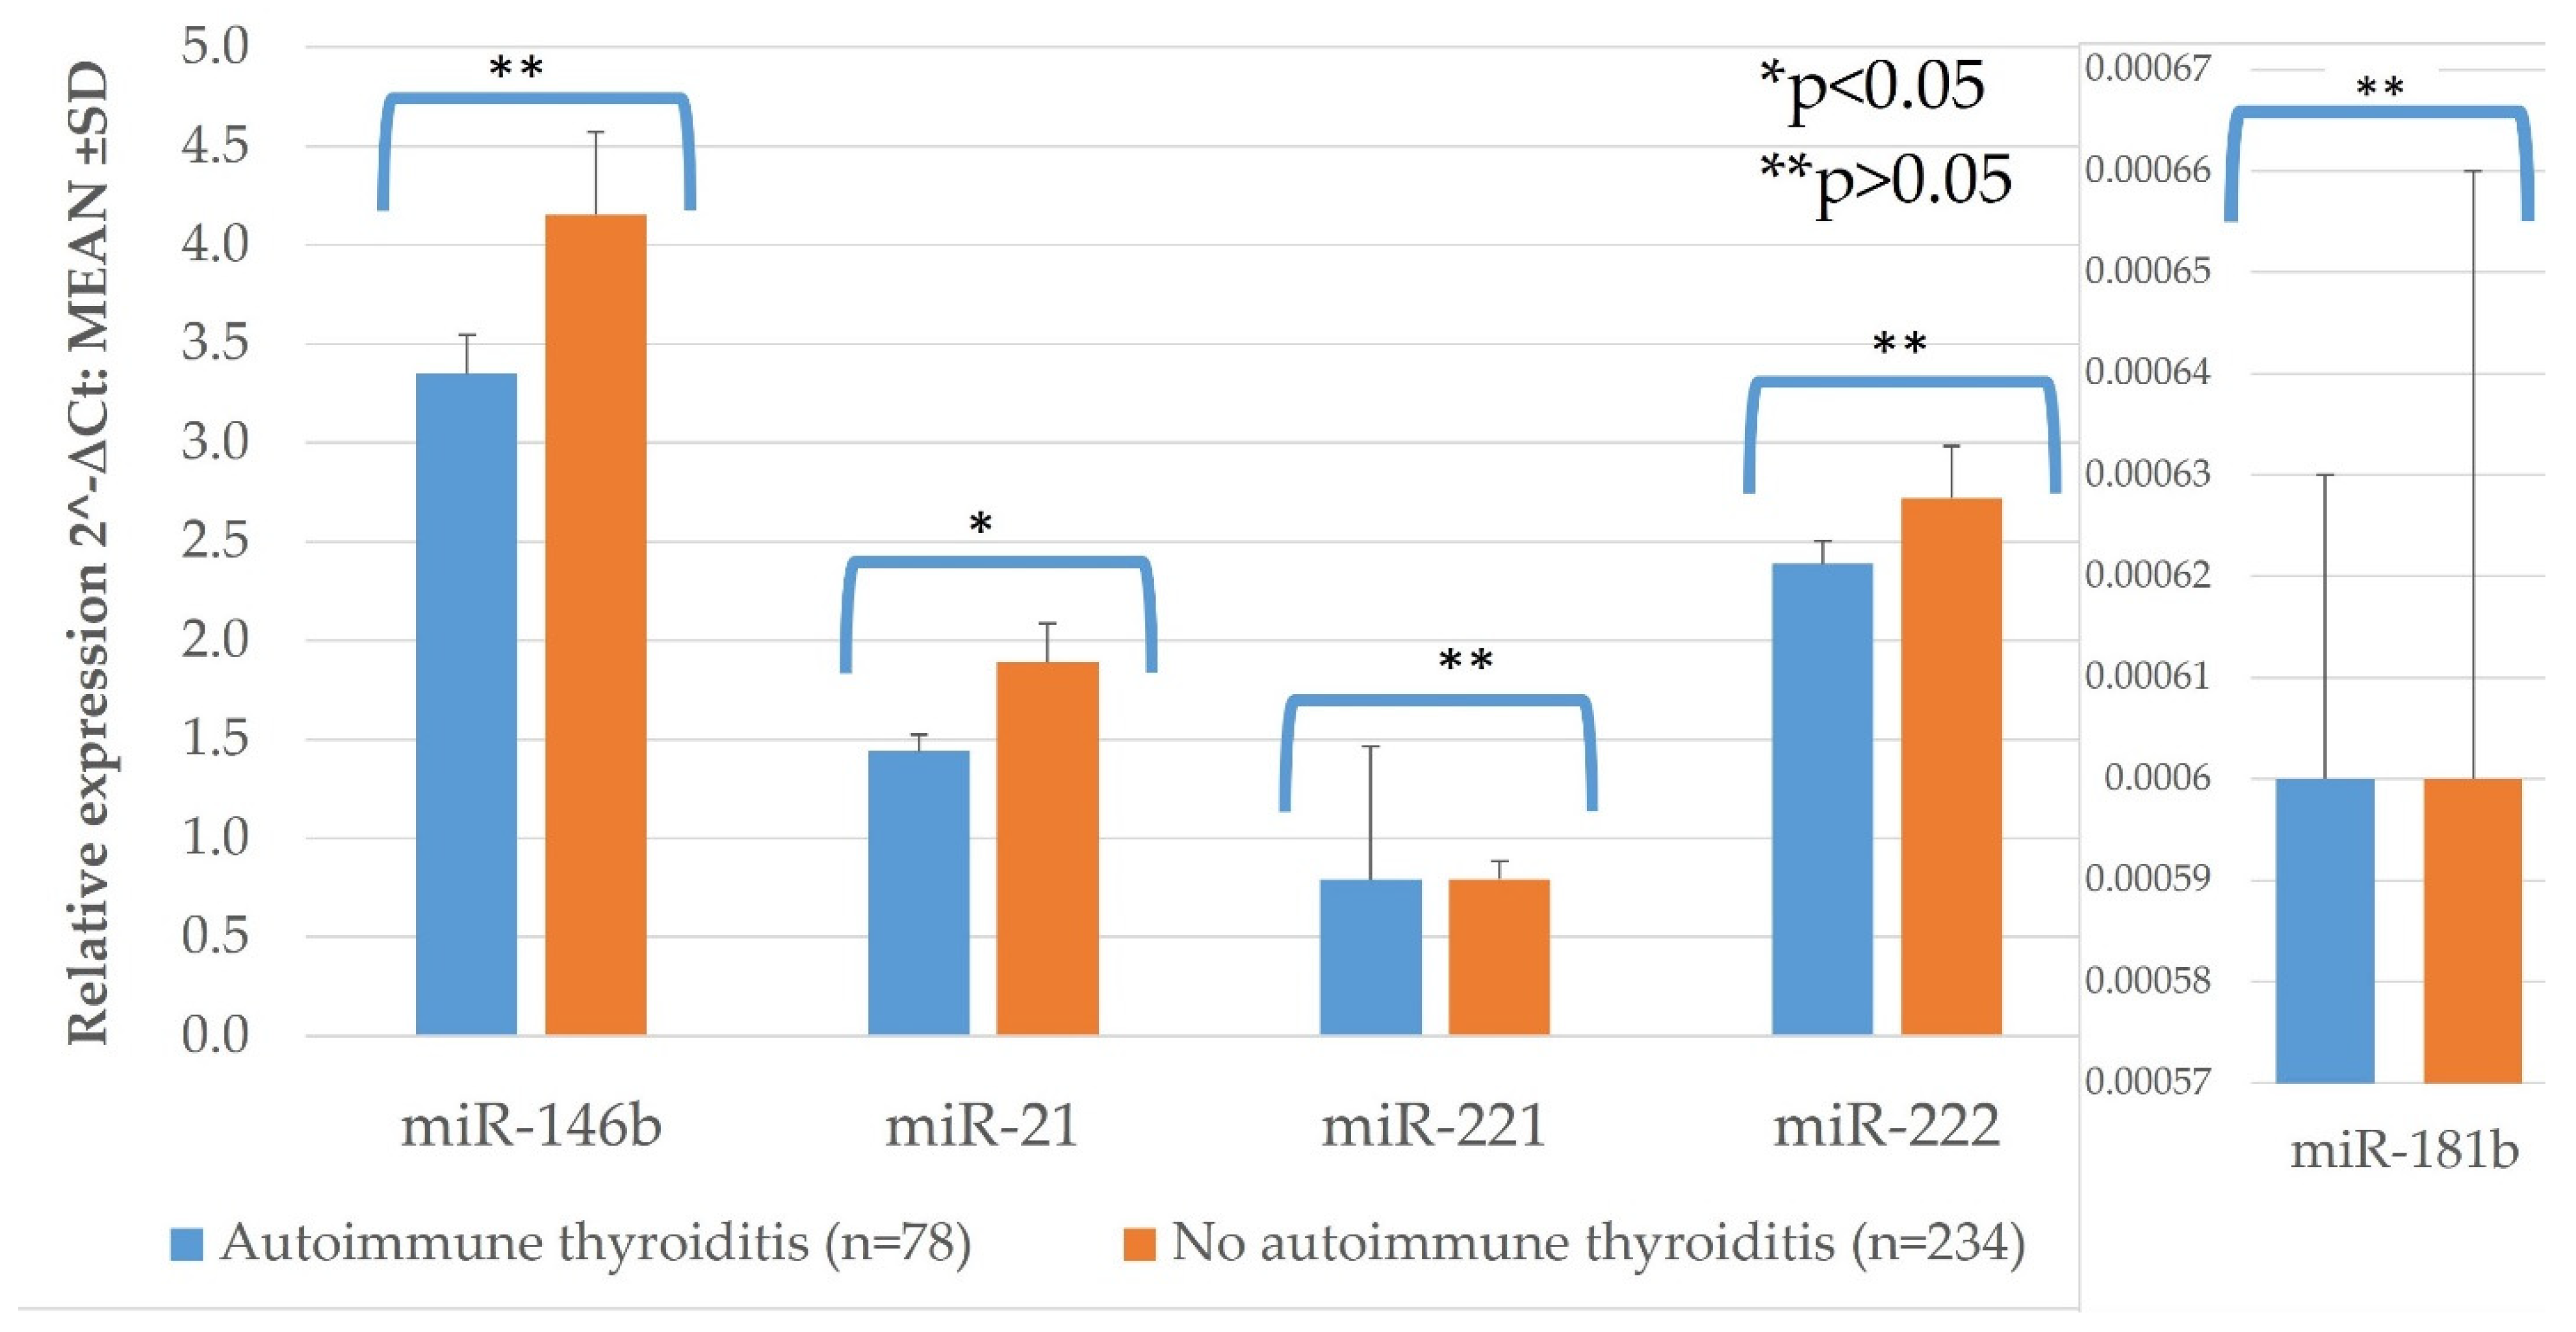
| Autoimmune thyroiditis | |||||
| Yes (n = 78; 25%) | 4.155 ± 0.416 | 1.889 ± 0.198 | 0.794 ± 0.091 | 2.720 ± 0.266 | 0.0006 ± 0.00006 |
| No (n = 234; 75%) | 3.350 ± 0.197 | 1.440 ± 0.082 | 0.790 ± 0.676 | 2.388 ± 0.116 | 0.0006 ± 0.00003 |
| p | 0.102 | 0.007 | 0.675 | 0.546 | 0.818 |

Appendix B


References
- Limaiem, F.; Rehman, A.; Mazzoni, T. Papillary Thyroid Carcinoma. StatPearls (Internet); StatPearls Publishing: Treasure Island, FL, USA, 2020. [Google Scholar]
- Fugazzola, L.; Elisei, R.; Fuhrer, D.; Jarzab, B.; Leboulleux, S.; Newbold, K.; Smit, J. 2019 European Thyroid Association Guidelines for the Treatment and Follow-Up of Advanced Radioiodine-Refractory Thyroid Cancer. Eur. Thyroid. J. 2019, 8, 227–245. [Google Scholar] [CrossRef]
- Ito, Y.; Miyauchi, A.; Kihara, M.; Fukushima, M.; Higashiyama, T.; Miya, A. Overall Survival of Papillary Thyroid Carcinoma Patients: A Single-Institution Long-Term Follow-Up of 5897 Patients. World J. Surg. 2018, 42, 615–622. [Google Scholar] [CrossRef] [Green Version]
- Medas, F.; Canu, G.L.; Boi, F.; Lai, M.L.; Erdas, E.; Calò, P.G. Predictive Factors of Recurrence in Patients with Differentiated Thyroid Carcinoma: A Retrospective Analysis on 579 Patients. Cancers 2019, 11, 1230. [Google Scholar] [CrossRef] [Green Version]
- Tuttle, R.M.; Leboeuf, R.; Martorella, A.J. Papillary Thyroid Cancer: Monitoring and Therapy. Endocrinol. Metab. Clin. North Am. 2007, 36, 753–778. [Google Scholar] [CrossRef]
- Maino, F.; Forleo, R.; Pacini, F. Prognostic indicators for papillary thyroid carcinoma. Expert Rev. Endocrinol. Metab. 2017, 12, 101–108. [Google Scholar] [CrossRef]
- Cho, J.-K.; Kim, J.-Y.; Jeong, C.-Y.; Jung, E.-J.; Park, S.-T.; Jeong, S.-H.; Ju, Y.-T.; Lee, Y.-J.; Hong, S.-C.; Ha, W.-S.; et al. Clinical features and prognostic factors in papillary thyroid microcarcinoma depends on age. J. Korean Surg. Soc. 2012, 82, 281–287. [Google Scholar] [CrossRef] [PubMed]
- Lin, J.-D.; Hsieh, S.-H.; Chang, H.-Y.; Huang, C.-C.; Chao, T.-C. Outcome after treatment for papillary thyroid cancer. Head Neck 2001, 23, 140–146. [Google Scholar] [CrossRef]
- Kowalska, A.; Walczyk, A.; Kowalik, A.; Pałyga, I.; Trybek, T.; Kopczyński, J.; Kajor, M.; Chrapek, M.; Pięciak, L.; Chłopek, M.; et al. Increase in Papillary Thyroid Cancer Incidence Is Accompanied by Changes in the Frequency of theBRAFV600EMutation: A Single-Institution Study. Thyroid 2016, 26, 543–551. [Google Scholar] [CrossRef] [PubMed]
- Paschke, R.; Cantara, S.; Crescenzi, A.; Jarzab, B.; Musholt, T.J.; Simoes, M.S. European Thyroid Association Guidelines regarding Thyroid Nodule Molecular Fine-Needle Aspiration Cytology Diagnostics. Eur. Thyroid. J. 2017, 6, 115–129. [Google Scholar] [CrossRef] [Green Version]
- Macfarlane, L.-A.; Murphy, P.R. MicroRNA: Biogenesis, Function and Role in Cancer. Curr. Genom. 2010, 11, 537–561. [Google Scholar] [CrossRef] [Green Version]
- O’Brien, J.; Hayder, H.; Zayed, Y.; Peng, C. Overview of MicroRNA Biogenesis, Mechanisms of Actions, and Circulation. Front. Endocrinol. 2018, 9, 402. [Google Scholar] [CrossRef] [Green Version]
- Adams, B.D.; Kasinski, A.L.; Slack, F.J. Aberrant Regulation and Function of MicroRNAs in Cancer. Curr. Biol. 2014, 24, R762–R776. [Google Scholar] [CrossRef] [Green Version]
- Wen, D.; Pan, D.; Lin, P.; Mo, Q.; Wei, Y.; Luo, Y.; Chen, G.; He, Y.; Chen, J.; Yang, H. Downregulation of miR-486-5p in papillary thyroid carcinoma tissue: A study based on microarray and miRNA sequencing. Mol. Med. Rep. 2018, 18, 2631–2642. [Google Scholar] [CrossRef]
- Zhang, Y.; Xu, D.; Pan, J.; Yang, Z.; Chen, M.; Han, J.; Zhang, S.; Sun, L.; Qiao, H. Dynamic monitoring of circulating microRNAs as a predictive biomarker for the diagnosis and recurrence of papillary thyroid carcinoma. Oncol. Lett. 2017, 13, 4252–4266. [Google Scholar] [CrossRef]
- Rosignolo, F.; Sponziello, M.; Giacomelli, L.; Russo, D.; Pecce, V.; Biffoni, M.; Bellantone, R.; Lombardi, C.P.; Lamartina, L.; Grani, G.; et al. Identification of Thyroid-Associated Serum microRNA Profiles and Their Potential Use in Thyroid Cancer Follow-Up. J. Endocr. Soc. 2017, 1, 3–13. [Google Scholar] [CrossRef] [Green Version]
- Dai, L.; Wang, Y.; Chen, L.; Zheng, J.; Li, J.; Wu, X. MiR-221, a potential prognostic biomarker for recurrence in papillary thyroid cancer. World J. Surg. Oncol. 2017, 15, 1–6. [Google Scholar] [CrossRef] [PubMed] [Green Version]
- Qiu, Z.; Li, H.; Wang, J.; Sun, C. miR-146a and miR-146b in the diagnosis and prognosis of papillary thyroid carcinoma. Oncol. Rep. 2017, 38, 2735–2740. [Google Scholar] [CrossRef] [Green Version]
- Sondermann, A.; Andreghetto, F.M.; Moulatlet, A.C.B.; Victor, E.D.S.; De Castro, M.G.; Nunes, F.D.; Brandão, L.G.; Severino, P. MiR-9 and miR-21 as prognostic biomarkers for recurrence in papillary thyroid cancer. Clin. Exp. Metastasis 2015, 32, 521–530. [Google Scholar] [CrossRef]
- Guo, Z.; Hardin, H.; Montemayor-Garcia, C.; Asioli, S.; Righi, A.; Maletta, F.; Sapino, A.; Lloyd, R.V. In Situ Hybridization Analysis of miR-146b-5p and miR-21 in Thyroid Nodules: Diagnostic Implications. Endocr. Pathol. 2015, 26, 157–163. [Google Scholar] [CrossRef]
- Lee, J.C.; Zhao, J.T.; Clifton-Bligh, R.J.; Gill, A.; Gundara, J.S.; Ip, J.C.; Glover, A.; Sywak, M.S.; Delbridge, L.W.; Robinson, B.G.; et al. MicroRNA-222 and MicroRNA-146b are tissue and circulating biomarkers of recurrent papillary thyroid cancer. Cancer 2013, 119, 4358–4365. [Google Scholar] [CrossRef] [PubMed]
- Yip, L.; Kelly, L.; Shuai, Y.; Armstrong, M.J.; Nikiforov, Y.E.; Carty, S.E.; Nikiforova, M.N. MicroRNA Signature Distinguishes the Degree of Aggressiveness of Papillary Thyroid Carcinoma. Ann. Surg. Oncol. 2011, 18, 2035–2041. [Google Scholar] [CrossRef] [Green Version]
- Pamedytyte, D.; Simanaviciene, V.; Dauksiene, D.; Leipute, E.; Zvirbliene, A.; Sarauskas, V.; Dauksa, A.; Verkauskiene, R.; Zilaitiene, B. Association of microRNA Expression and BRAFV600E Mutation with Recurrence of Thyroid Cancer. Biomolecules 2020, 10, 625. [Google Scholar] [CrossRef] [Green Version]
- Yang, Z.; Yuan, Z.; Fan, Y.; Deng, X.; Zheng, Q. Integrated analyses of microRNA and mRNA expression profiles in aggressive papillary thyroid carcinoma. Mol. Med. Rep. 2013, 8, 1353–1358. [Google Scholar] [CrossRef] [Green Version]
- Acibucu, F.; Dökmetaş, H.S.; Tutar, Y.; Elagoz, Ş.; Kilicli, F. Correlations between the Expression Levels of Micro-RNA146b, 221, 222 and p27Kip1 protein mRNA and the Clinicopathologic Parameters in Papillary Thyroid Cancers. Exp. Clin. Endocrinol. Diabetes 2014, 122, 137–143. [Google Scholar] [CrossRef]
- Wang, Z.; Zhang, H.; He, L.; Dong, W.; Li, J.; Shan, Z.; Teng, W. Association between the expression of four upregulated miRNAs and extrathyroidal invasion in papillary thyroid carcinoma. OncoTargets Ther. 2013, 6, 281–287. [Google Scholar] [CrossRef] [Green Version]
- Chou, C.-K.; Chen, R.-F.; Chou, F.-F.; Chang, H.-W.; Chen, Y.-J.; Lee, Y.-F.; Yang, K.D.; Cheng, J.-T.; Huang, C.-C.; Liu, R.-T. miR-146b is Highly Expressed in Adult Papillary Thyroid Carcinomas with High Risk Features Including Extrathyroidal Invasion and the BRAFV600E Mutation. Thyroid 2010, 20, 489–494. [Google Scholar] [CrossRef] [PubMed]
- Lamartina, L.; Grani, G.; Arvat, E.; Nervo, A.; Zatelli, M.C.; Rossi, R.; Puxeddu, E.; Morelli, S.; Torlontano, M.; Massa, M.; et al. 8th edition of the AJCC/TNM staging system of thyroid cancer: What to expect (ITCO#2). Endocr. Relat. Cancer 2018, 25, L7–L11. [Google Scholar] [CrossRef] [Green Version]
- Schmittgen, T.D.; Livak, K.J. Analyzing real-time PCR data by the comparative CT method. Nat. Protoc. 2008, 3, 1101–1108. [Google Scholar] [CrossRef]
- Github. Available online: https://github.com/webermarcolivier/statannot (accessed on 20 January 2021).
- Zenodo. Available online: https://zenodo.org/record/4313838#.YAf6L8WmO3J (accessed on 20 January 2021).
- Chereau, N.; Giudicelli, X.; Pattou, F.; Lifante, J.-C.; Triponez, F.; Mirallié, E.; Goudet, P.; Brunaud, L.; Trésallet, C.; Tissier, F.; et al. Diffuse Sclerosing Variant of Papillary Thyroid Carcinoma Is Associated With Aggressive Histopathological Features and a Poor Outcome: Results of a Large Multicentric Study. J. Clin. Endocrinol. Metab. 2016, 101, 4603–4610. [Google Scholar] [CrossRef] [Green Version]
- Ganly, I.; Filho, J.R.; Eng, S.; Ghossein, R.; Morris, L.G.T.; Liang, Y.; Socci, N.; Kannan, K.; Mo, Q.; Fagin, J.A.; et al. Genomic Dissection of Hurthle Cell Carcinoma Reveals a Unique Class of Thyroid Malignancy. J. Clin. Endocrinol. Metab. 2013, 98, E962–E972. [Google Scholar] [CrossRef] [Green Version]
- Goffredo, P.; Roman, S.A.; Sosa, J.A. Hurthle cell carcinoma: A population-level analysis of 3311 patients. Cancer 2013, 119, 504–511. [Google Scholar] [CrossRef]
- Fletcher, A.; Read, M.L.; Thornton, C.E.; Larner, D.P.; Poole, V.L.; Brookes, K.; Nieto, H.R.; Alshahrani, M.; Thompson, R.J.; Lavery, G.G.; et al. Targeting Novel Sodium Iodide Symporter Interactors ADP-Ribosylation Factor 4 and Valosin-Containing Protein Enhances Radioiodine Uptake. Cancer Res. 2020, 80, 102–115. [Google Scholar] [CrossRef] [Green Version]
- Acquaviva, G.; Visani, M.; Repaci, A.; Rhoden, K.J.; De Biase, D.; Pession, A.; Giovanni, T. Molecular pathology of thyroid tumours of follicular cells: A review of genetic alterations and their clinicopathological relevance. Histopathology 2017, 72, 6–31. [Google Scholar] [CrossRef]
- Kondrotienė, A.; Daukša, A.; Pamedytytė, D.; Kazokaitė, M.; Žvirblienė, A.; Daukšienė, D.; Simanavičienė, V.; Klimaitė, R.; Golubickaitė, I.; Stakaitis, R.; et al. Plasma-Derived miRNA-222 as a Candidate Marker for Papillary Thyroid Cancer. Int. J. Mol. Sci. 2020, 21, 6445. [Google Scholar] [CrossRef] [PubMed]
- Huang, Y.; Liao, D.; Pan, L.; Ye, R.; Li, X.; Wang, S.; Ye, C.; Chen, L. Expressions of miRNAs in papillary thyroid car-cinoma and their associations with the BRAFV600E mutation. Eur. J. Endocrinol. 2013, 168, 675–681. [Google Scholar] [CrossRef] [Green Version]
- Zang, C.; Sun, J.; Liu, W.; Chu, C.; Jiang, L.; Ge, R. miRNA-21 promotes cell proliferation and invasion via VHL/PI3K/AKT in papillary thyroid carcinoma. Hum. Cell 2019, 32, 428–436. [Google Scholar] [CrossRef] [PubMed]
- Wang, F.; Yu, X.; Shen, X.; Zhu, G.; Huang, Y.; Liu, R.; Viola, D.; Elisei, R.; Puxeddu, E.; Fugazzola, L.; et al. The Prognostic Value of Tumor Multifocality in Clinical Outcomes of Papillary Thyroid Cancer. J. Clin. Endocrinol. Metab. 2017, 102, 3241–3250. [Google Scholar] [CrossRef] [Green Version]
- Geron, Y.; Benbassat, C.; Shteinshneider, M.; Or, K.; Markus, E.; Hirsch, D.; Levy, S.; Ziv-Baran, T.; Muallem-Kalmovich, L. Multifocality Is not an Independent Prognostic Factor in Papillary Thyroid Cancer: A Propensity Score–Matching Analysis. Thyroid 2019, 29, 513–522. [Google Scholar] [CrossRef] [PubMed]
- Kim, H.J.; Sohn, S.Y.; Jang, H.W.; Kim, S.W.; Chung, J.H. Multifocality, but not bilaterality, is a predictor of disease recurrence/persistence of papillary thyroid carcinoma. World J Surg. 2013, 37, 376–384. [Google Scholar] [CrossRef]
- Grogan, R.H.; Kaplan, S.P.; Cao, H.; Weiss, R.E.; DeGroot, L.J.; Simon, C.A.; Embia, O.M.; Angelos, P.; Kaplan, E.L.; Schechter, R.B. A study of recurrence and death from papillary thyroid cancer with 27 years of median follow-up. Surgury 2013, 154, 1436–1447. [Google Scholar] [CrossRef] [PubMed]
- Neuhold, N.; Schultheis, A.; Hermann, M.; Krotla, G.; Koperek, O.; Birner, P. Incidental Papillary Microcarcinoma of the Thyroid—Further Evidence of a Very Low Malignant Potential: A Retrospective Clinicopathological Study With Up to 30 Years of Follow-Up. Ann. Surg. Oncol. 2011, 18, 3430–3436. [Google Scholar] [CrossRef]
- Kim, K.-J.; Kim, S.-M.; Lee, Y.S.; Chung, W.Y.; Chang, H.-S.; Park, C.S. Prognostic Significance of Tumor Multifocality in Papillary Thyroid Carcinoma and its Relationship with Primary Tumor Size: A Retrospective Study of 2,309 Consecutive Patients. Ann. Surg. Oncol. 2014, 22, 125–131. [Google Scholar] [CrossRef]
- Leboulleux, S.; Rubino, C.; Baudin, E.; Caillou, B.; Hartl, D.M.; Bidart, J.-M.; Travagli, J.-P.; Schlumberger, M. Prognostic Factors for Persistent or Recurrent Disease of Papillary Thyroid Carcinoma with Neck Lymph Node Metastases and/or Tumor Extension beyond the Thyroid Capsule at Initial Diagnosis. J. Clin. Endocrinol. Metab. 2005, 90, 5723–5729. [Google Scholar] [CrossRef] [Green Version]
- Zhang, W.; Jiao, D.; Liu, B.; Sun, S. Analysis of Risk Factors Contributing to Recurrence of Papillary Thyroid Carcinoma in Chinese Patients Who Underwent Total Thyroidectomy. Med Sci. Monit. 2016, 22, 1274–1279. [Google Scholar] [CrossRef]
- Buda, I.; Bachar, G.; Gilham, A.; Buda, I.; Bachar, G.; Gilam, A.; Modai, S.; Strenov, Y.; Pasmanik-Chor, M.; Feinmesser, R.; et al. Differential expression of microRNAs between aggressive and non-aggressive papillary thyroid carcinoma. Head Neck Oncol. 2012, 4, 52. [Google Scholar]
- Guancial, E.A.; Bellmunt, J.; Yeh, S.; Rosenberg, J.E.; Berman, D.M. The evolving understanding of microRNA in bladder cancer. Urol. Oncol. Semin. Orig. Investig. 2014, 32, 41.e31–41.e40. [Google Scholar] [CrossRef] [Green Version]
- Kjaer-Frifeldt, S.; Fredslund, R.; Lindebjerg, J.; Hansen, T.F.; Spindler, K.-L.G.; Jakobsen, A. Prognostic importance ofVEGF-Ahaplotype combinations in a stage II colon cancer population. Pharmacogenomics 2012, 13, 763–770. [Google Scholar] [CrossRef]
- Bica-Pop, C.; Cojocneanu-Petric, R.; Magdo, L.; Raduly, L.; Gulei, D.; Berindan-Neagoe, I. Overview upon miR-21 in lung cancer: Focus on NSCLC. Cell. Mol. Life Sci. 2018, 75, 3539–3551. [Google Scholar] [CrossRef] [PubMed]
- Xia, X.; Yang, B.; Zhai, X.; Liu, X.; Shen, K.; Wu, Z.; Cai, J. Prognostic Role of microRNA-21 in Colorectal Cancer: A Meta-Analysis. PLoS ONE 2013, 8, e80426. [Google Scholar] [CrossRef]
- Zhang, Y.; Pan, J.; Xu, D.; Yang, Z.; Sun, J.; Sun, L.; Wu, Y.; Qiao, H. Combination of serum microRNAs and ultrasound profile as predictive biomarkers of diagnosis and prognosis for papillary thyroid microcarcinoma. Oncol. Rep. 2018, 40, 3611–3624. [Google Scholar] [CrossRef] [PubMed] [Green Version]
- Lin, X.; Finkelstein, S.D.; Zhu, B.; Silverman, J.F. Molecular analysis of multifocal papillary thyroid carcinoma. J. Mol. Endocrinol. 2008, 41, 195–203. [Google Scholar] [CrossRef] [Green Version]
- Veit, F.; Momberger, S.; Helmich-Kapp, B.; Ruschenburg, I.; Peters, A.; Kussmann, J.; Saeger, W.; Schmidt, K.W.; Toetsch, M.; Nestler, K.; et al. Papillary Thyroid Cancer and Coexisting Autoimmune Thyroiditis. Horm. Metab. Res. 2017, 49, 869–872. [Google Scholar] [CrossRef]
- Su, X.; He, C.; Ma, J.; Tang, T.; Zhang, X.; Ye, Z.; Long, Y.; Shao, Q.; Shao, J.; Yang, A. RET/PTC Rearrangements Are Associated with Elevated Postoperative TSH Levels and Multifocal Lesions in Papillary Thyroid Cancer without Concomitant Thyroid Benign Disease. PLoS ONE 2016, 11, e0165596. [Google Scholar] [CrossRef]
- Suh, Y.J.; Kwon, H.; Kim, S.-J.; Choi, J.Y.; Lee, K.E.; Park, Y.J.; Park, D.J.; Youn, Y.-K. Factors Affecting the Locoregional Recurrence of Conventional Papillary Thyroid Carcinoma after Surgery: A Retrospective Analysis of 3381 Patients. Ann. Surg. Oncol. 2015, 22, 3543–3549. [Google Scholar] [CrossRef]
- Machens, A.; Holzhausen, H.-J.; Dralle, H. The prognostic value of primary tumor size in papillary and follicular thyroid carcinoma. Cancer 2005, 103, 2269–2273. [Google Scholar] [CrossRef]
- Roh, J.-L.; Kim, J.-M.; Park, C.I. Central Lymph Node Metastasis of Unilateral Papillary Thyroid Carcinoma: Patterns and Factors Predictive of Nodal Metastasis, Morbidity, and Recurrence. Ann. Surg. Oncol. 2011, 18, 2245–2250. [Google Scholar] [CrossRef]
- Ab Mutalib, N.-S.; Yusof, A.M.; Mokhtar, N.M.; Harun, R.; Muhammad, R.; Jamal, R. MicroRNAs and Lymph Node Metastasis in Papillary Thyroid Cancers. Asian Pac. J. Cancer Prev. 2016, 17, 25–35. [Google Scholar] [CrossRef]
- Silaghi, C.A.; Lozovanu, V.; Silaghi, H.; Georgescu, R.D.; Pop, C.; Dobrean, A.; Georgescu, C.E. The Prognostic Value of MicroRNAs in Thyroid Cancers—A Systematic Review and Meta-Analysis. Cancers 2020, 12, 2608. [Google Scholar] [CrossRef]
- AlQahtani, K.H.; AlAsiri, M.; Tunio, M.A.K.; Aljohani, N.J.; Bayoumi, Y.; AlShakwer, W. Diffuse sclerosing variant papillary thyroid carcinoma: Clinicopathological and treatment outcome analysis of 66 cases. Kuwait Med. J. 2015, 47, 230. [Google Scholar]
- Falvo, L.; Giacomelli, L.; D’Andrea, V.; Marzullo, A.; Guerriero, G.; De Antoni, E. Prognostic Importance of Sclerosing Variant in Papillary Thyroid Carcinoma. Am. Surg. 2006, 72, 438–444. [Google Scholar] [CrossRef]
- Akaishi, J.; Sugino, K.; Kameyama, K.; Masaki, C.; Matsuzu, K.; Suzuki, A.; Uruno, T.; Ohkuwa, K.; Shibuya, H.; Kitagawa, W.; et al. Clinicopathologic Features and Outcomes in Patients with Diffuse Sclerosing Variant of Papillary Thyroid Carcinoma. World J. Surg. 2015, 39, 1728–1735. [Google Scholar] [CrossRef] [PubMed]
- Li, D.; Jian, W.; Wei, C.; Song, H.; Gu, Y.; Luo, Y.; Fang, L. Down-regulation of miR-181b promotes apoptosis by targeting CYLD in thyroid papillary cancer. Int. J. Clin. Exp. Pathol. 2014, 7, 7672–7680. [Google Scholar]
- Ren, G.; Li, H.; He, X.; Zhang, J. Downregulation of serum miR-26a predicts poor clinical outcome of papillary thyroid carcinoma. Int. J. Clin. Exp. Pathol. 2017, 10, 9042–9047. [Google Scholar]
- Yao, X.-G.; Tan, Q.; Liu, P.-P.; Feng, L.-J. Tissue microRNA-182 expression level and its potential prognostic value for papillary thyroid carcinoma. Int. J. Clin. Exp. Pathol. 2019, 12, 3128–3133. [Google Scholar]


| Characteristic | All Patients | p |
|---|---|---|
| (n = 312) | ||
| Sex, n (%) | p < 0.05 | |
| Male | 33 (10.5%) | |
| Female | 279 (89.1%) | |
| Age at initial surgery (years) | 53 (min = 18, max = 83) | p < 0.05 |
| Median (min-max) | 174 (55.77%) | |
| <55 years, n (%) | 138 (44.23%) | |
| ≥55 years, n (%) | ||
| Tumor size, n (%) | p < 0.05 | |
| pT1a | 100 (32.05%) | |
| pT1b | 66 (21.15%) | |
| pT2 | 18 (5.78%) | |
| pT3 | 123 (39.42%) | |
| pT4 | 5 (1.6%) | |
| Lymph node metastases at initial surgery, | 264(84.7%)/48(15.3%) | p < 0.05 |
| n (%) | ||
| no/yes | ||
| Variant of PTC, n (%) | p < 0.05 | |
| The classical variant | 88 (28.20%) | |
| The diffuse sclerosing variant | 30 (9.62%) | |
| Microcarcinoma | 105 (33.65%) | |
| Oxiphylic cell carcinoma | 53 (16.99%) | |
| The follicular variant | 36(11.54%) | |
| Multifocality, | 244 (78.2%)/68 (21.8%) | p < 0.05 |
| n (%) | ||
| no/yes | ||
| Extrathyroidal extension, | 182 (58.4%)/130 (41.6) | p < 0.05 |
| n (%) | ||
| no/yes | ||
| Lymphovascular invasion, | 139 (44.6%)/173 (55.4%) | p > 0.05 |
| n (%) | ||
| no/yes | ||
| Autoimmune thyroiditis, | 234 (75%)/78 (25%) | p < 0.05 |
| n (%) | ||
| no/yes |
| miR | Relative Expression 2-∆Ct: MEAN ± SD | p-Value | |
|---|---|---|---|
| Aggressive Histology of PTC (n = 83) | Non-Aggressive Subtypes of PTC (n = 229) | ||
| 146b | 3.54 ± 2.83 | 3.55 ± 3.23 | 0.741 |
| 21 | 1.52 ± 1.39 | 1.55 ± 1.38 | 0.772 |
| 221 | 0.81 ± 0.66 | 0.79 ± 0.88 | 0.327 |
| 222 | 2.64 ± 1.94 | 2.45 ± 1.93 | 0.365 |
| 181b | 0.0004 ± 0.0002 | 0.0006 ± 0.0005 | 0.042 |
| Univariate Analysis | Multivariate Analysis | |||
|---|---|---|---|---|
| HR (95% CI) | p-Value | HR (95% CI) | p-Value | |
| Sex (female vs. male) | 0.42 (0.18–0.96) | 0.042 | 0.28 (0.09–0.86) | 0.026 |
| Age (<55 y vs. ≥55 y) | 0.1 (0.03–0.27) | <0.001 | 0.05(0.01–0.22) | <0.001 |
| Tumor size (pT1a-pT1b vs. pT2-4) | 0.44 (0.21–0.9) | 0.024 | 0.84 (0.35–2.01) | 0.69 |
| Lymph nodes (pos vs. neg) | 2.59 (1.24–5.42) | 0.011 | 2.16 (0.73–6.35) | 0.162 |
| Multifocality (yes/no) | 1.49 (0.71–3.12) | 0.29 | 1.37 (0.52–3.61) | 0.527 |
| Extrathyroidal extension (yes/no) | 1.77 (0.9–3.49) | 0.098 | 1.43 (0.41–4.95) | 0.57 |
| Lymphovascular invasion (yes/no) | 1.77 (0.86–3.63) | 0.121 | 1.45 (0.62–3.39) | 0.393 |
| Aggressive histology (yes/no) | 0.93 (0.29–3.04) | 0.904 | 0.96 (0.19–4.98) | 0.962 |
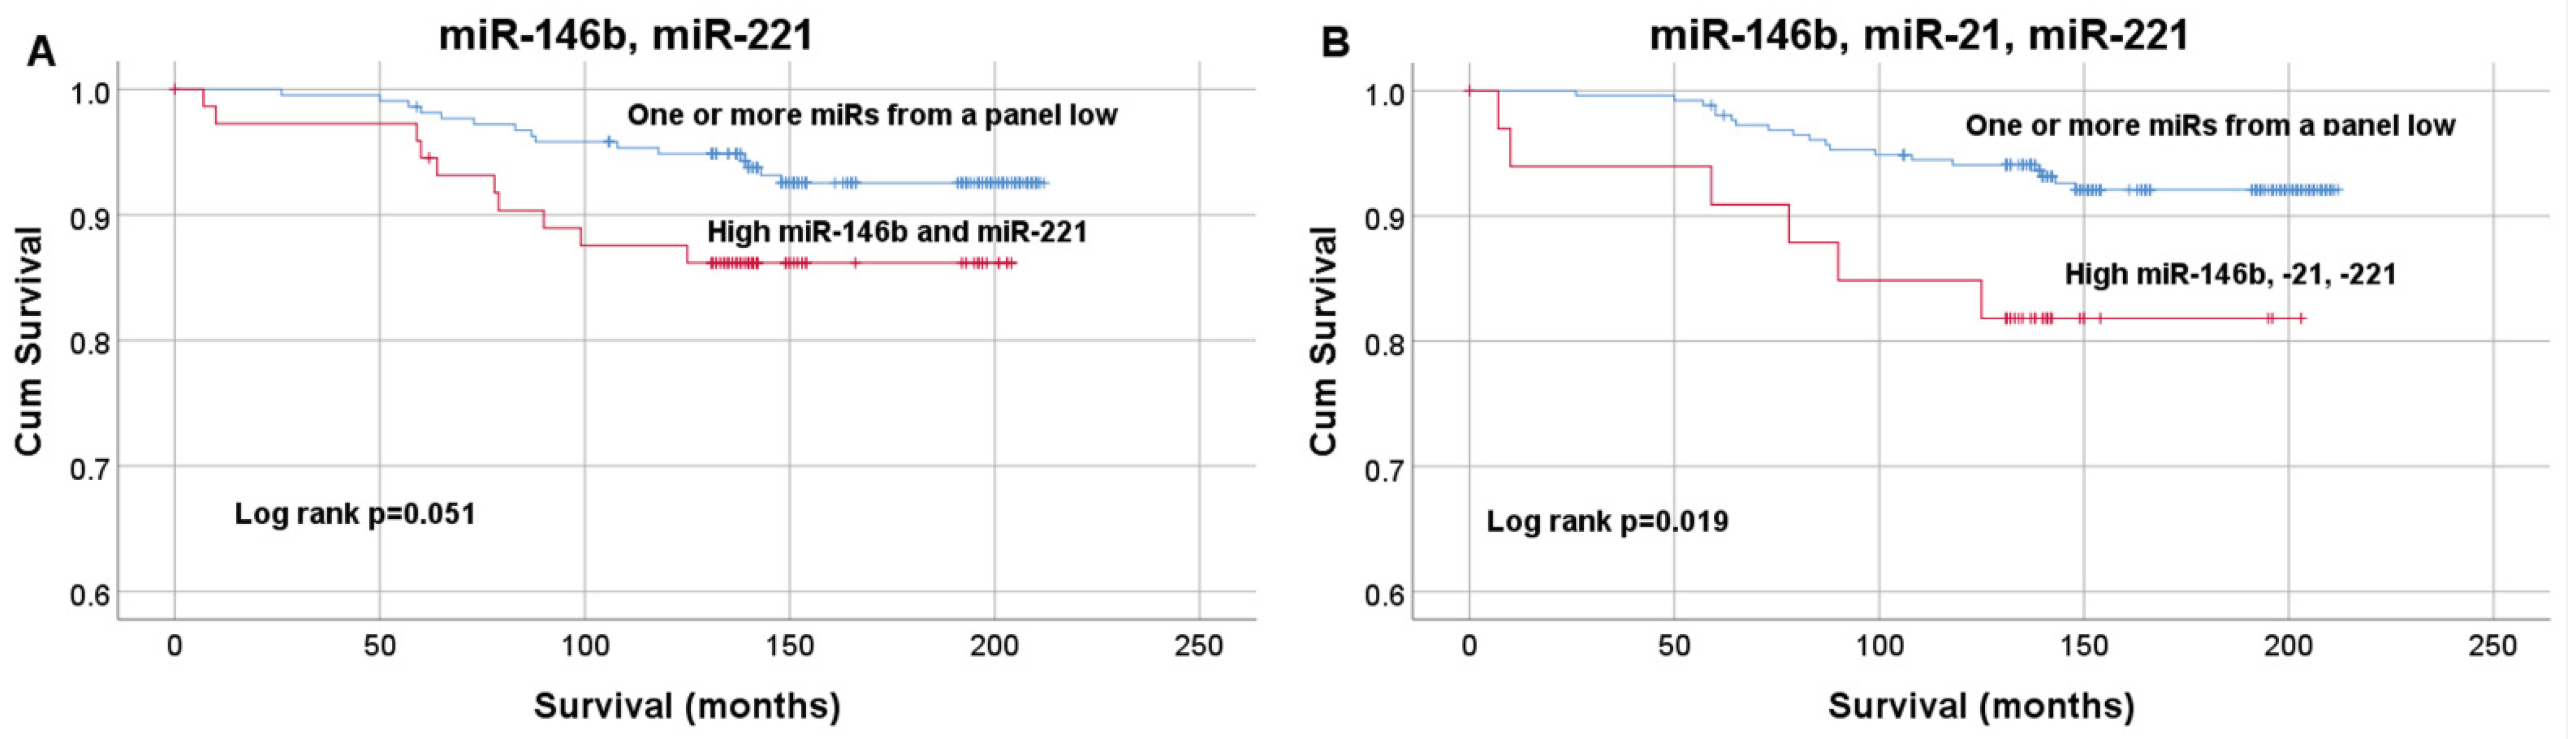
| miR-146b & miR-221 (high vs. low) | 2.17 (0.98–4.85) | 0.057 | 1.77 (0.53–5.89) | 0.354 |
| miR-146b & miR-221 & miR-21 (high vs. low) | 2.86 (1.14–7.19) | 0.026 | 1.37 (0.37–5.08) | 0.64 |
Publisher’s Note: MDPI stays neutral with regard to jurisdictional claims in published maps and institutional affiliations. |
© 2021 by the authors. Licensee MDPI, Basel, Switzerland. This article is an open access article distributed under the terms and conditions of the Creative Commons Attribution (CC BY) license (http://creativecommons.org/licenses/by/4.0/).
Share and Cite
Kondrotienė, A.; Daukša, A.; Pamedytytė, D.; Kazokaitė, M.; Žvirblienė, A.; Daukšienė, D.; Simanavičienė, V.; Klimaitė, R.; Golubickaitė, I.; Stakaitis, R.; et al. Papillary Thyroid Carcinoma Tissue miR-146b, -21, -221, -222, -181b Expression in Relation with Clinicopathological Features. Diagnostics 2021, 11, 418. https://doi.org/10.3390/diagnostics11030418
Kondrotienė A, Daukša A, Pamedytytė D, Kazokaitė M, Žvirblienė A, Daukšienė D, Simanavičienė V, Klimaitė R, Golubickaitė I, Stakaitis R, et al. Papillary Thyroid Carcinoma Tissue miR-146b, -21, -221, -222, -181b Expression in Relation with Clinicopathological Features. Diagnostics. 2021; 11(3):418. https://doi.org/10.3390/diagnostics11030418
Chicago/Turabian StyleKondrotienė, Aistė, Albertas Daukša, Daina Pamedytytė, Mintautė Kazokaitė, Aurelija Žvirblienė, Dalia Daukšienė, Vaida Simanavičienė, Raimonda Klimaitė, Ieva Golubickaitė, Rytis Stakaitis, and et al. 2021. "Papillary Thyroid Carcinoma Tissue miR-146b, -21, -221, -222, -181b Expression in Relation with Clinicopathological Features" Diagnostics 11, no. 3: 418. https://doi.org/10.3390/diagnostics11030418