Influenza Vaccination Coverage among Adults in Korea: 2008–2009 to 2011–2012 Seasons


Abstract
:1. Introduction

| Seasonal | Pandemic (2009–2010 Season only) |
|---|---|
| 1. Individuals over 65 years old 2. Financially vulnerable persons 3. Handicapped individuals 4. Soldiers | 1. Healthcare workers |
| 2. Infants and pregnant women | |
| 3. Individuals over 65 years old | |
| 4. Individuals in high-risk groups aged 50 to 64 years | |
| 5. Students (elementary, middle, and high school) | |
| 6. Soldiers | |
| 7. Teachers (preschool and K-12) | |
| 8. Airport, infrastructure, and port workers | |
| 9. Social welfare and child care center residents and workers |
2. Methods
2.1. Data Source
2.2. Study Variables
2.3. Statistical Analysis
3. Results
3.1. Influenza Vaccination Coverage in Four Consecutive Seasons
3.2. Determinants of Influenza Vaccination Receipt

| Variables | 2008–2009 Seasonal | 2009–2010 Seasonal and Pandemic | 2010–2011 Seasonal | 2011–2012 Seasonal | Test for linear trend * |
|---|---|---|---|---|---|
| Number of Individuals (vaccination Coverage, %) | p-value | ||||
| Socioeconomic variables | |||||
| Sex | |||||
| Male | 107,080 (32.4) | 104,575 (36.6) | 103,017 (36.5) | 102,898 (38.4) | <0.001 |
| Female | 123,635 (42.6) | 124,654 (44.7) | 126,209 (45.8) | 126,023 (47.8) | <0.001 |
| Age (years) | |||||
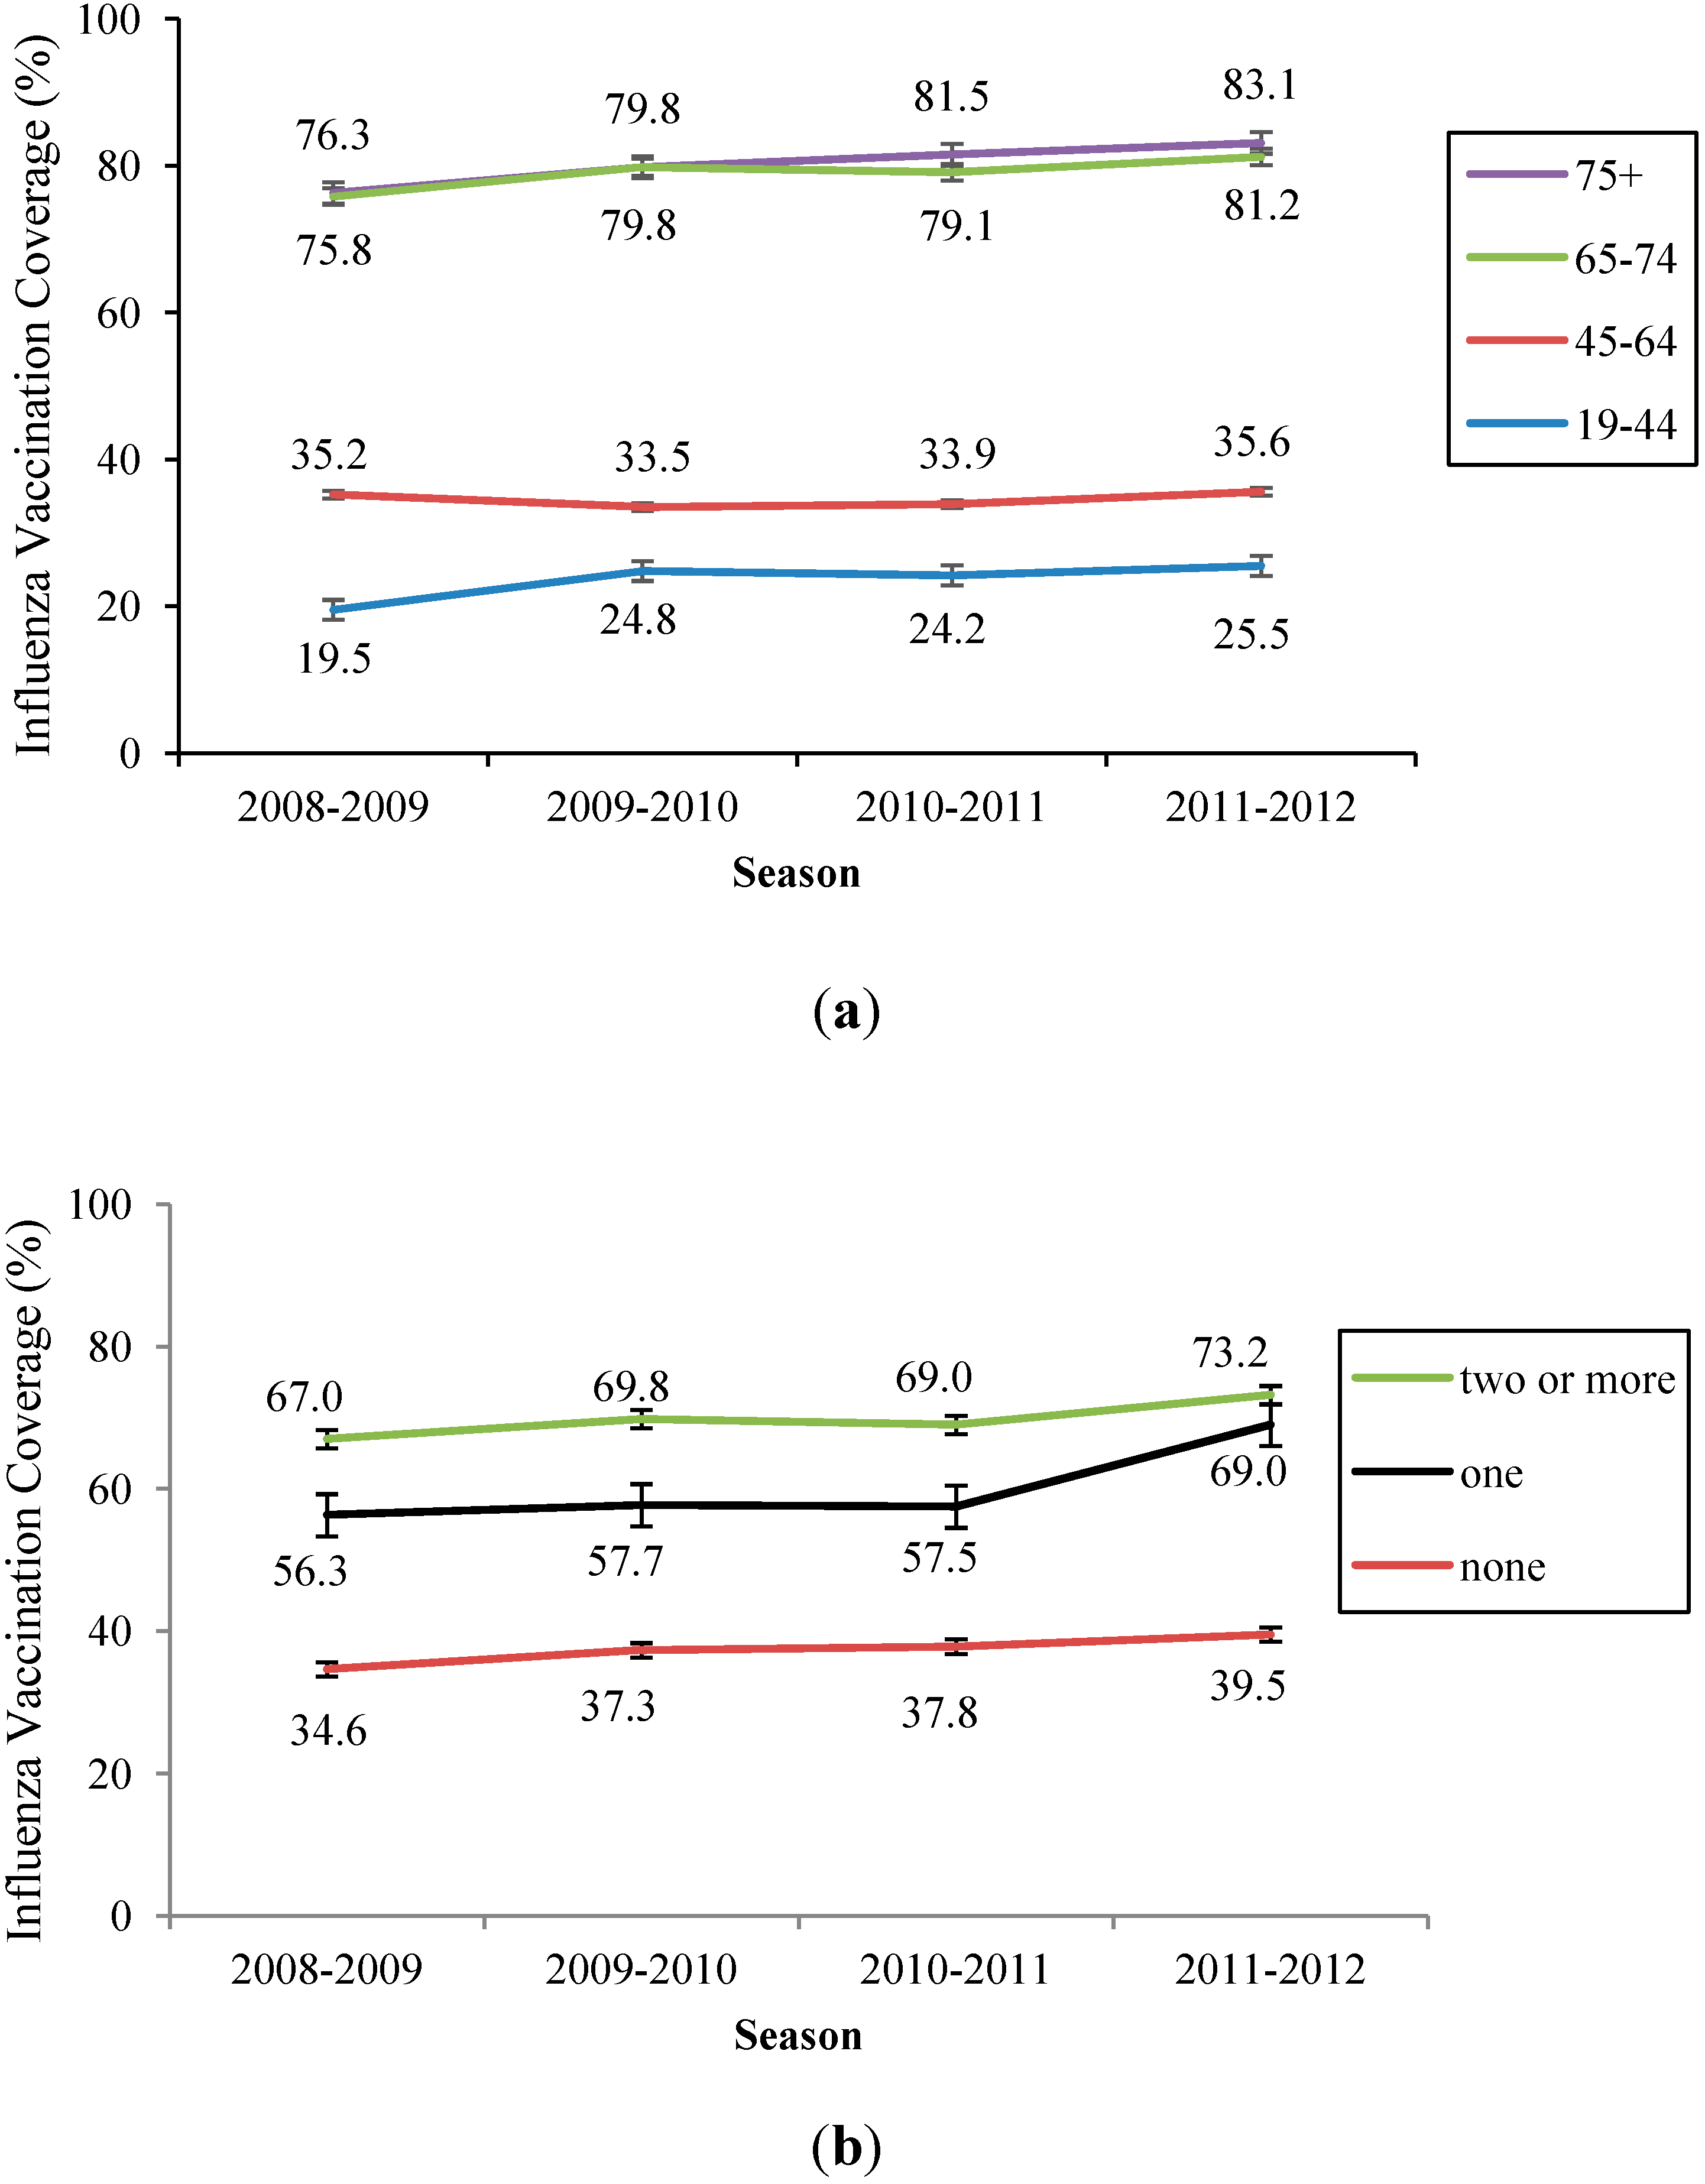
| 19–44 | 95,611 (19.5) | 90,970 (24.8) | 87,472 (24.2) | 85,060 (25.5) | <0.001 |
| 45–64 | 83,419 (35.2) | 84,005 (33.5) | 85,130 (33.9) | 85,757 (35.6) | <0.001 |
| 65–74 | 33,958 (75.8) | 34,823 (79.8) | 35,050 (79.1) | 35,483 (81.2) | <0.001 |
| ≥75 | 17,727 (76.3) | 19,431 (79.8) | 21,574 (81.5) | 22,621 (83.1) | <0.001 |
| Income † | |||||
| ≥2000 per month | 109,699 (29.2) | 104,669 (35.5) | 109,798 (31.7) | 119,165 (33.6) | <0.001 |
| <2000 per month | 112,716 (46.5) | 103,916 (49.8) | 101,784 (52.3) | 96,476 (56.1) | <0.001 |
| Occupation | |||||
| Professional | 72,118 (24.7) | 68,231 (28.0) | 70,694 (27.5) | 71,868 (29.3) | <0.001 |
| Service/physical | 66,141 (39.7) | 60,208 (41.5) | 70,925 (42.9) | 73,042 (45.5) | <0.001 |
| Others ‡ | 92,294 (46.8) | 86,883 (50.3) | 87,267 (52.0) | 83,800 (54.2) | <0.001 |
| Education level | |||||
| At least high school | 123,800 (25.9) | 124,649 (29.3) | 124,178 (29.3) | 125,419 (31.2) | <0.001 |
| Less than high school | 106,646 (51.7) | 103,956 (55.1) | 104,557 (56.2) | 103,069 (58.7) | <0.001 |
| Residency | |||||
| Metropolitan | 68,647 (30.7) | 67,747 (34.6) | 67,921 (35.6) | 67,852 (37.4) | <0.001 |
| Urban | 61,499 (31.5) | 60,947 (34.5) | 60,837 (35.4) | 61,903 (36.9) | <0.001 |
| Rural | 97,311 (47.1) | 97,318 (49.6) | 97,234 (49.9) | 94,991 (52.5) | <0.001 |
| Chronic illness § | |||||
| None | 198,682 (34.6) | 191,414 (37.3) | 189,346 (37.8) | 188,180 (39.5) | <0.001 |
| One | 27,566 (56.3) | 31,777 (57.7) | 33,473 (57.5) | 34,120 (60.2) | <0.001 |
| Two or more | 4467 (67.0) | 6,038 (69.8) | 6407 (69.0) | 6621 (73.2) | <0.001 |
| Health behaviors | |||||
| Health check-up †† | |||||
| No | 88,572 (24.3) | 86,883 (29.8) | - | 76,567 (30.7) | <0.001 |
| Yes | 142,143 (46.3) | 142,346 (47.9) | - | 152,354 (50.1) | <0.001 |
| Smoking | |||||
| Never smoker | 144,588 (40.7) | 144,859 (43.6) | 143,886 (44.3) | 144,249 (46.2) | <0.001 |
| Former smoker | 31,168 (44.5) | 33,551 (47.8) | 36,612 (47.9) | 36,831 (50.9) | <0.001 |
| Current smoker | 54,779 (26.3) | 50,741 (29.2) | 48,679 (28.9) | 47,812 (29.9) | <0.001 |
| Drink alcohol | |||||
| No | 114,699 (46.6) | 113,314 (49.6) | 111,358 (50.8) | 112,986 (53.0) | <0.001 |
| Yes | 115,931 (29.1) | 115,726 (32.6) | 117,743 (32.9) | 115,880 (34.4) | <0.001 |
| Regular walking | |||||
| <30 min/5days/week | 113,656 (36.6) | 129,781 (40.2) | 133,215 (40.8) | 136,324 (43.2) | <0.001 |
| ≥30 min/5days/week | 116,896 (39.0) | 98,988 (42.1) | 95,576 (42.7) | 92,343 (44.2) | <0.001 |
| Total | 230,715 (37.8) | 229,229 (41.0) | 229,226 (41.6) | 229,921 (43.6) | <0.001 |
| Variables | 2008–2009 | 2009–2010 | 2010–2011 | 2011–2012 | ||||
|---|---|---|---|---|---|---|---|---|
| Adjusted OR | 95% CI | Adjusted OR | 95% CI | Adjusted OR | 95% CI | Adjusted OR | 95% CI | |
| Socioeconomic variables | ||||||||
| Sex | ||||||||
| Male | 1 | 1 | 1 | 1 | ||||
| Female | 1.32 | (1.28–1.36) | 1.12 | (1.07–1.14) | 1.27 | (1.23–1.31) | 1.29 | (1.25–1.33) |
| Age (years) | ||||||||
| 19–44 | 1 | 1 | 1 | 1 | ||||
| 45–64 | 1.42 | (1.38–1.45) | 1.00 | (0.97–1.02) | 1.21 | (1.18–1.24) | 0.99 | (0.97–1.02) |
| 65–74 | 6.73 | (6.49–6.98) | 6.57 | (6.31–6.83) | 7.54 | (7.26–7.82) | 6.23 | (6.00–6.48) |
| ≥75 | 7.93 | (7.57–8.30) | 7.22 | (6.87–7.58) | 9.16 | (8.75–9.60) | 8.12 | (7.75–8.50) |
| Income † | ||||||||
| ≥2000 per month | 1 | 1 | 1 | 1 | ||||
| <2000 per month | 1.14 | (1.11–1.16) | 1.02 | (1.00–1.05) | 1.07 | (1.05–1.10) | 1.14 | (1.11–1.16) |
| Occupation | ||||||||
| Professional | 1 | 1 | 1 | 1 | ||||
| Service/physical | 1.08 | (1.05–1.11) | 1.00 | (0.97–1.03) | 1.05 | (1.02–1.08) | 1.07 | (1.04–1.10) |
| Others ‡ | 1.25 | (1.22–1.29) | 1.24 | (1.20–1.27) | 1.11 | (1.08–1.14) | 1.24 | (1.20–1.27) |
| Education level | ||||||||
| At least high school | 1 | 1 | 1 | 1 | ||||
| Less than high school | 1.23 | (1.20–1.26) | 1.02 | (1.00–1.05) | 1.27 | (1.24–1.30) | 1.31 | (1.28–1.34) |
| Residency | ||||||||
| Metropolitan | 1 | 1 | 1 | 1 | ||||
| Urban | 1.07 | (1.04–1.10) | 1.07 | (1.04–1.10) | 1.04 | (1.01–1.07) | 1.04 | (1.02–1.07) |
| Rural | 1.35 | (1.32–1.38) | 1.34 | (1.31–1.38) | 1.18 | (1.15–1.21) | 1.21 | (1.18–1.24) |
| Chronic illness § | ||||||||
| None | 1 | 1 | 1 | 1 | ||||
| One | 1.29 | (1.26–1.33) | 1.39 | (1.34–1.43) | 1.34 | (1.30–1.38) | 1.38 | (1.34–1.42) |
| Two or more | 1.59 | (1.49–1.70) | 1.62 | (1.51–1.73) | 1.59 | (1.49–1.70) | 1.80 | (1.68–1.92) |
| Health behaviors | ||||||||
| Health check–up †† | ||||||||
| No | 1 | 1 | - | 1 | ||||
| Yes | 2.48 | (2.43–2.54) | 2.15 | (2.10–2.20) | - | 2.28 | (2.23–2.33) | |
| Smoking | ||||||||
| Never smoker | 1 | 1 | 1 | 1 | ||||
| Former smoker | 1.04 | (1.01–1.08) | 0.97 | (0.93–1.01) | 1.03 | (1.00–1.07) | 1.08 | (1.05–1.12) |
| Current smoker | 0.79 | (0.77–0.82) | 0.74 | (0.72–0.77) | 0.75 | (0.72–0.77) | 0.78 | (0.75–0.80) |
| Drinking alcohol | ||||||||
| No | 1 | 1 | 1 | 1 | ||||
| Yes | 0.86 | (0.85–0.88) | 0.87 | (0.85–0.89) | 0.88 | (0.86–0.90) | 0.85 | (0.83–0.87) |
| Regular walking | ||||||||
| <30 min/5days/week | 1 | 1 | 1 | 1 | ||||
| ≥30 min/5days/week | 1.12 | (1.10–1.15) | 1.14 | (1.12–1.16) | 1.14 | (1.11–1.16) | 1.12 | (1.10–1.14) |
4. Discussion
5. Conclusions
Acknowledgments
Author Contributions
Conflicts of Interest
References
- World Health Organization (WHO). WHO position paper. Wkly. Epidemiol. Rec. 2005, 33, 279–287. [Google Scholar]
- CDC. Prevention and control of seasonal influenza with vaccines. MMWR 2013, 62, 1–43. [Google Scholar]
- Simonsen, L.; Fukuda, K. The impact of influenza epidemics on hospitalizations. J. Infect. Dis. 2000, 181, 831–837. [Google Scholar] [CrossRef] [PubMed]
- Terebu, P.; Uyeki, T. Impact of influenza on young children and the shaping of United Sates influenza vaccine policy. Pediatr. Infect. Dis. 2003, 22, S231–S235. [Google Scholar] [CrossRef]
- World Health Organization (WHO). Vaccines against influenza WHO position paper—Novermber 2012. Wkly. Epidemiol. Rec. 2012, 47, 461–476. [Google Scholar]
- Jain, S.; Kamimoto, L. Hospitalized patients with 2009 H1N1 influenza in the United States, April-June 2009. N. Engl. J. Med. 2009, 361, 1935–1944. [Google Scholar] [CrossRef] [PubMed]
- Mallia, P.; Johnston, S.L. Influenza infection and COPD. Int. J. COPD 2007, 2, 55–64. [Google Scholar] [CrossRef]
- Neuzil, K.M.; Reed, G.W. Influenza-associated morbidity and mortality in young and middle-aged women. JAMA 1999, 281, 901–907. [Google Scholar] [CrossRef] [PubMed]
- Osterholm, M.T.; Kelley, N.S. Efficacy and effectiveness of influenza vaccines: A systematic review and meta-analysis. Lancet Infect. Dis. 2012, 12, 36–44. [Google Scholar] [CrossRef] [PubMed]
- Puig-Barbera, J.; Diez-Domingo, J. Effectiveness of the 2011–2011 seasonal influenza vaccine in preventing confirmed influenza hospitalizations in adults: A case-case comparison, case-control study. Vaccine 2012, 30, 5714–5720. [Google Scholar] [CrossRef] [PubMed]
- Girard, M.P.; Tam, J.S. The 2009 A (H1N1) influenza virus pandemic: A review. Vaccine 2010, 28, 4895–4902. [Google Scholar] [CrossRef] [PubMed]
- Song, J.Y.; Cheong, H.J. Effectiveness of the pandemic influenza A/H1N1 2009 monovalent vaccine in Korea. Vaccine 2011, 29, 1395–1398. [Google Scholar] [CrossRef] [PubMed]
- Blank, P.R.; Szucs, T.D. Increasing influenza vaccination coverage in recommended population groups in Europe. Expert Rev. Vaccines 2009, 8, 425–433. [Google Scholar] [CrossRef] [PubMed]
- Simonsen, L.; Taylor, R.J. Mortality benefits of influenza vaccination in elderly people: An ongoing controversy. Lancet Infect. Dis. 2007, 7, 658–666. [Google Scholar] [CrossRef] [PubMed]
- Nicho, K.L.; Nording, J. Influenza vaccination and reduction in hospitalizations for cardiac disease and stroke among the elderly. N. Engl. J. Med. 2003, 348, 1322–1332. [Google Scholar] [CrossRef] [PubMed]
- Kausz, A.; Pahari, D. The value of vaccination in chronic kidney disease. Semin. Dial. 2004, 17, 9–11. [Google Scholar] [CrossRef] [PubMed]
- Lau, D.; Eurich, D.T. Effectiveness of influenza vaccination in working-age adults with diabetes: A population-based cohort study. Thorax 2013, 68, 658–663. [Google Scholar] [CrossRef] [PubMed]
- Kramarz, P.; Ciancio, B. Sesonal and pandemic influenza vaccines for the elderly and other risk groups: A review of available data. Pol. Arch. Med. Wewn. 2009, 119, 654–659. [Google Scholar] [PubMed]
- Lin, H.C.; Chiu, H.F. Association of influenza vaccination and reduced risk of stroke hospitalization among the elderly. Int. J. Environ. Res. Public Health 2014, 11, 3639–3649. [Google Scholar] [CrossRef] [PubMed]
- Korea Centers for Disease Control and Prevention. 2013–2014 Instruction Guidelines for Influenza; KCDC: Seoul, Korea, 2013. [Google Scholar]
- OECD. Health at a Glance 2011: OECD Indicators, OECD Publishing, 2011. Available online: http://dx.doi.org/10.1787/health_glance-2011-en (accessed on 3 December 2013).
- Lee, Y.K.; Kwon, Y. 2009–2010 novel influenza A (H1N1) vaccination coverage in the Republic of Korea. Am. J. Infect. Control. 2012, 40, 481–483. [Google Scholar] [CrossRef] [PubMed]
- Heo, J.Y.; Chang, S.H. Risk perception, preventive behaviors, and vaccination coverage in the Korean population during the 2009–2010 pandemic influenza A (H1N1); Comparison between high-risk group and non-high-risk group. PLoS One 2013, 8, 1–8. [Google Scholar]
- Ryu, S.Y.; Kim, S.H. Influenza vaccination among adults 65 years or older: A 2009–2010 community health survey in the Honam region of Korea. Int. J. Environ. Res. Public Health 2011, 8, 4197–4296. [Google Scholar] [CrossRef] [PubMed]
- Kee, S.Y.; Lee, J.S. Influenza vaccine coverage rates and perceptions on vaccination in South Korea. J. Infect. 2007, 55, 273–281. [Google Scholar] [CrossRef] [PubMed]
- Kim, Y.T.; Choi, B.Y. Overview of Korean community health survey. J. Korean Med. Assoc. 2012, 55, 74–83. [Google Scholar] [CrossRef]
- Rim, H.; Kim, H. Validity of self-reported healthcare utilization data in the community health survey in Korea. J. Korean Med. Sci. 2011, 26, 1409–1414. [Google Scholar] [CrossRef] [PubMed]
- Oh, D.H.; Kim, S.A. Prevalence and correlates of depressive symptoms in Korean adults: Results of a 2009 Korean community health survey. J. Korean Med. Sci. 2013, 28, 128–135. [Google Scholar] [CrossRef] [PubMed]
- Kee, S.Y.; Cheong, H.J. Influenza vaccination coverage rate and factors associated with vaccination in people with chronic disease. Infect. Chemother. 2011, 43, 406–411. [Google Scholar] [CrossRef]
- Wu, S.; Yang, P. Influenza vaccination coverage rates among adults before and after the 2009 influenza pandemic and the reasons for non-vaccination in Beijing, China: A cross-sectional study. BMC Public Health 2013, 13, 1–8. [Google Scholar] [CrossRef] [PubMed]
- Takayama, M.; Wetmore, C.M. Characteristics associated with the uptake of influenza vaccination among adults in the United States. Prev. Med. 2012, 54, 358–362. [Google Scholar] [CrossRef] [PubMed]
- Wada, K.; Smith, D.R. Influenza vaccination uptake among the working age population of Japan: Results from a national cross-sectional survey. PLoS One 2013, 8, 1–6. [Google Scholar]
- Vaux, S.; van Cauteren, D. Influenza vaccination coverage against seasonal and pandemic influenza and their determinants in France: A cross-sectional survey. BMC Public Health 2011, 11, 1–9. [Google Scholar] [CrossRef] [PubMed]
- McIntyre, A.F.; Gonzalez-Feliciano, A.G. Flu Vaccination Coverage, United States, 2011–12 Influenza Season. Available online: http://www.cdc.gov/flu/pdf/fluvaxview/vax-coverage-1112estimates.pdf (accessed on 29 April 2014).
- Bentele, H.; Bergsaker, M.R. Vaccination coverage for seasonal influenza among residents and health care workers in Norwegian nursing homes during the 2012/13 season, a cross-sectional study. BMC Public Health 2014, 14, 1–6. [Google Scholar] [CrossRef] [PubMed] [Green Version]
- Kroneman, M.; van Essen, G.A. Influenza vaccination coverage and reasons to refrain among high-risk persons in four European countries. Vaccine 2006, 24, 622–628. [Google Scholar] [CrossRef] [PubMed]
- Zhou, L.; Su, Q. Seasonal influenza vaccination coverage rate of target groups in selected cities and provinces in China by season (2009/10 to 2011/12). PLoS One 2013, 8, 1–7. [Google Scholar] [CrossRef]
- CDC. Surveillance of influenza vaccination coverage—United States, 2007–08 through 2011–12 influenza seasons. MMWR 2013, 62, 1–28. [Google Scholar]
- Mereckiene, J.; Cotter, S. Seasonal influenza immunization in Europe. Overview of recommendations and vaccination coverage for three seasons: pre-pandemic (2008/09), pandemic (2009.10) and post-pandemic (2010/11). Euro. Sruveill. 2014, 19, 1–11. [Google Scholar]
- Caille-Brillet, A.L.; Raude, J. Trends in influenza vaccination behaviors—Results from the CoPanFlu cohort, France, 2006 to 2011. Euro. Surveill. 2013, 18, 1–10. [Google Scholar] [PubMed]
- Nelson, D.E.; Bland, S. State Trend in health risk factors and receipt of clinical preventive service among US adults during the 1990s. JAMA 2002, 287, 2659–2667. [Google Scholar] [CrossRef] [PubMed]
- CDC. Surveillance for certain health behaviors among states and selected local areas—United States, 2010. MMWR 2013, 62, 1–75. [Google Scholar]
- Pinto, C.S.; Nunes, B. Trends in influenza vaccination coverage in Portugal from 1998 to 2010: Effect of major pandemic threats. BMC Public Health 2013, 13, 1–10. [Google Scholar] [CrossRef] [PubMed]
- Castilla, J.; Martinez-Baz, I. Trends in influenza vaccine coverage among primary healthcare workers in Spain, 2008–2011. Prev. Med. 2013, 57, 206–211. [Google Scholar] [CrossRef] [PubMed]
- de Lataillade, C.; Auvergne, S. 2005 and 2006 seasonal influenza vaccination coverage rates in 10 countries in Africa, Asia Pacific, Europe, Latin America and the Middle East. J. Public Health Policy 2009, 1, 83–101. [Google Scholar] [CrossRef]
- Palache, A. Seasonal influenza vaccine provision in 157 countries (2004–2009) and the potential influence of national public health policies. Vaccine 2011, 29, 9459–9466. [Google Scholar] [CrossRef] [PubMed]
- Kim, W.J. Novel influenza A/H1N1 pandemic: Current status and prospects. J. Korean Med. Assoc. 2009, 52, 787–794. [Google Scholar] [CrossRef]
- Kim, H.S.; Kim, J.H. Fatal cases of 2009 pandemic influenza A(H1N1) in Korea. J. Korean Med. Sci. 2011, 26, 22–27. [Google Scholar] [CrossRef] [PubMed]
- Suh, M.; Kang, D.R. Socioeconomic burden of influenza in the Republic of Korea, 2007–2010. PLoS One 2013, 8, 1–7. [Google Scholar]
- Yoo, B-.K. How to improve influenza vaccination rates in the U.S. J. Prev. Med. Public Health 2011, 44, 141–148. [Google Scholar]
- Stinchfield, P.K. Practice-proven interventions to increase vaccination rates and broaden the immunization season. Amer. J. Med. 2008, 121, S11–S21. [Google Scholar] [CrossRef] [PubMed]
© 2014 by the authors; licensee MDPI, Basel, Switzerland. This article is an open access article distributed under the terms and conditions of the Creative Commons Attribution license (http://creativecommons.org/licenses/by/4.0/).
Share and Cite
Yang, H.J.; Cho, S.-i. Influenza Vaccination Coverage among Adults in Korea: 2008–2009 to 2011–2012 Seasons. Int. J. Environ. Res. Public Health 2014, 11, 12162-12173. https://doi.org/10.3390/ijerph111212162
Yang HJ, Cho S-i. Influenza Vaccination Coverage among Adults in Korea: 2008–2009 to 2011–2012 Seasons. International Journal of Environmental Research and Public Health. 2014; 11(12):12162-12173. https://doi.org/10.3390/ijerph111212162
Chicago/Turabian StyleYang, Hye Jung, and Sung-il Cho. 2014. "Influenza Vaccination Coverage among Adults in Korea: 2008–2009 to 2011–2012 Seasons" International Journal of Environmental Research and Public Health 11, no. 12: 12162-12173. https://doi.org/10.3390/ijerph111212162