The Association between Road Traffic Noise Exposure, Annoyance and Health-Related Quality of Life (HRQOL)

 , ,
, , 
Abstract
:1. Introduction
2. Methods
2.1. Outcome Variables
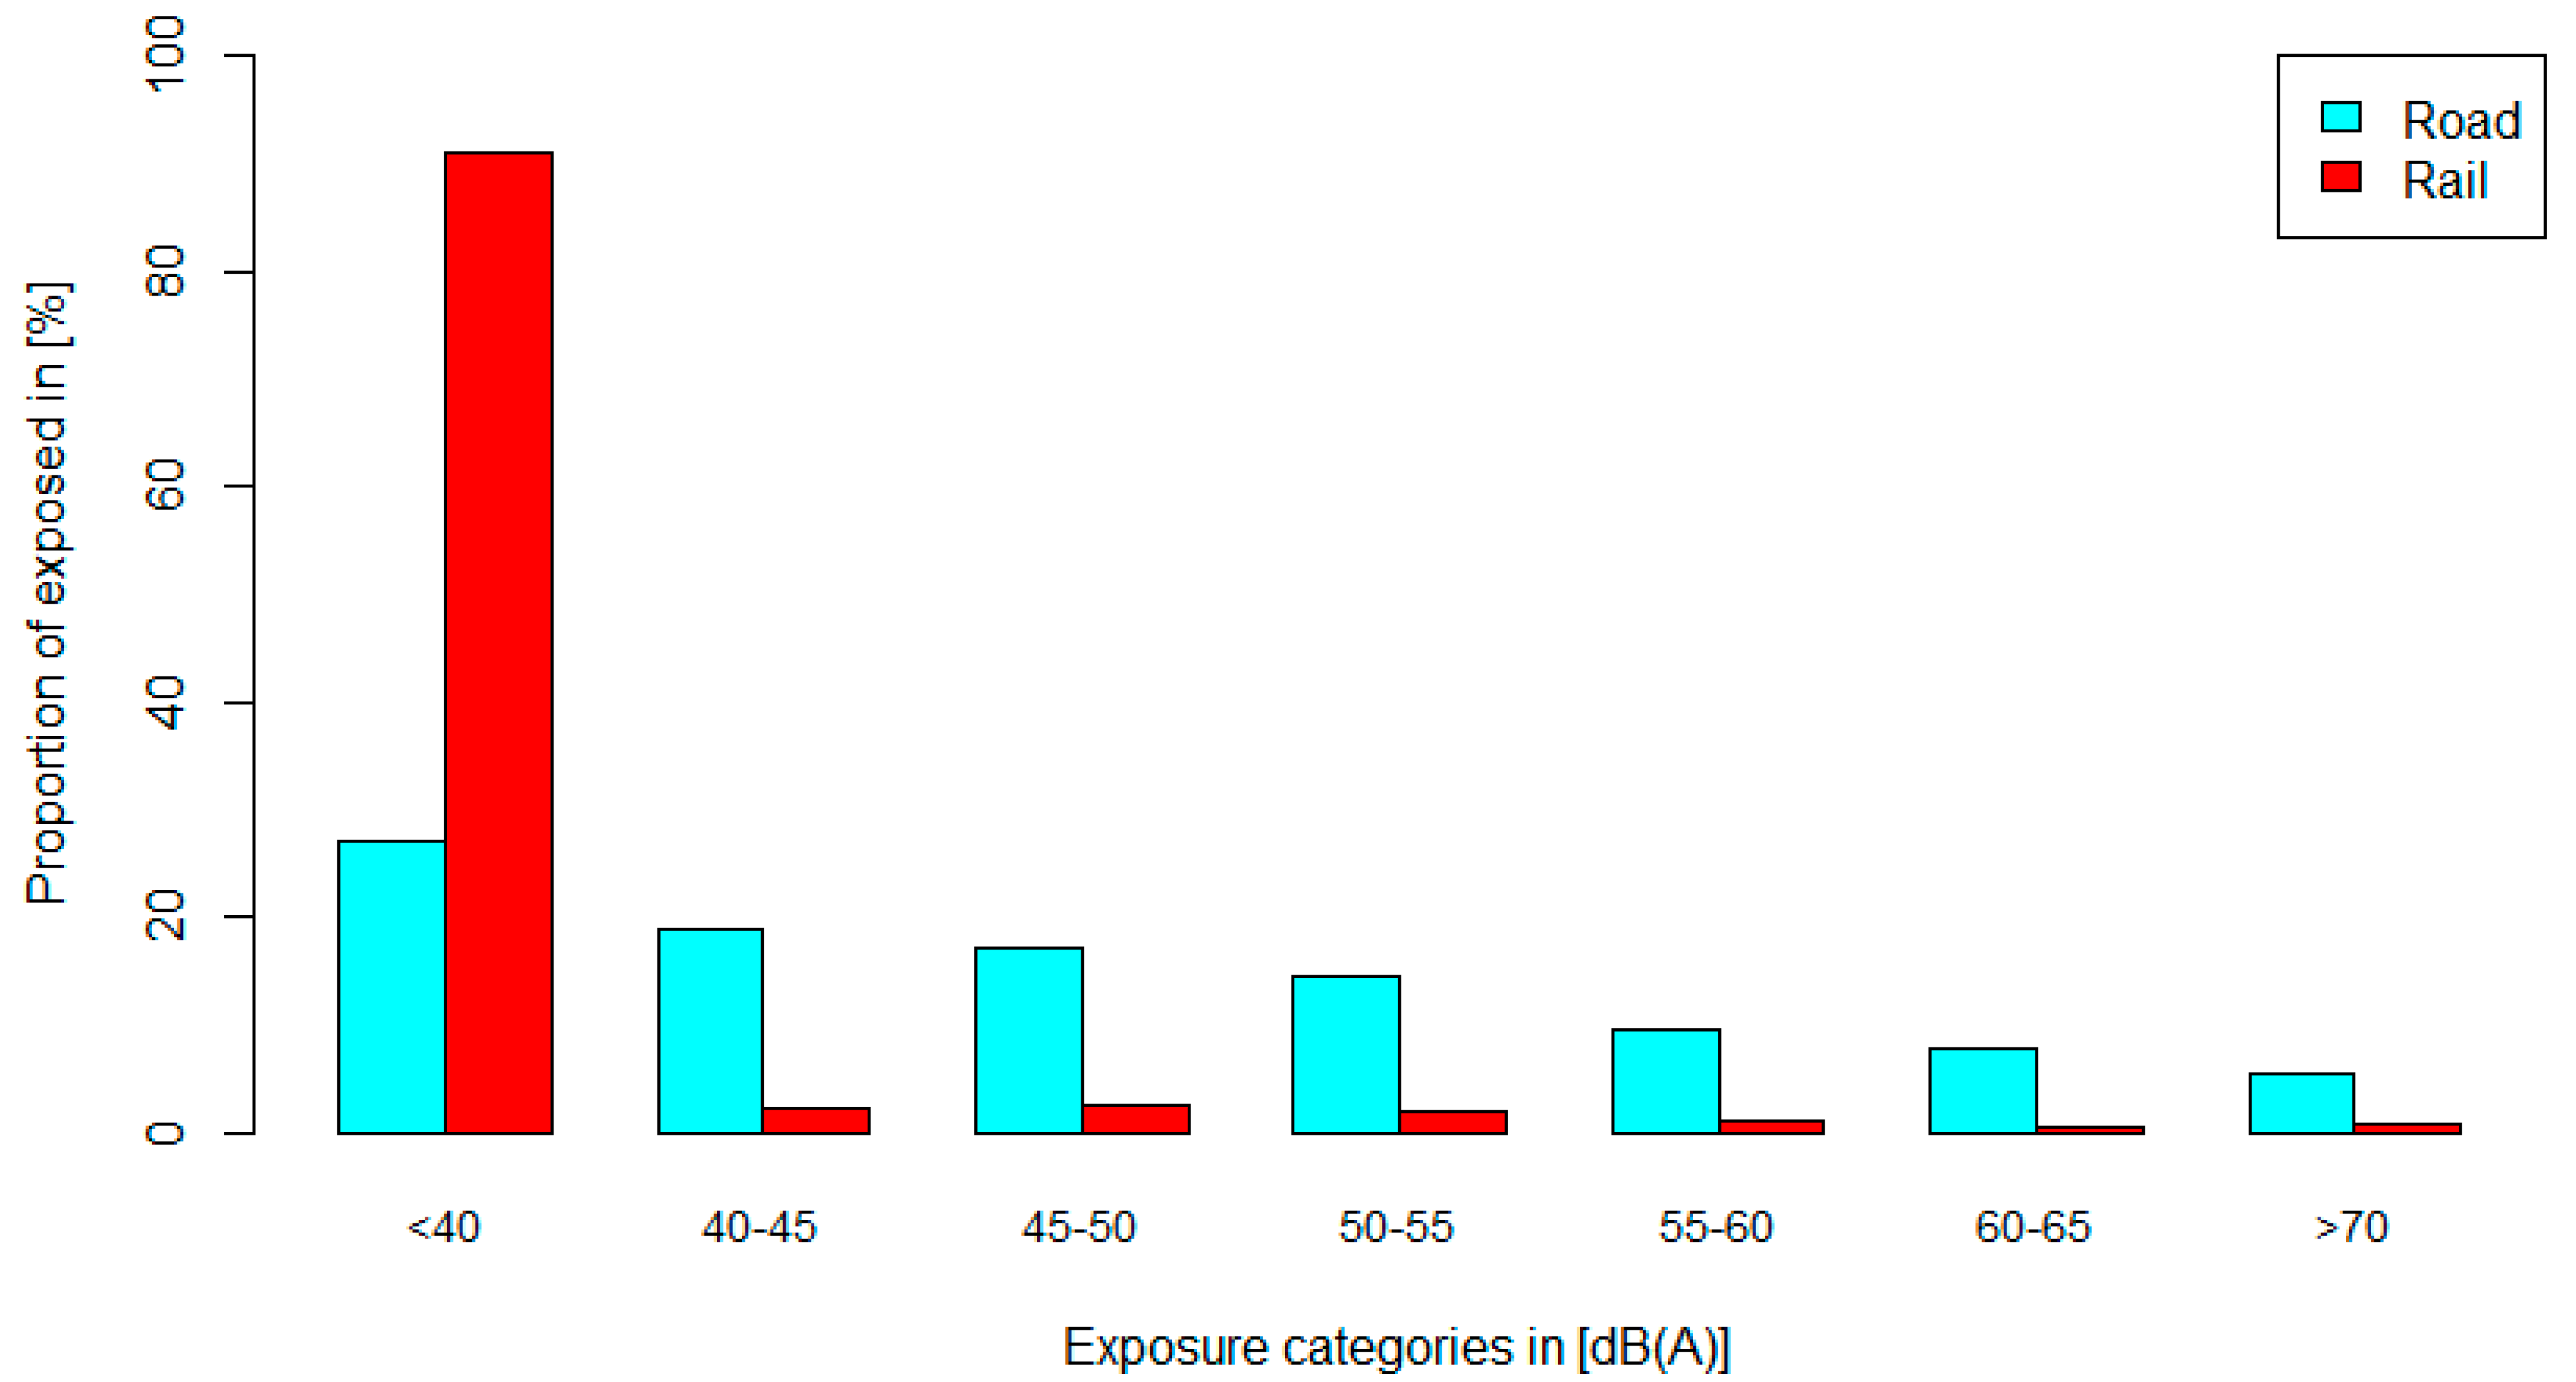
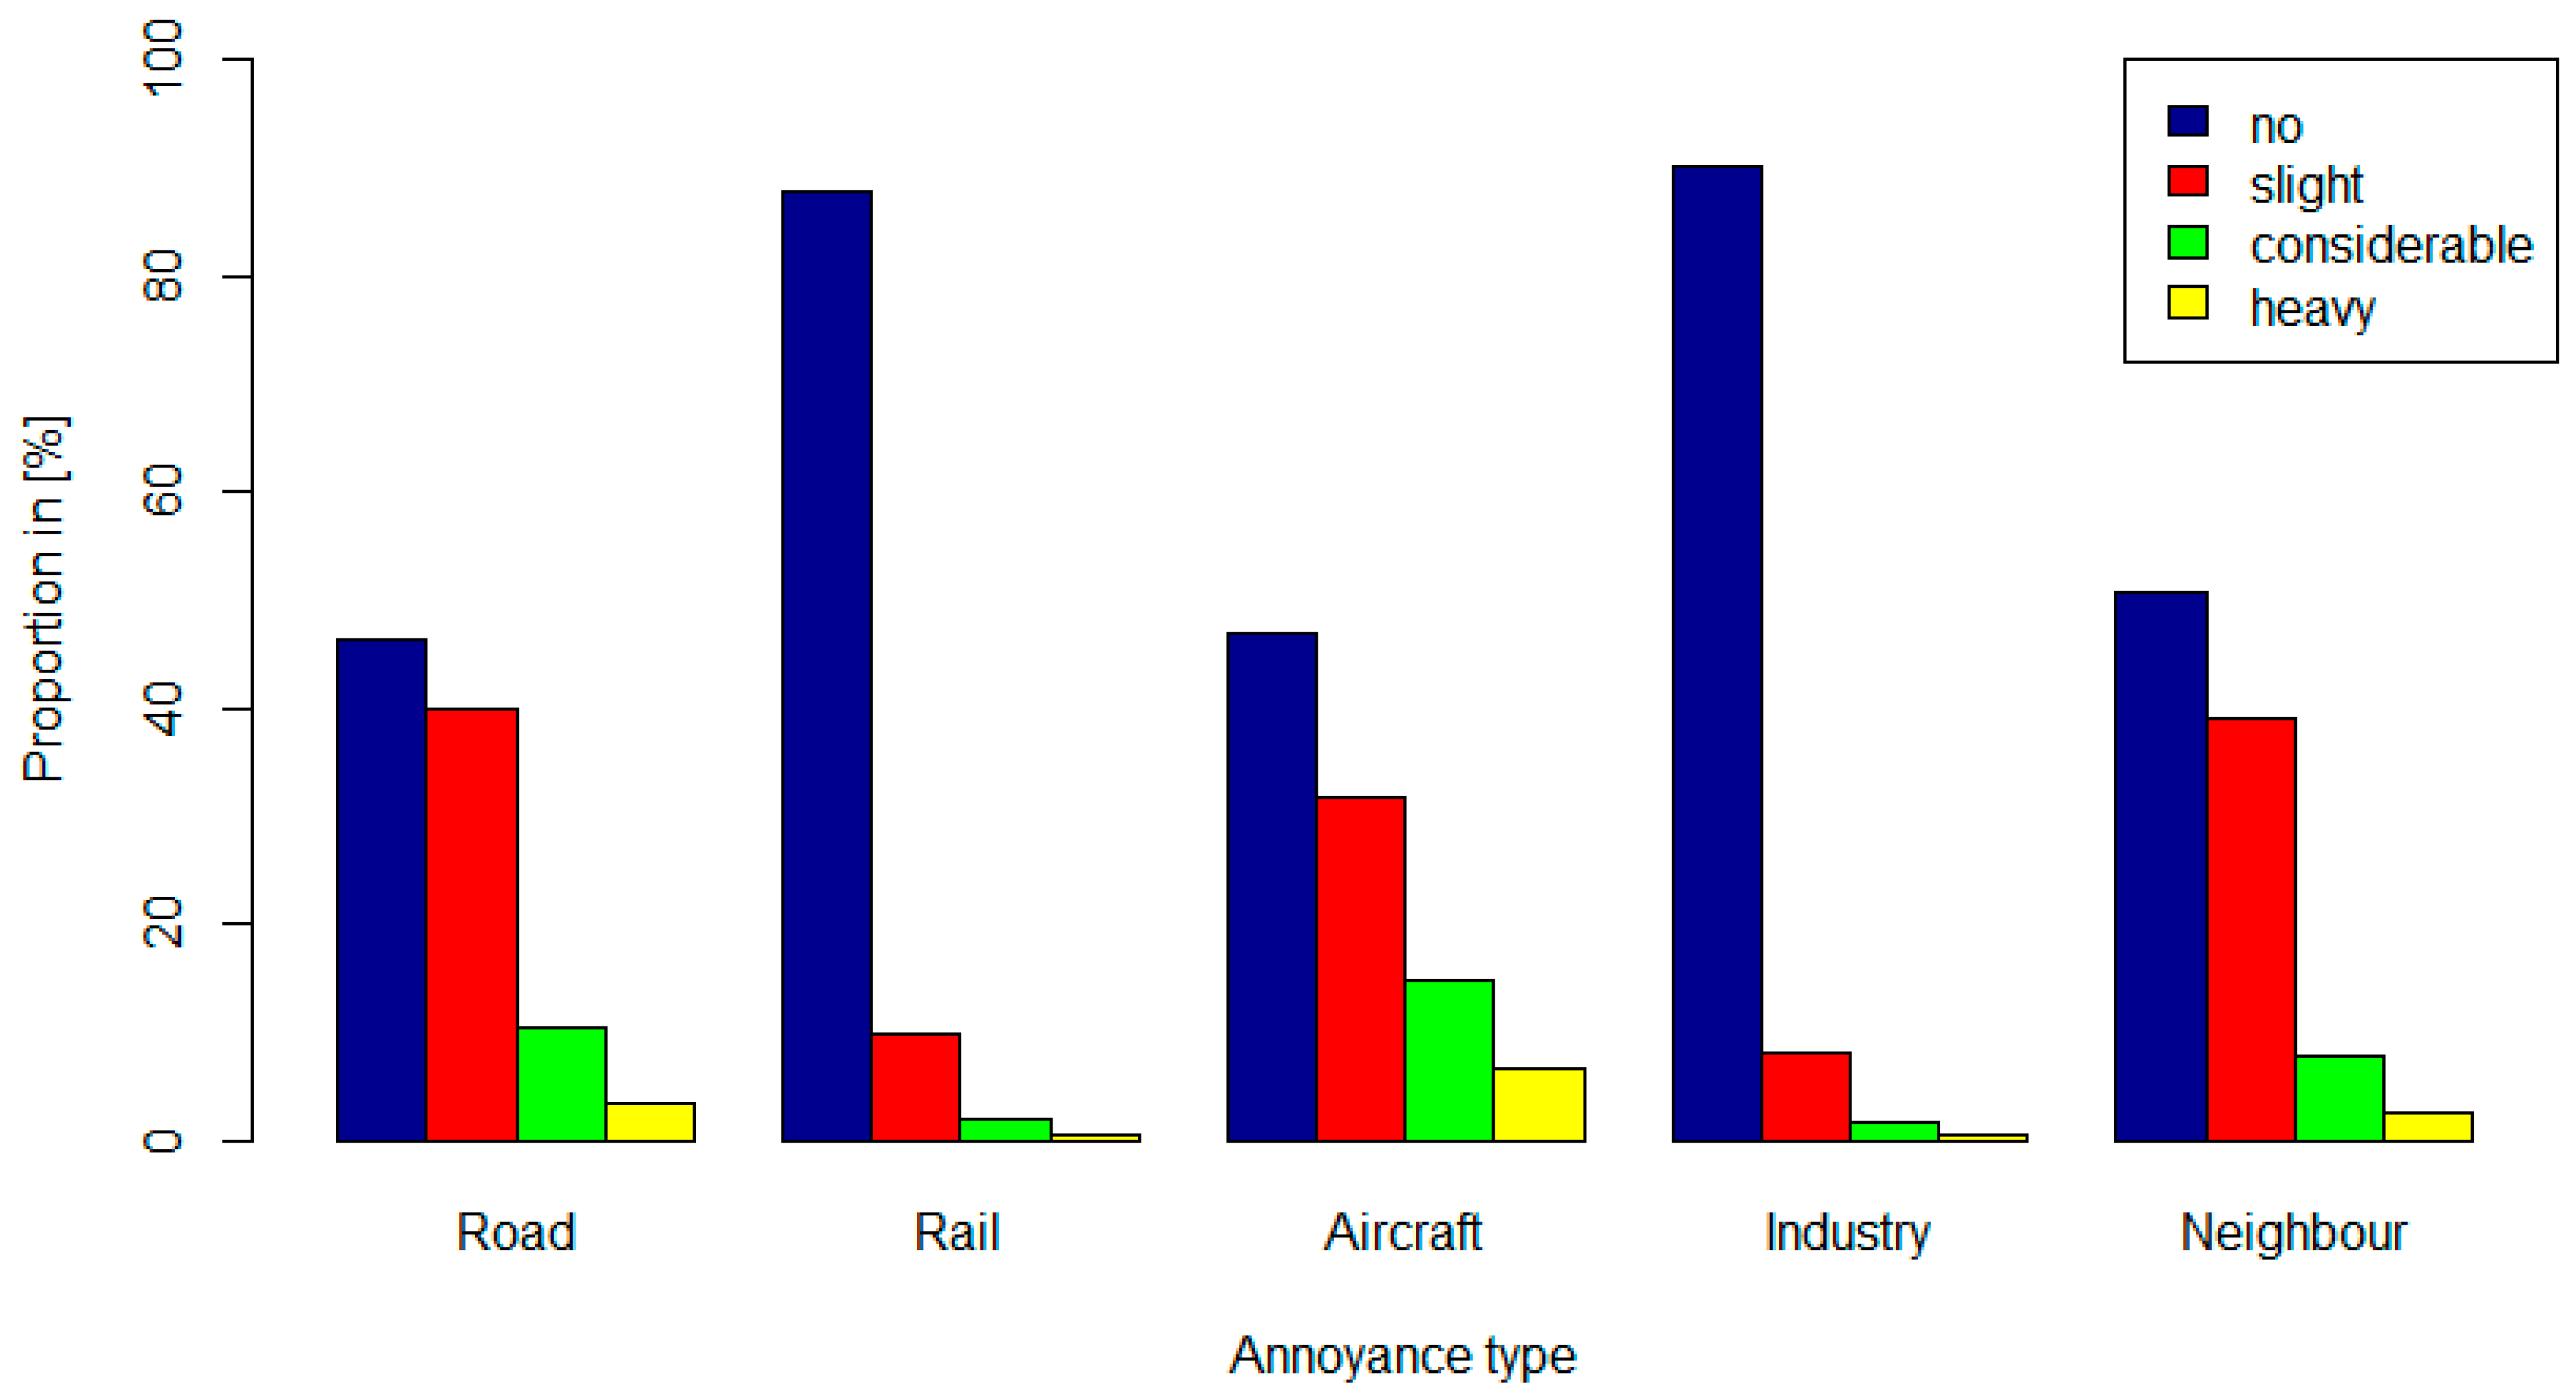
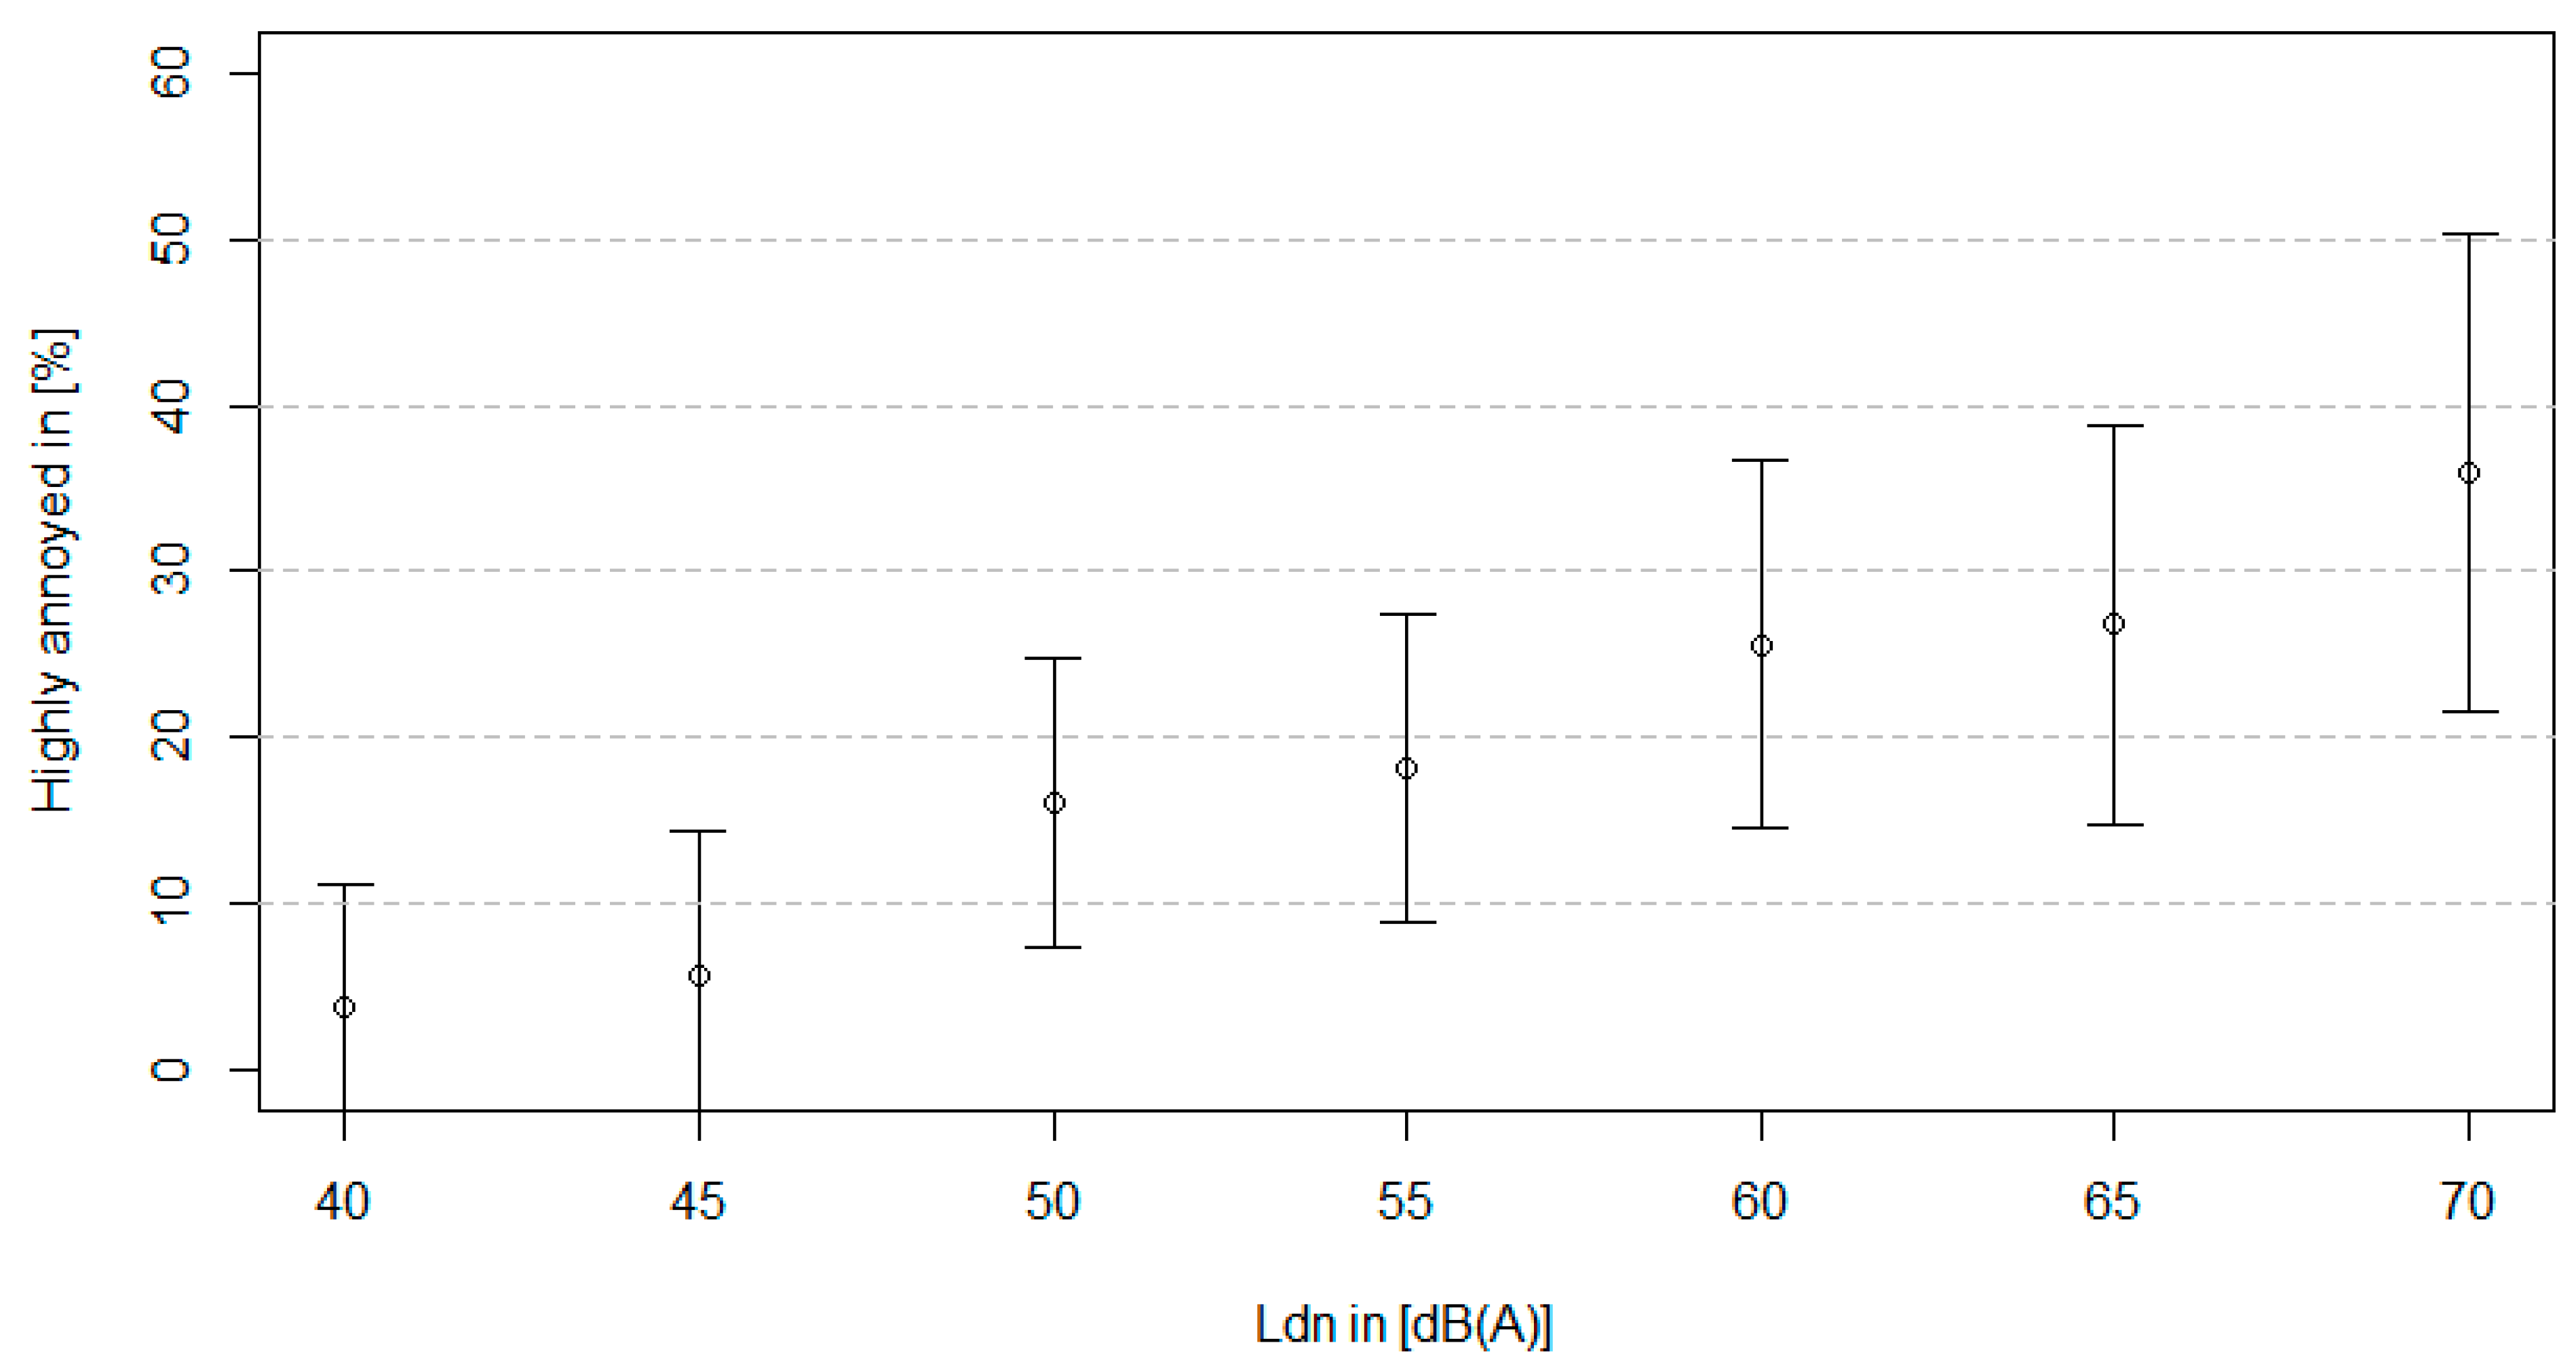
2.2. Noise Annoyance and Noise Exposure
2.3. Statistical Analysis
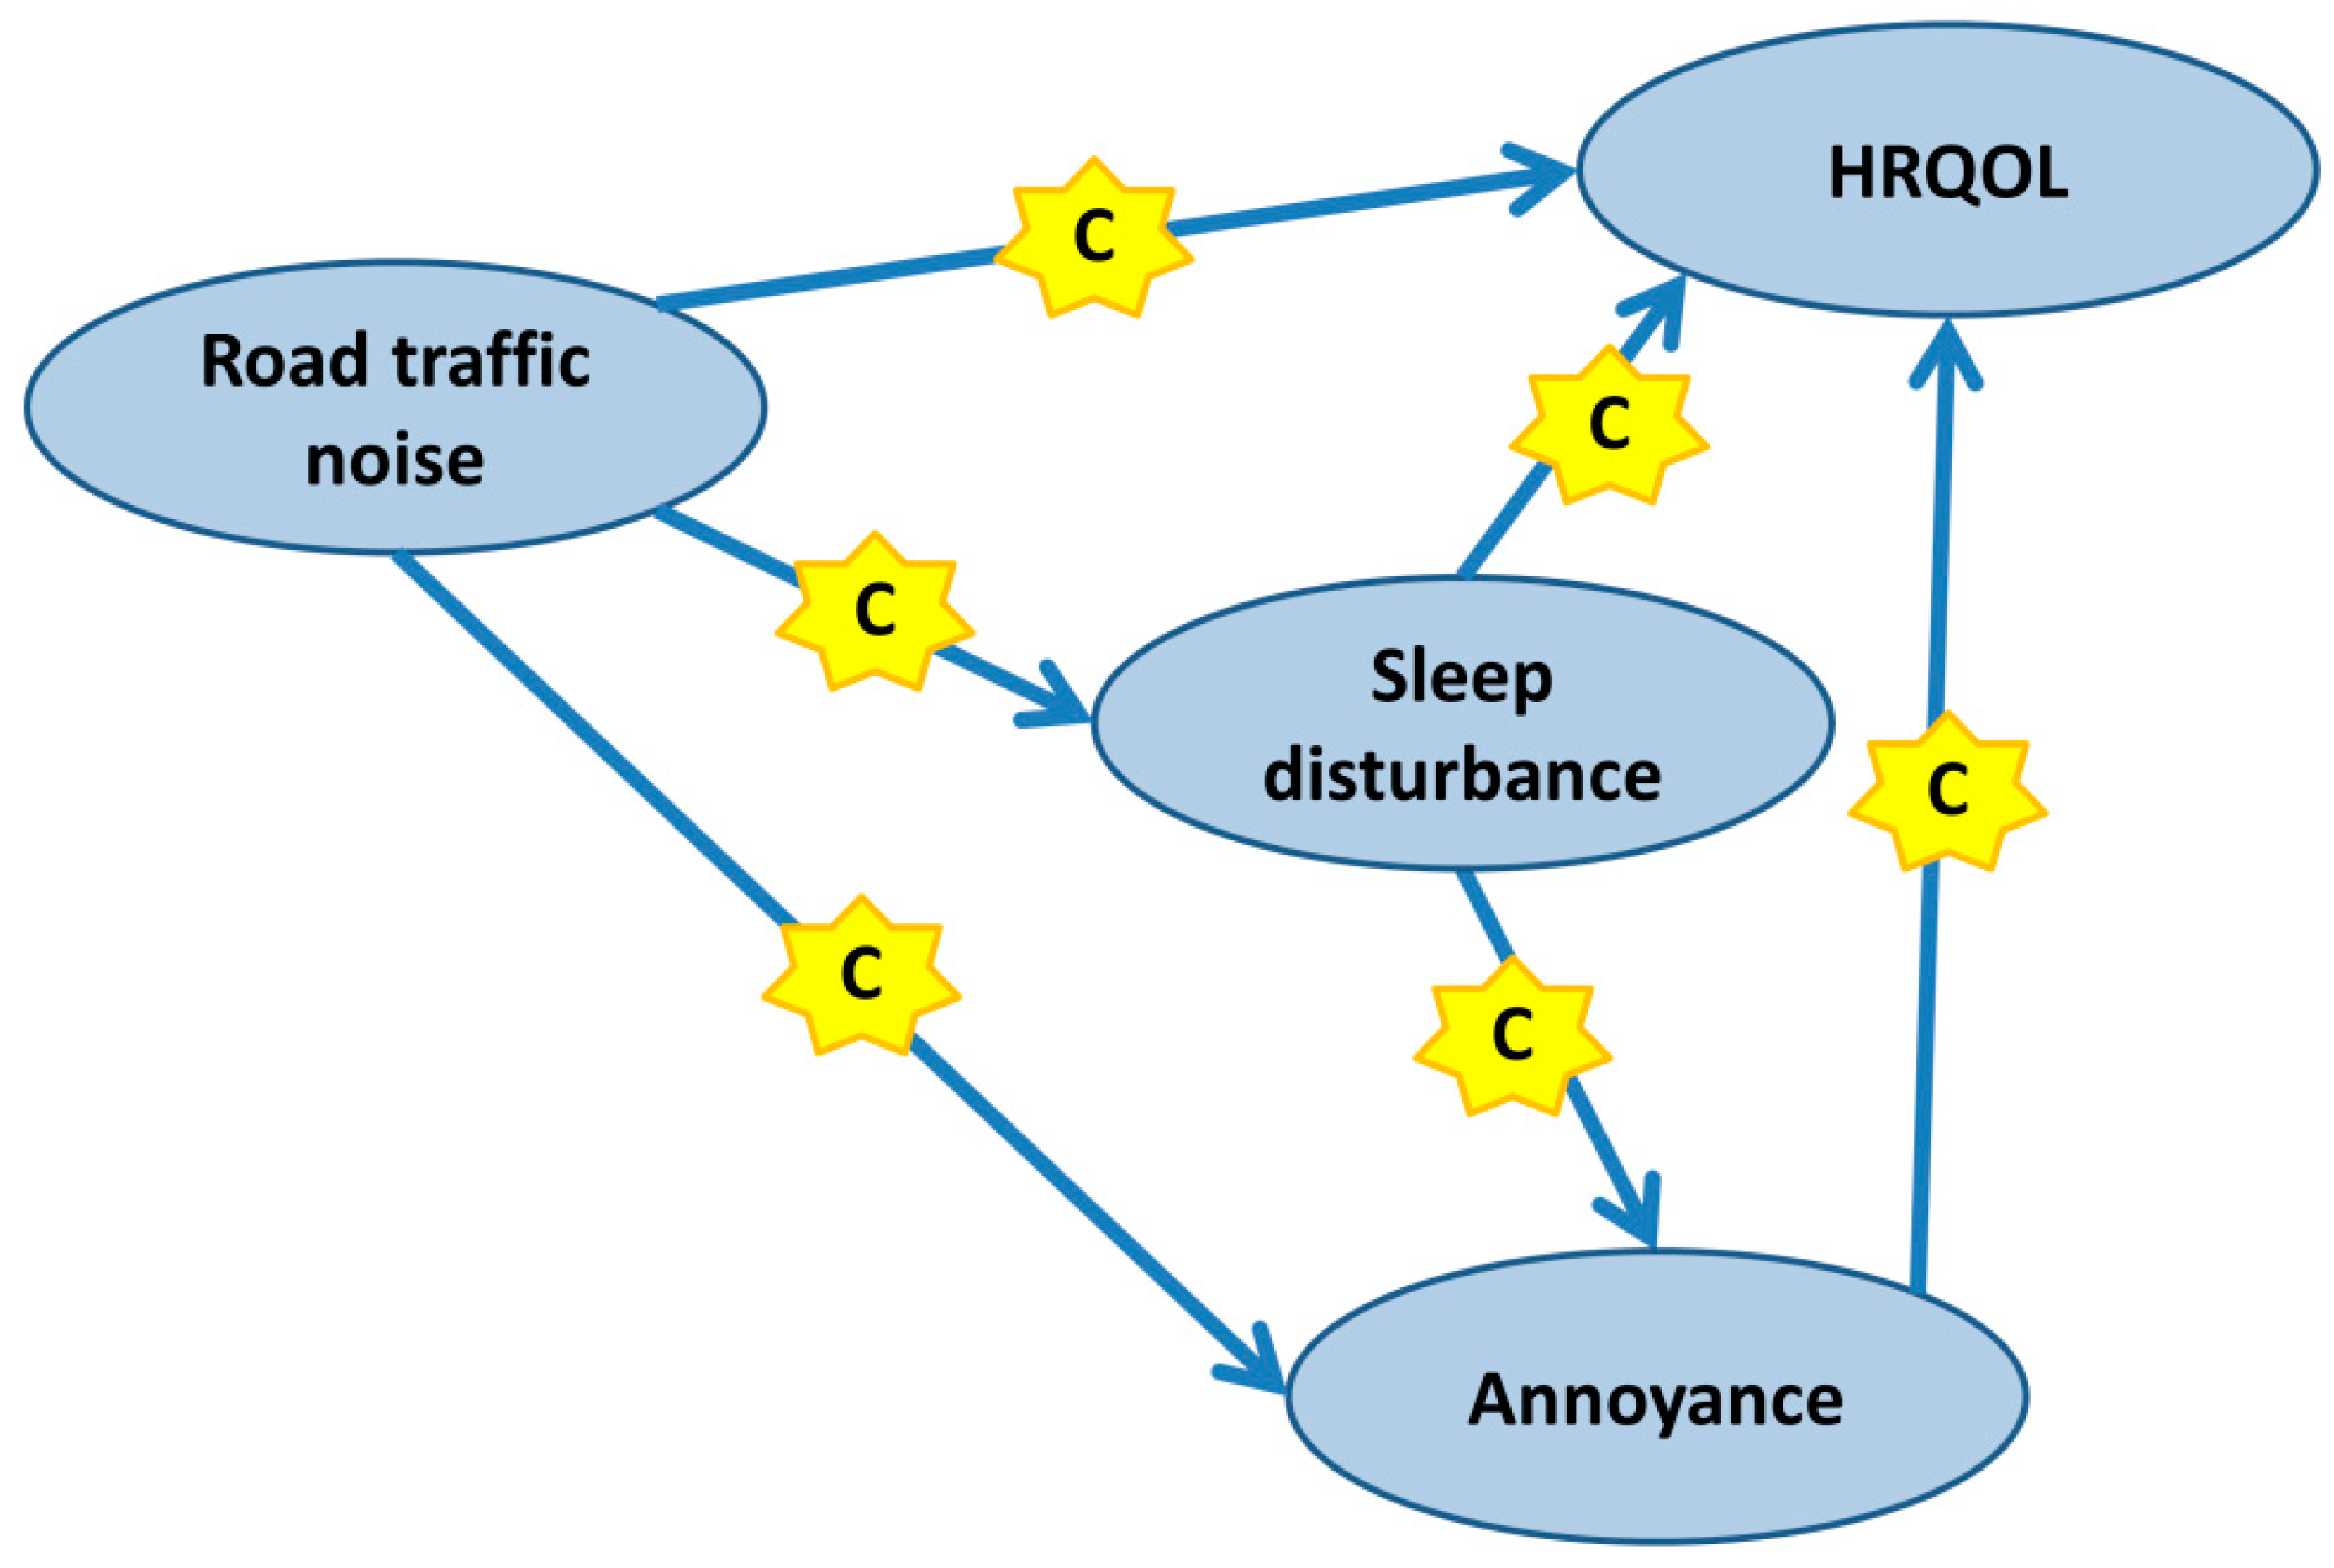
2.4. Structural Equation Model (SEM)

3. Results

| Age Categories | In % |
|---|---|
| 30–34 Years | 13.3 |
| 35–39 Years | 13.5 |
| 40–44 Years | 17.7 |
| 45–49 Years | 17.7 |
| 50–54 Years | 18.0 |
| >55 Years | 19.9 |
| Sex | In % |
| Female | 59.1 |
| Male | 40.9 |
| Educational level | In % |
| Low (primary school) | 5.9 |
| Medium (apprenticeship) | 48.4 |
| High (higher education) | 45.7 |
| Lifestyle characteristics | |
| Mean BMI (SD) | 24.2 (4.2) |
| Smokers (%) | 27.3 |
| Comorbidity * (%) | 11.5 |


| Von Zerssen | β [95% CI] Crude | p-Value | β [95% CI] Adjusted * | p-Value |
|---|---|---|---|---|
| Road traffic noise 10 dB(A) | 0.59 [0.09, 1.09] | 0.02 | 0.47 [−0.01, 0.95] | 0.05 |
| Annoyance road | 1.50 [1.06, 1.94] | <0.001 | 1.53 [1.09, 1.96] | <0.001 |
| Annoyance rail | 1.03 [0.22, 1.84] | 0.01 | 0.84 [0.06, 1.63] | 0.04 |
| Annoyance aircraft | 0.76 [0.35, 1.18] | <0.001 | 0.73 [0.33, 1.14] | <0.001 |
| Annoyance industry | 2.14 [1.30, 2.97] | <0.001 | 2.36 [1.54, 3.17] | <0.001 |
| Annoyance neighbour | 1.61 [1.16, 2.07] | <0.001 | 1.62 [1.17, 2.06] | <0.001 |
| SF-36 Mental Health | β [95% CI] Crude | p−Value | β [95% CI] Adjusted * | p-Value |
| Road traffic noise 10 dB(A) | 0.47 [−0.05, 0.98] | 0.08 | 0.09 [−0.43, 0.61] | 0.73 |
| Annoyance road | 1.16 [0.66, 1.66] | <0.001 | 1.03 [0.54, 1.52] | <0.001 |
| Annoyance rail | 1.49 [0.60, 2.37] | <0.01 | 1.22 [0.34, 2.10] | 0.01 |
| Annoyance aircraft | 0.12 [−0.33, 0.58] | 0.60 | 0.21 [−0.25, 0.67] | 0.37 |
| Annoyance industry | 2.16 [1.22, 3.10] | <0.001 | 2.20 [1.27, 3.12] | <0.001 |
| Annoyance neighbour | 1.47 [0.96, 1.98] | <0.001 | 1.34 [0.83, 1.84] | <0.001 |
| Self-Reported Health Status | OR [95% CI] Crude | p-Value | OR [95% CI] Adjusted * | p-Value |
|---|---|---|---|---|
| Road traffic noise 10 dB(A) | 1.36 [1.19, 1.55] | <0.001 | 1.28 [1.12, 1.48] | <0.001 |
| Annoyance road | 1.52 [1.32, 1.77] | <0.001 | 1.45 [1.25, 1.70] | <0.001 |
| Annoyance rail | 1.22 [0.95, 1.58] | 0.12 | 1.07 [0.83, 1.40] | 0.58 |
| Annoyance aircraft | 0.98 [0.85, 1.13] | 0.78 | 0.99 [0.86, 1.15] | 0.96 |
| Annoyance industry | 1.43 [1.11, 1.88] | 0.01 | 1.28 [0.97, 1.68] | 0.08 |
| Annoyance neighbour | 1.79 [1.52, 2.08] | <0.001 | 1.75 [1.49, 2.08] | <0.001 |

| Relationship | Baseline (n = 1307) | Follow up (n = 1064) | ||
|---|---|---|---|---|
| β [95% CI] | p-Value | β [95% CI] | p-Value | |
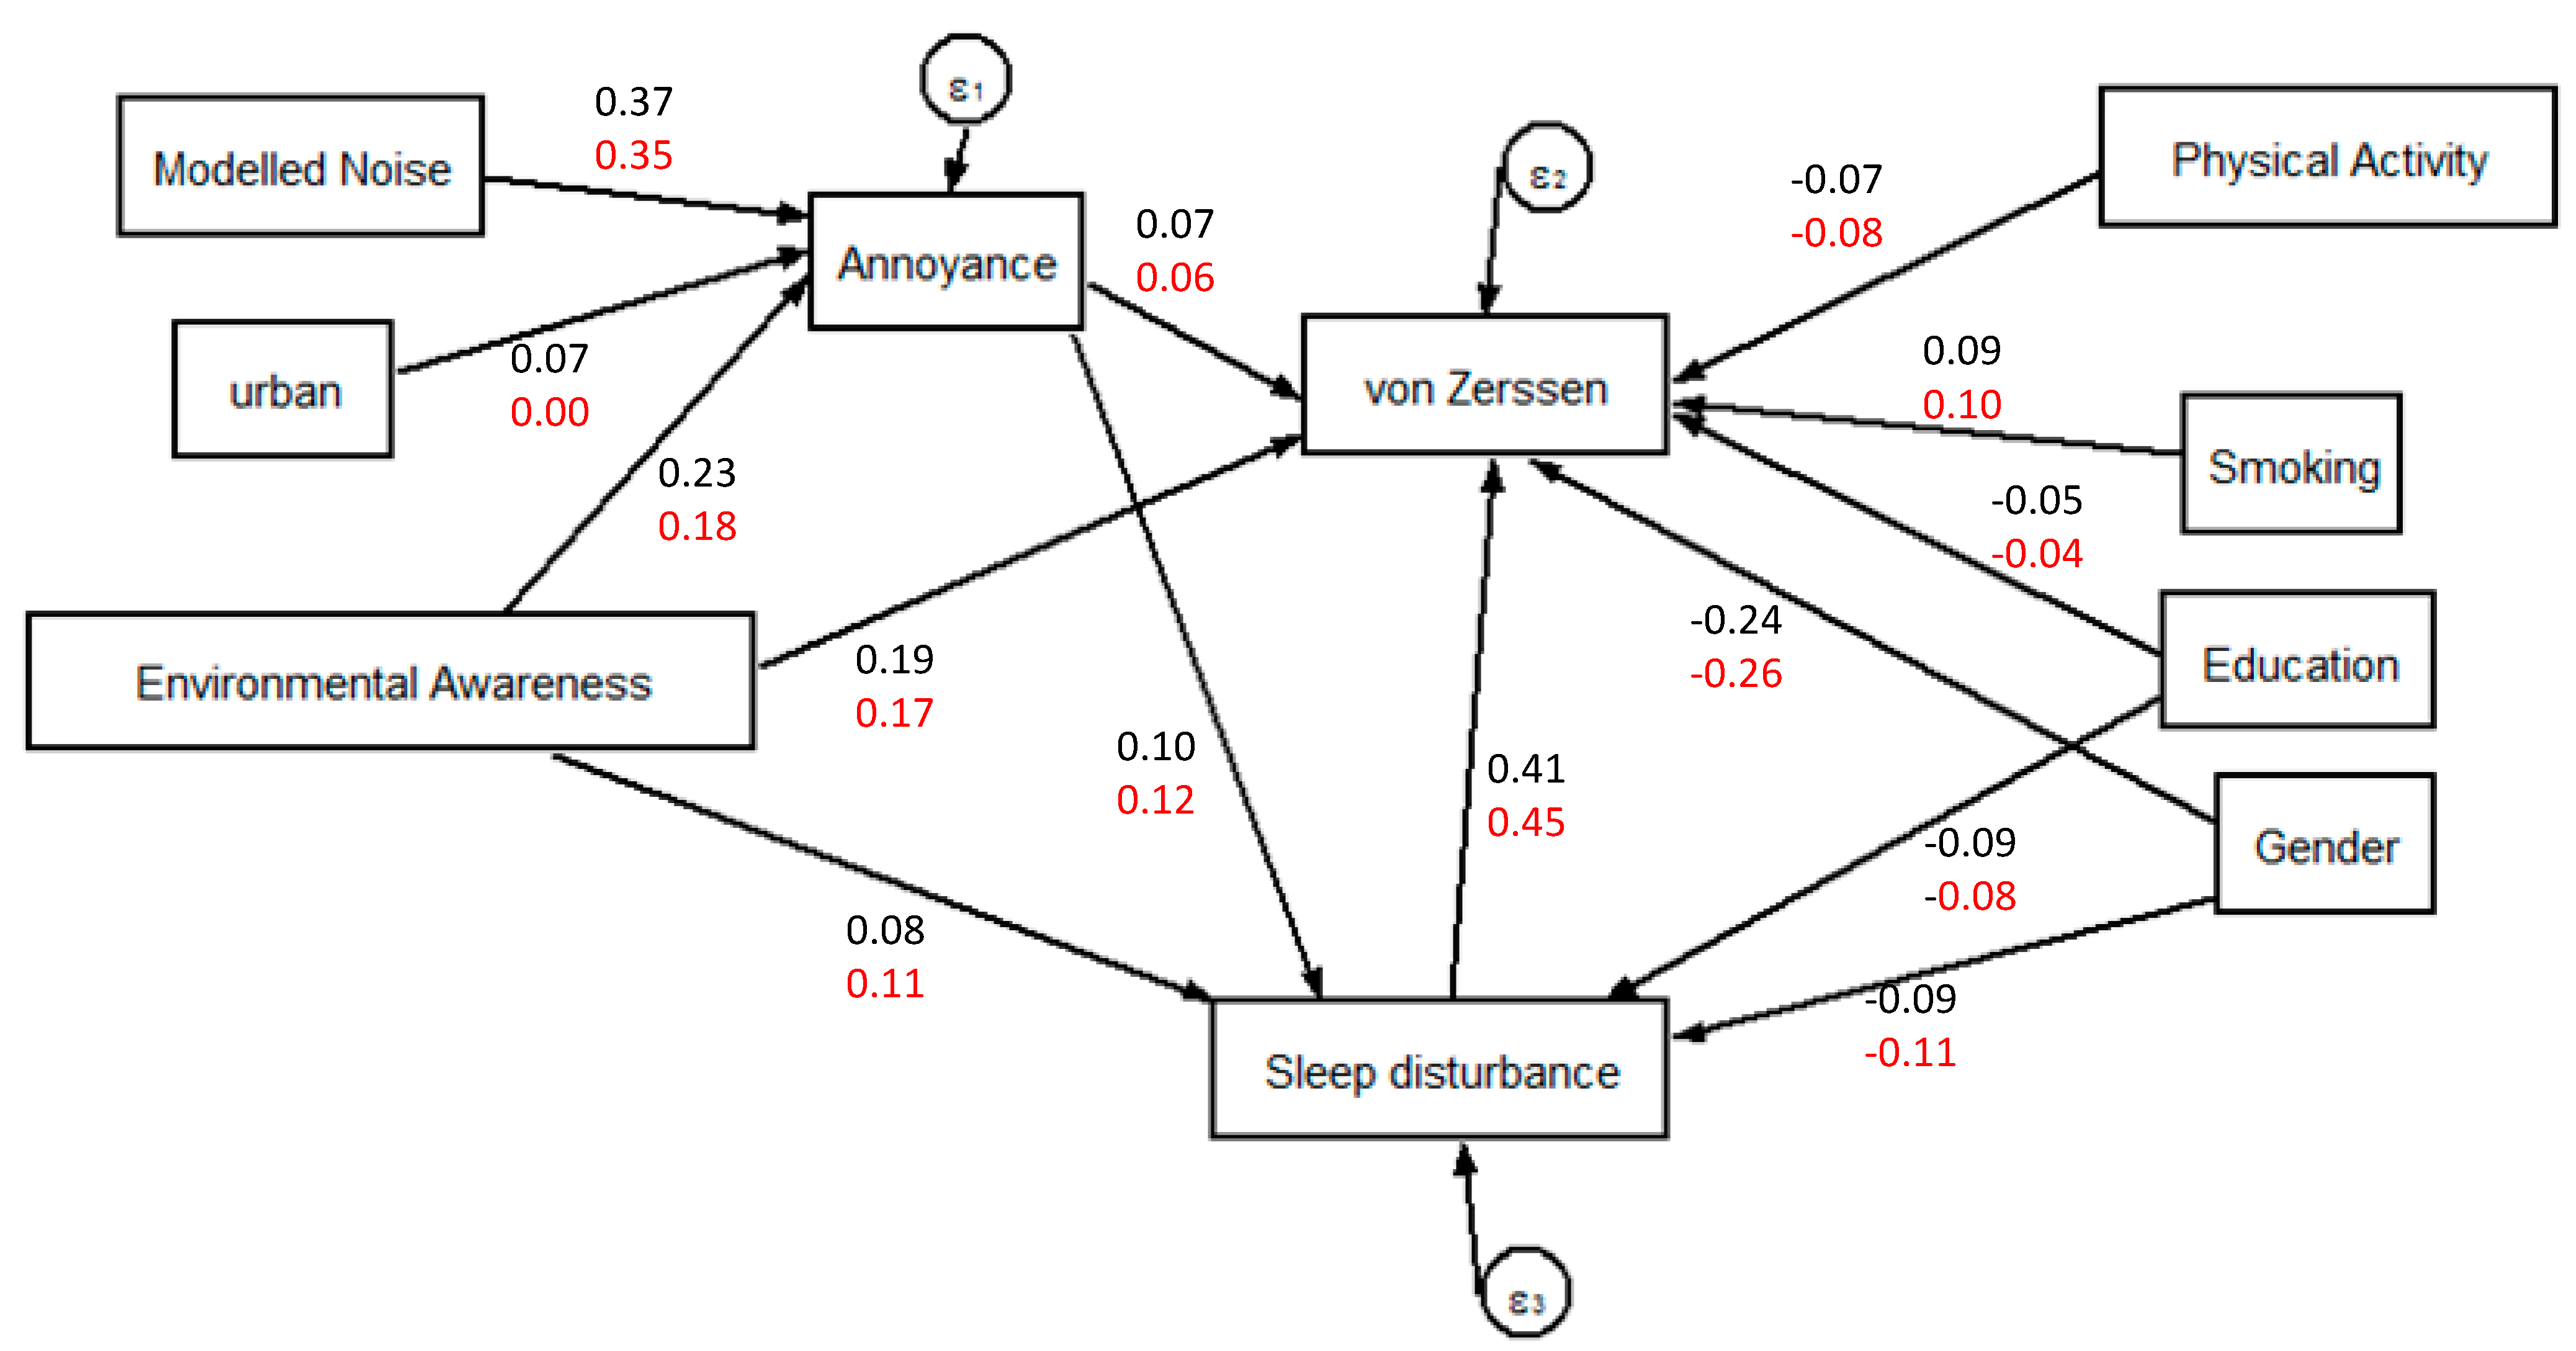
| Direct effects | ||||
| Road traffic noise → Annoyance to road traffic | 0.37 [0.32, 0.42] | <0.001 | 0.35 [0.29, 0.40] | <0.001 |
| Degree of urban → Annoyance to road traffic | 0.07 [0.02, 0.12] | 0.007 | 0.00 [−0.05, 0.06] | 0.929 |
| Environmental Awareness → Annoyance to road traffic | 0.23 [0.18, 0.28] | <0.001 | 0.18 [0.12, 0.23] | <0.001 |
| Annoyance to road traffic → von Zerssen | 0.07 [0.02, 0.11] | 0.003 | 0.06 [0.01, 0.11] | 0.021 |
| Sleep disturbance → von Zerssen | 0.41 [0.36, 0.45] | <0.001 | 0.45 [0.40, 0.50] | <0.001 |
| Environmental Awareness → von Zerssen | 0.19 [0.15, 0.24] | <0.001 | 0.17 [0.12, 0.22] | <0.001 |
| Physical activity → von Zerssen | −0.07 [−0.11, −0.02] | 0.002 | −0.08 [−0.13, −0.03] | 0.003 |
| Smoking → von Zerssen | 0.09 [0.04, 0.13] | <0.001 | 0.10 [0.05, 0.15] | <0.001 |
| Education → von Zerssen | −0.05 [−0.10, −0.01] | 0.022 | −0.04 [−0.09, 0.01] | 0.097 |
| Gender → von Zerssen | −0.24 [−0.28, −0.19] | <0.001 | −0.26 [−0.31, −0.21] | <0.001 |
| Annoyance to road traffic → Sleep disturbance | 0.10 [0.05, 0.15] | <0.001 | 0.12 [0.06, 0.18] | <0.001 |
| Environmental Awareness → Sleep disturbance | 0.08 [0.03, 0.14] | 0.003 | 0.11 [0.05, 0.17] | <0.001 |
| Education → Sleep disturbance | −0.09 [−0.15, −0.04] | 0.001 | −0.08 [−0.14, −0.02] | 0.011 |
| Gender → Sleep disturbance | −0.09 [−0.15, −0.04] | 0.001 | −0.11 [−0.17, −0.05] | <0.001 |
| Indirect effects | ||||
| Annoyance to road traffic → von Zerssen | 0.04 [0.02, 0.06] | <0.001 | 0.05 [0.03, 0.08] | <0.001 |
| Road traffic noise → von Zerssen | 0.04 [0.02, 0.06] | <0.001 | 0.04 [0.02, 0.06] | <0.001 |
| Degree of urban → von Zerssen | 0.01 [0.00, 0.01] | 0.022 | 0.00 [−0.01, 0.01] | 0.929 |
| Environmental Awareness → von Zerssen | 0.06 [0.03, 0.08] | <0.001 | 0.07 [0.04, 0.10] | <0.001 |
| Education → von Zerssen | −0.04 [−0.06, −0.01] | 0.001 | −0.03 [−0.06, −0.01] | 0.011 |
| Gender → von Zerssen | −0.04 [−0.06, −0.01] | 0.001 | −0.05 [−0.08, −0.02] | <0.001 |
| Road traffic noise → Sleep disturbance | 0.04 [0.02, 0.06] | <0.001 | 0.04 [0.02, 0.06] | <0.001 |
| Degree of urban → Sleep disturbance | 0.01 [0.00, 0.01] | 0.031 | 0.00 [−0.01, 0.01] | 0.929 |
| Environmental Awareness → Sleep disturbance | 0.02 [0.01, 0.04] | 0.001 | 0.02 [0.01, 0.03] | 0.001 |
| Model fit indices | Baseline | Follow up | ||
| χ2 | 3.62 | 13.42 | ||
| p-value χ2 | 0.963 | 0.201 | ||
| RMSEA | 0.000 | 0.018 | ||
| AIC | 36278 | 28878 | ||
| Tucker-Lewis | 1.017 | 0.989 | ||
| SRMR | 0.006 | 0.014 | ||

| Relationship | Baseline | Follow_up | ||
|---|---|---|---|---|
| β [95% CI] | p-Value | β [95% CI] | p-Value | |
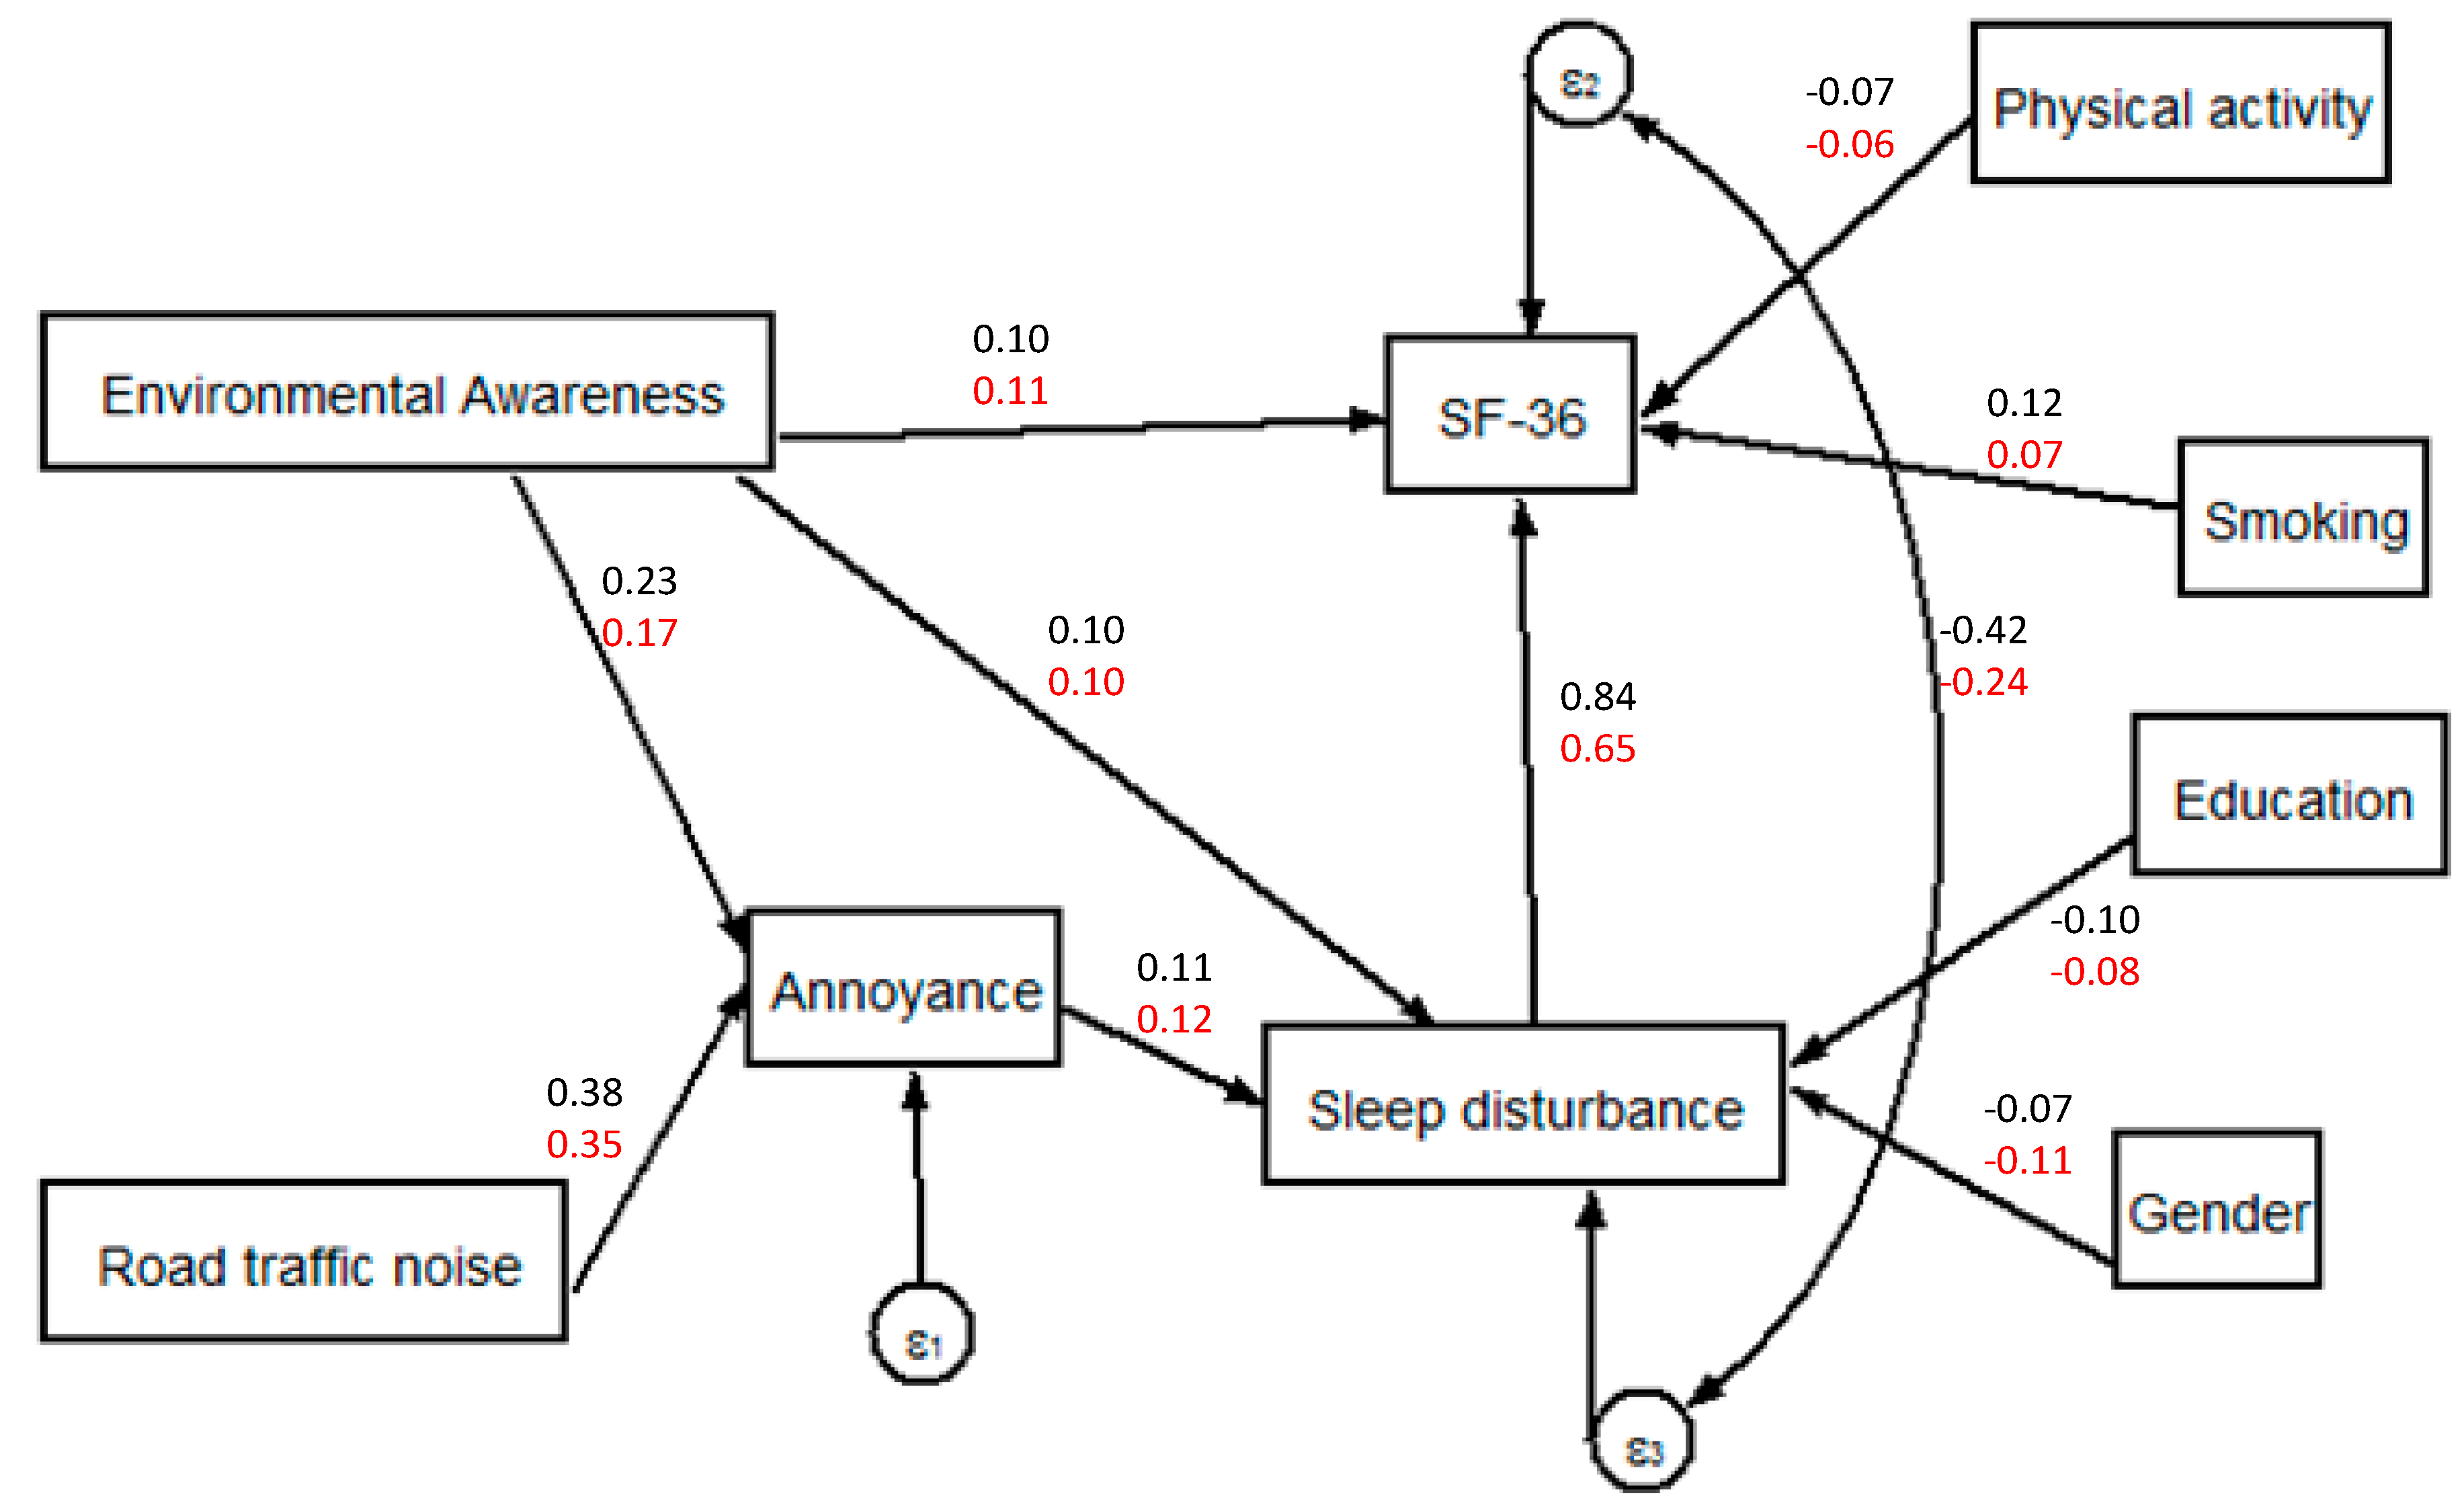
| Direct effects | ||||
| Road traffic noise → Annoyance to road traffic | 0.38 [0.33, 0.43] | <0.001 | 0.35 [0.30, 0.41] | <0.001 |
| Environmental Awareness → Annoyance to road traffic | 0.23 [0.18, 0.28] | <0.001 | 0.17 [0.12, 0.22] | <0.001 |
| Sleep disturbance → SF-36 | 0.84 [0.54, 1.14] | <0.001 | 0.65 [0.35, 0.95] | <0.001 |
| Environmental Awareness → SF-36 | 0.10 [0.04, 0.17] | 0.003 | 0.11 [0.04, 0.18] | 0.002 |
| Physical activity → SF-36 | −0.07 [−0.11, −0.02] | 0.004 | −0.06 [−0.12, −0.01] | 0.025 |
| Smoking → SF-36 | 0.12 [0.08, 0.17] | <0.001 | 0.07 [0.02, 0.13] | 0.011 |
| Annoyance to road traffic → Sleep disturbance | 0.11 [0.06, 0.16] | <0.001 | 0.12 [0.06, 0.18] | <0.001 |
| Environmental Awareness → Sleep disturbance | 0.10 [0.04, 0.15] | <0.001 | 0.10 [0.05, 0.16] | <0.001 |
| Education → Sleep disturbance | −0.10 [−0.15, −0.05] | <0.001 | −0.08 [−0.14, −0.02] | 0.007 |
| Gender → Sleep disturbance | −0.07 [−0.12, −0.02] | 0.007 | −0.11 [−0.17, −0.06] | <0.001 |
| Indirect effects | ||||
| Annoyance to road traffic → SF-36 | 0.09 [0.05, 0.14] | <0.001 | 0.08 [0.04, 0.12] | <0.001 |
| Road traffic noise → SF-36 | 0.04 [0.02, 0.06] | <0.001 | 0.03 [0.01, 0.05] | 0.001 |
| Environmental Awareness → SF-36 | 0.10 [0.04, 0.17] | 0.001 | 0.08 [0.03, 0.13] | 0.003 |
| Education → SF-36 | −0.09 [−0.13, −0.04] | <0.001 | −0.05 [−0.09, −0.01] | 0.015 |
| Gender → SF-36 | −0.06 [−0.1, −0.02] | 0.006 | −0.07 [−0.12, −0.03] | 0.002 |
| Road traffic noise → Sleep disturbance | 0.04 [0.02, 0.06] | <0.001 | 0.04 [0.02, 0.07] | <0.001 |
| Environmental Awareness → Sleep disturbance | 0.03 [0.01, 0.04] | <0.001 | 0.02 [0.01, 0.03] | 0.001 |
| Model fit indices | ||||
| χ2 | 3.724 | 10.094 | ||
| p-value χ2 | 0.959 | 0.432 | ||
| RMSEA | 0.000 | 0.003 | ||
| AIC | 33991 | 26379 | ||
| Tucker-Lewis | 1.018 | 1.000 | ||
| SRMR | 0.006 | 0.012 | ||
4. Discussion
5. Conclusions
Acknowledgments
Author Contributions
Conflicts of Interest
References
- Bluhm, G.; Nordling, E.; Berglind, N. Road traffic noise and annoyance—An increasing environmental health problem. Noise Health 2004, 6, 43–49. [Google Scholar] [PubMed]
- Öhrström, E.; Skånberg, A.; Svensson, H.; Gidlöf-Gunnarsson, A. Effects of road traffic noise and the benefit of access to quietness. J. Sound Vib. 2006, 295, 40–59. [Google Scholar] [CrossRef]
- Brink, M.; Wunderli, J.-M. A field study of the exposure-annoyance relationship of military shooting noise. J. Acoust. Soc. Am. 2010, 127, 2301–2311. [Google Scholar] [CrossRef] [PubMed]
- Miedema, H.; Oudshoorn, C. Annoyance from transportation noise: Relationships with exposure metrics DNL and DENL and their confidence intervals. Environ. Health Perspect. 2001, 109, 409–416. [Google Scholar] [CrossRef] [PubMed]
- Miedema, H.M.; Vos, H. Exposure-response relationships for transportation noise. J. Acoust. Soc. Am. 1998, 104, 3432–3445. [Google Scholar] [CrossRef] [PubMed]
- WHO. Burden of Disease from Environmental Noise; WHO: Bonn, Germany, 2011. [Google Scholar]
- Öhrström, E. Longitudinal surveys on effects of changes in road traffic noise—Annoyance, activity disturbances, and psycho-social well-being. J. Acoust. Soc. Am. 2004, 115, 719–729. [Google Scholar] [PubMed]
- Schreckenberg, D.; Meis, M.; Kahl, C.; Peschel, C.; Eikmann, T. Aircraft noise and quality of life around Frankfurt Airport. Int. J. Environ. Res. Public Health 2010, 7, 3382–3405. [Google Scholar] [PubMed]
- Dratva, J.; Zemp, E.; Dietrich, D.F.; Bridevaux, P.-O.; Rochat, T.; Schindler, C.; Gerbase, M.W. Impact of road traffic noise annoyance on health-related quality of life: Results from a population-based study. Qual. Life Res. 2010, 19, 37–46. [Google Scholar] [CrossRef] [PubMed]
- Stallen, P. A theoretical framework for environmental noise annoyance. Noise Health 1999, 1, 69–80. [Google Scholar] [PubMed]
- Soames Job, R. Noise sensitivity as a factor influencing human reaction to noise. Noise Health 1999, 1, 57–68. [Google Scholar] [PubMed]
- Frei, P.; Mohler, E.; Röösli, M. Effect of nocturnal road traffic noise exposure and annoyance on objective and subjective sleep quality. Int. J. Hyg. Environ. Health 2014, 217, 188–195. [Google Scholar] [CrossRef] [PubMed]
- Fyhri, A.; Aasvang, G.M. Noise, sleep and poor health: Modeling the relationship between road traffic noise and cardiovascular problems. Sci. Total Environ. 2010, 408, 4935–4942. [Google Scholar] [CrossRef] [PubMed]
- Fyhri, A.; Klæboe, R. Road traffic noise, sensitivity, annoyance and self-reported health—A structural equation model exercise. Environ. Int. 2009, 35, 91–97. [Google Scholar] [CrossRef] [PubMed]
- Kroesen, M.; Molin, E.J.; van Wee, B. Testing a theory of aircraft noise annoyance: A structural equation analysis. J. Acoust. Soc. Am. 2008, 123, 4250–4260. [Google Scholar] [CrossRef] [PubMed]
- Sørensen, M.; Andersen, Z.J.; Nordsborg, R.B.; Becker, T.; Tjønneland, A.; Overvad, K.; Raaschou-Nielsen, O. Long-term exposure to road traffic noise and incident diabetes: A cohort study. Environ. Health Perspect. 2013, 121, 217–222. [Google Scholar] [PubMed]
- Röösli, M.; Mohler, E.; Frei, P.; Vienneau, D. Noise-related sleep disturbances: Does gender matter? Noise Health 2014, 16, 197–204. [Google Scholar] [CrossRef] [PubMed]
- Frei, P.; Mohler, E.; Braun-Fahrländer, C.; Fröhlich, J.; Neubauer, G.; Röösli, M. Cohort study on the effects of everyday life radio frequency electromagnetic field exposure on non-specific symptoms and tinnitus. Environ. Int. 2012, 38, 29–36. [Google Scholar] [CrossRef] [PubMed] [Green Version]
- Mohler, E.; Frei, P.; Braun-Fahrländer, C.; Fröhlich, J.; Neubauer, G.; Röösli, M. Effects of everyday radiofrequency electromagnetic-field exposure on sleep quality: A cross-sectional study. Radiat. Res. 2010, 174, 347–356. [Google Scholar] [CrossRef] [PubMed]
- Eurostat. European Health Interview Survey (EHIS wave 2). In Methodological Manual; Publications Office of the European Union: Luxembourg, Luxembourg, 2013. [Google Scholar]
- Von Zerssen, D.; Petermann, F. B-LR—Beschwerden-Liste—Revidierte Fassung; Hogrefe: Göttingen, Germany, 2011. [Google Scholar]
- Ware, J.E.; Kosinski, M.; Dewey, J.E.; Gandek, B. SF-36 Health Survey: Manual and Interpretation Guide; Quality Metric Inc.: Montréal, Canada, 2000. [Google Scholar]
- SFSO. Swiss Health Survey 2007; SFSO: Neuchâtel, Switzerland, 2012. [Google Scholar]
- Wirth, K.; Brink, M.; Rometsch, R.; Schierz, C. Lärmstudie 2000 Zusammenfassung; Zentrum für Organisations-und Arbeistswissenschaften ETH: Zürich, Switzerland, 2005. [Google Scholar]
- Höin, R.; Ingold, K.; Köpfli, M.; Minder, T. SonBase—Die GIS-Lärmdatenbank der Schweiz. Grundlagen. In Umwelt-Wissen Nr. 0908; Bundesamt für Umwelt BAFU: Bern, Switzerland, 2009. [Google Scholar]
- Karipidis, I.; Vienneau, D.; Habermacher, M.; Köpfli, M.; Brink, M.; Probst-Hensch, N.; Röösli, M.; Wunderli, J.-M. Reconstruction of historical noise exposure data for environmental epidemiology in Switzerland withing the SiRENE project. Noise Mapp. 2014, 1, 3–14. [Google Scholar]
- Noise Abatement Ordinance of 15 December 1986. Available online: http://www.admin.ch/opc/en/classified-compilation/19860372/index.html (accessed on 1 December 2014).
- Kannapin, O.; Pawlik, K.; Zinn, F. The pattern of variables predicting self-reported environmental behavior. Z. Exp. Psychol. 1997, 45, 365–377. [Google Scholar]
- Stansfeld, S.A. Noise, noise sensitivity and psychiatric disorder: Epidemiological and psychophysiological studies. Psychol. Med. Monogr. Suppl. 1992, 22, 1–44. [Google Scholar] [CrossRef] [PubMed]
- BAZL. Lärmbelastungskataster Landesflughafen Basel-Mulhouse. In Zivilluftfahrt; Bundesamt für Zivilluftfahrt BAZL: Bern, Switzerland, 2009. [Google Scholar]
© 2014 by the authors; licensee MDPI, Basel, Switzerland. This article is an open access article distributed under the terms and conditions of the Creative Commons Attribution license (http://creativecommons.org/licenses/by/4.0/).
Share and Cite
Héritier, H.; Vienneau, D.; Frei, P.; Eze, I.C.; Brink, M.; Probst-Hensch, N.; Röösli, M. The Association between Road Traffic Noise Exposure, Annoyance and Health-Related Quality of Life (HRQOL). Int. J. Environ. Res. Public Health 2014, 11, 12652-12667. https://doi.org/10.3390/ijerph111212652
Héritier H, Vienneau D, Frei P, Eze IC, Brink M, Probst-Hensch N, Röösli M. The Association between Road Traffic Noise Exposure, Annoyance and Health-Related Quality of Life (HRQOL). International Journal of Environmental Research and Public Health. 2014; 11(12):12652-12667. https://doi.org/10.3390/ijerph111212652
Chicago/Turabian StyleHéritier, Harris, Danielle Vienneau, Patrizia Frei, Ikenna C. Eze, Mark Brink, Nicole Probst-Hensch, and Martin Röösli. 2014. "The Association between Road Traffic Noise Exposure, Annoyance and Health-Related Quality of Life (HRQOL)" International Journal of Environmental Research and Public Health 11, no. 12: 12652-12667. https://doi.org/10.3390/ijerph111212652