Addressing Health Disparities in Chronic Kidney Disease

 ,
,
Abstract
:1. Introduction
2. Methods
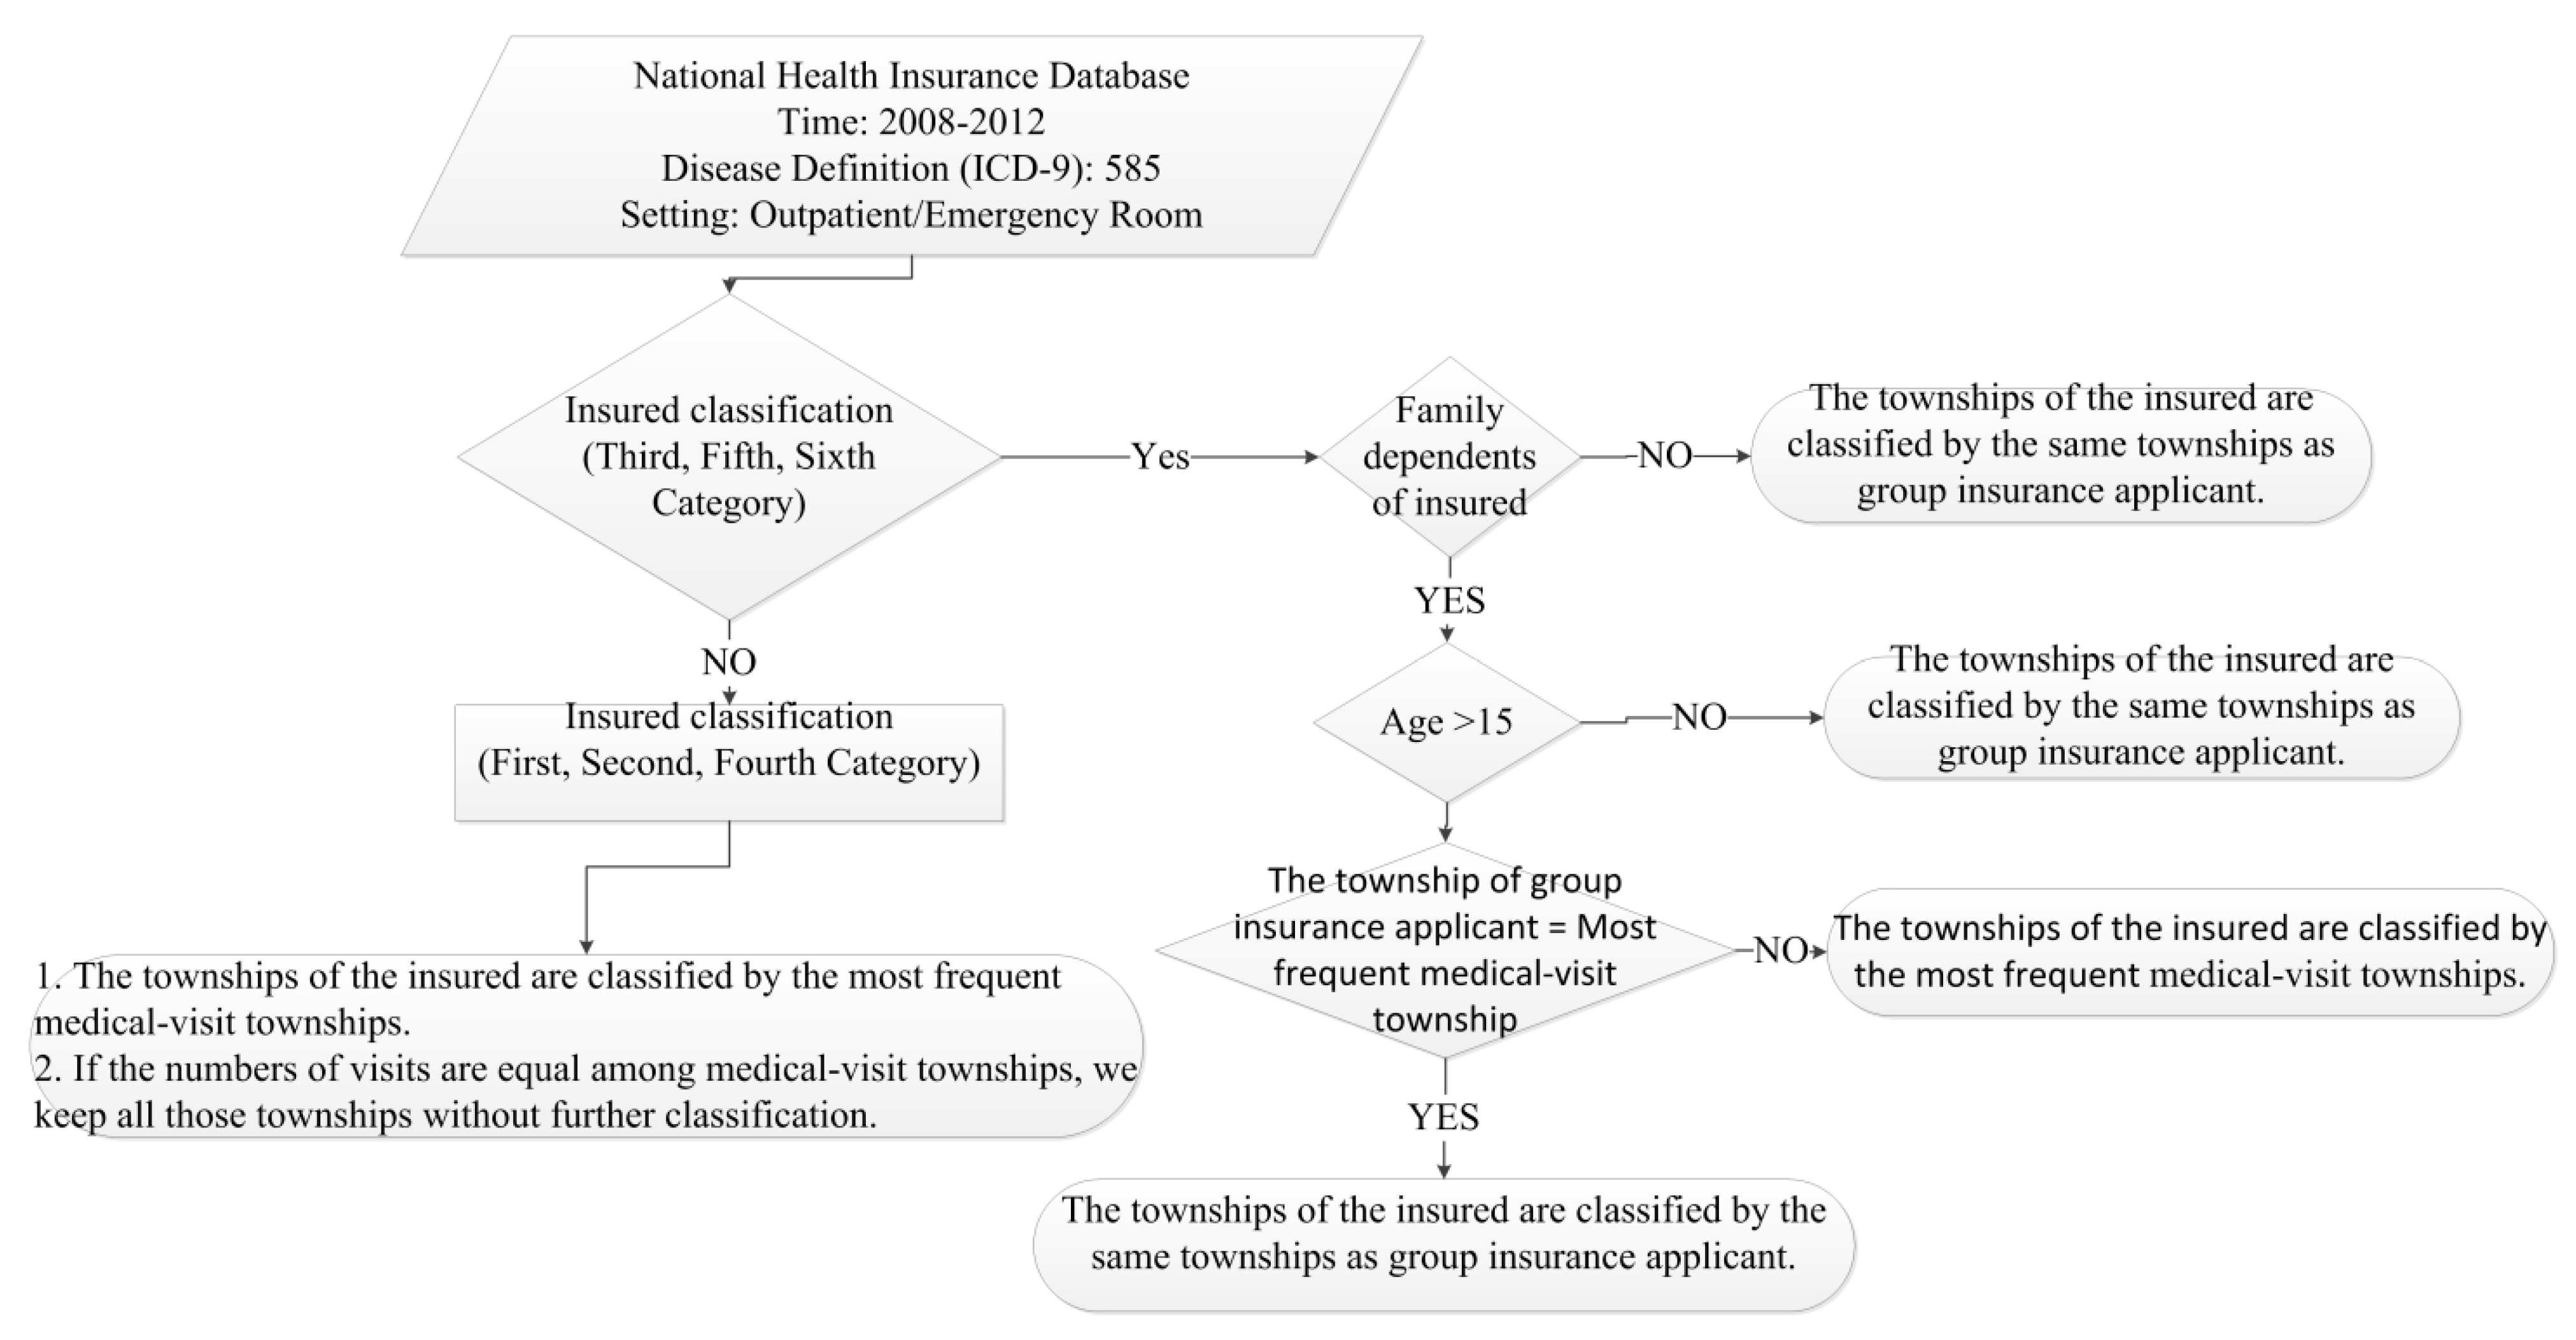
2.1. Data Collection
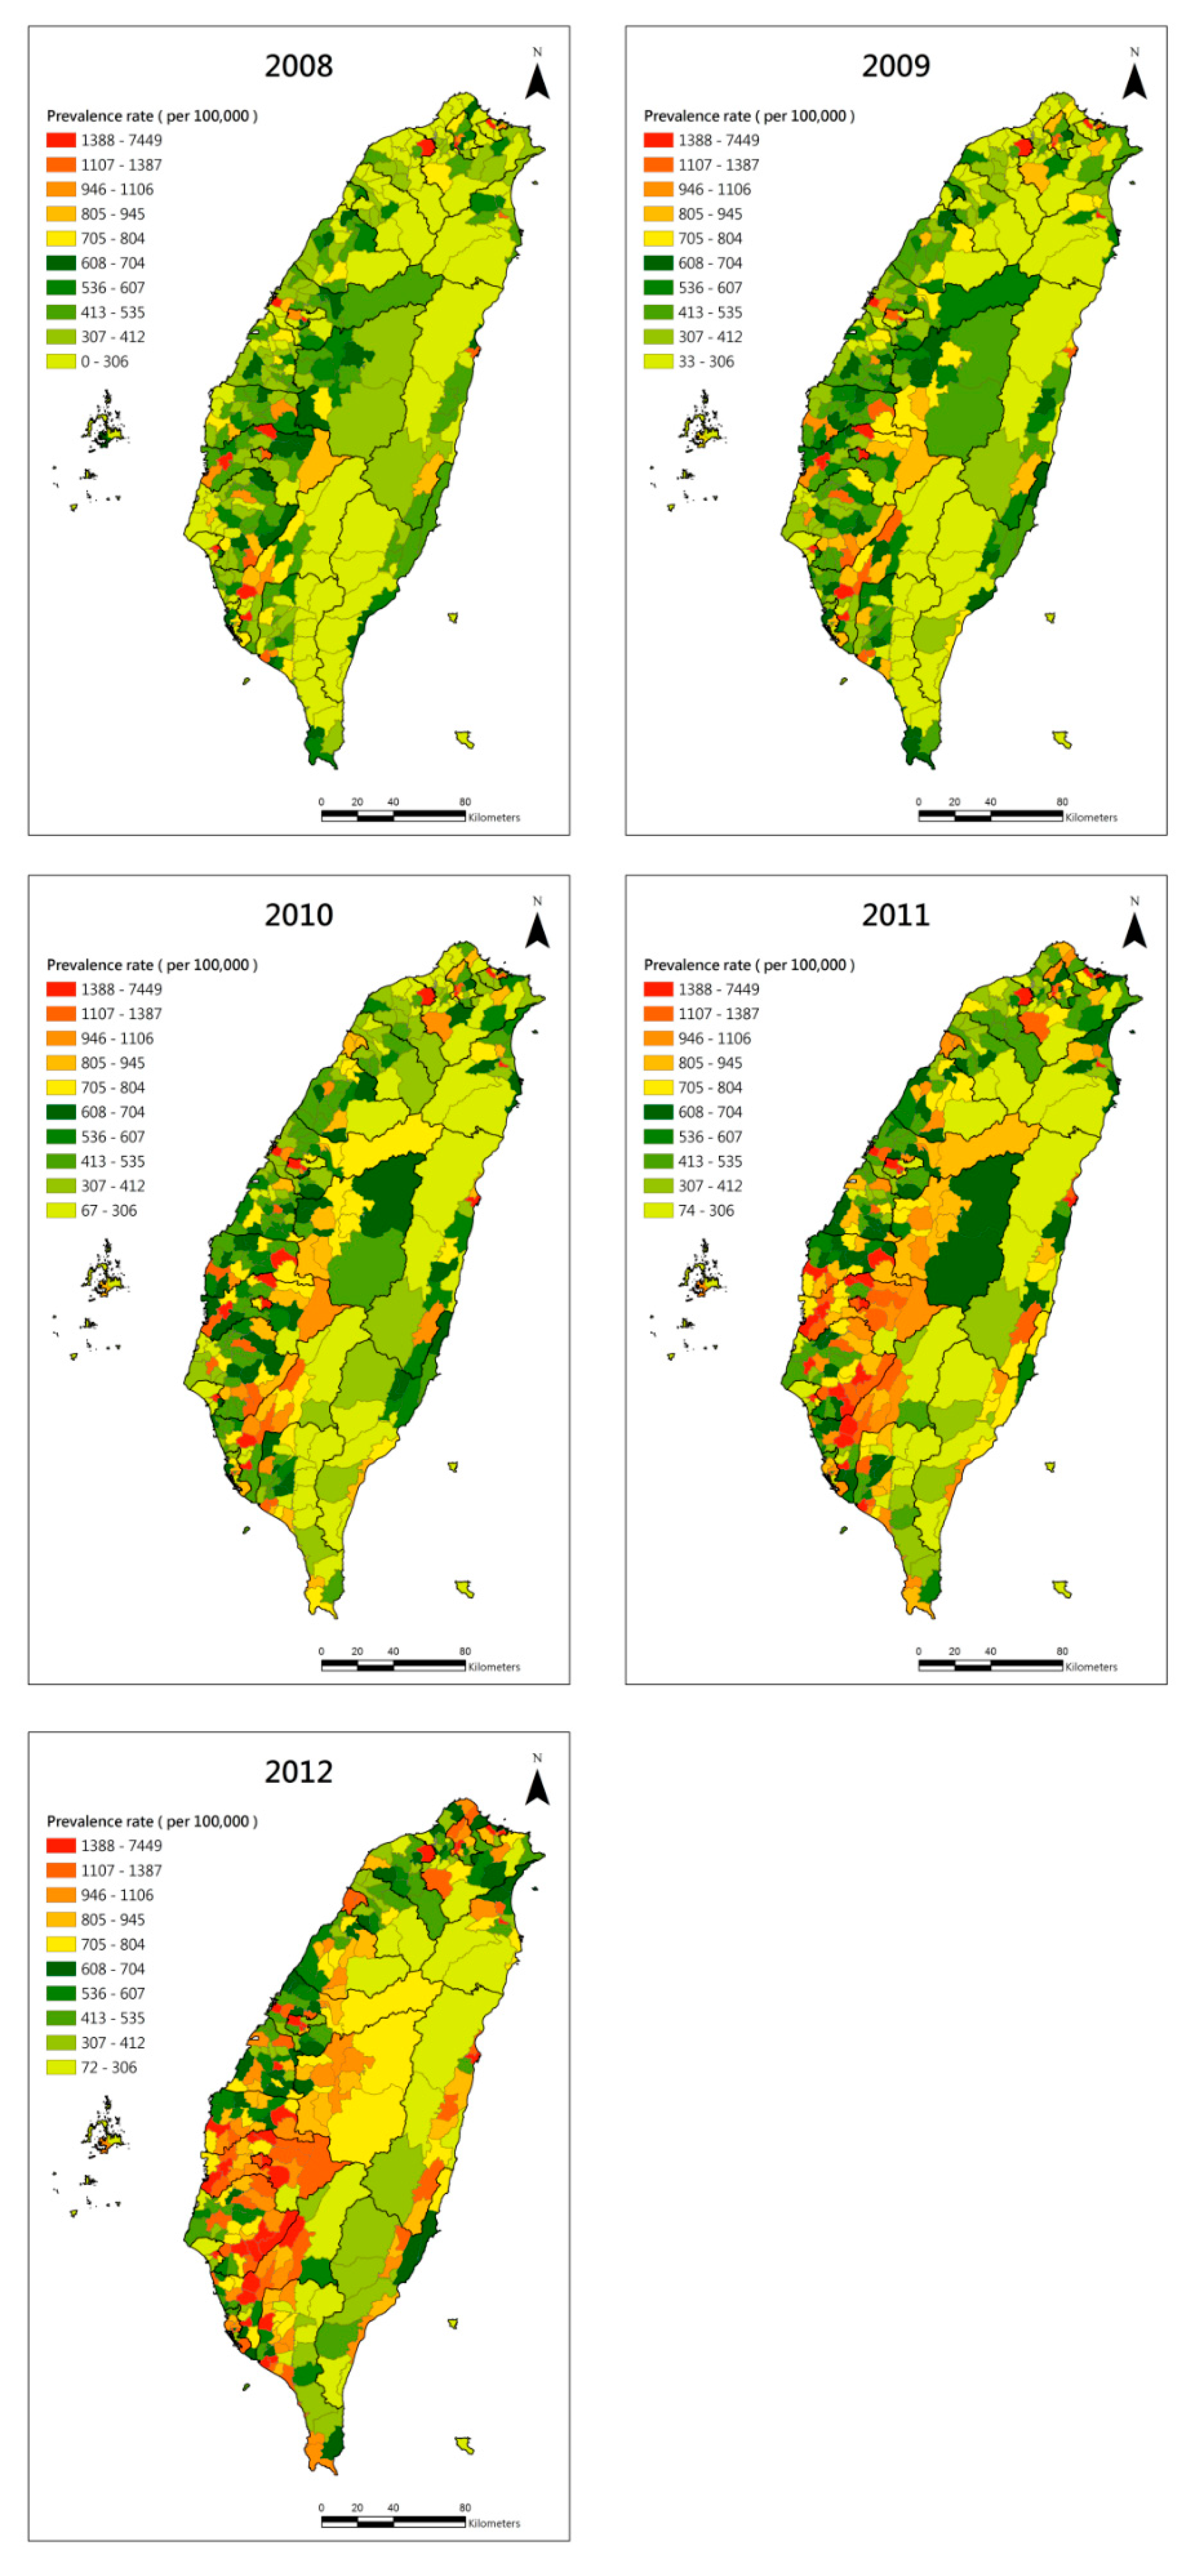
2.2. Geographical Prevalence Estimation

2.3. Statistical Analysis
3. Results

| Year | CKD | ESRD | ||
|---|---|---|---|---|
| Male | Female | Male | Female | |
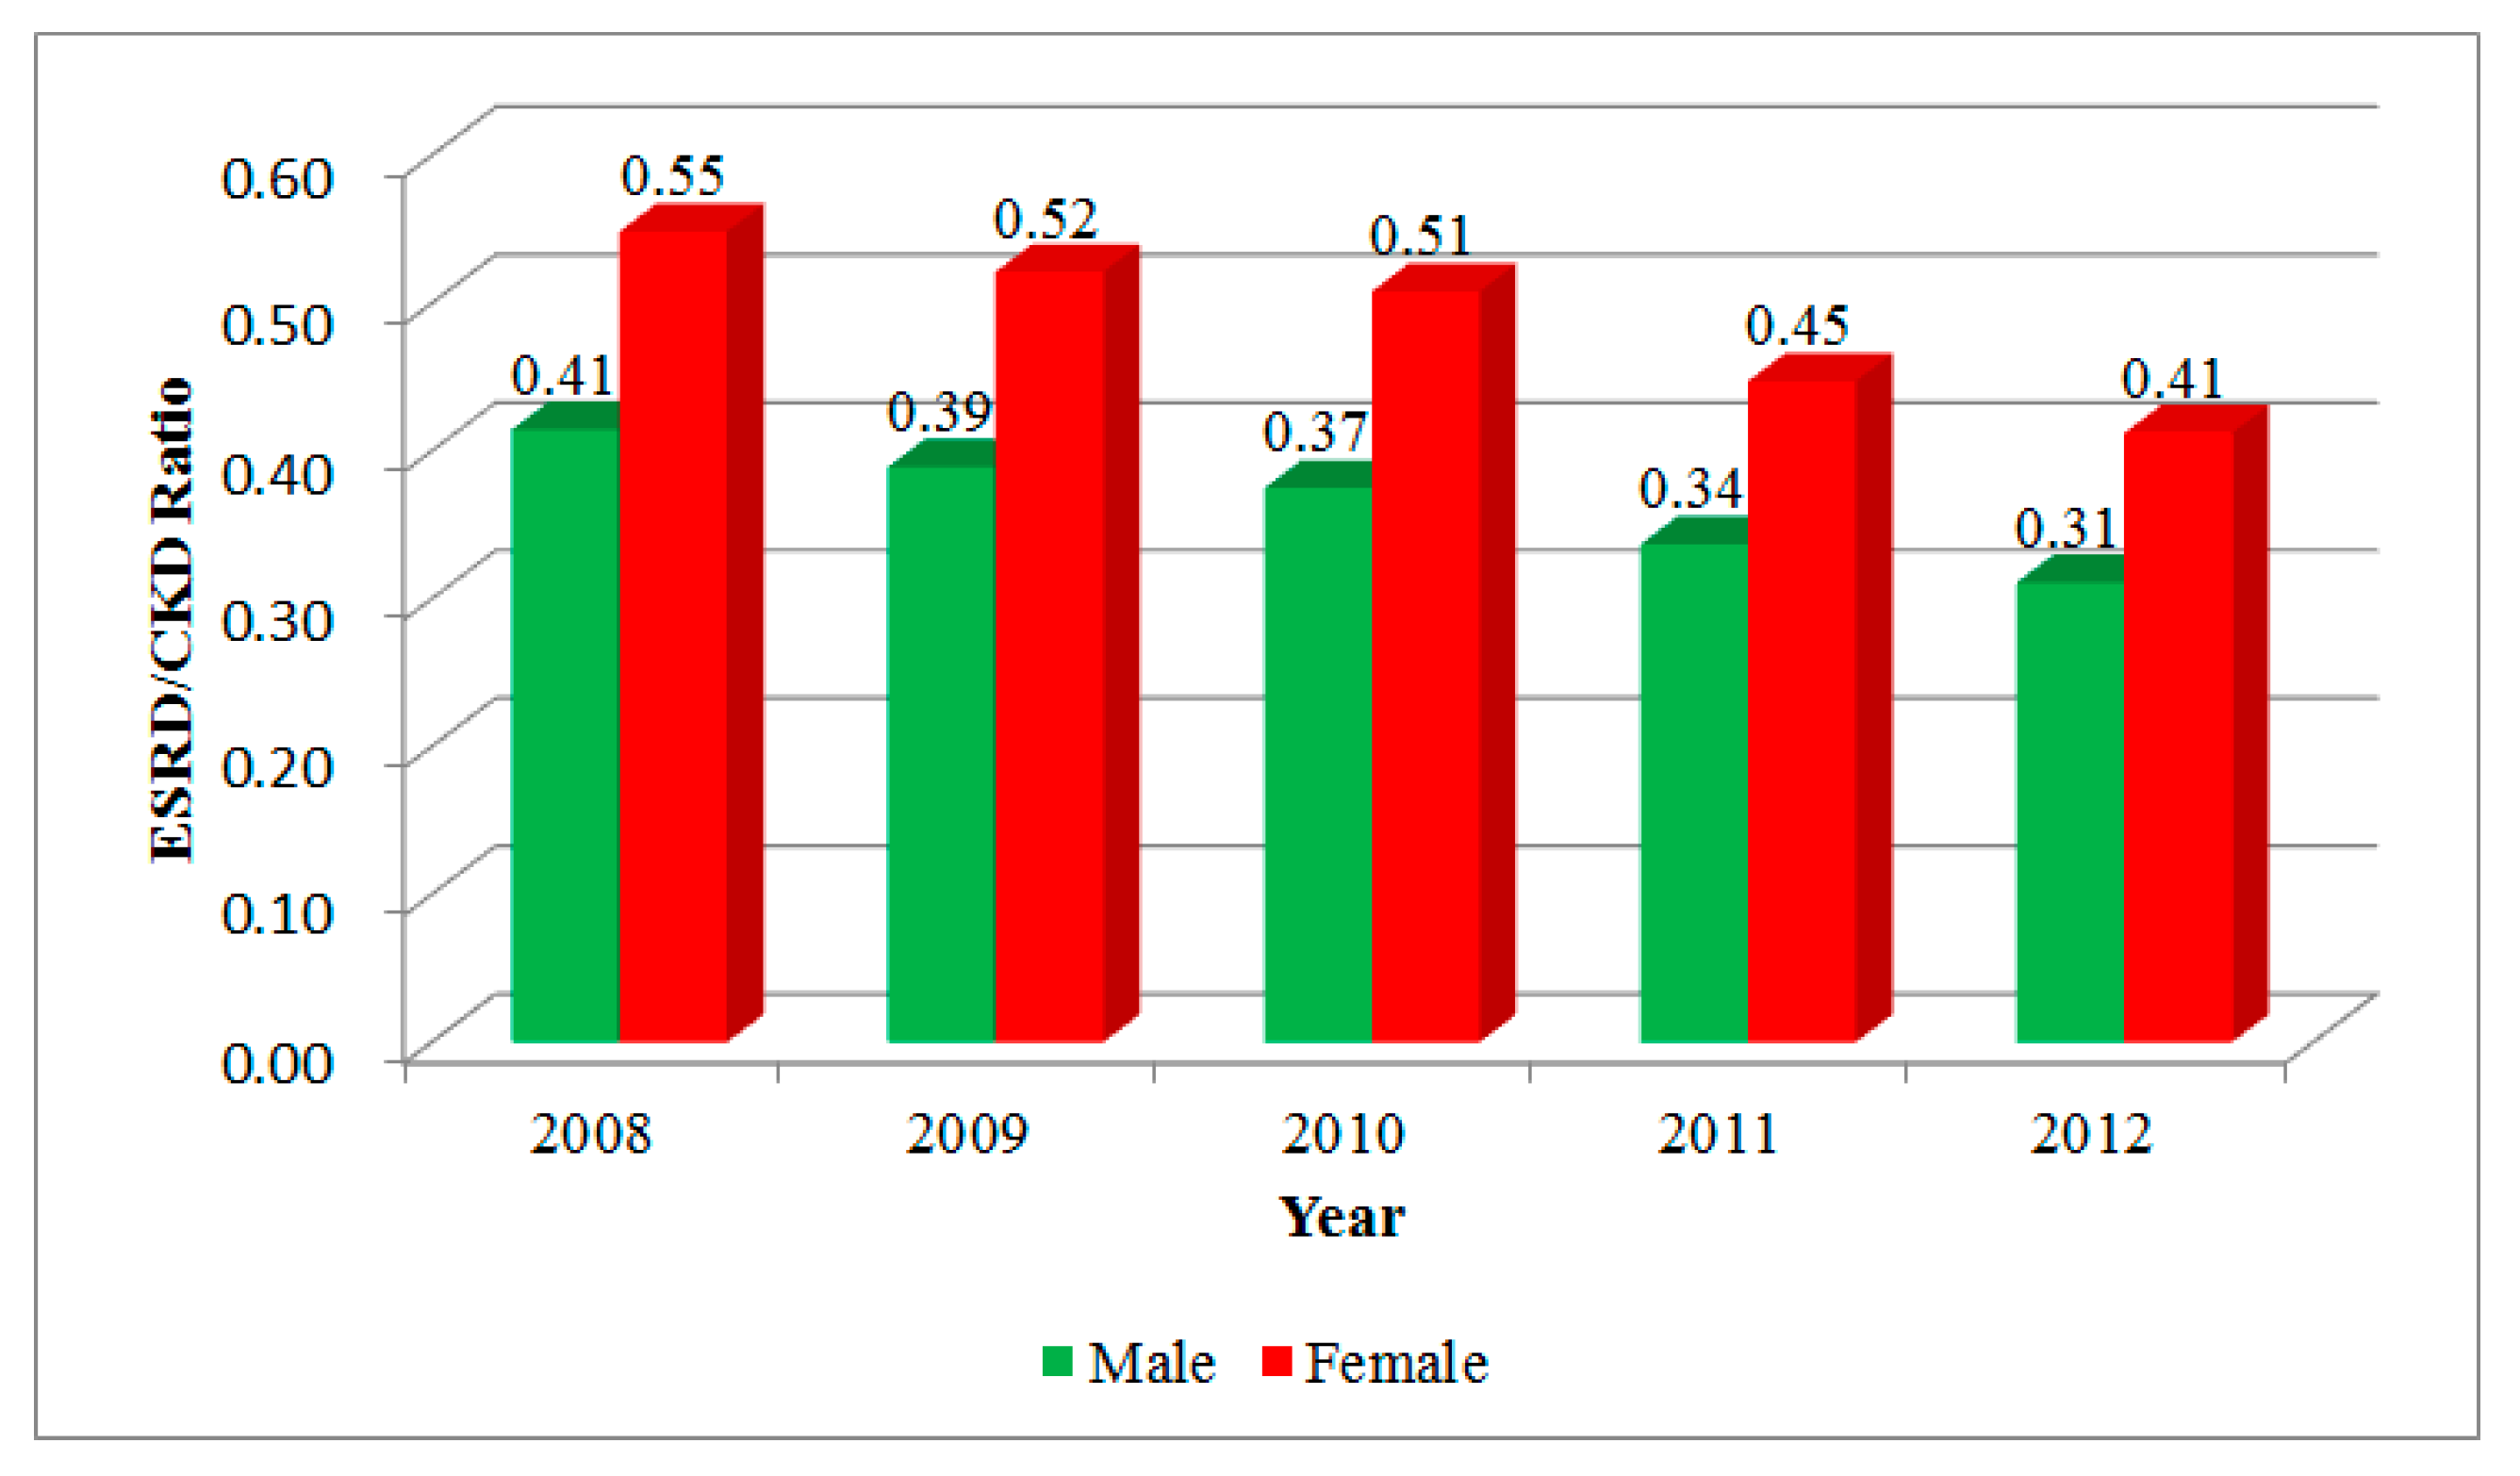
| 2008 | 1,090,712 | 1,058,147 | 308,493 | 347,169 |
| 2009 | 1,230,749 | 1,166,880 | 331,580 | 365,532 |
| 2010 | 1,374,800 | 1,273,005 | 352,702 | 383,122 |
| 2011 | 1,563,096 | 1,418,837 | 373,201 | 399,351 |
| 2012 | 1,833,066 | 1,605,235 | 392,413 | 411,323 |
| Sum | 7,092,423 | 6,522,104 | 1,758,389 | 1,906,497 |

| Year | CKD | ESRD | ||||
|---|---|---|---|---|---|---|
| Male | Female | Total | Male | Female | Total | |
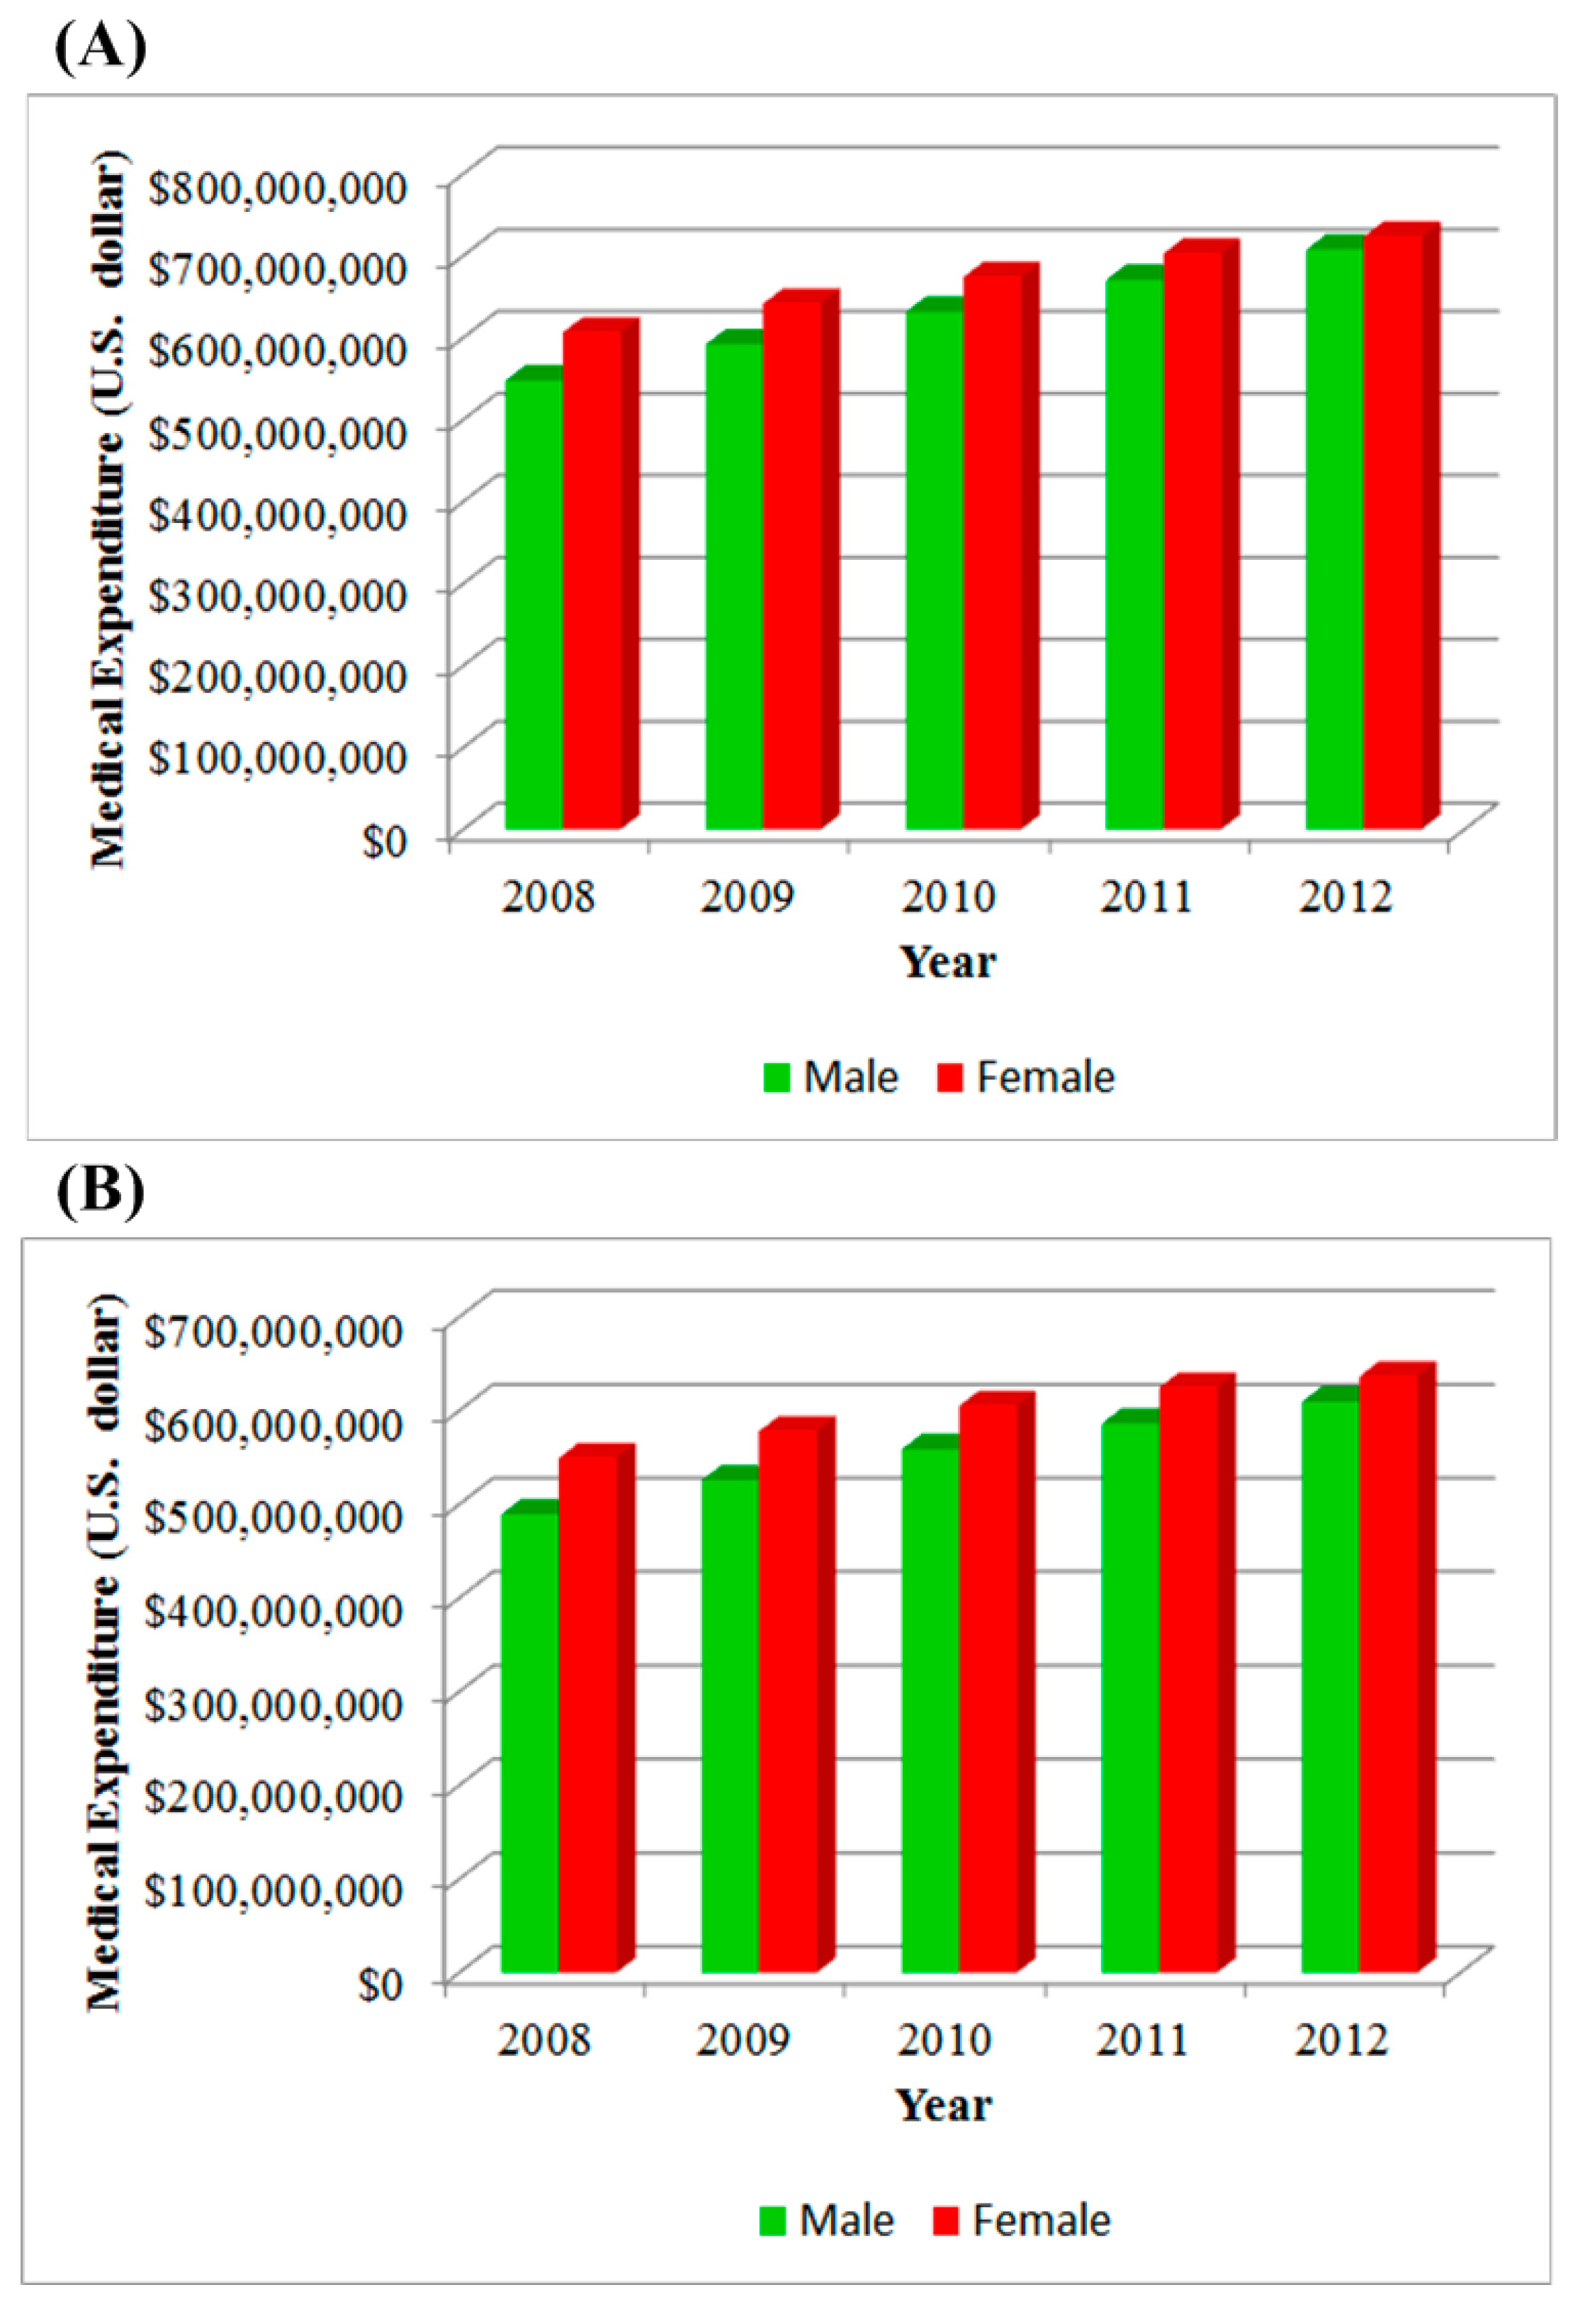
| 2008 | 601.11 | 508.81 | 555.39 | 249.24 | 279.21 | 264.08 |
| 2009 | 682.72 | 559.28 | 621.41 | 265.85 | 291.60 | 278.64 |
| 2010 | 755.01 | 600.87 | 678.30 | 283.07 | 305.40 | 294.18 |
| 2011 | 886.97 | 704.36 | 795.93 | 298.84 | 315.18 | 306.99 |
| 2012 | 1003.01 | 781.59 | 892.45 | 312.15 | 322.28 | 317.21 |

| Variables | 2008 | 2009 | 2010 | 2011 | 2012 | ||||||||||
|---|---|---|---|---|---|---|---|---|---|---|---|---|---|---|---|
| Beta | S.E. | VIF | Beta | S.E. | VIF | Beta | S.E. | VIF | Beta | S.E. | VIF | Beta | S.E. | VIF | |
| % Aborigines | −1.2 | 27.6 | 1.8 | 5.0 | 31.5 | 1.9 | 8.7 | 35.9 | 1.9 | 7.8 | 43.3 | 1.9 | 24.3 | 47.9 | 1.9 |
| % Residents aged >15 years with college or above education status | 146.2 * | 38.1 | 3.5 | 161.2 * | 42.1 | 3.3 | 190.9 * | 49.5 | 3.5 | 234.7 * | 57.4 | 3.4 | 289.9 * | 64.5 | 3.4 |
| % Elderly aged ≥65 years | 94.3 * | 28.3 | 1.9 | 111.6 * | 32.1 | 1.9 | 139.6 * | 37.4 | 2.0 | 184.5 * | 44.1 | 2.0 | 234.9 * | 50.4 | 2.1 |
| Smoking rate | −20.3 | 21.1 | 1.1 | −32.1 | 24.3 | 1.1 | −20.0 | 27.9 | 1.1 | −13.9 | 32.1 | 1.1 | −8.8 | 36.3 | 1.1 |
| Density of hospitals | 24.5 | 38.1 | 3.5 | 19.4 | 41.1 | 3.2 | 63.9 | 45.5 | 3.0 | 105.6 # | 53.6 | 3.0 | 211.6 * | 58.9 | 2.8 |
| Density of clinics | −49.8 | 44.2 | 4.7 | −51.0 | 48.0 | 4.3 | −91.6 | 53.3 | 4.1 | −126.6 # | 62.7 | 4.1 | −207.8 * | 69.1 | 3.9 |
| Adjusted R-square | 0.08 | 0.08 | 0.08 | 0.09 | 0.12 | ||||||||||

| Year | Before GWR | After GWR | ||
|---|---|---|---|---|
| Moran’s I | p-Value | Moran’s I | p-Value | |
| 2008 | 0.01 | 0.20 | −0.28 | 0.78 |
| 2009 | 0.01 | 0.24 | −0.52 | 0.60 |
| 2010 | 0.01 | 0.33 | −0.72 | 0.47 |
| 2011 | 0.02 | 0.01 | −0.83 | 0.40 |
| 2012 | 0.03 | 0.00 | −0.56 | 0.58 |
| Variables | 2008 | 2009 | 2010 | 2011 | 2012 | |||||
|---|---|---|---|---|---|---|---|---|---|---|
| Median | R. STD | Median | R. STD | Median | R. STD | Median | R. STD | Median | R.STD | |
| % Aborigines | 17.0 | 27.5 | 26.7 | 32.7 | 33.5 | 45.0 | 39.8 | 67.3 | 68.9 | 97.1 |
| % Residents aged >15 years old with college or above education status | 169.6 | 114.2 | 191.0 | 125.1 | 233.2 | 153.7 | 294.7 | 319.6 | 349.8 | 354.5 |
| % Elderly aged ≥65 years old | 114.5 | 50.4 | 135.0 | 59.4 | 169.7 | 74.9 | 253.3 | 186.3 | 320.0 | 226.4 |
| Smoking rate | −5.4 | 32.5 | −29.8 | 19.0 | −5.2 | 15.9 | 47.4 | 115.3 | 32.4 | 43.3 |
| Density of hospitals | 2.8 | 16.7 | −5.7 | 20.4 | 36.7 | 13.1 | 6.2 | 167.1 | −1.5 | 284.4 |
| Density of clinics | −15.9 | 32.4 | −16.1 | 34.9 | −48.7 | 75.8 | 13.6 | 300.6 | 18.6 | 422.0 |
| Adjusted R-square | 0.11 | 0.10 | 0.11 | 0.16 | 0.20 | |||||

4. Discussion and Conclusions
Acknowledgments
Author Contributions
Conflicts of Interest
References
- Perico, N.; Remuzzi, G. Chronic kidney disease: A research and public health priority. Nephrol. Dial. Transplant. 2012, 27, iii19–iii26. [Google Scholar]
- Jha, V.; Wang, A.Y.; Wang, H. The impact of CKD identification in large countries: The burden of illness. Nephrol. Dial. Transplant. 2012, 27, iii32–iii38. [Google Scholar]
- Nugent, R.A.; Fathima, S.F.; Feigl, A.B.; Chyung, D. The burden of chronic kidney disease on developing nations: A 21st century challenge in global health. Nephron. Clin. Pract. 2011, 118, c269–c277. [Google Scholar] [CrossRef]
- Atkins, R.C. The epidemiology of chronic kidney disease. Kidney Int. 2005, 67, S14–S18. [Google Scholar] [CrossRef]
- United States Renal Data System (USRDS). 2013 Annual Data Report: Atlas of Chronic Kidney Disease and End-Stage Renal Disease in the United States; National Institutes of Health, National Institute of Diabetes and Digestive and Kidney Diseases: Bethesda, MD, USA, 2013. [Google Scholar]
- Lin, C.M.; Yang, M.C.; Hwang, S.J.; Sung, J.M. Progression of stages 3b-5 chronic kidney disease—Preliminary results of Taiwan national pre-ESRD disease management program in Southern Taiwan. J. Formos. Med. Assoc. 2013, 112, 773–782. [Google Scholar] [CrossRef]
- Tsai, S.Y.; Tseng, H.F.; Tan, H.F.; Chien, Y.S.; Chang, C.C. End-stage renal disease in Taiwan: A case-control study. J. Epidemiol. 2008, 19, 169–176. [Google Scholar] [CrossRef]
- Kuo, H.W.; Tsai, S.S.; Tiao, M.M.; Yang, C.Y. Epidemiological features of CKD in Taiwan. Am. J. Kidney Dis. 2007, 49, 46–55. [Google Scholar] [CrossRef]
- Hsieh, C.F.; Huang, S.L.; Chen, C.L.; Chen, W.T.; Chang, H.C.; Wu, M.L.; Yang, C.C. Increased risk of chronic kidney disease among users of non-prescribed Chinese herbal medicine in Taiwan. Prev. Med. 2012, 55, 155–159. [Google Scholar] [CrossRef]
- Hsu, Y.C.; Lee, P.H.; Lei, C.C.; Shih, Y.H.; Lin, C.L. Analgesic use, parents’ clan, and coffee intake are three independent risk factors of chronic kidney disease in middle and elderly-aged population: A community-based study. Renal Fail. 2014, 36, 361–366. [Google Scholar] [CrossRef]
- Singh, A.K.; Kari, J.A. Metabolic syndrome and chronic kidney disease. Curr. Opin. Nephrol. Hypertens. 2013, 22, 198–203. [Google Scholar] [CrossRef]
- Plantinga, L.; Howard, V.J.; Judd, S.; Muntner, P.; Tanner, R.; Rizk, D.; Lackland, D.T.; Warnock, D.G.; Howard, G.; McClellan, W.M. Association of duration of residence in the southeastern United States with chronic kidney disease may differ by race: The Reasons for Geographic and Racial Differences in Stroke (REGARDS) cohort study. Int. J. Health Geogr. 2013, 12. [Google Scholar] [CrossRef]
- Norris, K.; Nissenson, A.R. Race, gender, and socioeconomic disparities in CKD in the United States. J. Am. Soc. Nephrol. 2008, 19, 1261–1270. [Google Scholar] [CrossRef]
- Rodriguez, R.A.; Hotchkiss, J.R.; O’Hare, A.M. Geographic information systems and chronic kidney disease: Racial disparities, rural residence and forecasting. J. Nephrol. 2013, 26, 3–15. [Google Scholar] [CrossRef]
- Lee, Y.C.; Huang, Y.T.; Tsai, Y.W.; Huang, S.M.; Kuo, K.N.; McKee, M.; Nolte, E. The impact of universal National Health Insurance on population health: The experience of Taiwan. BMC Health Serv. Res. 2010, 10. [Google Scholar] [CrossRef]
- Ta-Chien, Chan; King, C.-C. Surveillance and Epidemiology of Infectious Diseases Using Spatial and Temporal Clustering Methods. In Infectious Disease Informatics and Biosurveillance: Research, Systems and Case Studies; Castillo-Chavez, H.C., Lober, W.B., Thurmond, M., Zeng, D., Eds.; Springer: New York City, NY, USA, 2010; pp. 208–234. [Google Scholar]
- Chan, T.C.; Chiang, P.H.; Su, M.D.; Wang, H.W.; Liu, M.S. Geographic disparity in chronic obstructive pulmonary disease (COPD) mortality rates among the Taiwan population. PLoS One 2014, 9. [Google Scholar] [CrossRef]
- Fotheringham, A.S.; Brunsdon, C. Local forms of spatial analysis. Geogr. Anal. 1999, 31, 340–358. [Google Scholar] [CrossRef]
- Nakaya, T.; Fotheringham, A.S.; Brunsdon, C.; Charlton, M. Geographically weighted Poisson regression for disease association mapping. Stat. Med. 2005, 24, 2695–2717. [Google Scholar] [CrossRef]
- Tucker, P.S.; Kingsley, M.I.; Morton, R.H.; Scanlan, A.T.; Dalbo, V.J. The increasing financial impact of chronic kidney disease in Australia. Int. J. Nephrol. 2014, 2014. [Google Scholar] [CrossRef]
- Kerr, M.; Bray, B.; Medcalf, J.; O’Donoghue, D.J.; Matthews, B. Estimating the financial cost of chronic kidney disease to the NHS in England. Nephrol. Dial. Transplant. 2012, 27, iii73–iii80. [Google Scholar]
- Yang, W.C.; Hwang, S.J. Taiwan Society of Nephrology. Incidence, prevalence and mortality trends of dialysis end-stage renal disease in Taiwan from 1990 to 2001: The impact of national health insurance. Nephrol. Dial. Transplant. 2008, 23, 3977–3982. [Google Scholar] [CrossRef]
- Kao, Y.M.; Chen, J.D. Inverse association between body mass index and chronic kidney disease in older diabetic adults. Ann. Epidemiol. 2013, 23, 255–259. [Google Scholar] [CrossRef]
- Lin, M.Y.; Chiu, Y.W.; Lee, C.H.; Yu, H.Y.; Chen, H.C.; Wu, M.T.; Hwang, S.J. Factors associated with CKD in the elderly and nonelderly population. Clin. J. Am. Soc. Nephrol. 2013, 8, 33–40. [Google Scholar] [CrossRef]
- Sun, F.; Tao, Q.; Zhan, S. Metabolic syndrome and the development of chronic kidney disease among 118,924 non-diabetic Taiwanese in a retrospective cohort. Nephrology (Carlton) 2010, 15, 84–92. [Google Scholar] [CrossRef]
- Ma, L.C.; Chang, H.J.; Liu, Y.M.; Hsieh, H.L.; Lo, L.; Lin, M.Y.; Lu, K.C. The relationship between health-promoting behaviors and resilience in patients with chronic kidney disease. Sci. World J. 2013, 2013. [Google Scholar] [CrossRef]
- United States Renal Data System (USRDS). USRDS Archived Annual Data Report: Atlas of End-Stage Renal Disease in the United States. National Institutes of Health, National Institute of Diabetes and Digestive and Kidney Diseases. Available online: http://www.usrds.org/archive.aspx (accessed on 19 August 2014).
- Lin, C.C.; Liu, C.S.; Lai, M.M.; Li, C.I.; Chen, C.C.; Chang, P.C.; Lin, W.Y.; Lee, Y.D.; Lin, T.; Li, T.C. Metabolic syndrome in a Taiwanese metropolitan adult population. BMC Public Health 2007, 7. [Google Scholar] [CrossRef]
- Bello, A.K.; Peters, J.; Rigby, J.; Rahman, A.A.; El Nahas, M. Socioeconomic status and chronic kidney disease at presentation to a renal service in the United Kingdom. Clin. J. Am. Soc. Nephrol. 2008, 3, 1316–1323. [Google Scholar] [CrossRef]
- Fored, C.M.; Ejerblad, E.; Fryzek, J.P.; Lambe, M.; Lindblad, P.; Nyren, O.; Elinder, C.G. Socio-economic status and chronic renal failure: A population-based case-control study in Sweden. Nephrol. Dial. Transplant. 2003, 18, 82–88. [Google Scholar] [CrossRef]
Appendix


© 2014 by the authors; licensee MDPI, Basel, Switzerland. This article is an open access article distributed under the terms and conditions of the Creative Commons Attribution license (http://creativecommons.org/licenses/by/4.0/).
Share and Cite
Chan, T.-C.; Fan, I.-C.; Liu, M.S.-Y.; Su, M.-D.; Chiang, P.-H. Addressing Health Disparities in Chronic Kidney Disease. Int. J. Environ. Res. Public Health 2014, 11, 12848-12865. https://doi.org/10.3390/ijerph111212848
Chan T-C, Fan I-C, Liu MS-Y, Su M-D, Chiang P-H. Addressing Health Disparities in Chronic Kidney Disease. International Journal of Environmental Research and Public Health. 2014; 11(12):12848-12865. https://doi.org/10.3390/ijerph111212848
Chicago/Turabian StyleChan, Ta-Chien, I.-Chun Fan, Michael Shi-Yung Liu, Ming-Daw Su, and Po-Huang Chiang. 2014. "Addressing Health Disparities in Chronic Kidney Disease" International Journal of Environmental Research and Public Health 11, no. 12: 12848-12865. https://doi.org/10.3390/ijerph111212848