
Economic Burden of Hospitalization Due to Injuries in North India: A Cohort Study

 ,
,
Abstract
:1. Introduction
2. Methodology
2.1. Study Settings
2.2. Study Design
2.3. Data Collection
2.4. Data Analysis
3. Results
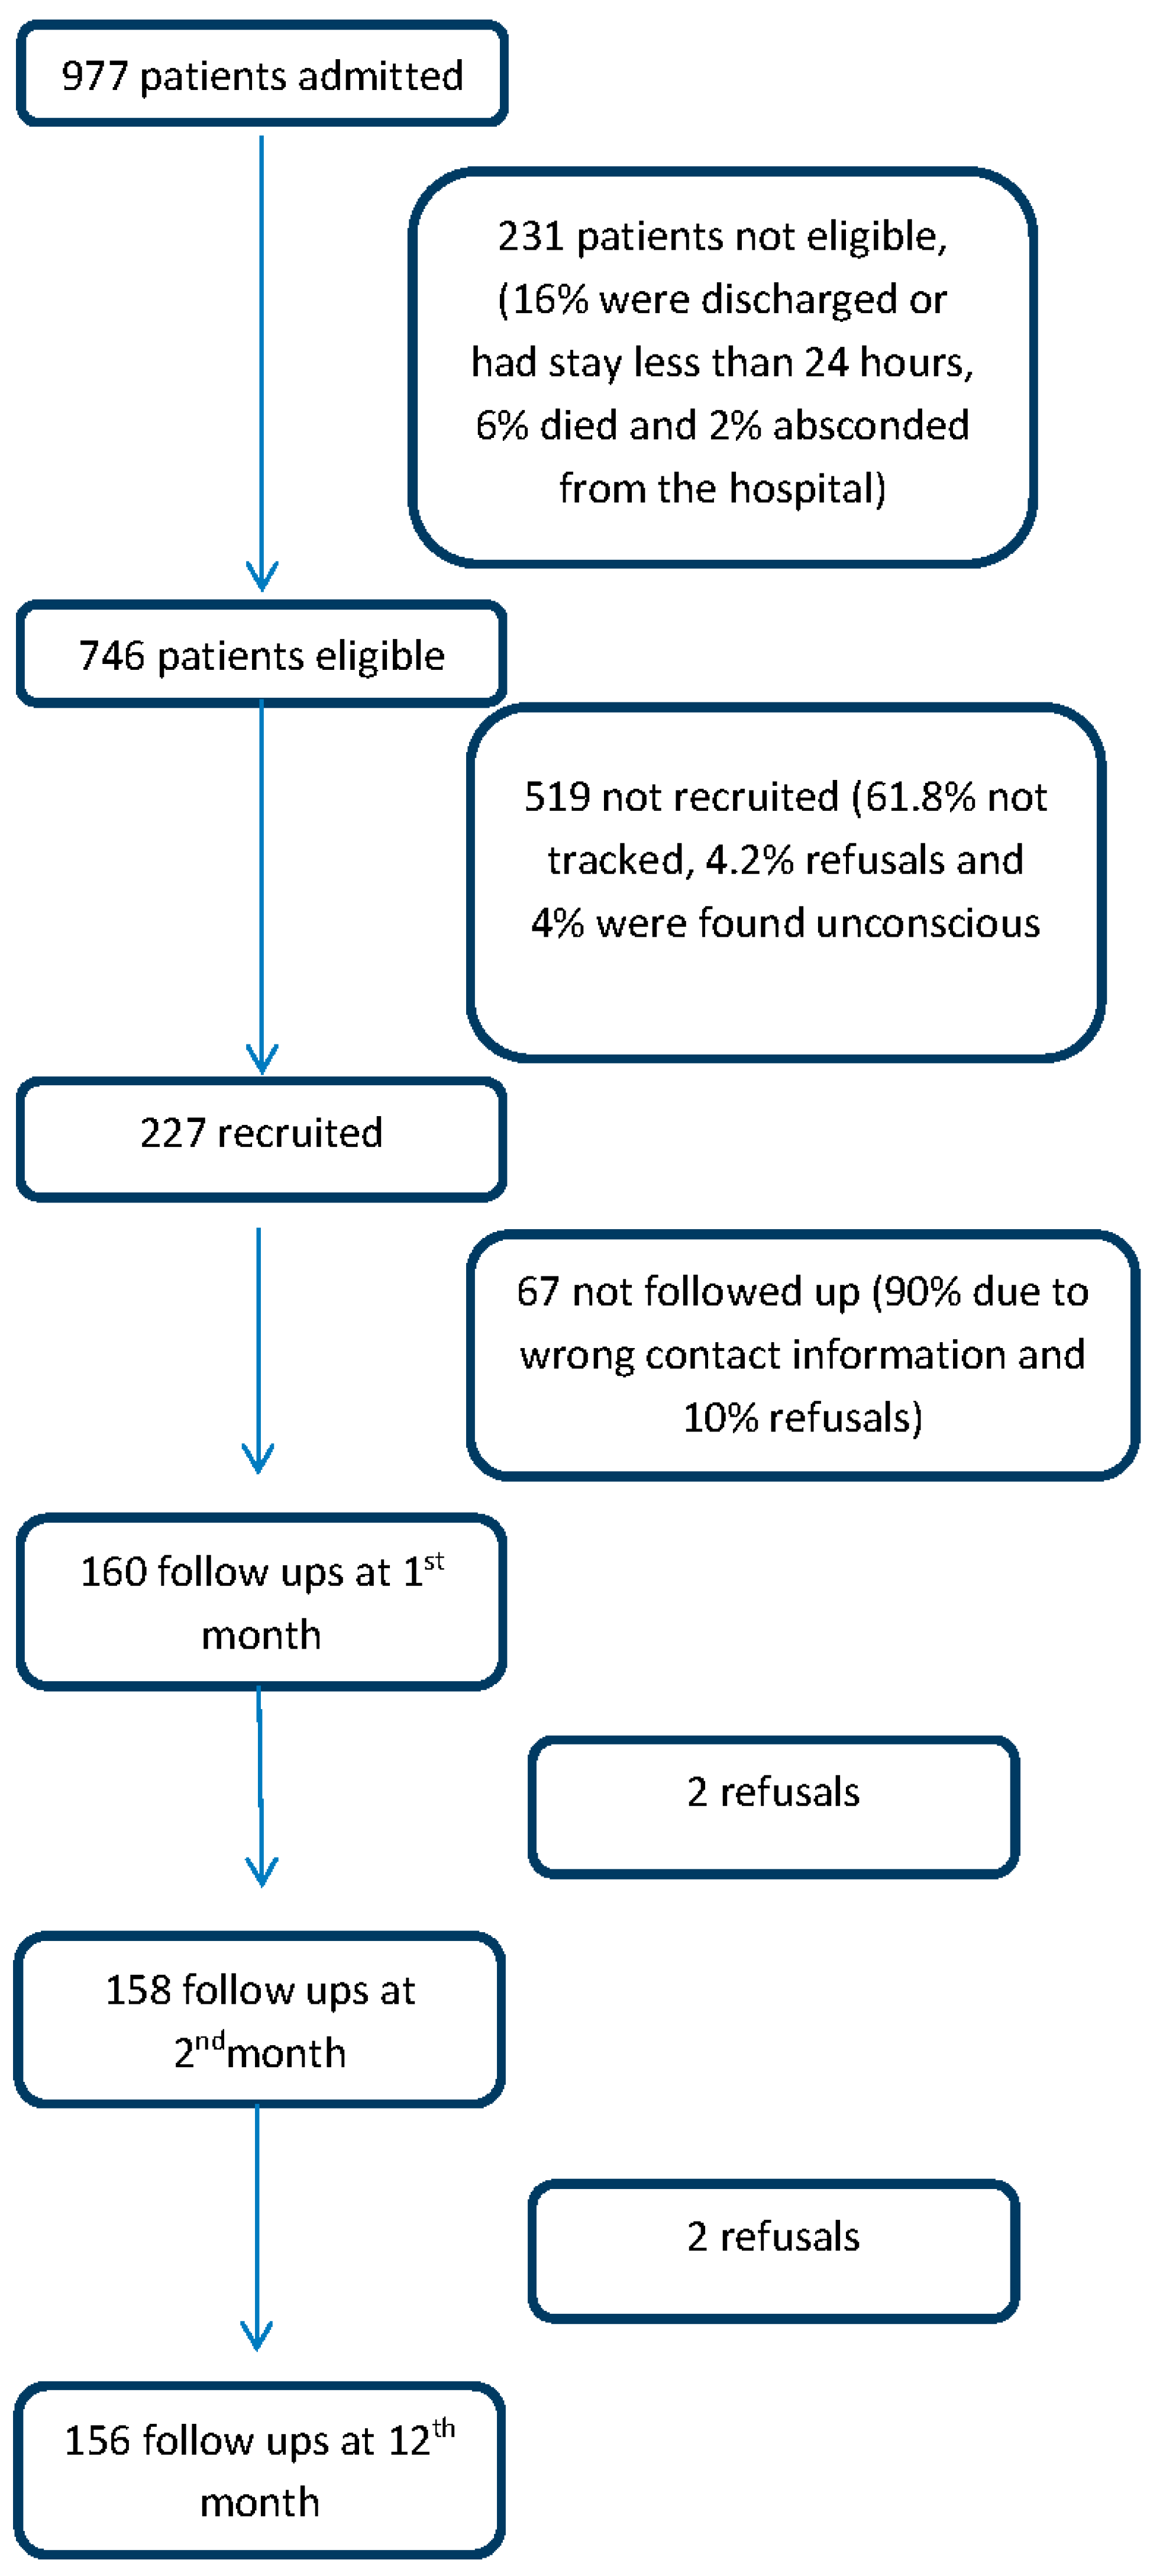
3.1. Recruitment
3.2. Sample Characteristics
3.3. Out of Pocket Expenditure
3.4. Financial Risk Protection
4. Discussion
4.1. Strengths
4.2. Limitations
4.3. Findings in Context with Country and Global Research
5. Conclusions
Acknowledgments
Author Contributions
Conflicts of Interest
Abbreviations
| RTI | Road traffic injuries |
| OOP | Out of pocket |
| LMIC | Low and middle income countries |
| MTV | Motorised vehicles |
| NSSO | National sample survey organization |
References
- World Health Organization. Global Health Estimate: Deaths by Age, Sex and Cause. 2014. Available online: http://www.who.int/healthinfo/global_burden_disease/estimates/en/index1.html (accessed on 2 July 2015).
- Mohan, D.; Anderson, R. Injury Prevention and Control: International Course on Injury Prevention and Control; TRIPP: New Delhi, India, 2000. [Google Scholar]
- Ministry of Home Affairs, Government of India, National Crime Records Bureau, Accidental Deaths and Suicides in India 2013. Available online: http://ncrb.gov.in/adsi2013/ADSI-2013.pdf (accessaed on 15 August 2015).
- Ministry of Health and Family Welfare. Integrated Disease Surveillance Project—Project Implementation Plan 2004–2009; Department of Health, Ministry of Health and Family Welfare, Government of India: New Delhi, India, 2004; pp. 1–18.
- Kamyotra, J.; Mahwar, R.; Saxena, R.; Thirumurthy, G.; Puri, M.; Debroy, R. Status of the Vehicular Pollution Control Programme in India; Central Pollution Control Board, Ministry of Environment and Forests, Government of India: New Delhi, India, 2010.
- Srinivasan, N.S.; Hingorani, D.V.; Sharma, B.M. Economic costs of road accidents. J. Indian Roads Congr. 1975, 36, 207–208. [Google Scholar]
- Natarajan, T. Costs of Road Accidents; Department of Traffic and Urban Engineering, College of Engineering: Guindy, India, 1980. [Google Scholar]
- New Delhi. Road User Cost Study in India; Central Road Research Institute: New Delhi, Delh, India, 1982; p. 106.
- Evaluation of road accident costs—Research digest. Indian Highw. 2000, 28, 27–44.
- Mohan, D. Social cost of road traffic crashes in India. In Proceedings of the First Safe Community Conference on Cost of Injury, Viborg, Denmark, October 2002; pp. 33–38.
- Reddy, G.; Negandhi, H.; Singh, D.; Singh, A.J. Extent and determinants of cost of road traffic injuries in an Indian city. Indian J. Med. Sci. 2009, 63, 549–556. [Google Scholar] [PubMed]
- Kumar, G.A.; Dilip, T.R.; Dandona, L.; Dandona, R. Burden of out-of-pocket expenditure for road traffic injuries in urban India. BMC Health Serv. Res. 2012, 12, 285. [Google Scholar] [CrossRef] [PubMed]
- Wesson, H.K.; Boikhutso, N.; Bachani, A.M.; Hofman, K.J.; Hyder, A.A. The cost of injury and trauma care in low- and middle-income countries: A review of economic evidence. Health Policy Plan. 2014, 29, 795–808. [Google Scholar] [CrossRef] [PubMed]
- Balarajan, Y.; Selvaraj, S.; Subramanian, S.V. Health care and equity in India. Lancet 2011, 377, 505–515. [Google Scholar] [CrossRef]
- Garg, C.C.; Karan, A.K. Reducing out-of-pocket expenditures to reduce poverty: A disaggregated analysis at rural-urban and state level in India. Health Policy Plan. 2009, 24, 116–128. [Google Scholar] [CrossRef] [PubMed]
- World Health Organization. Global Status Report on Road Safety: Time for Action; World Health Organization: Geneva, 2009; Available online: www.who.int/violence_injury_prevention/road_safety_status/2009 (accessed on 20 August 2015).
- Thomson, S.; Foubister, T.; Mossialos, E. Financing Health Care in the European Union: Challenges and Policy Responses; World Health Organization: Copenhagen, Denmark, 2009. [Google Scholar]
- SPSS Inc. SPSS Statistics for Windows, Version 17.0; SPSS Inc.: Chicago, IL, USA, 2008. [Google Scholar]
- Huffman, M.; Rao, K.; Pichon-Riviere, A.; Zhao, D.; Harikrishnan, S.; Ramaiya, K. A cross-sectional study of the microeconomic impact of cardiovascular disease hospitalization in four low-and middle-income countries. PLoS ONE 2011, 6, e20821. [Google Scholar] [CrossRef] [PubMed]
- Heeley, E.; Anderson, C.S.; Huang, Y.; Jan, S.; Li, Y.; Liu, M. Role of health insurance in averting economic hardship in families after acute stroke in China. J. Cereb. Circ. 2009, 40, 2149–2156. [Google Scholar] [CrossRef] [PubMed]
- Rocha-García, A.; Hernández-Peña, P.; Ruiz-Velazco, S.; Avila-Burgos, L.; Marín-Palomares, T.; Lazcano-Ponce, E. Out-of-pocket expenditures during hospitalization of young leukemia patients with state medical insurance in two Mexican hospitals. Salud Pública México 2003, 45, 285–292. [Google Scholar]
- Alvarez-Hernandez, E.; Pelaez-Ballestas, I.; Boonen, A.; Vázquez-Mellado, J.; Hernández-Garduño, A.; Rivera, F.C. Catastrophic health expenses and impoverishment of households of patients with rheumatoid arthritis. Reumatol. Clin. 2012, 8, 168–173. [Google Scholar] [CrossRef] [PubMed]
- Scott, K.; Steele, D.; Temesgen, T. Living Standards Measurement Study Surveys: Household Sample Surveys in Developing and Transition Countries. Available online: http://unstats.un.org/unsd/hhsurveys/pdf/Chapter_23.pdf (accessed on 24 August 2015).
- National Sample Survey Organization (NSSO). Morbidity, Health Care and the Conditions of the Aged, NSSO 60th Round (January–June 2004); National Sample Survey Organisation, Ministry of Statistics and Programme Implementation, Government of India: New Delhi, India, 2006.
- Barancik, J.; Chatterjee, B. Methodological considerations in the use of the abbreviated injury scale in trauma epidemiology. J. Trauma Acute Care Surg. 1981, 21, 627–631. [Google Scholar] [CrossRef]
- Moreno-Serra, R.; Millett, C.; Smith, P.C. Towards improved measurement of financial protection in health. PLoS Med. 2011, 8, 8–13. [Google Scholar] [CrossRef] [PubMed]
- Pradhan, M.; Prescott, N. Social risk management options for medical care in Indonesia. Health Econ. 2002, 11, 431–446. [Google Scholar] [CrossRef] [PubMed]
- Engelgau, M.M.; Karan, A.; Mahal, A. The economic impact of non-communicable diseases on households in India. Global Health 2012, 8. [Google Scholar] [CrossRef] [PubMed]
- Aeron-Thomas, A.; Jacobs, G.; Sexton, B.; Gururaj, G.; Rahman, F. The Involvement and Impact of Road Crashes on the Poor: Bangladesh and India Case Studies 2004. Available online: http://r4d.dfid.gov.uk/pdf/outputs/R7780.pdf (accessaed on 20 August 2015).
- Razzak, J.A.; Bhatti, J.A.; Ali, M.; Khan, U.R.; Jooma, R. Average out-of-pocket healthcare and work-loss costs of traffic injuries in Karachi, Pakistan. Int. J. Inj. Contr. Saf. Promot. 2011, 18, 199–204. [Google Scholar] [CrossRef] [PubMed]
- Nguyen, H.; Ivers, R.; Jan, S.; Martiniuk, A.; Pham, C. Catastrophic household costs due to injury in Vietnam. Injury 2013, 44, 684–690. [Google Scholar] [CrossRef] [PubMed]
- Ghaffar, A.; Reddy, K.S.; Singhi, M. Burden of non-communicable diseases in South Asia. BMJ 2004, 328, 807–810. [Google Scholar] [CrossRef] [PubMed]
- Yip, W.; Mahal, A. The health care systems of China and India: Performance and future challenges. Health Aff. 2008, 27, 921–932. [Google Scholar] [CrossRef] [PubMed]
- Prinja, S.; Kanavos, P.; Kumar, R. Inequities in health care utilization in three north Indian states: Role of public sector in universalizing health care. Indian J. Med. Res. 2012, 136, 421–431. [Google Scholar] [PubMed]
- Prinja, S.; Bahuguna, P.; Pinto, A.D.; Sharma, A.; Bharaj, G.; Kumar, V. The cost of universal health care in India: A model based estimate. PLoS ONE 2012, 7, e30362. [Google Scholar] [CrossRef] [PubMed]
- Selvaraj, S.; Mukhopadhyay, I.; Kumar, P.; Aisola, M. Universal access to medicines: Evidence from Rajasthan, India. WHO South-East Asia J. Public Health 2014, 3, 289–299. [Google Scholar]
- Ravi, S.; Bergkvist, S. Are Publicly Financed Health Insurance Schemes Working in India? Available online: http://ssrn.com/abstract=2292360 or http://dx.doi.org/10.2139/ssrn.2292360 (accessed on 7 January 2015).
- World Health Organization. Regional Office for South East Asia. Road Safety Status in the WHO South East Asia Region; World Health Organization: New Delhi, India, 2013. [Google Scholar]
- Wadhwaniya, S.; Gupta, S.; Tetali, S.; Hyder, A. The validity of self-reported helmet-use among motorcyclists in India. Injury Prevent. 2012, 18. [Google Scholar] [CrossRef]


| Variable | Category | N (%) | RTI * (%) | Non-RTI (%) |
|---|---|---|---|---|
| Gender | Male | 194 (85.5) | 119 (86.9) | 75 (83.3) |
| Female | 33 (14.5) | 18 (13.1) | 15 (16.7) | |
| Age Group | 18–30 years | 93 (41.0) | 60 (43.8) | 33 (36.7) |
| 31–60 years | 116 (51.0) | 68 (41.6) | 48 (53.3) | |
| Above 60 years | 18 (8.0) | 9 (6.6) | 9 (10.0) | |
| Marital Status | Unmarried | 67 (29.5) | 45 (32.8) | 22 (24.4) |
| Married | 153 (67.4) | 86 (62.8) | 67 (74.4) | |
| Other | 7 (3.1) | 6 (4.4) | 1 (1.1) | |
| Education | Illiterate | 39 (17.2) | 20 (14.6) | 19 (21.1) |
| Primary and middle | 73 (32.2) | 39 (28.5) | 34 (37.8)) | |
| Matric and above | 115 (50.7) | 78 (57.0) | 37 (41.0) | |
| Occupation | Cultivator | 29 (12.8) | 15 (10.9) | 14 (15.6) |
| Wage Labourer | 55 (24.7) | 35 (25.5) | 20 (22.2) | |
| Employer | 26 (11.5) | 14 (10.2) | 12 (13.3) | |
| Unpaid family worker | 26 (11.5) | 14 (10.2) | 12 (13.3) | |
| Regular salaried | 58 (25.2) | 40 (29.2) | 18 (20.0) | |
| Others | 33 (14.5) | 19 (13.9) | 14 (15.5) | |
| Income Quartile (INR) | Poorest (<10,000) | 59 (26.0) | 32 (23.4) | 27 (30.0) |
| Poor (10,001–18,000) | 56 (24.7) | 30 (21.9) | 26 (28.9) | |
| Rich (18,001–35,250) | 55 (24.2) | 36 (26.3) | 19 (21.1) | |
| Richest (35,251–552,000) | 57 (25) | 39 (28.5) | 18 (20.0) | |
| Health Insurance | Yes | 90 (39.6) | 58 (42.3) | 32 (35.6) |
| No | 137 (60.4) | 79 (57.7) | 58 (64.4) | |
| Cause of Injury | Unintentional | 197 (86.7) | 137 (100) | 60 (66.6) |
| Intentional | 21 (9.2) | - | 21 (23.3) | |
| Undetermined | 9 (3.9) | - | 9 (10.0) | |
| Mode of Transportation | Pedestrian | - | 27 (19.7) | - |
| Bicycle | - | 9 (6.5) | - | |
| MTV ** | - | 94(68.6) | - | |
| Others | - | 7 (5.0) | - | |
| Catchment area | Punjab | 75 (33.0) | 48 (35.0) | 27 (30.0) |
| Haryana | 62 (27.0) | 39 (28.5) | 23 (25.6) | |
| Himachal Pradesh | 45 (20.0) | 20 (14.6) | 25 (27.8) | |
| Chandigarh | 20 (9.0) | 17 (11.7) | 3 (3.3) | |
| Jammu and Kashmir | 6 (4.0) | 3 (2.2) | 3 (3.3) | |
| Others | 15 (6.0) | 7 (5.1) | 8 (8.8) | |
| Not found | 4 (1.7) | 3 (2.0) | 1 (1.1) | |
| Total | 227 (100) | 137 (100) | 90 (100) |
| Variable | Category | Mean Out of Pocket Expenditure in USD (SE) | |||||||
|---|---|---|---|---|---|---|---|---|---|
| During Hospitalization | 12 Months Following Injury | ||||||||
| RTI * | Non-RTI | p-Value | All Injuries | RTI * | Non-RTI | p-Value | All Injuries | ||
| Overall | 400 | 369 | 0.58 | 388 | 1179 | 850 | 0.07 | 1046 | |
| (36) | (43) | 5 | (28) | (118) | (136) | 2 | (88) | ||
| Gender | Male | 402 | 374 | 0.66 | 391 | 1168 | 937 | 0.26 | 1080 |
| (40) | (53) | 3 | (32) | (127) | (163) | 5 | (100) | ||
| Female | 389 | 345 | 0.69 | 369 | 1282 | 484 | 0.01 | 826 | |
| (81) | (73) | 3 | (54) | (296) | (104) | 1 | (162) | ||
| Age Group | 18–30 years | 332 | 323 | 0.906 | 329 | 986 | 616 | 0.089 | 853 |
| (39) | (70) | (35) | (131) | (165) | (105) | ||||
| 31–60 years | 459 | 407 | 0.589 | 438 | 1380 | 863 | 0.051 | 1150 | |
| (63) | (68) | (46) | (207) | (134) | (132) | ||||
| Above 60 years | 416 | 328 | 0.516 | 372 | 1010 | 1793 | 0.429 | 1289 | |
| (88) | (98) | (65) | (265) | (1229) | (452) | ||||
| Marital Status | Unmarried | 307 | 290 | 0.837 | 301 | 910 | 758 | 0.572 | 859 |
| (43) | (80) | (39) | (147) | (233) | (24) | ||||
| Married | 450 | 399 | 0.510 | 427 | 1323 | 896 | 0.073 | 1136 | |
| (52) | (55) | (38) | (164) | (164) | (118) | ||||
| Other | 403 | 92 | 0.422 | 358 | 986 | 92 | 0.287 | 762 | |
| (134) | (XX) ** | (122) | (311) | (XX) ** | (313) | ||||
| Education | Illiterate | 324 | 494 | 0.256 | 407 | 801 | 740 | 0.769 | 774 |
| (58) | (138) | (74) | (106) | (186) | (100) | ||||
| Primary and middle | 438 | 417 | 0.857 | 428 | 1189 | 829 | 0.243 | 1020 | |
| (83) | (78) | (57) | (225) | (201) | (153) | ||||
| Matric and above | 402 | 259 | 0.059 | 357 | 1284 | 918 | 0.228 | 1157 | |
| (47) | (42) | (35) | (174) | (248) | (143) | ||||
| Occupation | Cultivator | 191 | 428 | 0.073 | 306 | 542 | 1354 | 0.068 | 884 |
| (36) | (126) | (66) | (86) | (479) | (221) | ||||
| Wage Labourer | 515 | 441 | 0.663 | 488 | 1161 | 359 | 0.014 | 894 | |
| (100) | (138) | (80) | (215) | (76) | (158) | ||||
| Employer | 267 | 267 | 0.996 | 267 | 1170 | 1054 | 0.829 | 1120 | |
| (47) | (71) | (41) | (407) | (270) | (254) | ||||
| Unpaid family worker | 474 | 365 | 0.416 | 424 | 1267 | 524 | 0.036 | 895 | |
| (94) | (89) | (65) | (296) | (130) | (181) | ||||
| Regular salaried | 454 | 423 | 0.804 | 444 | 1583 | 999 | 0.119 | 1371 | |
| (70) | (102) | (57) | (256) | (182) | (180) | ||||
| Others | 287 | 226 | 0.519 | 261 | 672 | 915 | 0.747 | 794 | |
| (60) | (69) | (45) | (211) | (708) | (360) | ||||
| Inc. Quartile | Poorest | 436 | 479 | 0.744 | 456 | 915 | 601 | 0.206 | 777 |
| (73) | (113) | (64) | (190) | (129) | (122) | ||||
| Poor | 328 | 307 | 0.810 | 318 | 727 | 602 | 0.409 | 663 | |
| (70) | (47) | (43) | (115) | (97) | (75) | ||||
| Rich | 523 | 318 | 0.173 | 452 | 1530 | 1231 | 0.562 | 1458 | |
| (96) | (92) | (71) | (240) | (505) | (217) | ||||
| Richest | 314 | 346 | 0.725 | 324 | 1493 | 1362 | 0.808 | 1443 | |
| (42) | (96) | (41) | (309) | (465) | (257) | ||||
| Health Insurance | Yes | 445 | 443 | 0.986 | 445 | 1418 | 1031 | 0.272 | 1287 |
| (60) | (99) | (52) | (220) | (230) | (166) | ||||
| No | 368 | 328 | 0.542 | 351 | 1006 | 767 | 0.240 | 900 | |
| (46) | (45) | (32) | (123) | (166) | (101) | ||||
| Hospitalised days | <3 days | 174 | 113 | 0.080 | 150 | 618 | 531 | 0.630 | 579 |
| (26) | (14) | (17) | (89) | (159) | (85) | ||||
| 4–7 days | 377 | 385 | 0.923 | 380 | 1342 | 957 | 0.319 | 1198 | |
| (33) | (88) | (40) | (216) | (338) | (185) | ||||
| >7 days | 784 | 712 | 0.606 | 755 | 1734 | 1282 | 0.210 | 1562 | |
| (97) | (89) | (68) | (257) | (165) | (173) | ||||
| Variable | Category | Number with of Catastrophic Expenditure (%) | OR * | 95% CI ** | p-Value |
|---|---|---|---|---|---|
| Sex | Male | 58 (29.8) | 1.40 | 0.50–3.92 | 0.51 |
| Female | 10 (30.3) | 1 | |||
| Age | 18–30 years | 20 (21.5) | 1 | ||
| 31–60 years | 42 (36.2) | 1.93 | 0.88–2.22 | 0.96 | |
| >60 years | 6 (33.3) | 1.63 | 0.42–6.39 | 0.47 | |
| Income Quartile | Poorest | 24 (57.6) | 26.50 | 6.70–105.07 | <0.01 |
| Poor | 19 (33.9) | 12.18 | 3.01–49.32 | <0.01 | |
| Rich | 12 (21.8) | 4.80 | 1.17–19.62 | 0.03 | |
| Richest | 3 (5.3) | 1 | |||
| Hospitalised days | <3 days | 14 (14.6) | 1 | ||
| 4–7 days | 18 (25.2) | 2.81 | 1.14–6.95 | 0.02 | |
| >7 days | 36 (58.0) | 10.60 | 4.21–26.64 | <0.01 | |
| Health Insurance | Yes | 28 (31.1) | 1 | ||
| No | 40 (29.1) | 1.04 | 0.89–2.24 | 0.90 | |
| Type of Injury | RTI $ | 37 (27.0) | 0.86 | 0.42–1.78 | 0.70 |
| Non RTI | 31 (34.4) | 1 |
| Variable | Category | Number with Distress Financing (%) | OR * | 95% CI ** | p-Value |
|---|---|---|---|---|---|
| Sex | Male | 65 (33.5) | 1.70 | 0.69–4.18 | 0.24 |
| Female | 8 (24.2) | 1 | |||
| Age | 18-30 years | 25 (26.8) | 1 | ||
| 31–60 years | 43 (37.0) | 1.50 | 0.79–2.84 | 0.21 | |
| >60 years | 5 (27.8) | 1.03 | 0.31–3.39 | 0.96 | |
| Income Quartile | Poorest | 24 (40.7) | 2.50 | 1.05–5.93 | 0.04 |
| Poor | 21 (37.5) | 2.30 | 0.96–5.50 | 0.06 | |
| Rich | 16 (29.0) | 1.38 | 0.56–3.42 | 0.48 | |
| Richest | 12 (21.0) | 1 | |||
| Hospitalised days | <3 days | 23 (26.3) | 1 | ||
| 4–7 days | 23 (32.0) | 1.53 | 0.74–3.16 | 0.24 | |
| >7 days | 26 (41.9) | 2.03 | 0.98–4.19 | 0.05 | |
| HealthInsurance | Yes | 29 (32.2) | 1 | ||
| No | 44 (32.1) | 1.12 | 0.59–2.09 | 0.74 | |
| Type of Injury | RTI $ | 44 (32.1) | 1.20 | 0.65–2.20 | 0.54 |
| Non RTI | 29 (32.2) | 1 |
© 2016 by the authors; licensee MDPI, Basel, Switzerland. This article is an open access article distributed under the terms and conditions of the Creative Commons Attribution (CC-BY) license (http://creativecommons.org/licenses/by/4.0/).
Share and Cite
Prinja, S.; Jagnoor, J.; Chauhan, A.S.; Aggarwal, S.; Nguyen, H.; Ivers, R. Economic Burden of Hospitalization Due to Injuries in North India: A Cohort Study. Int. J. Environ. Res. Public Health 2016, 13, 673. https://doi.org/10.3390/ijerph13070673
Prinja S, Jagnoor J, Chauhan AS, Aggarwal S, Nguyen H, Ivers R. Economic Burden of Hospitalization Due to Injuries in North India: A Cohort Study. International Journal of Environmental Research and Public Health. 2016; 13(7):673. https://doi.org/10.3390/ijerph13070673
Chicago/Turabian StylePrinja, Shankar, Jagnoor Jagnoor, Akashdeep Singh Chauhan, Sameer Aggarwal, Ha Nguyen, and Rebecca Ivers. 2016. "Economic Burden of Hospitalization Due to Injuries in North India: A Cohort Study" International Journal of Environmental Research and Public Health 13, no. 7: 673. https://doi.org/10.3390/ijerph13070673