
The Methods of Choice for Extracellular Vesicles (EVs) Characterization

 and
and
Abstract
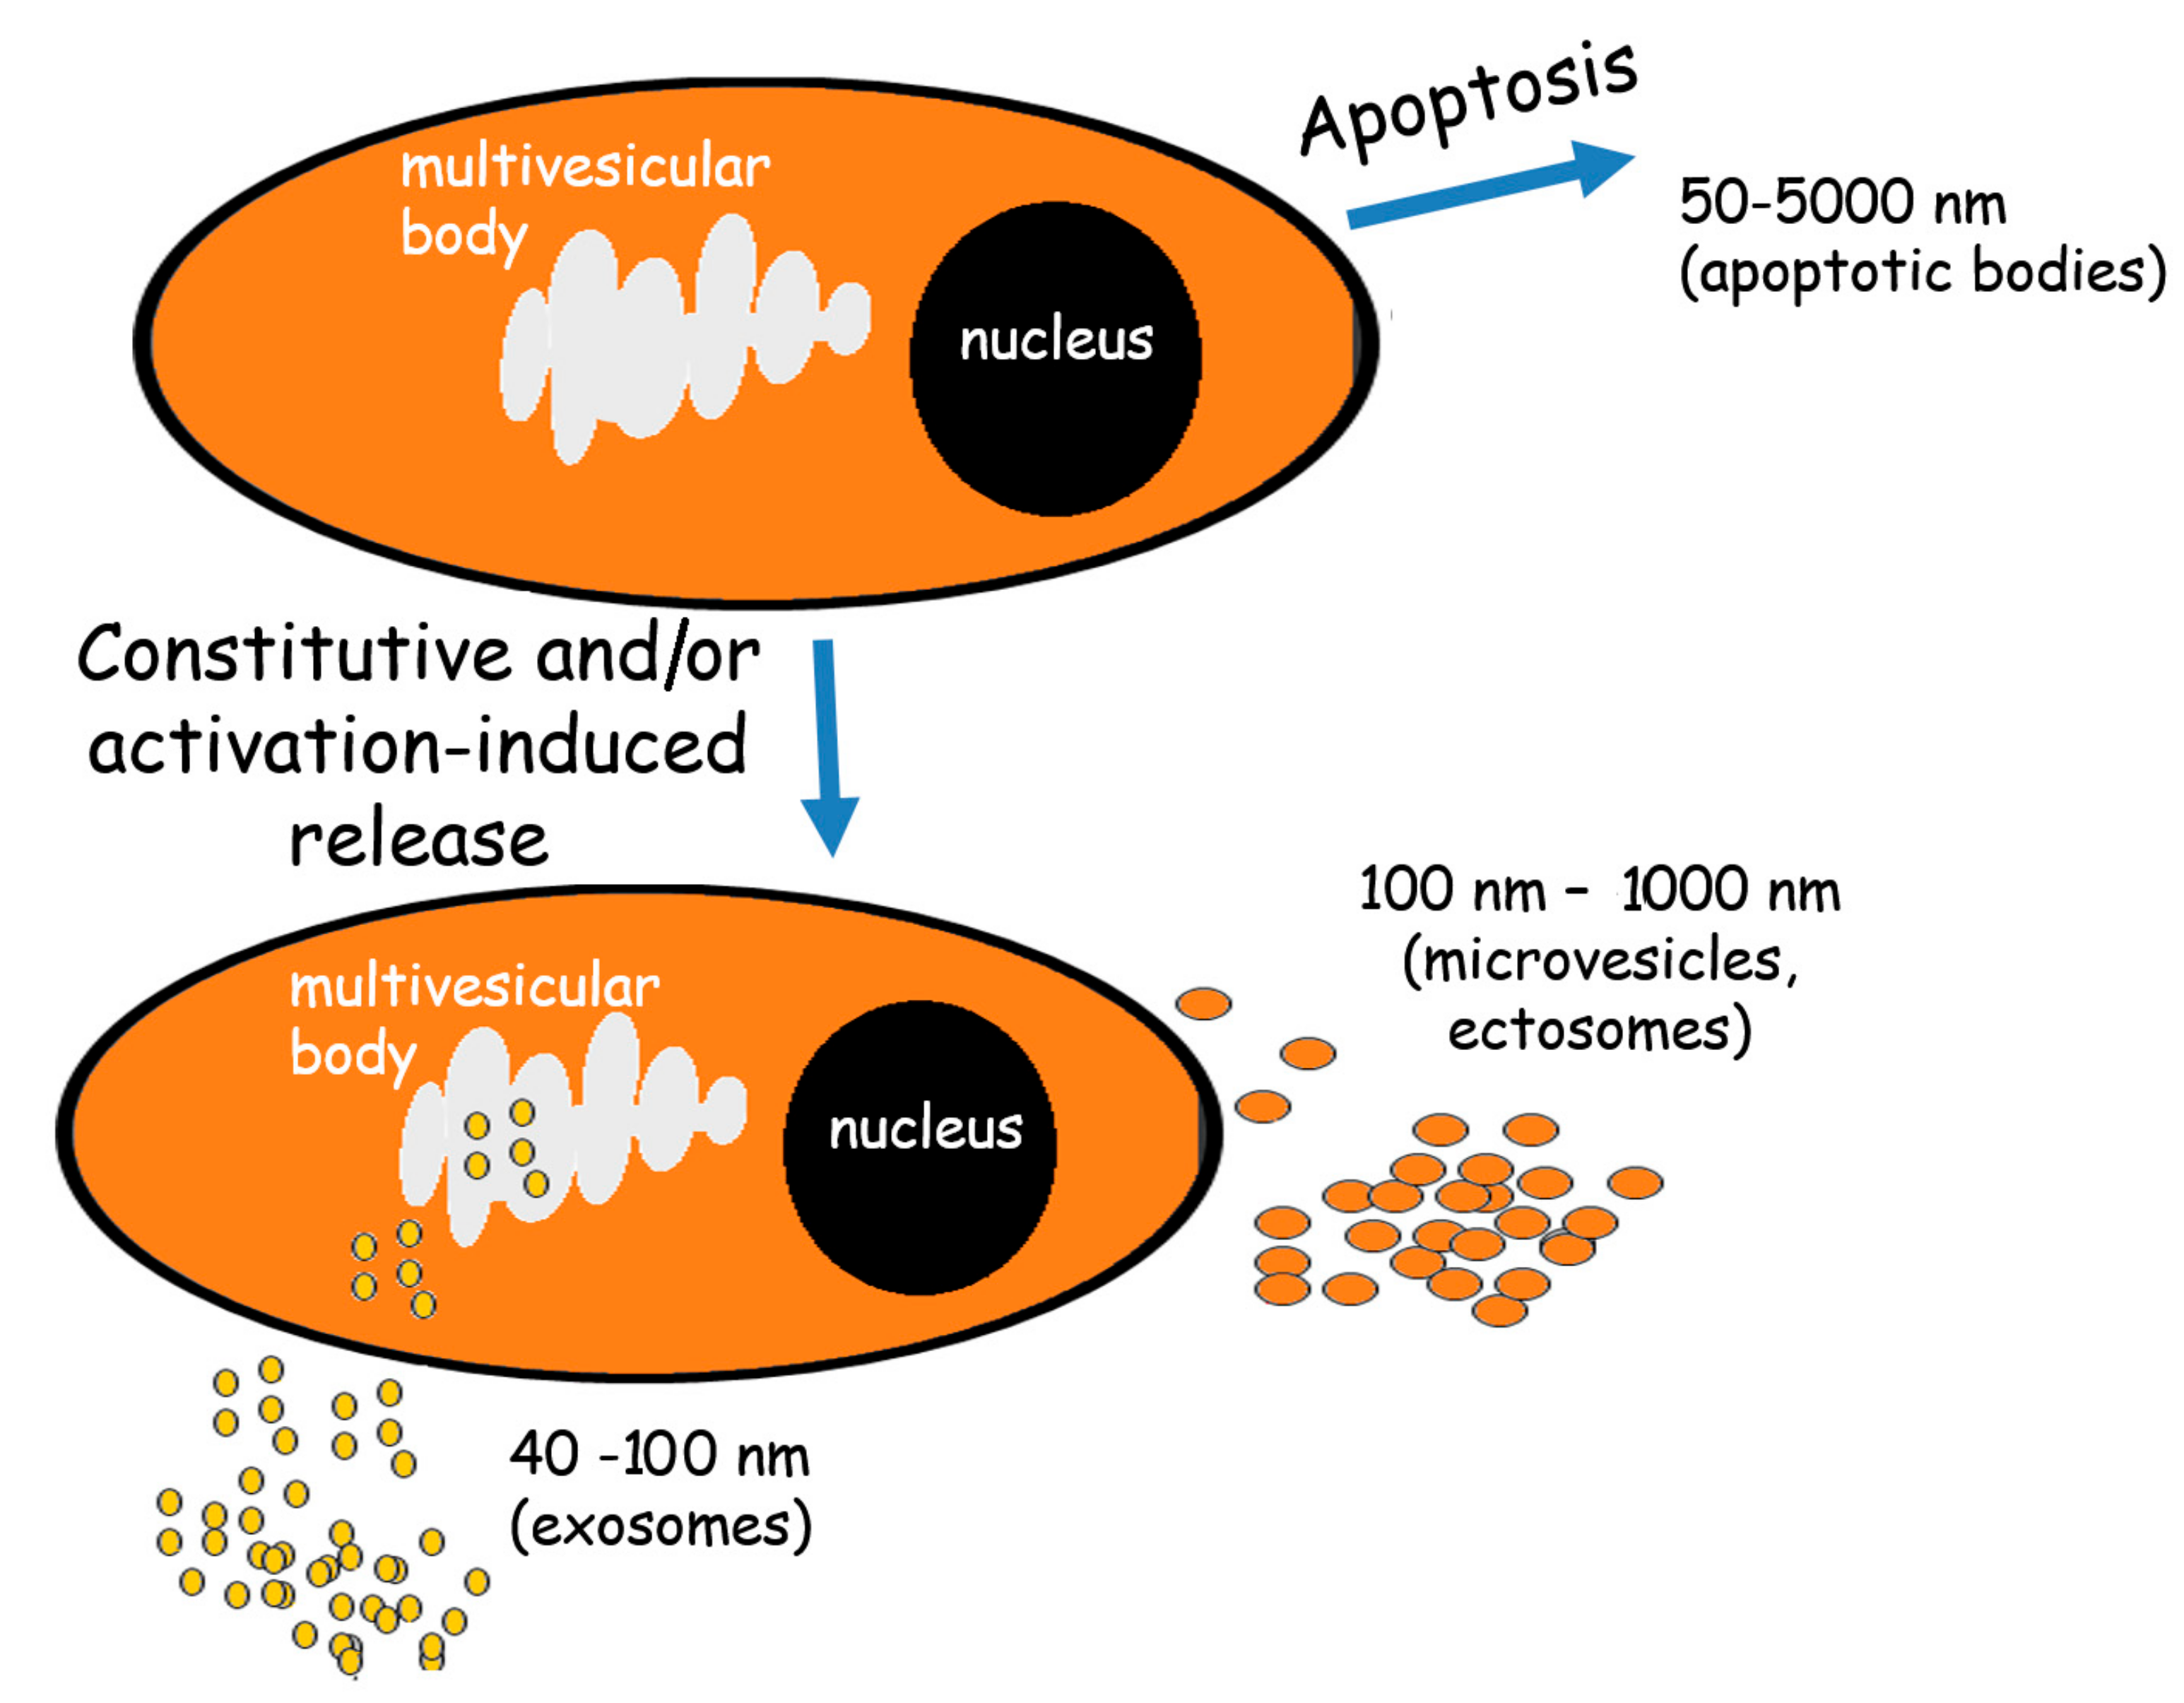
:1. Extracellular Vesicles
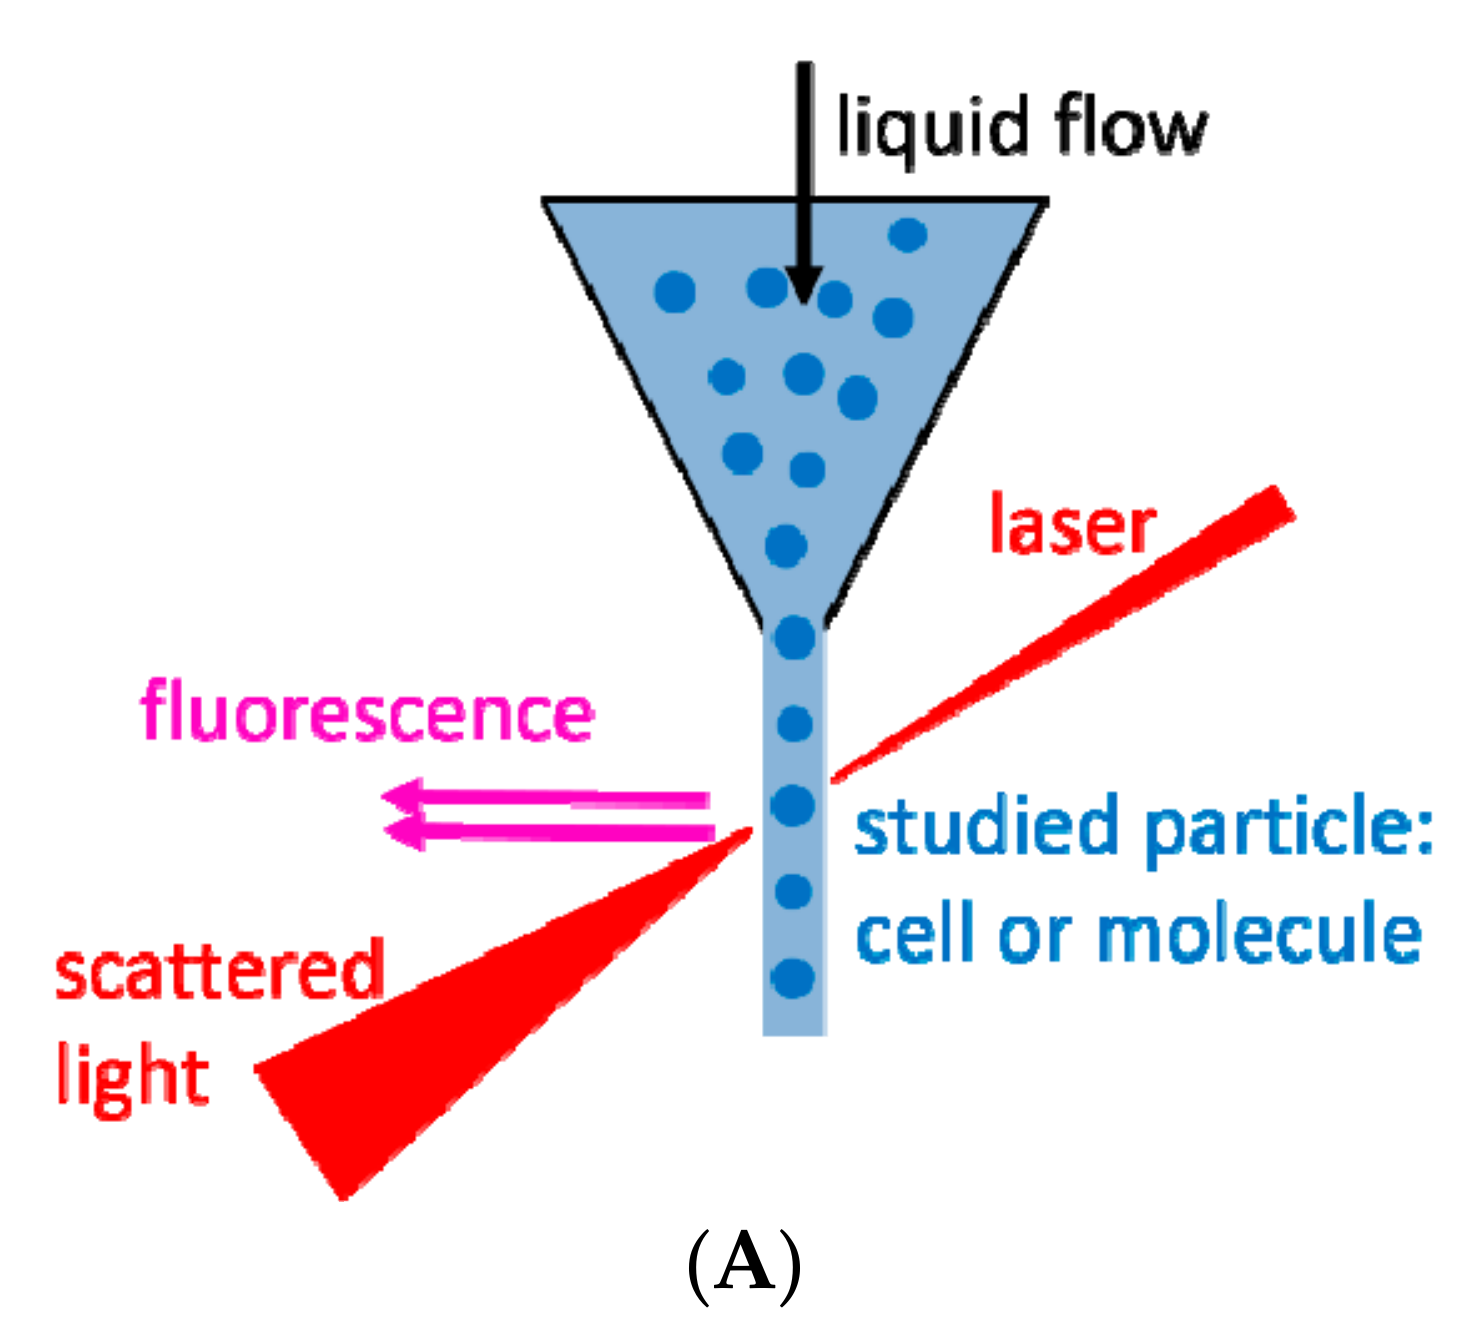
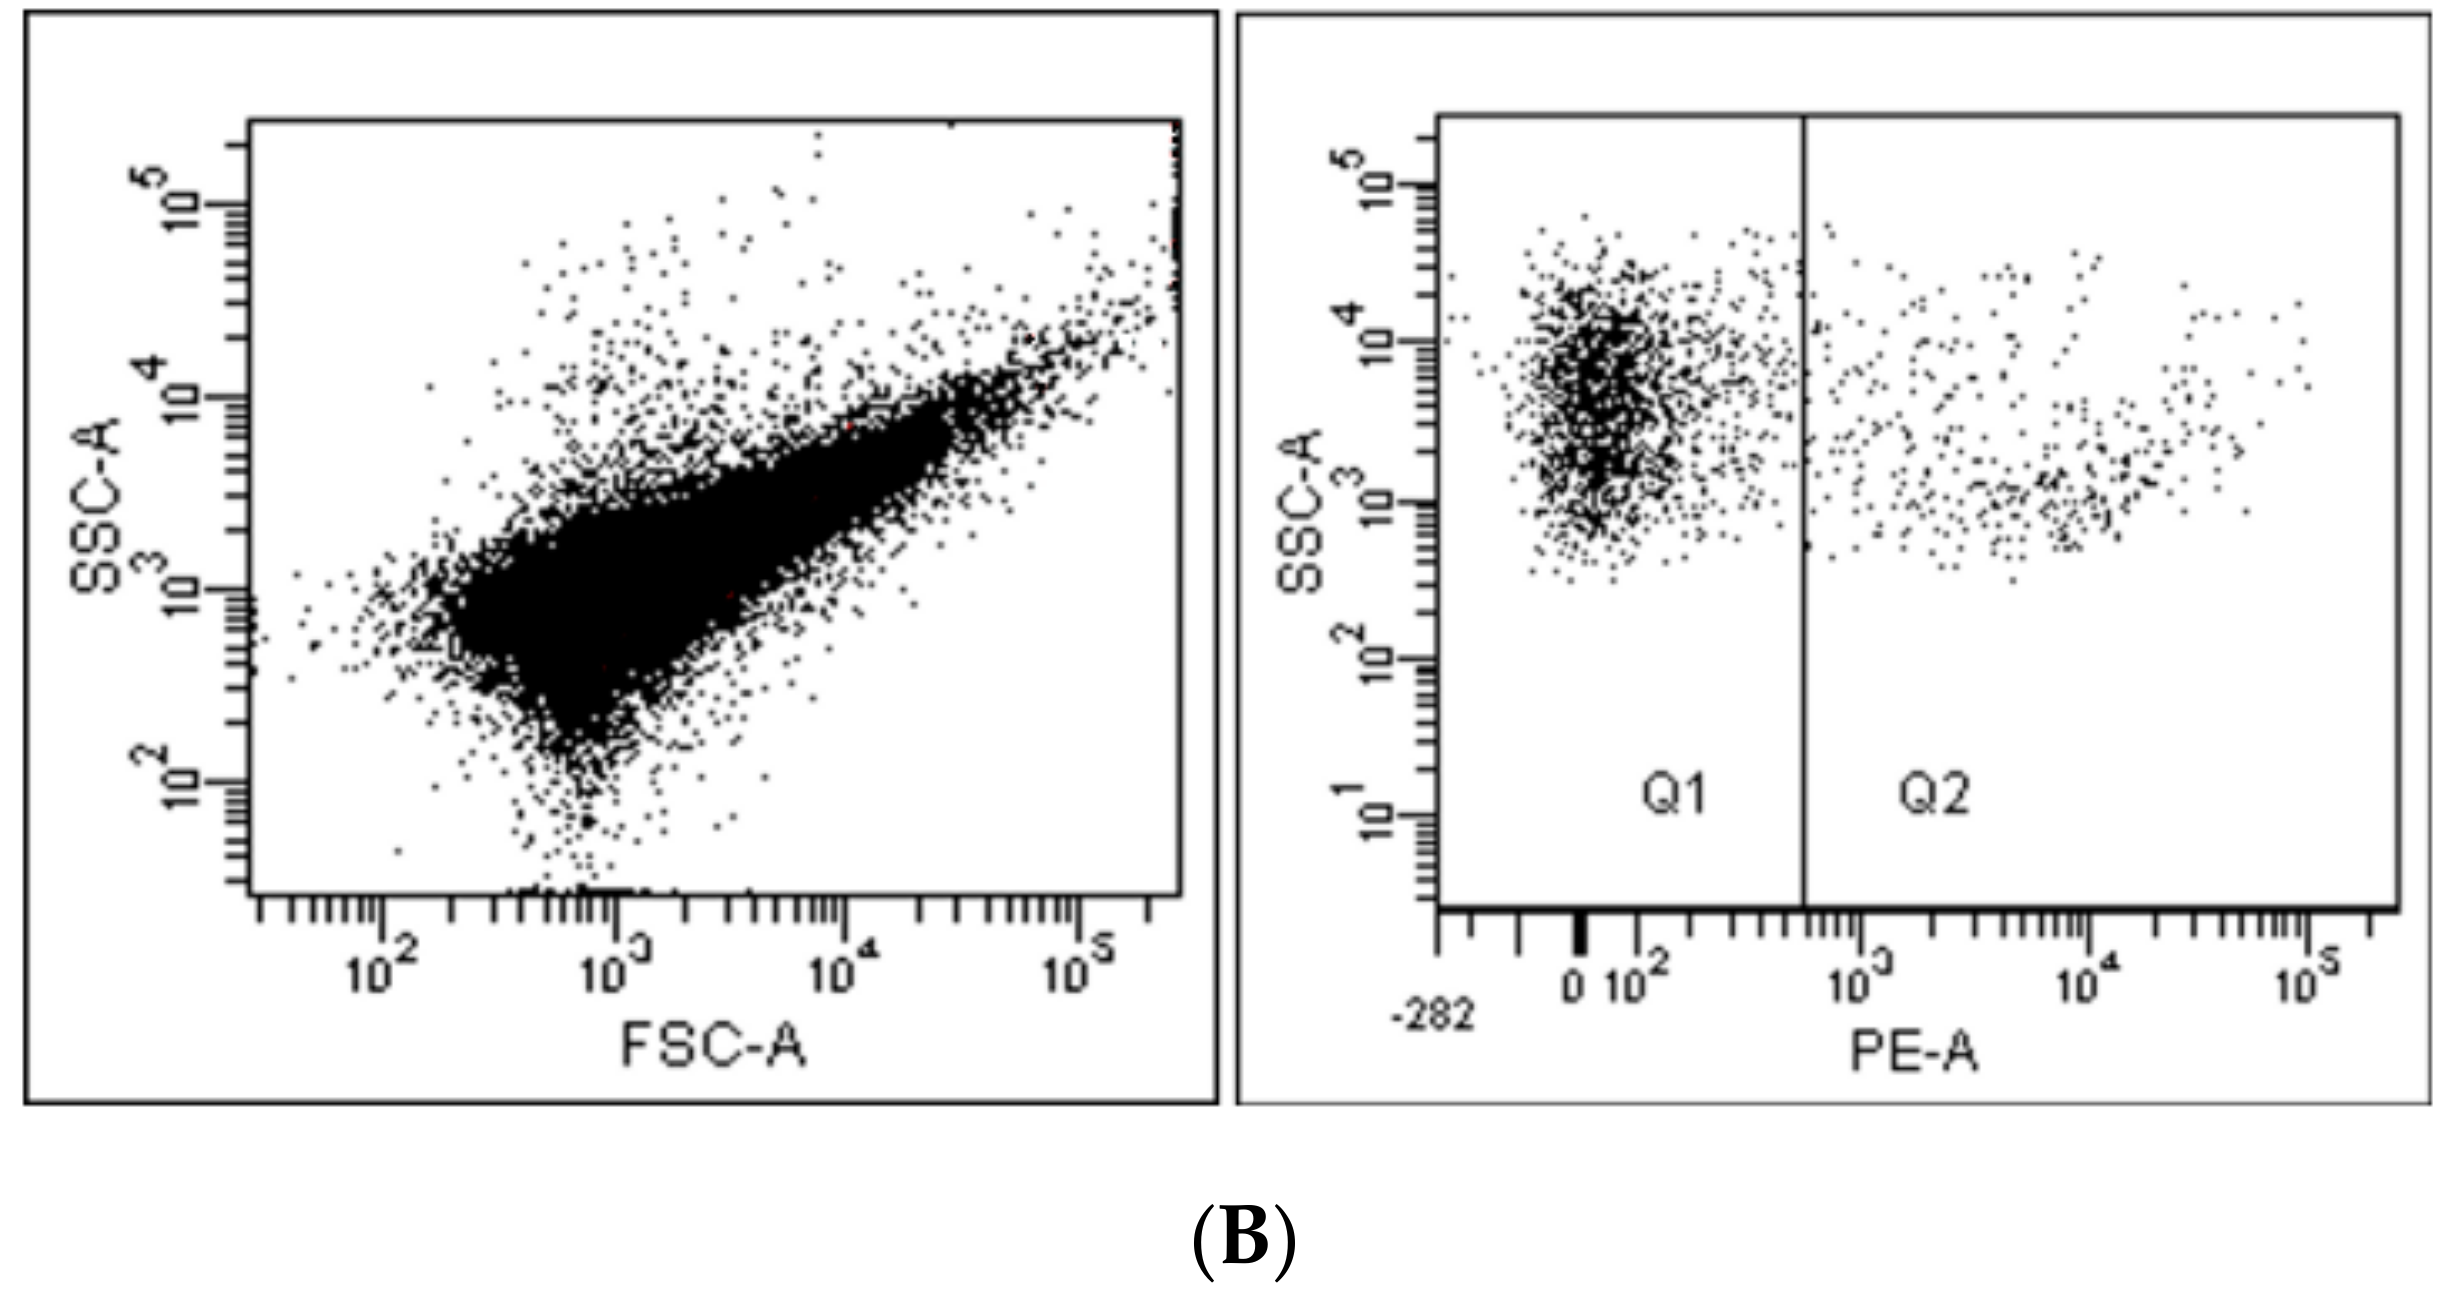
2. Flow Cytometry and Related Methods
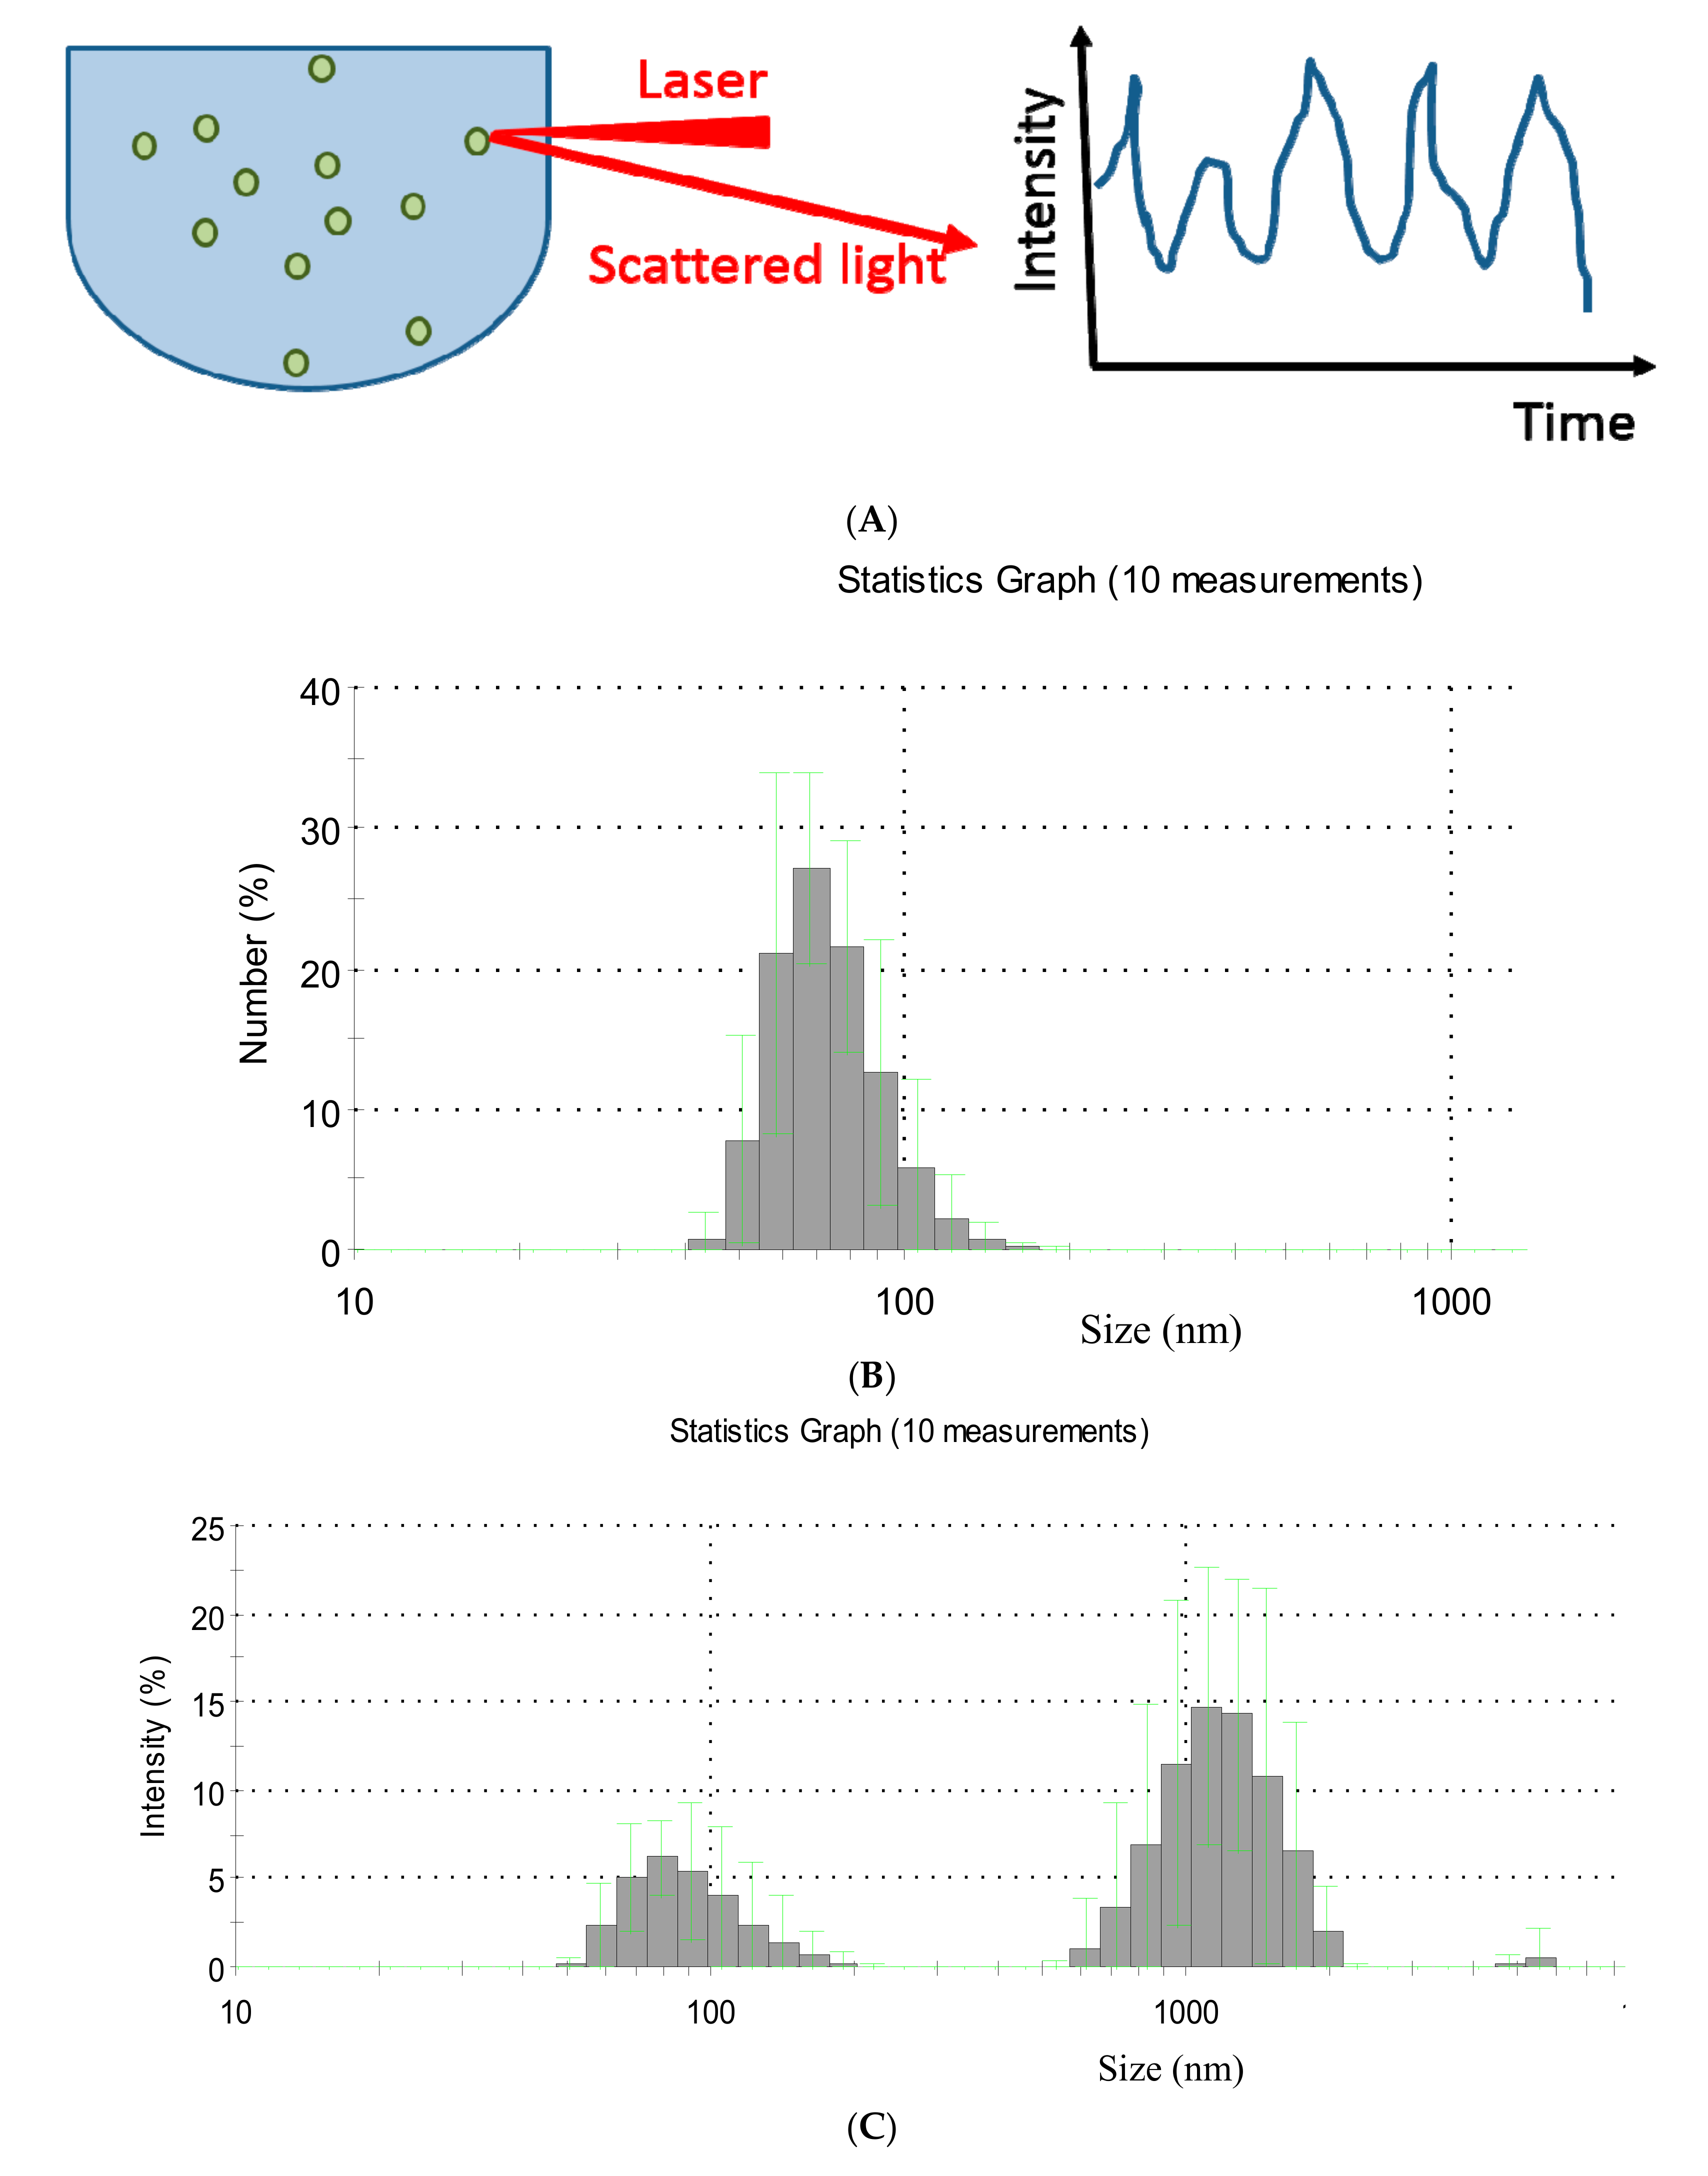
2.1. Dynamic Light Scattering
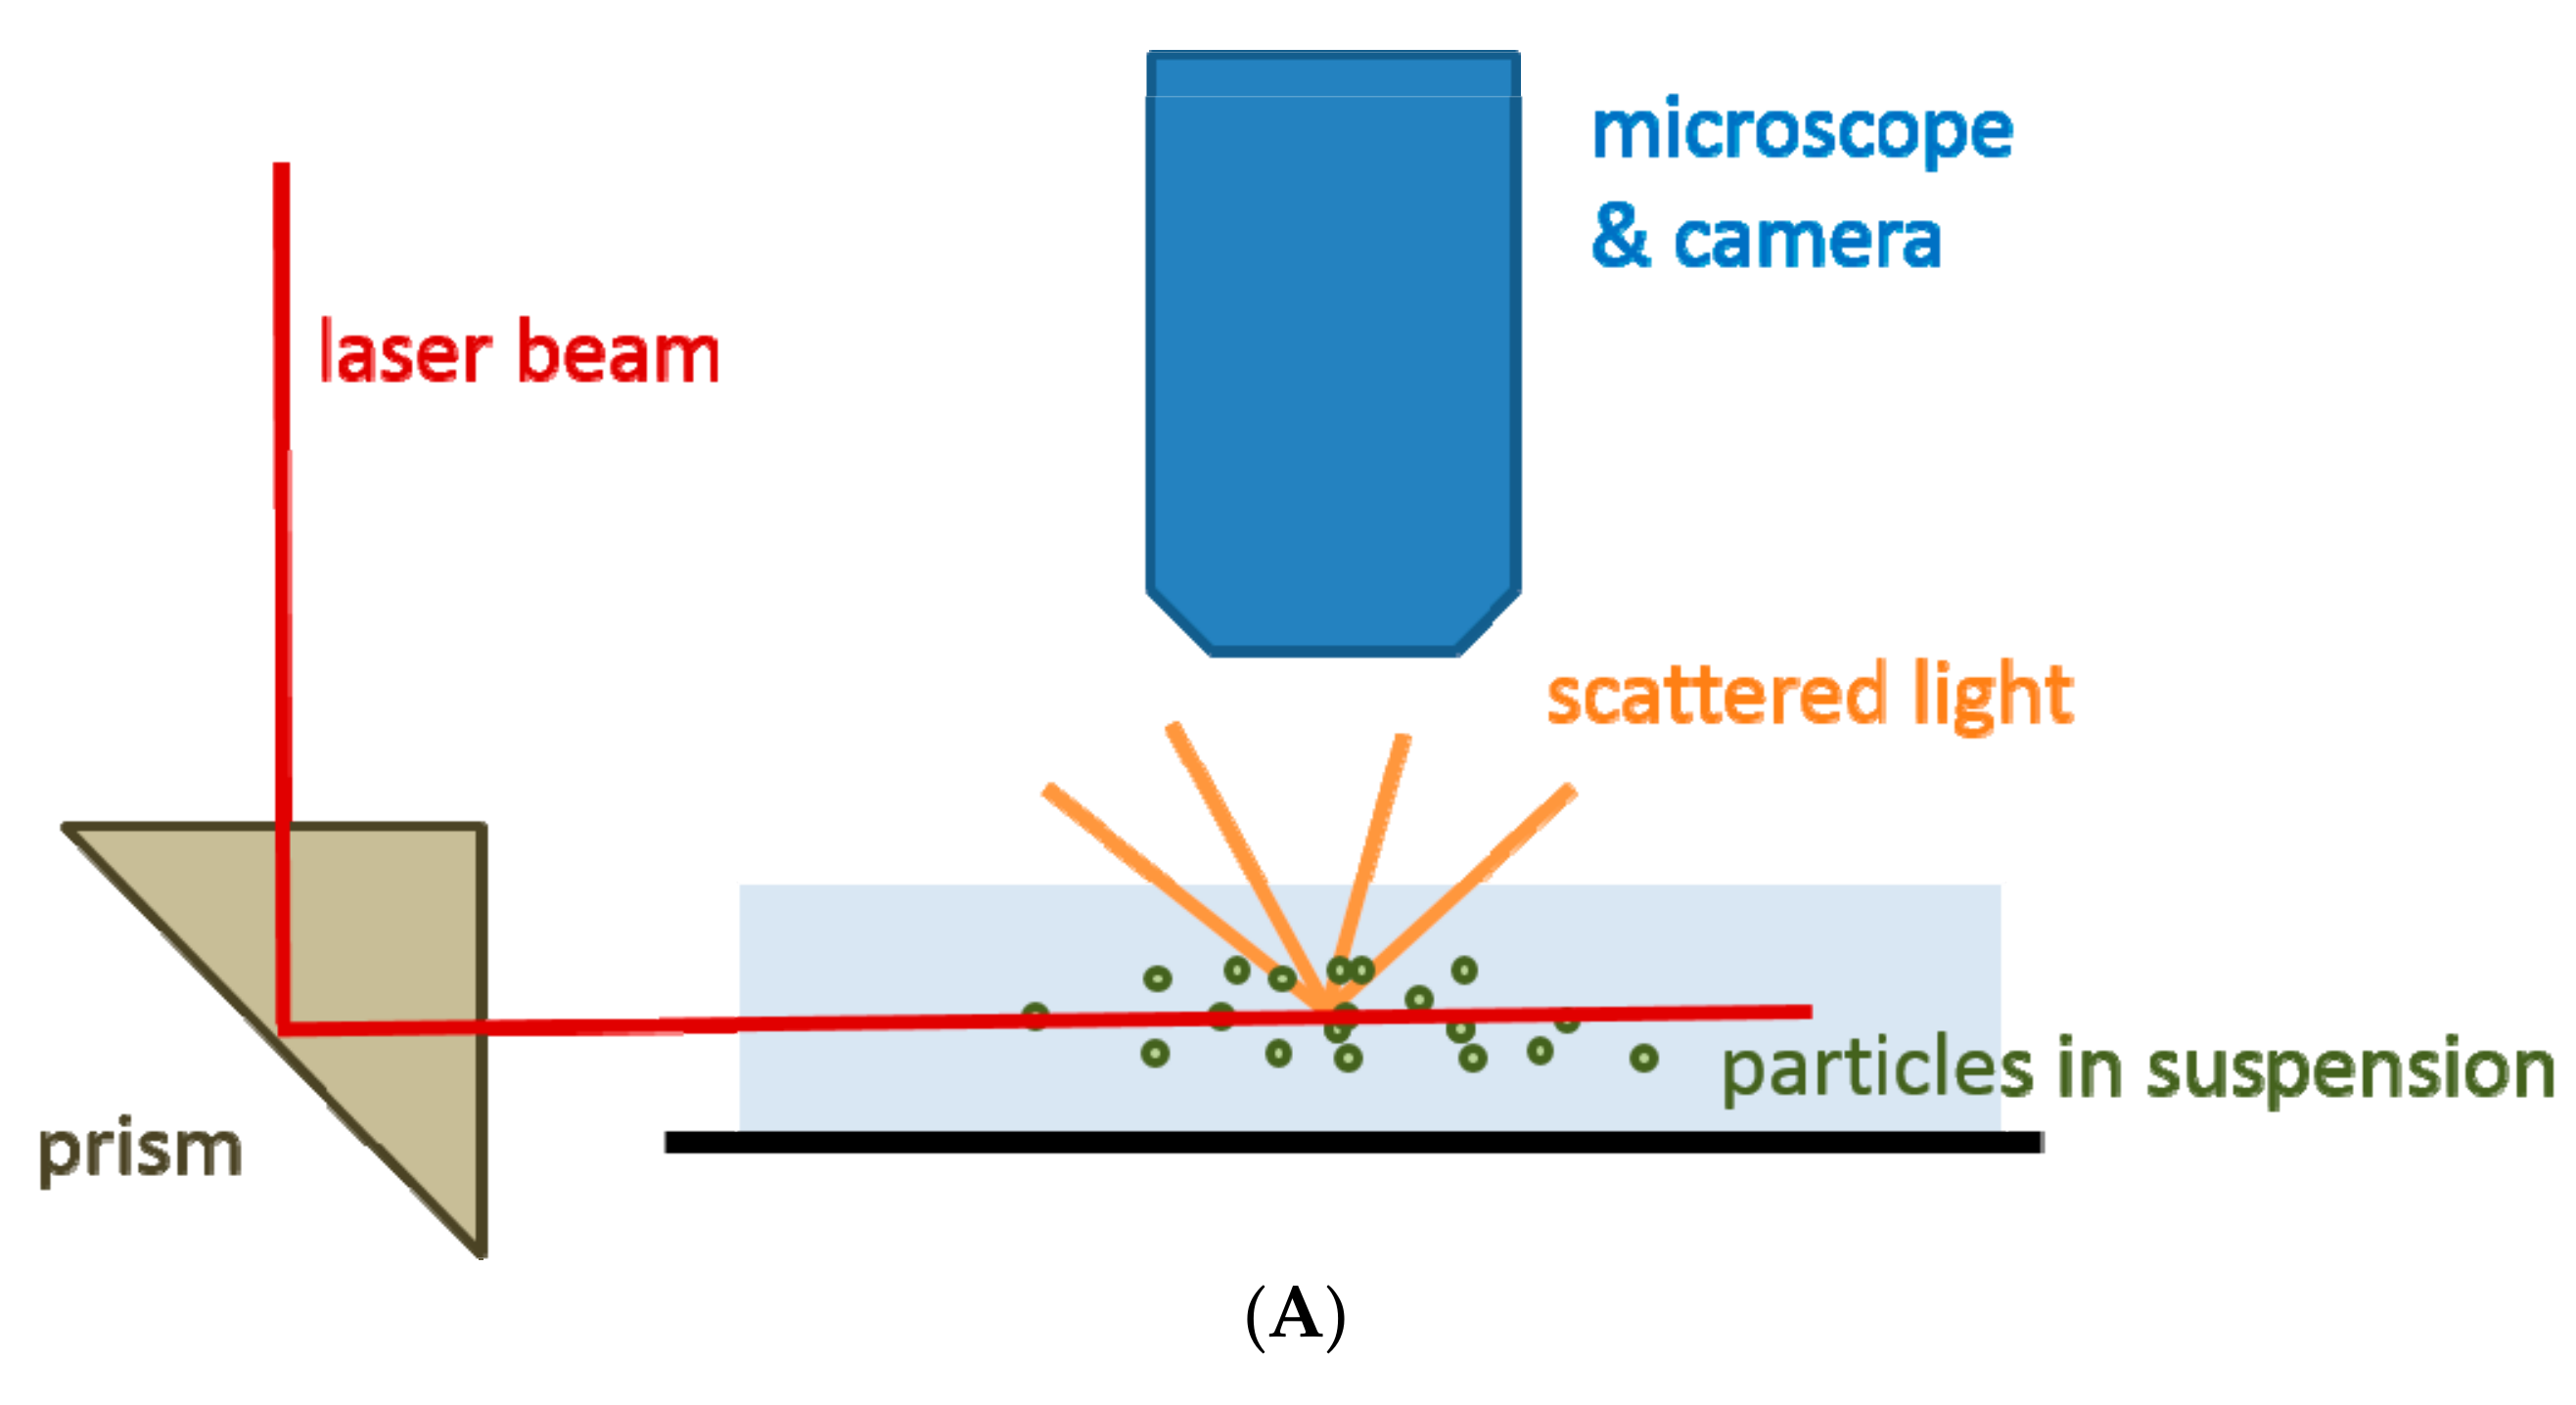
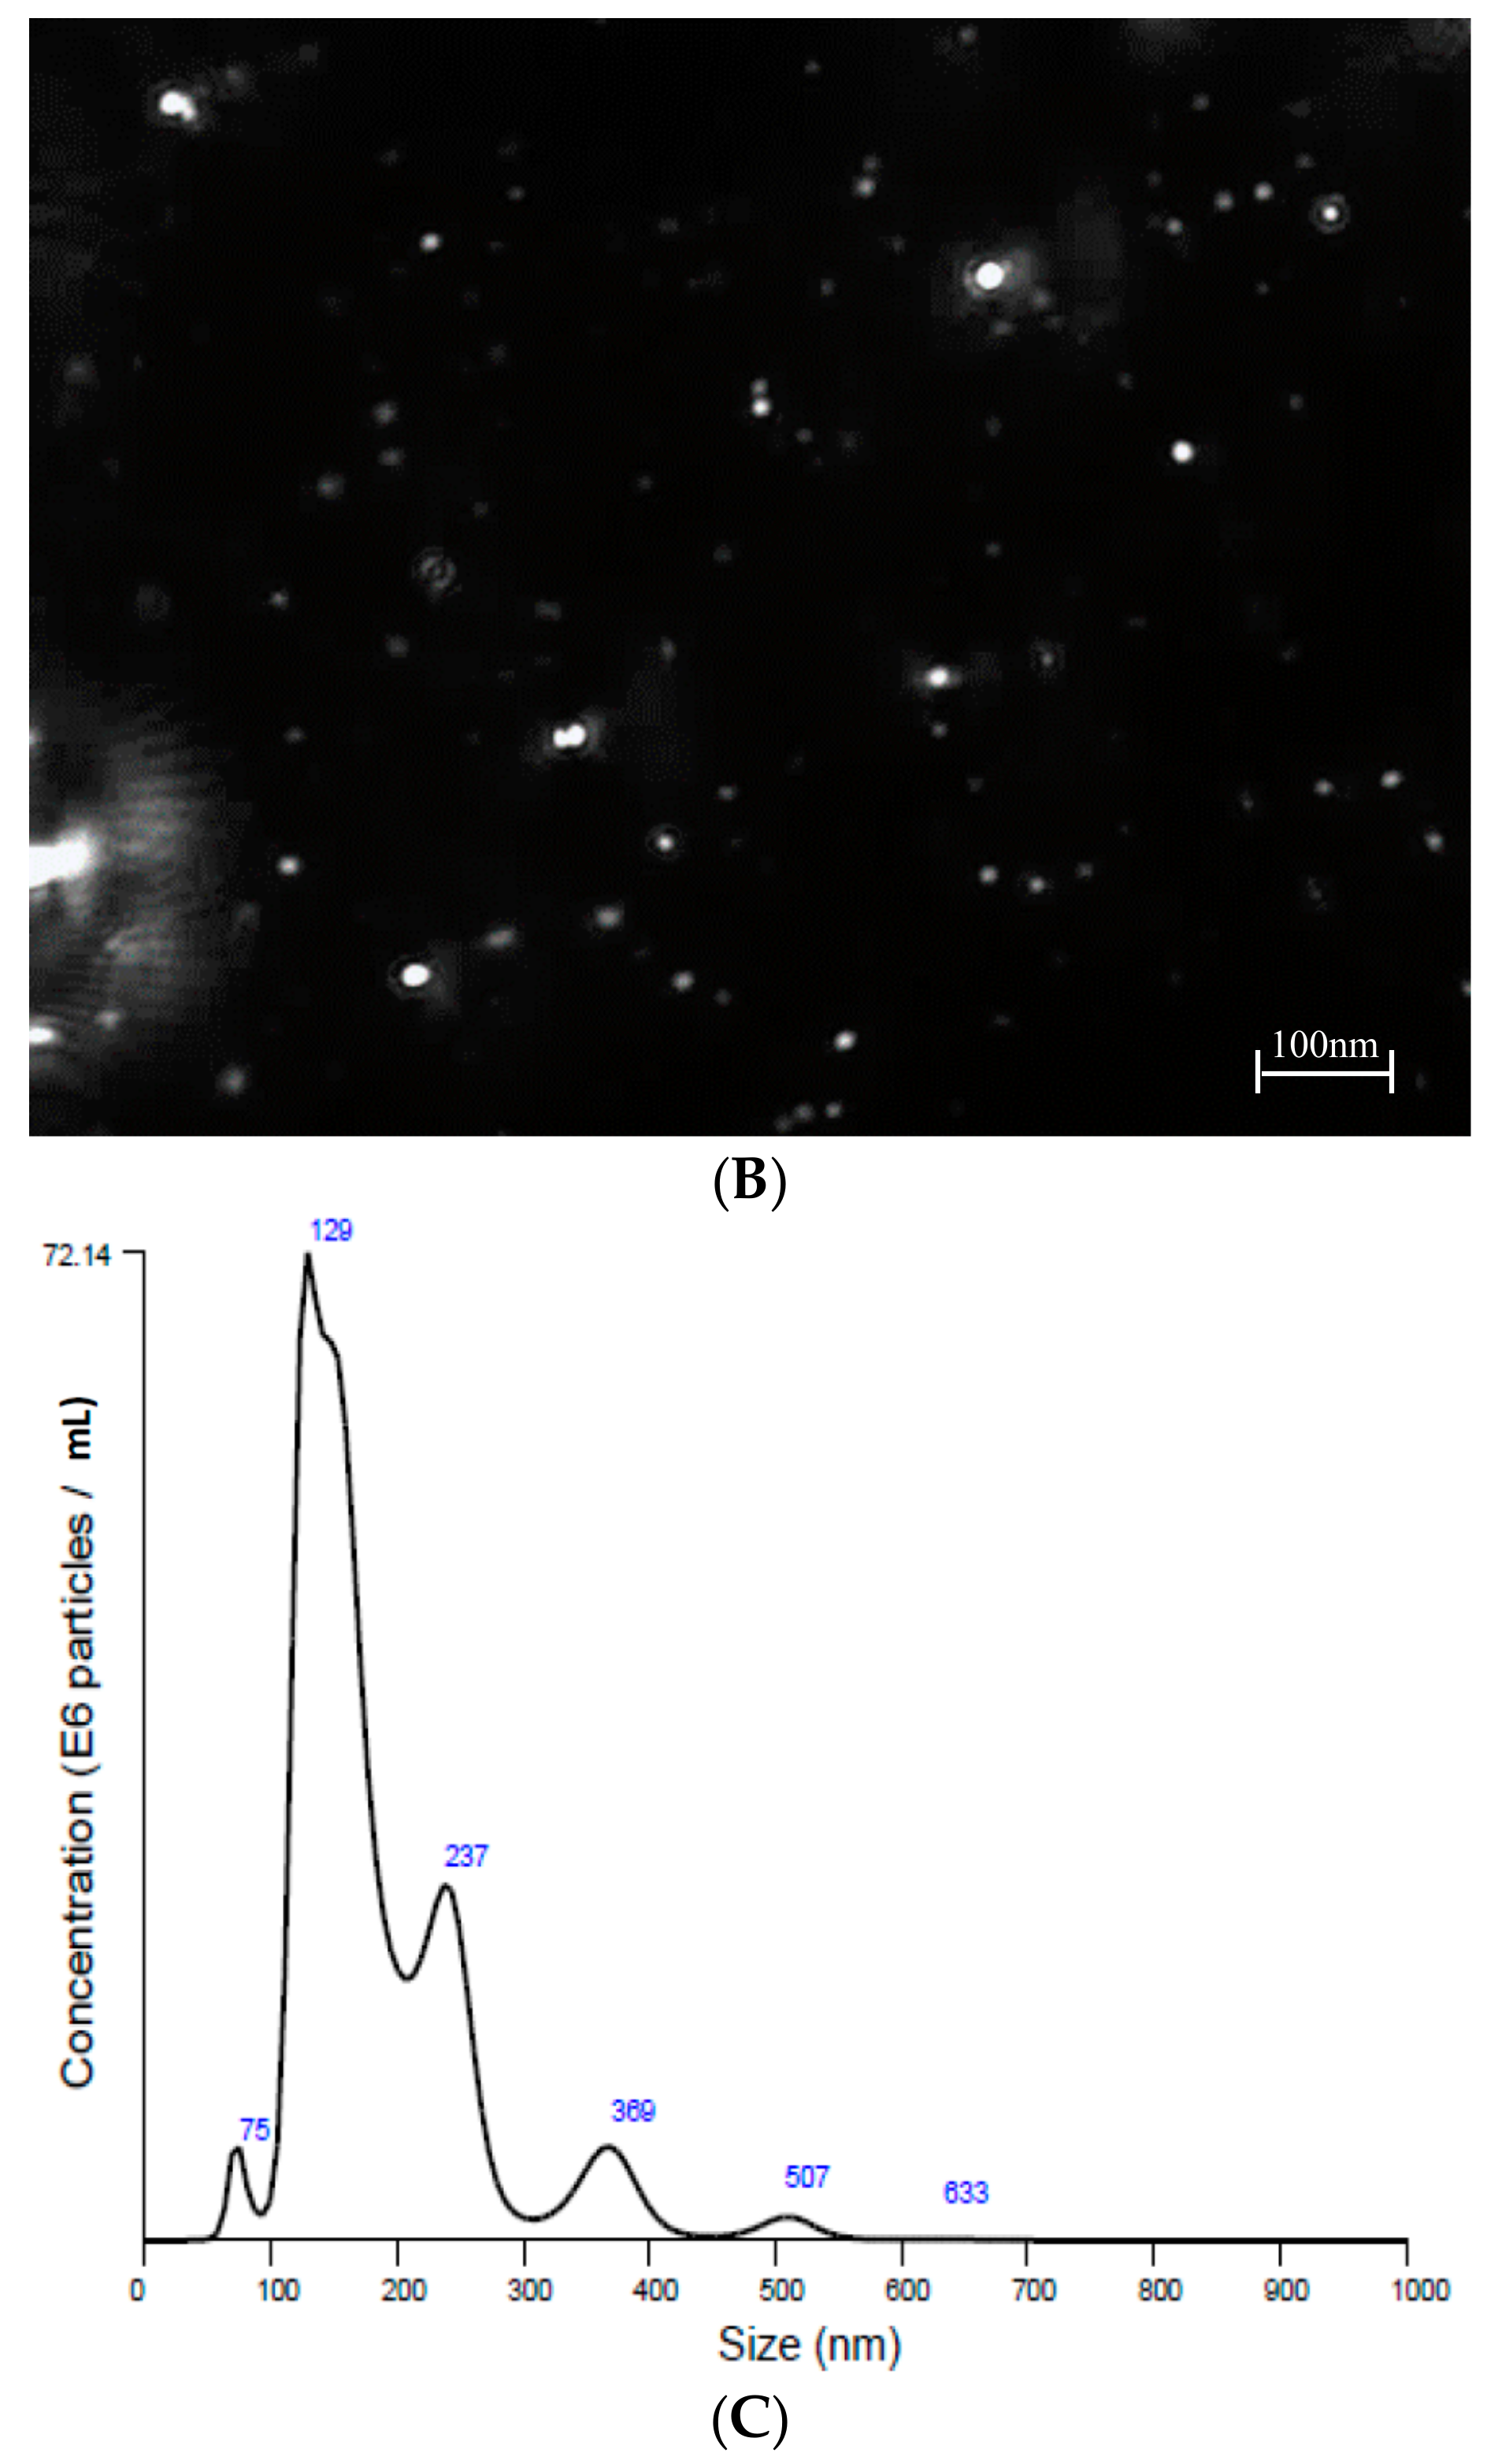
2.2. Nanoparticle Tracking Analysis
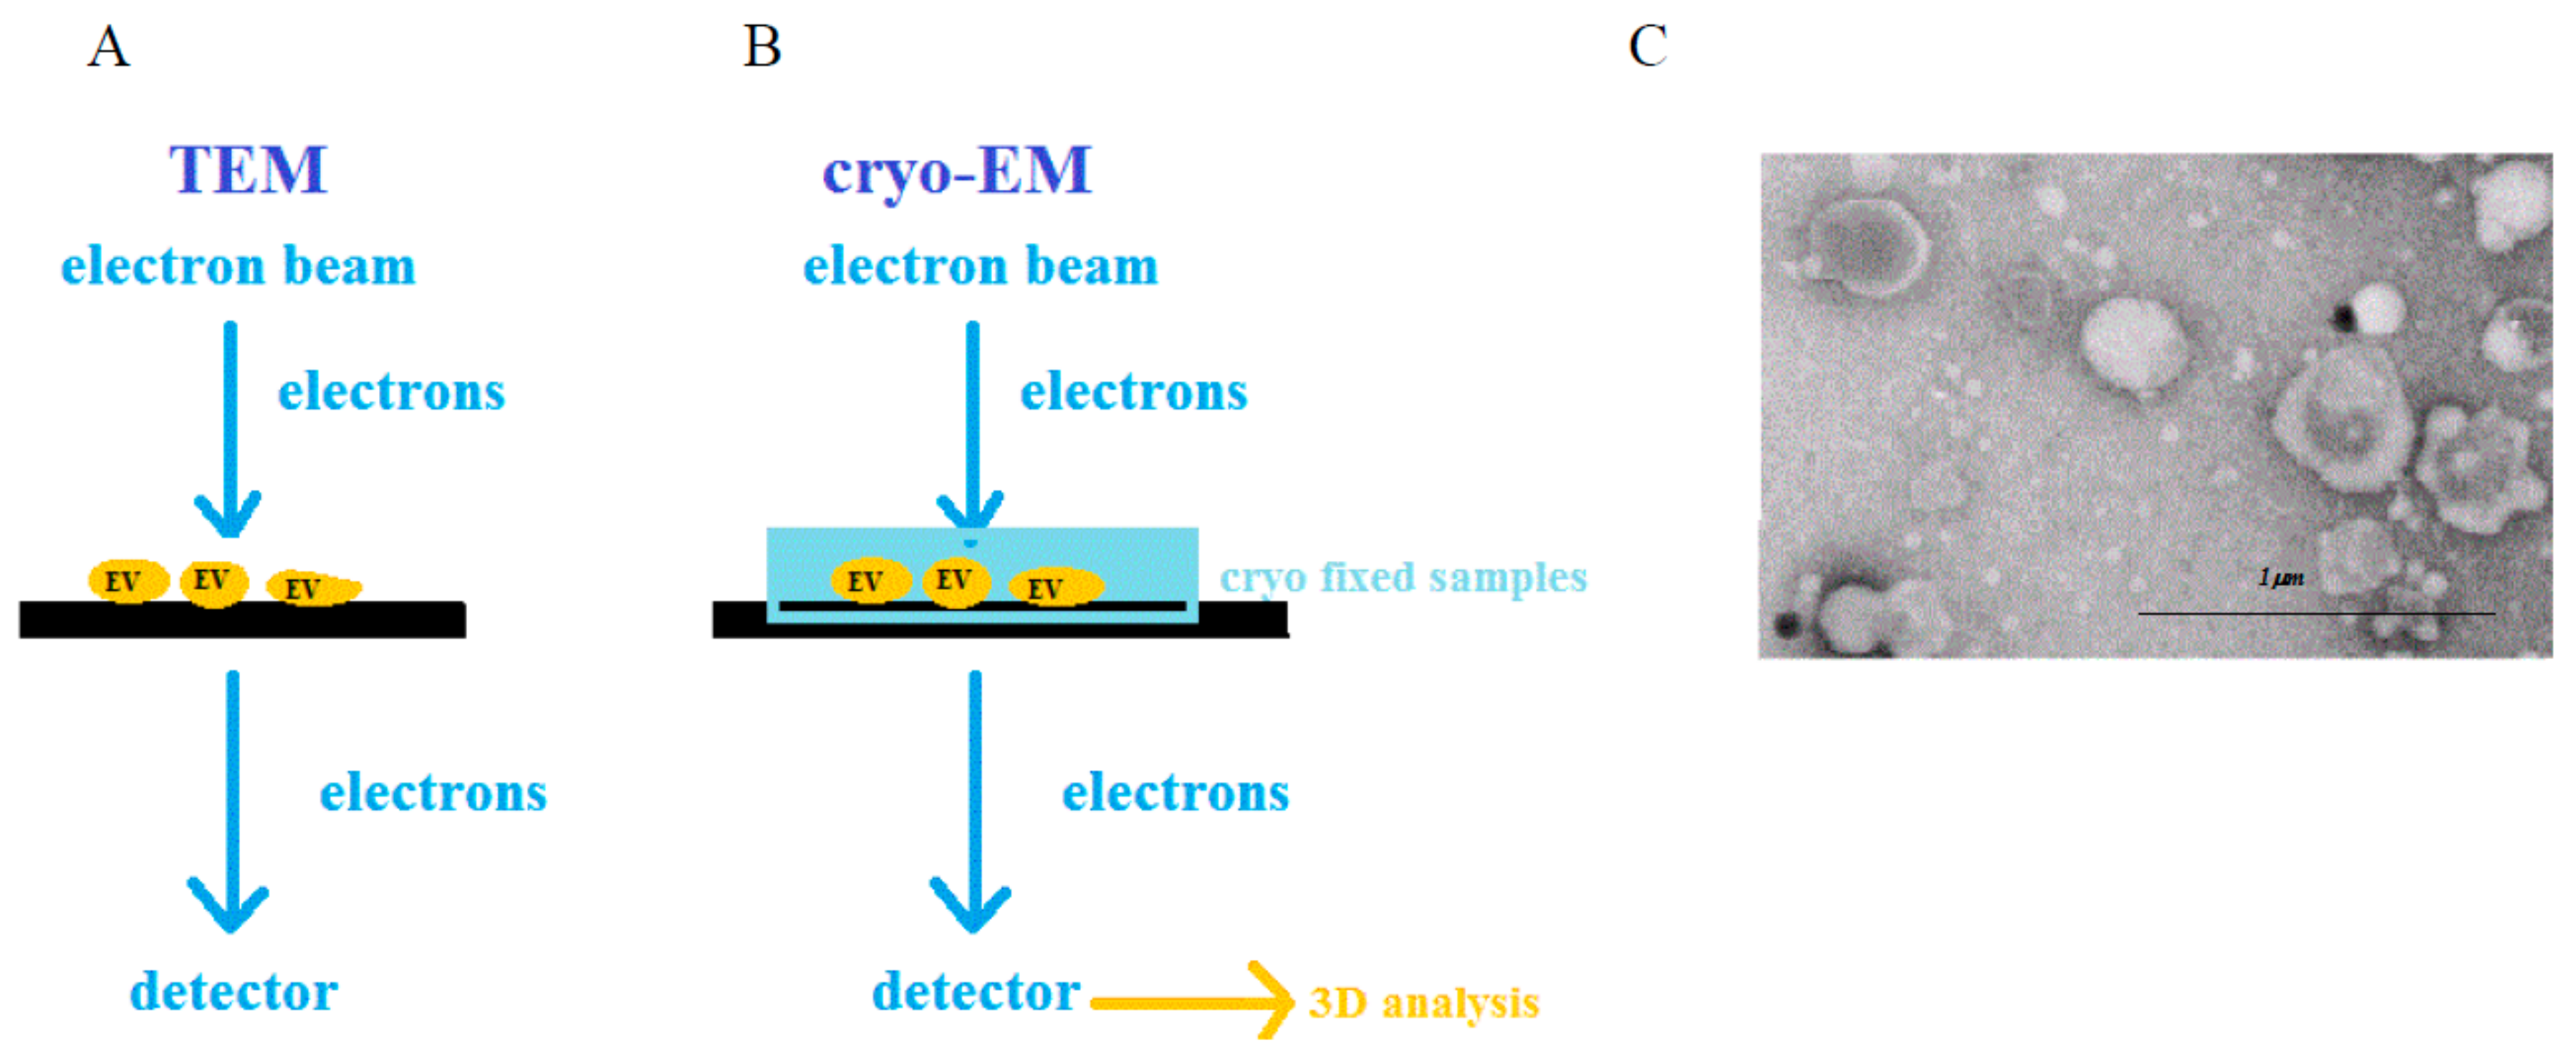
2.3. Electron Microscopy
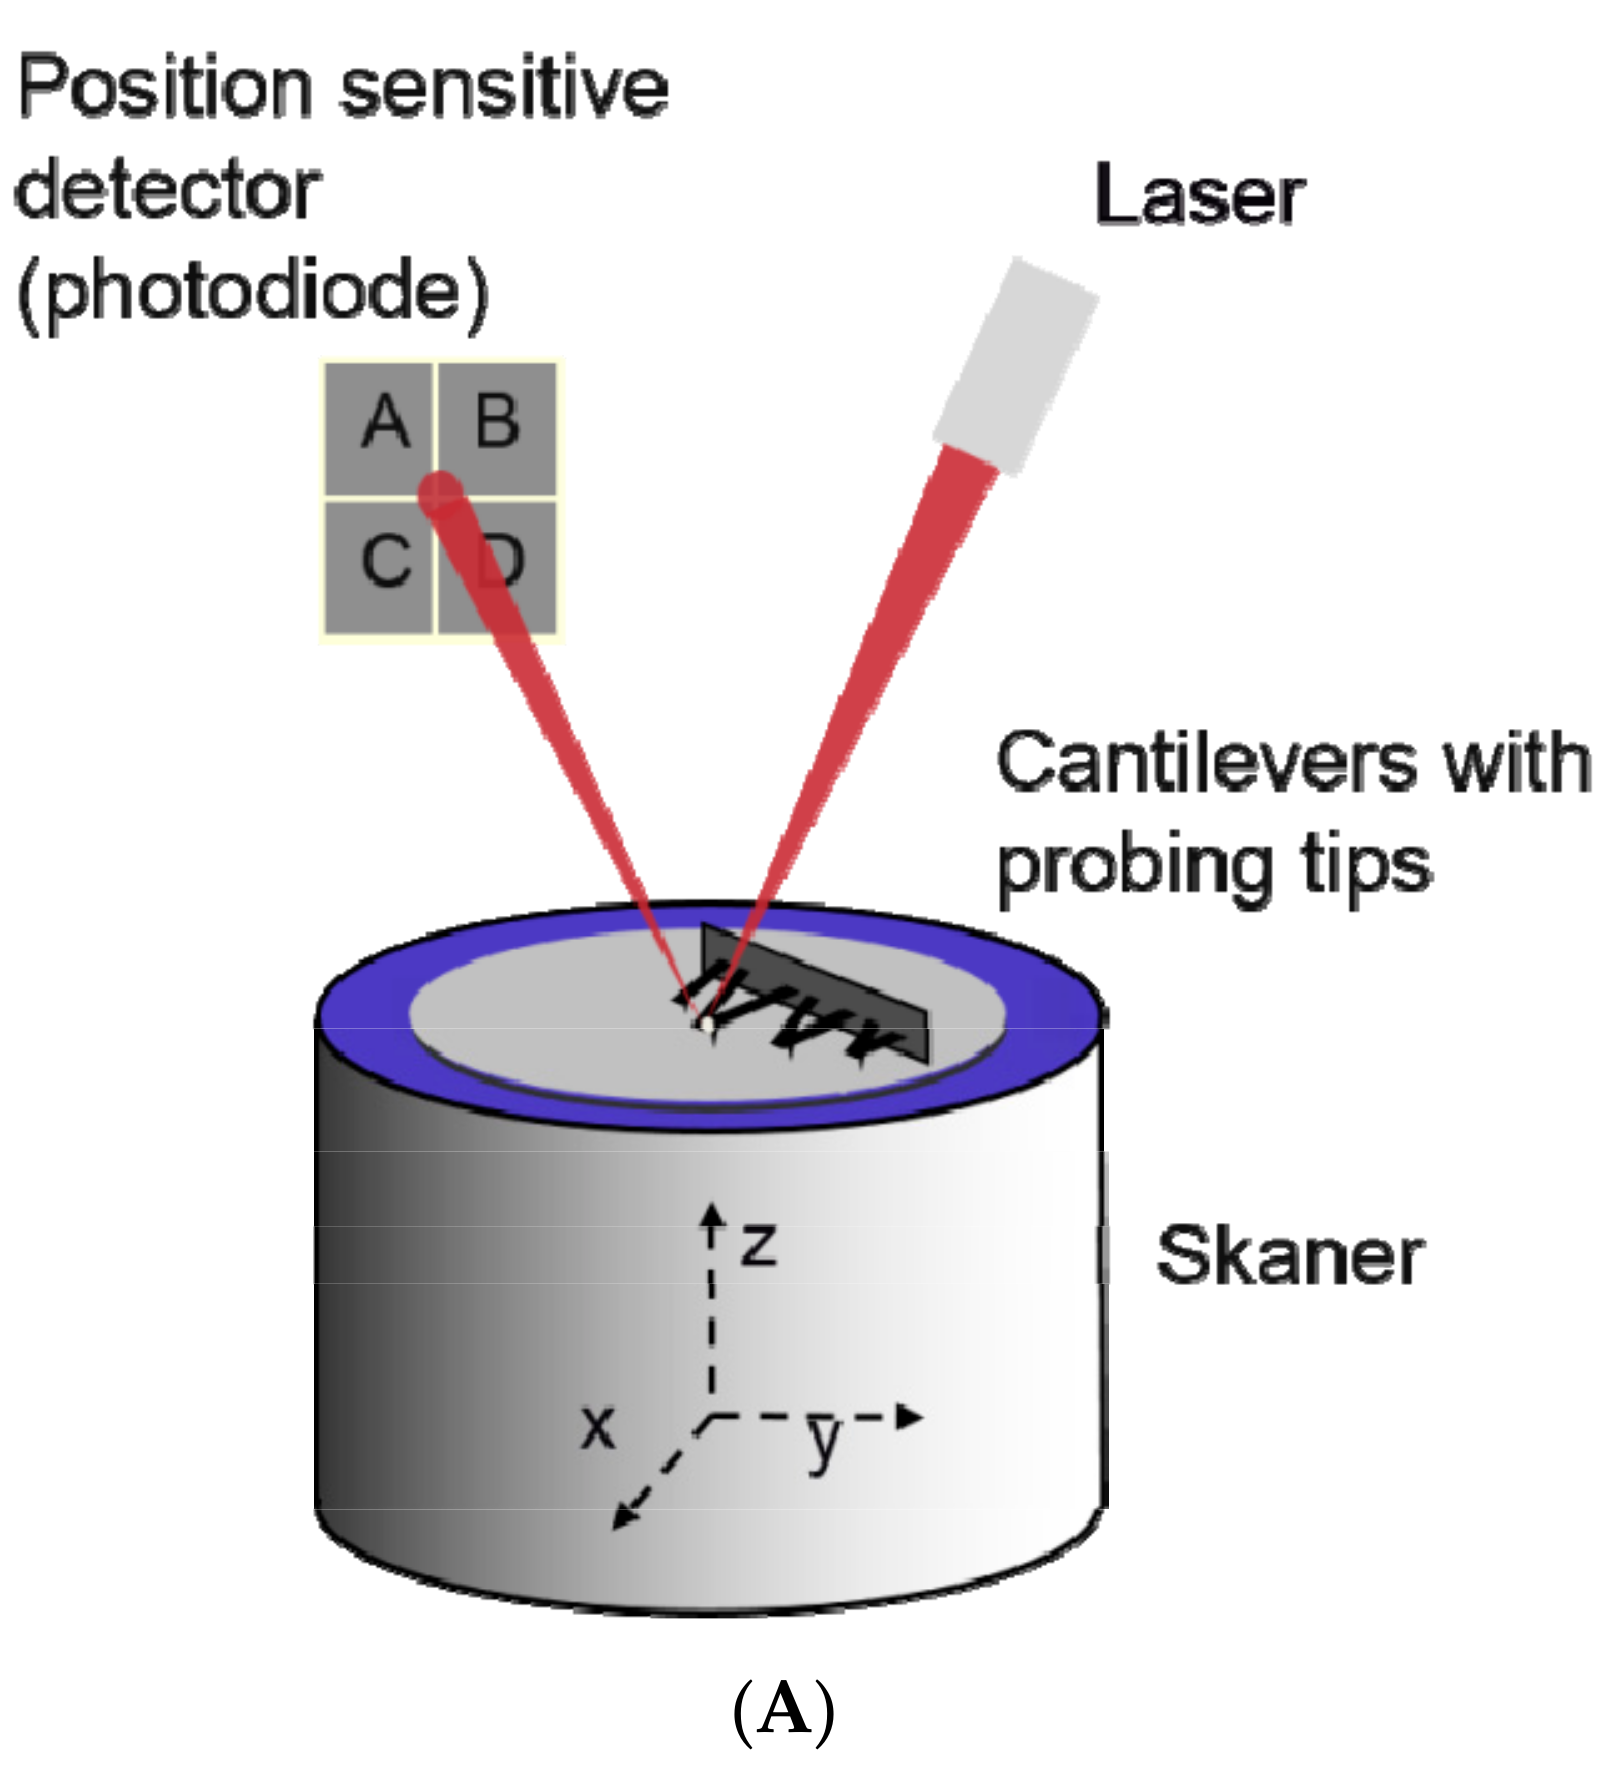
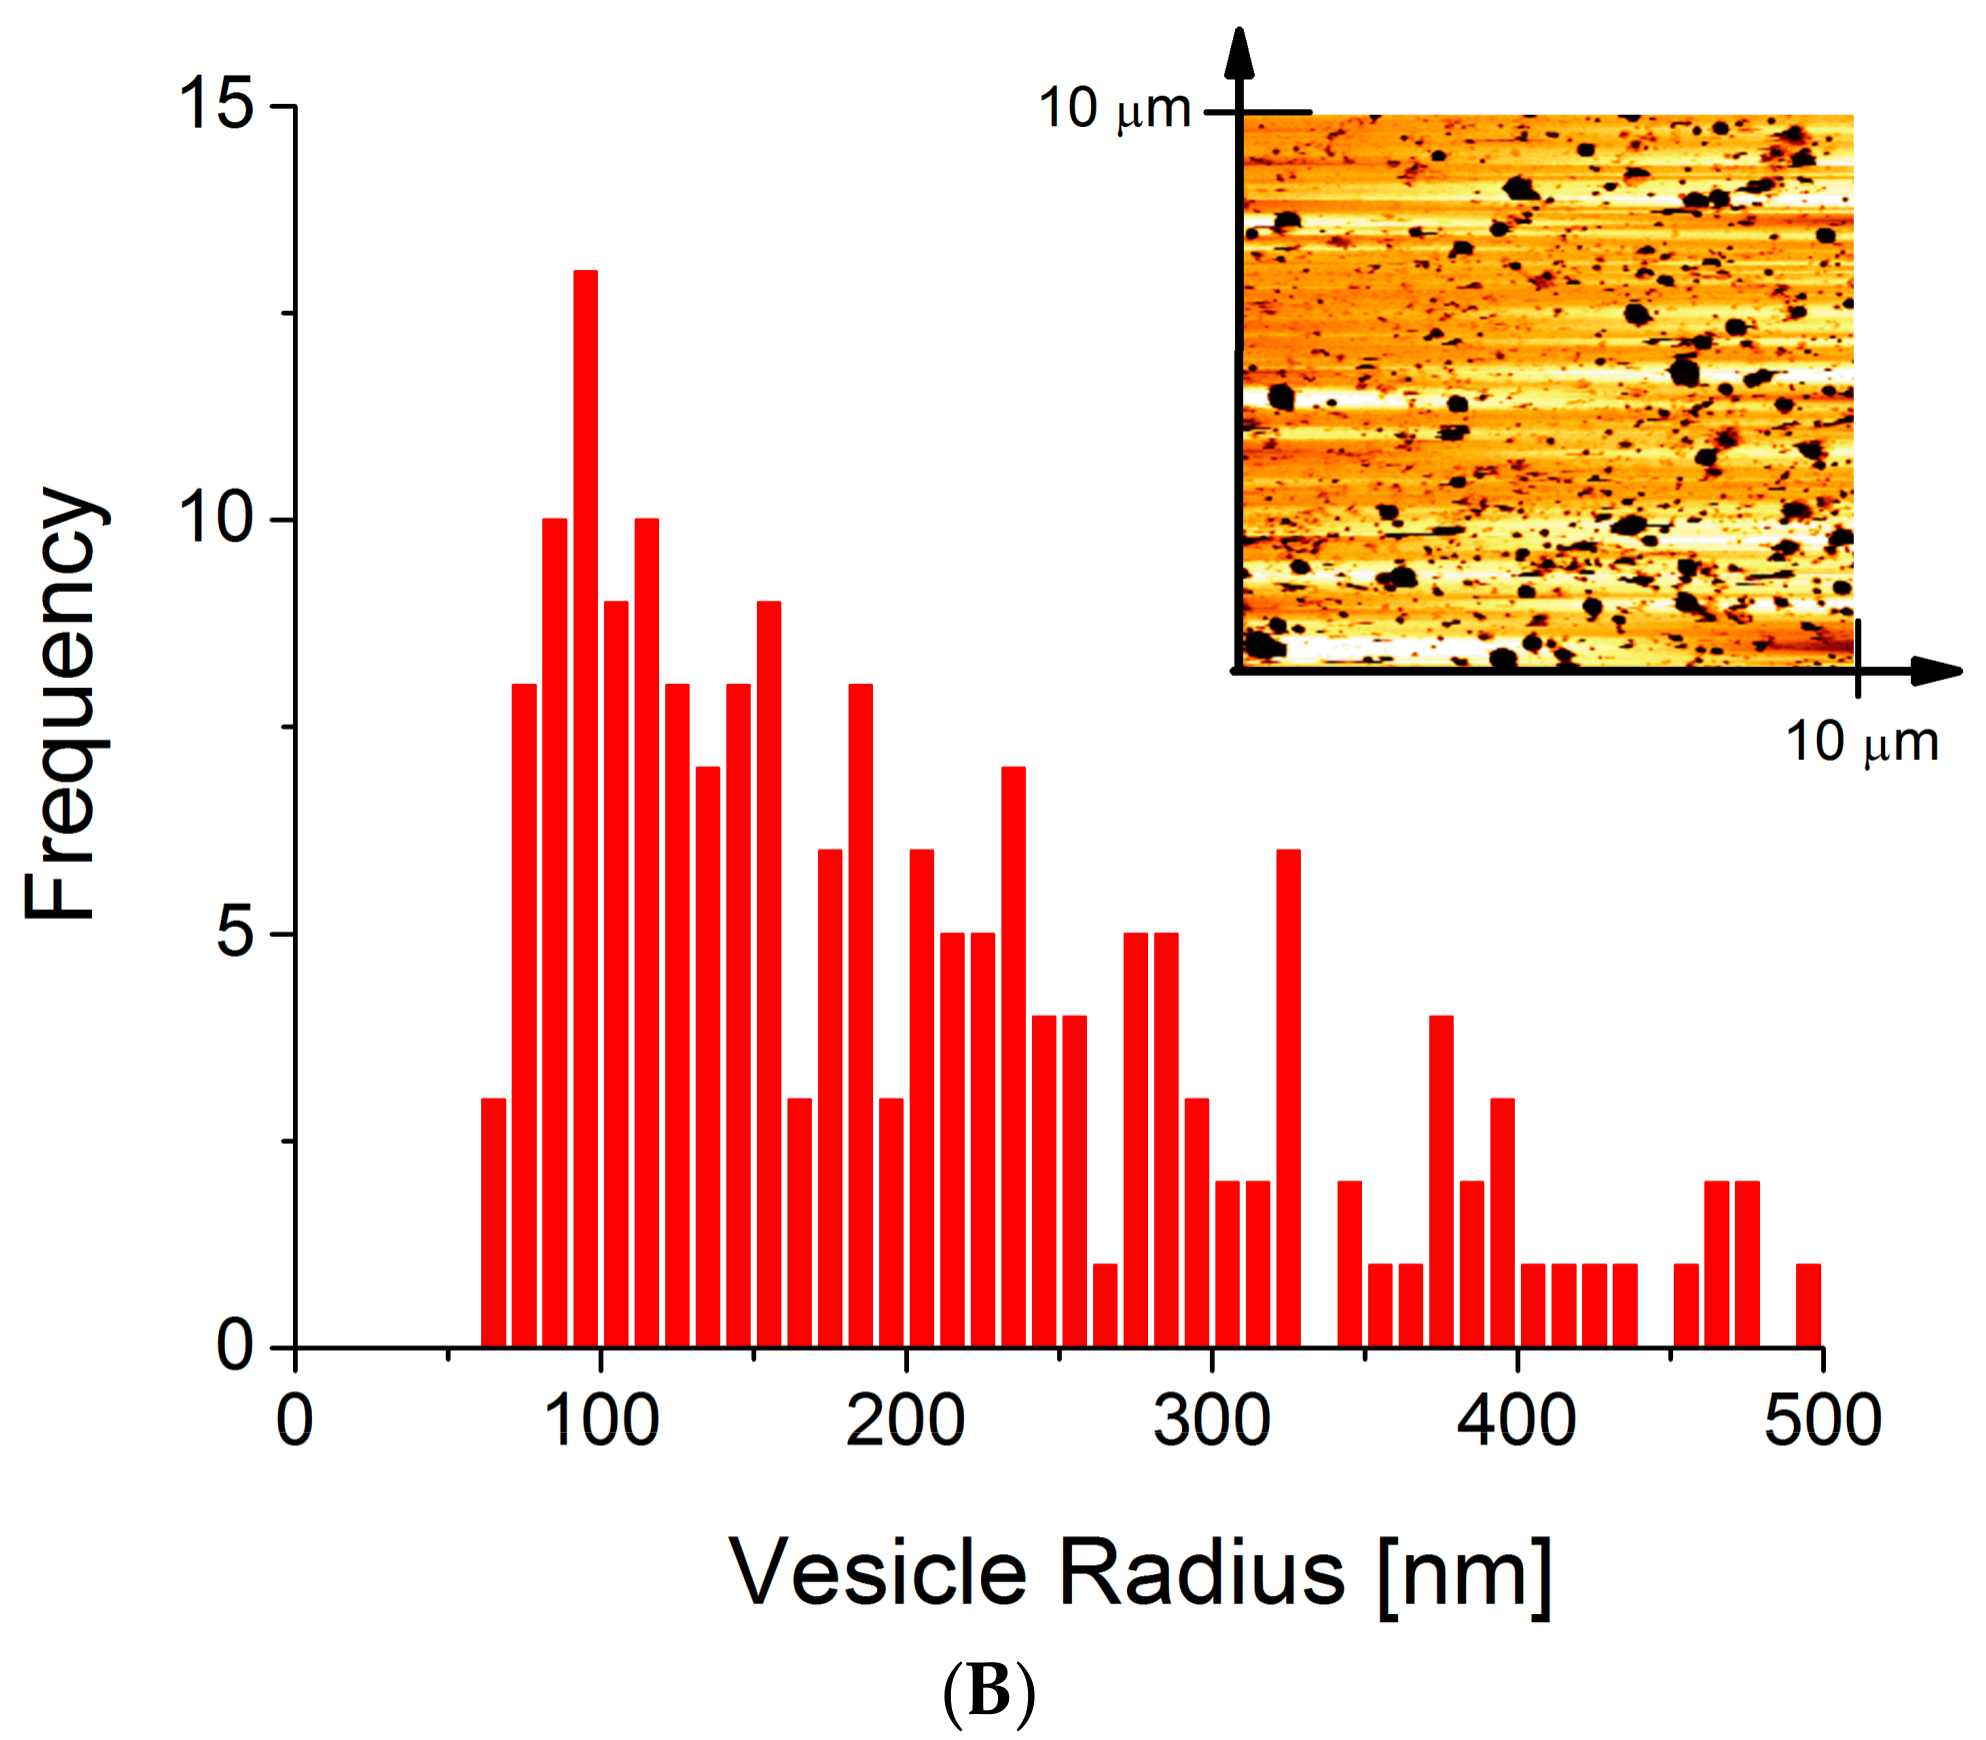
2.4. Atomic Force Microscopy
2.5. Other Methods
3. Summary
Acknowledgments
Author Contributions
Conflicts of Interest
Abbreviations
| AFM | Atomic force microscopy |
| DLS | Dynamic light scattering |
| ELISA | Enzyme-linked immunosorbent assay |
| EV | Extracellular vesicle |
| FCS | Fluorescence correlation spectroscopy |
| FSC | Forward scatter |
| MV | Microvesicle |
| MVB | Multivesicular body |
| NTA | Nanoparticle tracking analysis |
| SSC | Side scatter |
| STED | Stimulated emission depletion microscopy |
| TEM | Transmission electron microscopy |
References
- Zomer, A.; Vendrig, T.; Hopmans, E.S.; van Eijndhoven, M.; Middeldorp, J.M.; Pegtel, D.M. Exosomes. Commun. Integr. Biol. 2010, 3, 447–450. [Google Scholar] [CrossRef] [PubMed]
- Valadi, H.; Ekström, K.; Bossios, A.; Sjöstrand, M.; Lee, J.J.; Lötvall, J.O. Exosome-mediated transfer of mRNAs and microRNAs is a novel mechanism of genetic exchange between cells. Nat. Cell Biol. 2007, 9, 654–659. [Google Scholar] [CrossRef] [PubMed]
- Simpson, R.J.; Jensen, S.S.; Lim, J.W.E. Proteomic profiling of exosomes: Current perspectives. Proteomics 2008, 8, 4083–4099. [Google Scholar] [CrossRef] [PubMed]
- Subra, C.; Laulagnier, K.; Perret, B.; Record, M. Exosome lipidomics unravels lipid sorting at the level of multivesicular bodies. Biochimie 2007, 89, 205–212. [Google Scholar] [CrossRef] [PubMed]
- Théry, C.; Zitvogel, L.; Amigorena, S. Exosomes: Composition, biogenesis and function. Nat. Rev. Immunol. 2002, 2, 569–579. [Google Scholar] [PubMed]
- Heijnen, H.F.; Schiel, A.E.; Fijnheer, R.; Geuze, H.J.; Sixma, J.J. Activated platelets release two types of membrane vesicles: Microvesicles by surface shedding and exosomes derived from exocytosis of multivesicular bodies and α-granules. Blood 1999, 94, 3791–3799. [Google Scholar] [PubMed]
- Mitchell, P.S.; Parkin, R.K.; Kroh, E.M.; Fritz, B.R.; Wyman, S.K.; Pogosova-Agadjanyan, E.L.; Peterson, A.; Noteboom, J.; O’Briant, K.C.; Allen, A.; et al. Circulating microRNAs as stable blood-based markers for cancer detection. Proc. Natl. Acad. Sci. USA 2008, 105, 10513–10518. [Google Scholar] [CrossRef] [PubMed]
- Rabinowits, G.; Gerçel-Taylor, C.; Day, J.M.; Taylor, D.D.; Kloecker, G.H. Exosomal microRNA: A diagnostic marker for lung cancer. Clin. Lung Cancer 2009, 10, 42–46. [Google Scholar] [CrossRef] [PubMed]
- Yáñez-Mó, M.; Siljander, P.R.-M.; Andreu, Z.; Zavec, A.B.; Borràs, F.E.; Buzas, E.I.; Buzas, K.; Casal, E.; Cappello, F.; Carvalho, J.; et al. Biological properties of extracellular vesicles and their physiological functions. J. Extracell. Vesicles 2015, 4, 27066. [Google Scholar] [CrossRef] [PubMed]
- Ratajczak, J.; Wysoczynski, M.; Hayek, F.; Janowska-Wieczorek, A.; Ratajczak, M.Z. Membrane-derived microvesicles: Important and underappreciated mediators of cell-to-cell communication. Leukemia 2006, 20, 1487–1495. [Google Scholar] [CrossRef] [PubMed]
- Schorey, J.S.; Bhatnagar, S. Exosome function: From tumor immunology to pathogen biology. Traffic 2008, 9, 871–881. [Google Scholar] [CrossRef] [PubMed]
- Piccin, A.; Murphy, W.G.; Smith, O.P. Circulating microparticles: Pathophysiology and clinical implications. Blood Rev. 2007, 21, 157–171. [Google Scholar] [CrossRef] [PubMed]
- Trajkovic, K.; Hsu, C.; Chiantia, S.; Rajendran, L.; Wenzel, D.; Wieland, F.; Schwille, P.; Brügger, B.; Simons, M. Ceramide triggers budding of exosome vesicles into multivesicular endosomes. Science 2008, 319, 1244–1247. [Google Scholar] [CrossRef] [PubMed]
- Wubbolts, R.; Leckie, R.S.; Veenhuizen, P.T.M.; Schwarzmann, G.; Möbius, W.; Hoernschemeyer, J.; Slot, J.W.; Geuze, H.J.; Stoorvogel, W. Proteomic and biochemical analyses of human B cell-derived exosomes: Potential implications for their function and multivesicular body formation. J. Biol. Chem. 2003, 278, 10963–10972. [Google Scholar] [CrossRef] [PubMed]
- Colombo, M.; Raposo, G.; Théry, C. Biogenesis, secretion, and intercellular interactions of exosomes and other extracellular Vesicles. Annu. Rev. Cell Dev. Biol. 2014, 30, 255–289. [Google Scholar] [CrossRef] [PubMed]
- Théry, C.; Ostrowski, M.; Segura, E. Membrane vesicles as conveyors of immune responses. Nat. Rev. Immunol. 2009, 9, 581–593. [Google Scholar] [CrossRef] [PubMed]
- Cocucci, E.; Racchetti, G.; Meldolesi, J. Shedding microvesicles: Artefacts no more. Trends Cell Biol. 2009, 19, 43–51. [Google Scholar] [CrossRef] [PubMed]
- Győrgy, B.; Szabó, T.G.; Pásztói, M.; Pál, Z.; Misják, P.; Aradi, B.; László, V.; Pállinger, E.; Pap, E.; Kittel, A.; et al. Membrane vesicles, current state-of-the-art: Emerging role of extracellular vesicles. Cell. Mol. life Sci. 2011, 68, 2667–2688. [Google Scholar] [CrossRef] [PubMed]
- Baj-Krzyworzeka, M.; Szatanek, R.; Wȩglarczyk, K.; Baran, J.; Urbanowicz, B.; Brański, P.; Ratajczak, M.Z.; Zembala, M. Tumour-derived microvesicles carry several surface determinants and mRNA of tumour cells and transfer some of these determinants to monocytes. Cancer Immunol. Immunother. 2006, 55, 808–818. [Google Scholar] [CrossRef] [PubMed]
- Sadallah, S.; Eken, C.; Schifferli, J.A. Ectosomes as modulators of inflammation and immunity. Clin. Exp. Immunol. 2011, 163, 26–32. [Google Scholar] [CrossRef] [PubMed]
- Wysoczynski, M.; Ratajczak, M.Z. Lung cancer secreted microvesicles: Underappreciated modulators of microenvironment in expanding tumors. Int. J. Cancer 2009, 125, 1595–1603. [Google Scholar] [CrossRef] [PubMed]
- Baj-Krzyworzeka, M.; Majka, M.; Pratico, D.; Ratajczak, J.; Vilaire, G.; Kijowski, J.; Reca, R.; Janowska-Wieczorek, A.; Ratajczak, M.Z. Platelet-derived microparticles stimulate proliferation, survival, adhesion, and chemotaxis of hematopoietic cells. Exp. Hematol. 2002, 30, 450–459. [Google Scholar] [CrossRef]
- Baj-Krzyworzeka, M.; Szatanek, R.; Weglarczyk, K.; Baran, J.; Zembala, M. Tumour-derived microvesicles modulate biological activity of human monocytes. Immunol. Lett. 2007, 113, 76–82. [Google Scholar] [CrossRef] [PubMed]
- Van Niel, G.; Porto-Carreiro, I.; Simoes, S.; Raposo, G. Exosomes: A common pathway for a specialized function. J. Biochem. 2006, 140, 13–21. [Google Scholar] [CrossRef] [PubMed]
- Lötvall, J.; Hill, A.F.; Hochberg, F.; Buzás, E.I.; di Vizio, D.; Gardiner, C.; Gho, Y.S.; Kurochkin, I.V.; Mathivanan, S.; Quesenberry, P.; et al. Minimal experimental requirements for definition of extracellular vesicles and their functions: A position statement from the International Society for Extracellular Vesicles. J. Extracell. Vesicles 2014, 3, 26913. [Google Scholar] [CrossRef] [PubMed]
- Ratajczak, M.Z.; Ratajczak, J. Horizontal transfer of RNA and proteins between cells by extracellular microvesicles: 14 Years later. Clin. Transl. Med. 2016, 5, 7. [Google Scholar] [CrossRef] [PubMed]
- Belting, M.; Wittrup, A. Nanotubes, exosomes, and nucleic acid-binding peptides provide novel mechanisms of intercellular communication in eukaryotic cells: Implications in health and disease. J. Cell Biol. 2008, 183, 1187–1191. [Google Scholar] [CrossRef] [PubMed]
- Boulanger, C.; Amabile, N.; Tedgui, A. Circulating microparticles: A potential prognostic marker for atherosclerotic vascular disease. Hypertension 2006, 48, 180–186. [Google Scholar] [CrossRef] [PubMed]
- Madhavan, B.; Yue, S.; Galli, U.; Rana, S.; Gross, W.; Müller, M.; Giese, N.A.; Kalthoff, H.; Becker, T.; Büchler, M.W.; et al. Combined evaluation of a panel of protein and miRNA serum-exosome biomarkers for pancreatic cancer diagnosis increases sensitivity and specificity. Int. J. Cancer 2015, 136, 2616–2627. [Google Scholar] [CrossRef] [PubMed]
- Que, R.; Ding, G.; Chen, J.; Cao, L. Analysis of serum exosomal microRNAs and clinicopathologic features of patients with pancreatic adenocarcinoma. World J. Surg. Oncol. 2013, 11, 1–9. [Google Scholar] [CrossRef] [PubMed]
- Van der Pol, E.; Coumans, F.A.W.; Grootemaat, A.E.; Gardiner, C.; Sargent, I.L.; Harrison, P.; Sturk, A.; van Leeuwen, T.G.; Nieuwland, R. Particle size distribution of exosomes and microvesicles determined by transmission electron microscopy, flow cytometry, nanoparticle tracking analysis, and resistive pulse sensing. J. Thromb. Haemost. 2014, 12, 1182–1192. [Google Scholar] [CrossRef] [PubMed]
- Chandler, W.L.; Yeung, W.; Tait, J.F. A new microparticle size calibration standard for use in measuring smaller microparticles using a new flow cytometer. J. Thromb. Haemost. 2011, 9, 1216–1224. [Google Scholar] [CrossRef] [PubMed]
- Shapiro, H. Practical Flow Cytometry, 4th ed.; Wiley: Hoboken, NJ, USA, 2003. [Google Scholar]
- Steen, H.B. Flow cytometer for measurement of the light scattering of viral and other submicroscopic particles. Cytom. Part A 2004, 57, 94–99. [Google Scholar] [CrossRef] [PubMed]
- Robert, S.; Lacroix, R.; Poncelet, P.; Harhouri, K.; Bouriche, T.; Judicone, C.; Wischhusen, J.; Arnaud, L.; Dignat-George, F. High-sensitivity flow cytometry provides access to standardized measurement of small-size microparticles-brief report. Arterioscler. Thromb. Vasc. Biol. 2012, 32, 1054–1058. [Google Scholar] [CrossRef] [PubMed]
- Nebe-von-Caron, G. Standardization in microbial cytometry. Cytom. Part A 2009, 75, 86–89. [Google Scholar] [CrossRef] [PubMed]
- Baj-Krzyworzeka, M.; Baran, J.; Szatanek, R.; Siedlar, M. Application of Flow Cytometry in the Studies of Microparticles, Flow Cytometry—Recent Perspectives; InTech: Rijeka, Croatia, 2012; pp. 203–236. [Google Scholar]
- Nolan, J.P.; Stoner, S.A. A trigger channel threshold artifact in nanoparticle analysis. Cytom. Part A 2013, 83, 301–305. [Google Scholar] [CrossRef] [PubMed]
- Van der Vlist, E.J.; Nolte-’t Hoen, E.N.M.; Stoorvogel, W.; Arkesteijn, G.J.A.; Wauben, M.H.M. Fluorescent labeling of nano-sized vesicles released by cells and subsequent quantitative and qualitative analysis by high-resolution flow cytometry. Nat. Protoc. 2012, 7, 1311–1326. [Google Scholar] [CrossRef] [PubMed]
- Arraud, N.; Gounou, C.; Linares, R.; Brisson, A.R. A simple flow cytometry method improves the detection of phosphatidylserine-exposing extracellular vesicles. J. Thromb. Haemost. 2015, 13, 237–247. [Google Scholar] [CrossRef] [PubMed]
- Van der Pol, E.; Van Gemert, M.J.C.; Sturk, A.; Nieuwland, R.; Van Leeuwen, T.G. Single vs. swarm detection of microparticles and exosomes by flow cytometry. J. Thromb. Haemost. 2012, 10, 919–930. [Google Scholar] [CrossRef] [PubMed]
- Curl, C.L.; Bellair, C.J.; Harris, T.; Allman, B.E.; Harris, P.J.; Stewart, A.G.; Roberts, A.; Nugent, K.A.; Delbridge, L.M.D. Refractive index measurement in viable cells using quantitative phase-amplitude microscopy and confocal microscopy. Cytom. Part A 2005, 65, 88–92. [Google Scholar] [CrossRef] [PubMed]
- Orozco, A.F.; Lewis, D.E. Flow cytometric analysis of circulating microparticles in plasma. Cytom. Part A 2010, 77, 502–514. [Google Scholar] [CrossRef] [PubMed]
- Caby, M.-P.; Lankar, D.; Vincendeau-Scherrer, C.; Raposo, G.; Bonnerot, C. Exosomal-like vesicles are present in human blood plasma. Int. Immunol. 2005, 17, 879–887. [Google Scholar] [CrossRef] [PubMed]
- Coulter, W.I. Means for Counting Particles Suspended in a Fluid. US Patent No. 2,656,508, 20 October 1953. [Google Scholar]
- Ito, T.; Sun, L.; Henriquez, R.R.; Crooks, R.M. A carbon nanotube-based coulter nanoparticle counter. Acc. Chem. Res. 2004, 37, 937–945. [Google Scholar] [CrossRef] [PubMed]
- Zwicker, J.I. Impedance-based flow cytometry for the measurement of microparticles. Semin. Thromb. Hemost. 2010, 36, 819–823. [Google Scholar] [CrossRef] [PubMed]
- Headland, S.E.; Jones, H.R.; D’Sa, A.S.V.; Perretti, M.; Norling, L.V. Cutting-edge analysis of extracellular microparticles using ImageStream(X) imaging flow cytometry. Sci. Rep. 2014, 4, 5237. [Google Scholar] [CrossRef] [PubMed]
- Erdbrügger, U.; Rudy, C.K.; Etter, M.E.; Dryden, K.A.; Yeager, M.; Klibanov, A.L.; Lannigan, J. Imaging flow cytometry elucidates limitations of microparticle analysis by conventional flow cytometry. Cytom. Part A 2014, 85, 756–770. [Google Scholar] [CrossRef] [PubMed]
- Ortyn, W.E.; Hall, B.E.; George, T.C.; Frost, K.; Basiji, D.A.; Perry, D.J.; Zimmerman, C.A.; Coder, D.; Morrissey, P.J. Sensitivity measurement and compensation in spectral imaging. Cytom. Part A 2006, 69, 852–862. [Google Scholar] [CrossRef] [PubMed]
- Chu, B. Physics: Laser Light Scattering: Basic Principles and Practice, 2nd ed.; Dover Publications: Mineola, NY, USA, 2007. [Google Scholar]
- Hoo, C.M.; Starostin, N.; West, P.; Mecartney, M.L. A comparison of atomic force microscopy (AFM) and dynamic light scattering (DLS) methods to characterize nanoparticle size distributions. J. Nanopart. Res. 2008, 10, 89–96. [Google Scholar] [CrossRef]
- Bryant, G.; Abeynayake, C.; Thomas, J.C. Improved particle size distribution using multiangle dynamic light scattering. 2. refinements and applications. Langmuir 1996, 12, 6224–6228. [Google Scholar] [CrossRef]
- Lawrie, A.S.; Albanyan, A.; Cardigan, R.A.; MacKie, I.J.; Harrison, P. Microparticle sizing by dynamic light scattering in fresh-frozen plasma. Vox Sang. 2009, 96, 206–212. [Google Scholar] [CrossRef] [PubMed]
- Gercel-Taylor, C.; Atay, S.; Tullis, R.H.; Kesimer, M.; Taylor, D.D. Nanoparticle analysis of circulating cell-derived vesicles in ovarian cancer patients. Anal. Biochem. 2012, 428, 44–53. [Google Scholar] [CrossRef] [PubMed]
- Dragovic, R.A.; Gardiner, C.; Brooks, A.S.; Tannetta, D.S.; Ferguson, D.J.P.; Hole, P.; Carr, B.; Redman, C.W.G.; Harris, A.L.; Dobson, P.J.; et al. Sizing and phenotyping of cellular vesicles using Nanoparticle Tracking Analysis. Nanomed. Nanotechnol. Biol. Med. 2011, 7, 780–788. [Google Scholar] [CrossRef] [PubMed]
- Sokolova, V.; Ludwig, A.K.; Hornung, S.; Rotan, O.; Horn, P.A.; Epple, M.; Giebel, B. Characterisation of exosomes derived from human cells by nanoparticle tracking analysis and scanning electron microscopy. Colloids Surf. B Biointerfaces 2011, 87, 146–150. [Google Scholar] [CrossRef] [PubMed]
- Saveyn, H.; de Baets, B.; Thas, O.; Hole, P.; Smith, J.; van der Meeren, P. Accurate particle size distribution determination by nanoparticle tracking analysis based on 2-D Brownian dynamics simulation. J. Colloid. Interface Sci. 2010, 352, 593–600. [Google Scholar] [CrossRef] [PubMed]
- Gardiner, C.; Ferreira, Y.J.; Dragovic, R.A.; Redman, C.W.G.; Sargent, I.L. Extracellular vesicle sizing and enumeration by nanoparticle tracking analysis. J. Extracell. Vesicles 2013, 2, 1–11. [Google Scholar] [CrossRef] [PubMed]
- Soo, C.Y.; Song, Y.; Zheng, Y.; Campbell, E.C.; Riches, A.C.; Gunn-Moore, F.; Powis, S.J. Nanoparticle tracking analysis monitors microvesicle and exosome secretion from immune cells. Immunology 2012, 136, 192–197. [Google Scholar] [CrossRef] [PubMed]
- Dragovic, R.A.; Collett, G.P.; Hole, P.; Ferguson, D.J.P.; Redman, C.W.; Sargent, I.L.; Tannetta, D.S. Isolation of syncytiotrophoblast microvesicles and exosomes and their characterisation by multicolour flow cytometry and fluorescence Nanoparticle Tracking Analysis. Methods 2015, 87, 64–74. [Google Scholar] [CrossRef] [PubMed]
- Dragovic, R.A.; Southcombe, J.H.; Tannetta, D.S.; Redman, C.W.G.; Sargent, I.L. Multicolor flow cytometry and nanoparticle tracking analysis of extracellular vesicles in the plasma of normal pregnant and pre-eclamptic women. Biol. Reprod. 2013, 89, 151. [Google Scholar] [CrossRef] [PubMed]
- Reimer, L. Transmission Electron Microscopy: Physics of Image Formation and Microanalysis; Springer: Berlin/Heidelberg, Germany, 1997. [Google Scholar]
- Pisitkun, T.; Shen, R.-F.; Knepper, M.A. Identification and proteomic profiling of exosomes in human urine. Proc. Natl. Acad. Sci. USA 2004, 101, 13368–13373. [Google Scholar] [CrossRef] [PubMed]
- Adrian, M.; Dubochet, J.; Lepault, J.; McDowall, A.W. Cryo-electron microscopy of viruses. Nature 1984, 308, 32–36. [Google Scholar] [CrossRef] [PubMed]
- Glaeser, R.M.; Hall, R.J. Reaching the information limit in cryo-EM of biological macromolecules: Experimental aspects. Biophys. J. 2011, 100, 2331–2337. [Google Scholar] [CrossRef] [PubMed]
- Van Heel, M.; Gowen, B.; Matadeen, R.; Orlova, E.V.; Finn, R.; Pape, T.; Cohen, D.; Stark, H.; Schmidt, R.; Schatz, M.; et al. Single-particle electron cryo-microscopy: Towards atomic resolution. Q. Rev. Biophys. 2000, 33, 307–369. [Google Scholar] [CrossRef] [PubMed]
- Frank, J. Three-Dimensional Electron Microscopy of Macromolecular Assemblies: Visualization of Biological Molecules in Their Native State; Oxford University Press: New York, USA, 2010. [Google Scholar]
- Coleman, B.M.; Hanssen, E.; Lawson, V.A.; Hill, A.F. Prion-infected cells regulate the release of exosomes with distinct ultrastructural features. FASEB J. 2012, 26, 4160–4173. [Google Scholar] [CrossRef] [PubMed]
- Peters, P.J.; Bos, E.; Griekspoor, A. Cryo-immunogold electron microscopy. Curr. Protoc. Cell Biol. 2006. [Google Scholar] [CrossRef]
- Binnig, G.; Quate, C.; Gerber, C. Atomic force microscope. Phys. Rev. Lett. 1986, 56, 930–933. [Google Scholar] [CrossRef] [PubMed]
- Yuana, Y.; Oosterkamp, T.H.; Bahatyrova, S.; Ashcroft, B.; Garcia Rodriguez, P.; Bertina, R.M.; Osanto, S. Atomic force microscopy: A novel approach to the detection of nanosized blood microparticles. J. Thromb. Haemost. 2010, 8, 315–323. [Google Scholar] [CrossRef] [PubMed]
- Ashcroft, B.; de Sonneville, J.; Yuana, Y.; Osanto, S.; Bertina, R.; Kuil, M.; Oosterkamp, T. Determination of the size distribution of blood microparticles directly in plasma using atomic force microscopy and microfluidics. Biomed. Microdevices 2012, 14, 641–649. [Google Scholar] [CrossRef] [PubMed]
- Siedlecki, C.A.; Wang, I.W.; Higashi, J.M.; Kottke-Marchant, K.; Marchant, R.E. Platelet-derived microparticles on synthetic surfaces observed by atomic force microscopy and fluorescence microscopy. Biomaterials 1999, 20, 1521–1529. [Google Scholar] [CrossRef]
- Creasey, R.; Sharma, S.; Gibson, C.T.; Craig, J.E.; Ebner, A.; Becker, T.; Hinterdorfer, P.; Voelcker, N.H. Atomic force microscopy-based antibody recognition imaging of proteins in the pathological deposits in Pseudoexfoliation Syndrome. Ultramicroscopy 2011, 111, 1055–1061. [Google Scholar] [CrossRef] [PubMed]
- Tatischeff, I.; Larquet, E.; Falcón-Pérez, J.M.; Turpin, P.; Kruglik, S.G. Fast characterisation of cell-derived extracellular vesicles by nanoparticles tracking analysis, cryo-electron microscopy, and Raman tweezers microspectroscopy. J. Extracell. Vesicles 2012, 1, 1–11. [Google Scholar] [CrossRef] [PubMed]
- Vogel, R.; Willmott, G.; Kozak, D.; Roberts, G.S.; Anderson, W.; Groenewegen, L.; Glossop, B.; Barnett, A.; Turner, A.; Trau, M. Quantitative sizing of nano/microparticles with a tunable elastomeric pore sensor. Anal. Chem. 2011, 83, 3499–3506. [Google Scholar] [CrossRef] [PubMed]
- Anderson, W.; Kozak, D.; Coleman, V.A.; Jämting, Å.K.; Trau, M. A comparative study of submicron particle sizing platforms: Accuracy, precision and resolution analysis of polydisperse particle size distributions. J. Colloid Interface Sci. 2013, 405, 322–330. [Google Scholar] [CrossRef] [PubMed]
- Starchev, K.; Buffle, J.; Pérez, E. Applications of fluorescence correlation spectroscopy: Polydispersity measurements. J. Colloid Interface Sci. 1999, 213, 479–487. [Google Scholar] [CrossRef] [PubMed]
- Vidal, M.; Mangeat, P.; Hoekstra, D. Aggregation reroutes molecules from a recycling to a vesicle-mediated secretion pathway during reticulocyte maturation. J. Cell Sci. 1997, 110, 1867–1877. [Google Scholar] [PubMed]
- Wyss, R.; Grasso, L.; Wolf, C.; Grosse, W.; Demurtas, D.V.H. Molecular and dimensional profiling of highly purified extracellular vesicles by fluorescence fluctuation spectroscopy. Anal. Chem. 2014, 86, 7229–7233. [Google Scholar] [CrossRef] [PubMed]
- Chen, Y.; Chung, A.J.; Wu, T.H.; Teitell, M.A.; di Carlo, D.C.P. Pulsed laser activated cell sorting with three dimensional sheathless inertial focusing. Small 2014, 10, 1746–1751. [Google Scholar] [CrossRef] [PubMed]
- Heinzelman, P.; Bilousova, T.; Campagna, J.; John, V. Nanoscale extracellular vesicle analysis in Alzheimer’s disease diagnosis and therapy. Int. J. Alzheimers Dis. 2016, 2016, 1–10. [Google Scholar] [CrossRef] [PubMed]
- Van der Pol, E. Methods for detection and characterization of extracellular vesicles. In Detection of Extracellular Vesicles: Size Does Matter; Uitgeverij Box Press: Vianen, Netherlands, 2015; pp. 29–47. [Google Scholar]
- Kirz, J.; Jacobsen, C. Soft X-ray microscopes and their biological applications List of Figures. Q. Rev. Biophys. 1995, 28, 33–130. [Google Scholar] [CrossRef] [PubMed]
- Klar, T.A.; Hell, S.W. Subdiffraction resolution in far-field fluorescence microscopy. Opt. Lett. 1999, 24, 954–956. [Google Scholar] [CrossRef] [PubMed]
- Hein, B.; Willig, K.I.; Hell, S.W. Stimulated emission depletion (STED) nanoscopy of a fluorescent protein-labeled organelle inside a living cell. Proc. Natl. Acad. Sci. USA 2008, 105, 14271–14276. [Google Scholar] [CrossRef] [PubMed]
- Hell, S.W. Microscopy and its focal switch. Nat. Methods 2009, 6, 24–32. [Google Scholar] [CrossRef] [PubMed]
- Willig, K.I.; Rizzoli, S.O.; Westphal, V.; Jahn, R.; Hell, S.W. STED microscopy reveals that synaptotagmin remains clustered after synaptic vesicle exocytosis. Nature 2006, 440, 935–939. [Google Scholar] [CrossRef] [PubMed]
- Tønnesen, J.; Nadrigny, F.; Willig, K.I.; Wedlich-Söldner, R.; Nägerl, U.V. Two-color STED microscopy of living synapses using a single laser-beam pair. Biophys. J. 2011, 101, 2545–2552. [Google Scholar] [CrossRef] [PubMed]
- Logozzi, M.; de Milito, A.; Lugini, L.; Borghi, M.; Calabrò, L.; Spada, M.; Perdicchio, M.; Marino, M.L.; Federici, C.; Iessi, E.; et al. High levels of exosomes expressing CD63 and caveolin-1 in plasma of melanoma patients. PLoS ONE 2009, 4, e5219. [Google Scholar] [CrossRef] [PubMed]
- Yoshioka, Y.; Kosaka, N.; Konishi, Y.; Ohta, H.; Okamoto, H.; Sonoda, H.; Nonaka, R.; Yamamoto, H.; Ishii, H.; Mori, M.; et al. Ultra-sensitive liquid biopsy of circulating extracellular vesicles using ExoScreen. Nat. Commun. 2014, 5, 3591. [Google Scholar] [CrossRef] [PubMed]
- Burger, D.; Kwart, D.G.; Montezano, A.C.; Read, N.C.; Kennedy, C.R.J.; Thompson, C.S.; Touyz, R.M. Microparticles induce cell cycle arrest through redox-sensitive processes in endothelial cells: Implications in vascular senescence. J. Am. Heart Assoc. 2012, 1, e001842. [Google Scholar] [CrossRef] [PubMed]
- Roos, M.A.; Gennero, L.; Denysenko, T.; Reguzzi, S.; Cavallo, G.; Pescarmona, G.P.; Ponzetto, A. Microparticles in physiological and in pathological conditions. Cell Biochem. Funct. 2010, 28, 539–548. [Google Scholar] [CrossRef] [PubMed]


| Technique | What Is Measured | Information Acquired |
|---|---|---|
| Flow cytometry | Scattered and fluorescent lights | Particles’ * phenotype, absolute number and size (with limitations) |
| Dynamic light scattering (DLS) | Intensity of scattered light as a function of time | Particles’ size typically in the submicron scale, size distribution |
| Nanoparticle tracking analysis (NTA) | Scattered light | Particles’ size, size distribution, concentration, phenotype (with limitations) |
| Scanning and transmission electron microscopy (SEM and TEM) | Scattered electron beam | Morphology, particles’ size |
| Atomic force microscopy (AFM) | Interaction forces between the probing tip and surface | Particles’ three-dimensional (3D)topography, diameter |
© 2017 by the authors. Licensee MDPI, Basel, Switzerland. This article is an open access article distributed under the terms and conditions of the Creative Commons Attribution (CC BY) license (http://creativecommons.org/licenses/by/4.0/).
Share and Cite
Szatanek, R.; Baj-Krzyworzeka, M.; Zimoch, J.; Lekka, M.; Siedlar, M.; Baran, J. The Methods of Choice for Extracellular Vesicles (EVs) Characterization. Int. J. Mol. Sci. 2017, 18, 1153. https://doi.org/10.3390/ijms18061153
Szatanek R, Baj-Krzyworzeka M, Zimoch J, Lekka M, Siedlar M, Baran J. The Methods of Choice for Extracellular Vesicles (EVs) Characterization. International Journal of Molecular Sciences. 2017; 18(6):1153. https://doi.org/10.3390/ijms18061153
Chicago/Turabian StyleSzatanek, Rafal, Monika Baj-Krzyworzeka, Jakub Zimoch, Malgorzata Lekka, Maciej Siedlar, and Jarek Baran. 2017. "The Methods of Choice for Extracellular Vesicles (EVs) Characterization" International Journal of Molecular Sciences 18, no. 6: 1153. https://doi.org/10.3390/ijms18061153