
Detection of Exosomal miRNAs in the Plasma of Melanoma Patients


Abstract
:1. Introduction
2. Results
2.1. Characterization of miRNA Expression in Plasma-Derived Exosomes from Patients with a Predisposition to Melanoma and Patients with Metastatic Melanoma

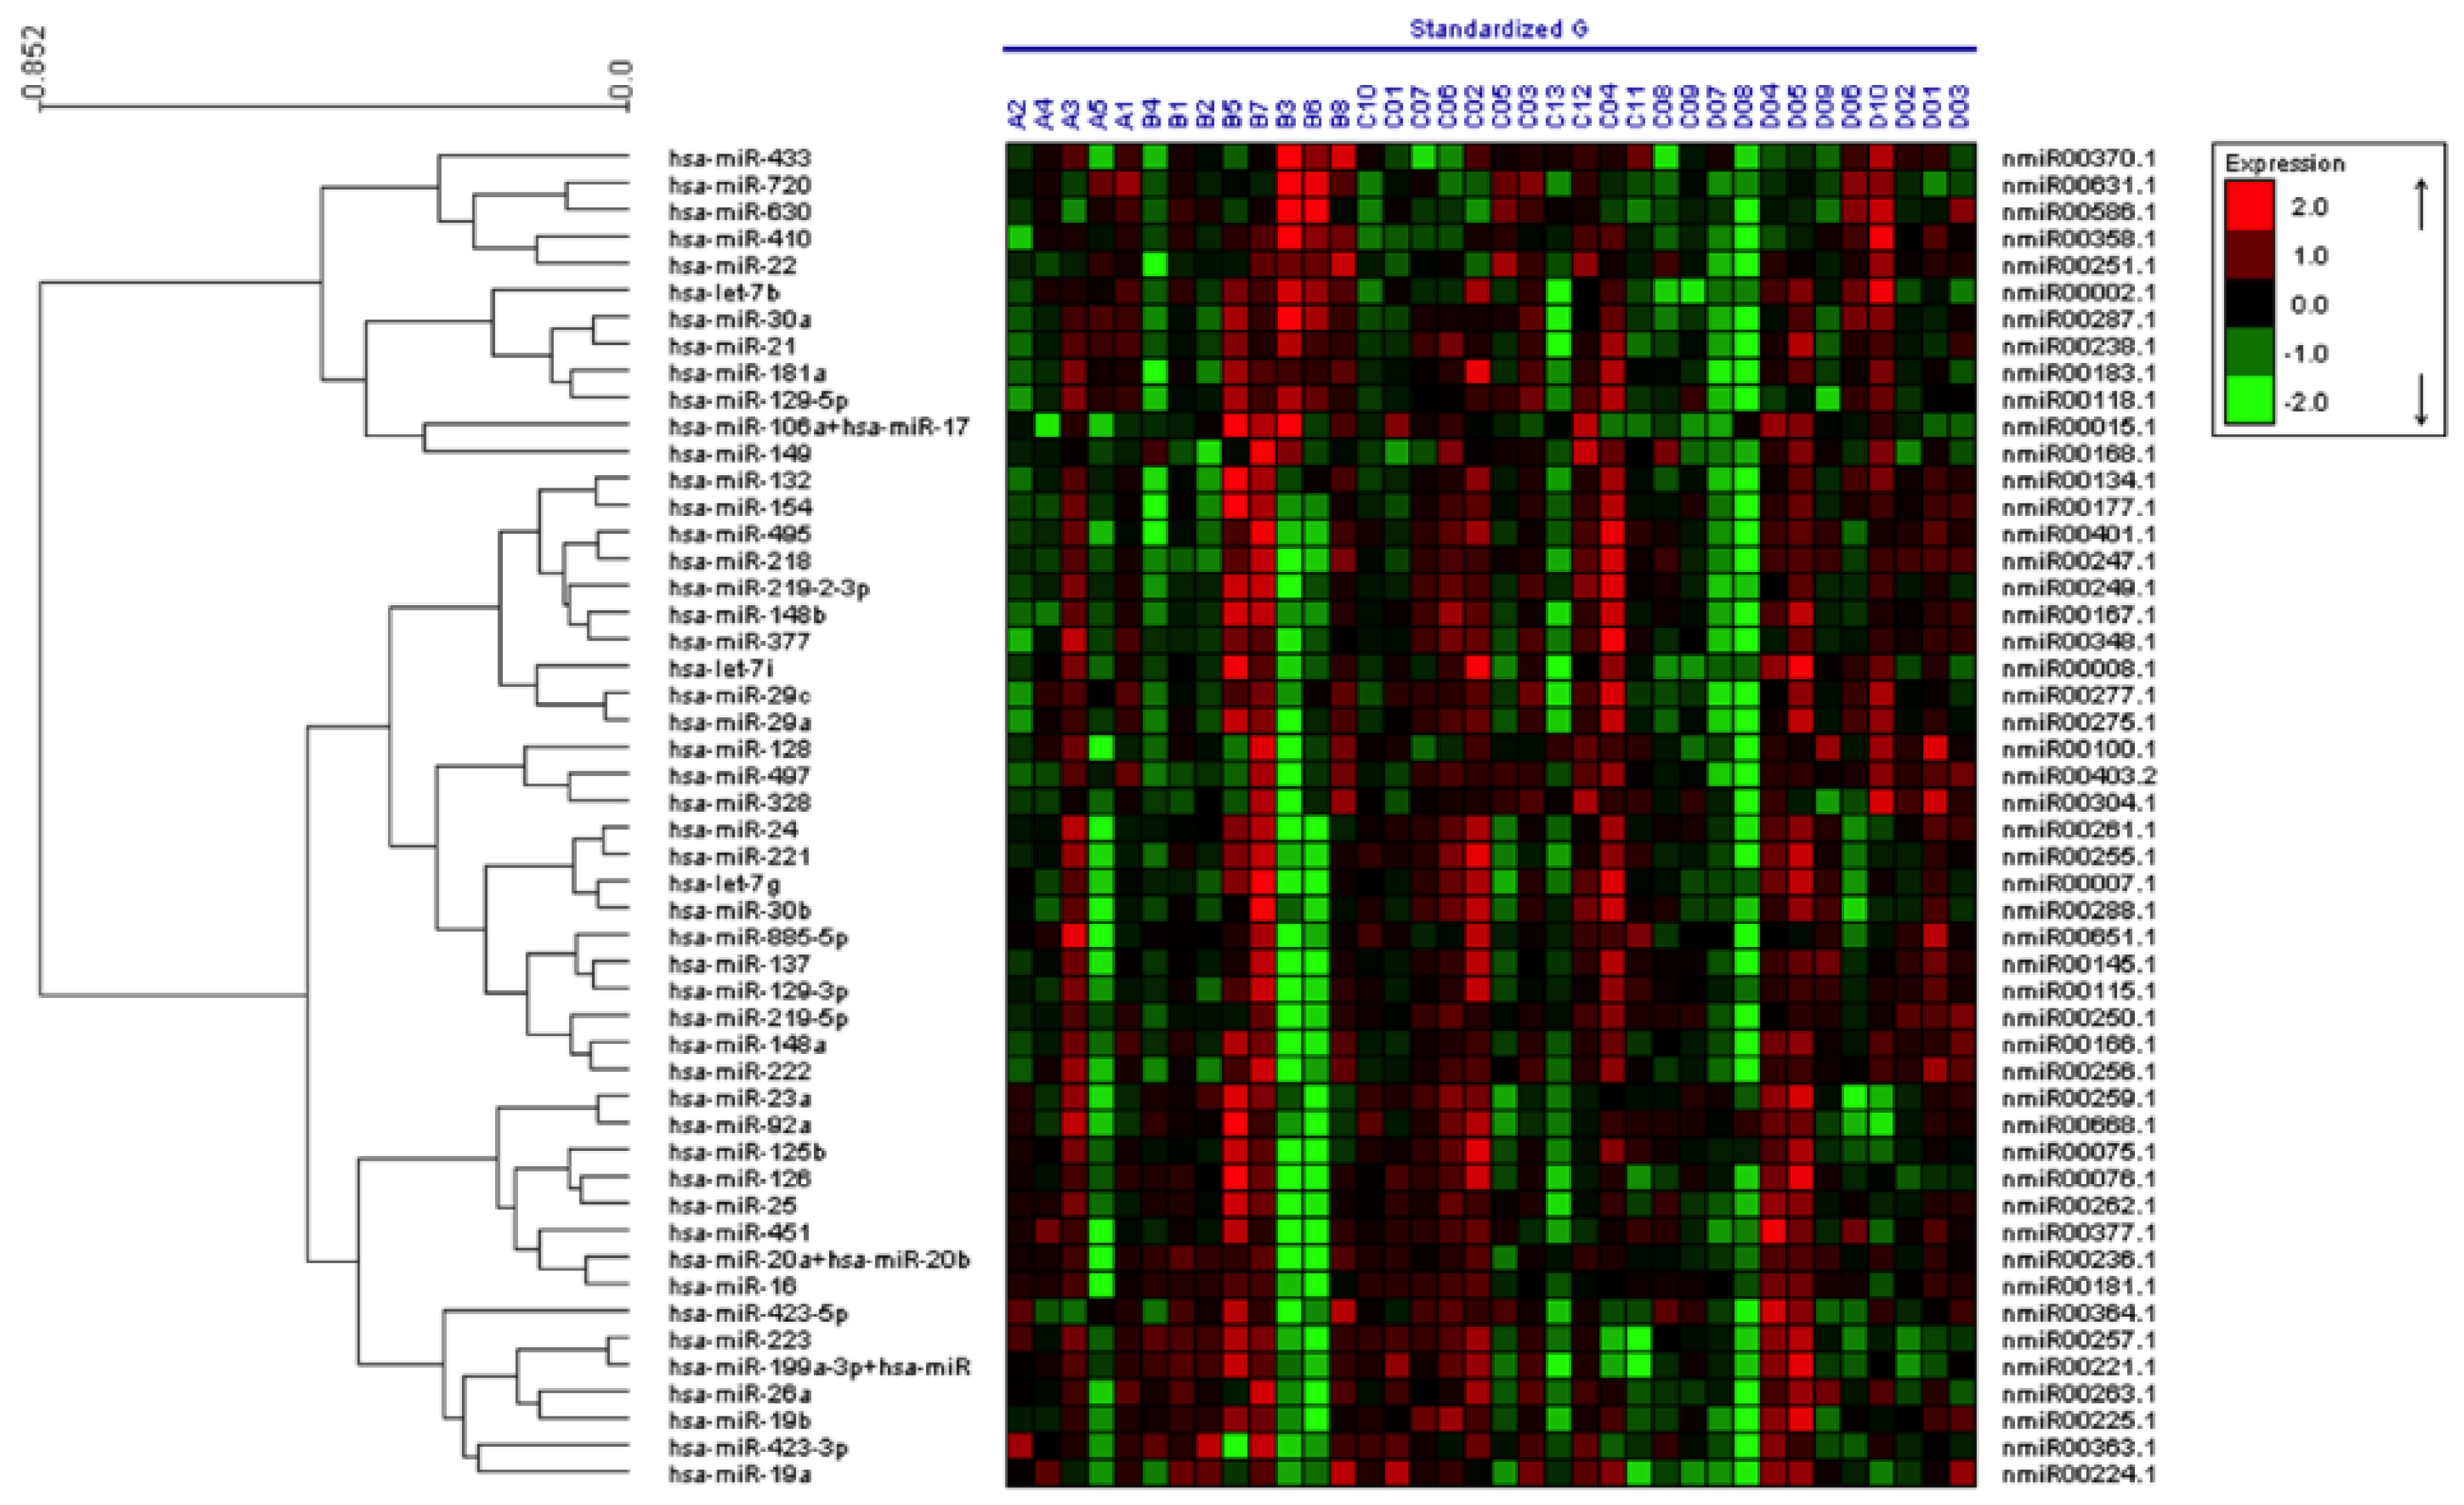
| Cohort | Age | Gender | p16 Mutation Status | Melanoma Diagnosis |
|---|---|---|---|---|
| A1 | 37 | M | 377T>A (p.V126D) | N |
| A2 | 40 | M | 377T>A (p.V126D) | N |
| A3 | 37 | M | 377T>A (p.V126D)) | N |
| A4 | 46 | M | 377T>A (p.V126D) | N |
| A5 | 64 | F | 377T>A (p.V126D) | N |
| B1 | 86 | M | 377T>A (p.V126D) | Y |
| B2 | 56 | M | 377T>A (p.V126D) | Y |
| B3 | 83 | M | 377T>A (p.V126D) | Y |
| B4 | 66 | F | 377T>A (p.V126D) | Y |
| B5 | 50 | M | 377T>A (p.V126D) | Y |
| B6 | 39 | F | 377T>A (p.V126D) | Y |
| B7 | 42 | F | 377T>A (p.V126D) | Y |
| B8 | 52 | F | 377T>A (p.V126D) | Y |
| C1 | 68 | M | negative | N |
| C2 | 40 | F | negative | N |
| C3 | 41 | M | negative | N |
| C4 | 46 | M | negative | N |
| C5 | 45 | F | negative | N |
| C6 | 36 | M | negative | N |
| C7 | 58 | M | negative | N |
| C8 | 63 | M | negative | N |
| C9 | 88 | M | negative | N |
| C10 | 34 | F | negative | N |
| C11 | 36 | F | negative | N |
| C12 | 40 | F | negative | N |
| C13 | 68 | F | negative | N |
| D1 | 50 | M | Not tested | met mel |
| D2 | 48 | F | Not tested | met mel |
| D3 | 38 | M | Not tested | met mel |
| D4 | 55 | M | Not tested | met mel |
| D5 | 34 | M | Not tested | met mel |
| D6 | 81 | M | Not tested | met mel |
| D7 | 82 | F | Not tested | met mel |
| D8 | 40 | M | Not tested | met mel |
| D9 | 40 | M | Not tested | met mel |
| D10 | 55 | M | Not tested | met mel |

| hsa-let-7b | TGAGGTAGTAGGTTGTGTGGTT |
| hsa-let-7g-5p | TGAGGTAGTAGTTTGTACAGTT |
| hsa-miR-125b | TCCCTGAGACCCTAACTTGTGA |
| hsa-miR-126 | TCGTACCGTGAGTAATAATGCG |
| hsa-miR-128 | TCACAGTGAACCGGTCTCTTT |
| hsa-miR-137 | TTATTGCTTAAGAATACGCGTAG |
| hsa-miR-148a | AAAGTTCTGAGACACTCCGACT |
| hsa-miR-149 | TCTGGCTCCGTGTCTTCACTCCC |
| hsa-miR-17 | CAAAGTGCTTACAGTGCAGGTAG |
| hsa-miR-199a-5p | CCCAGTGTTCAGACTACCTGTTC |
| hsa-miR-19a | TGTGCAAATCTATGCAAAACTGA |
| hsa-miR-19b | TGTGCAAATCCATGCAAAACTGA |
| hsa-miR-20b | TAAAGTGCTTATAGTGCAGGTAG |
| hsa-miR-21 | TAGCTTATCAGACTGATGTTGA |
| hsa-miR-221 | AGCTACATTGTCTGCTGGGTTTC |
| hsa-miR-222 | AGCTACATCTGGCTACTGGGT |
| hsa-miR-23a | ATCACATTGCCAGGGATTTCC |
| hsa-miR-29a | TAGCACCATCTGAAATCGGTTA |
| hsa-miR-423-5p | TGAGGGGCAGAGAGCGAGACTTT |
| hsa-miR-92a | TATTGCACTTGTCCCGGCCTGT |
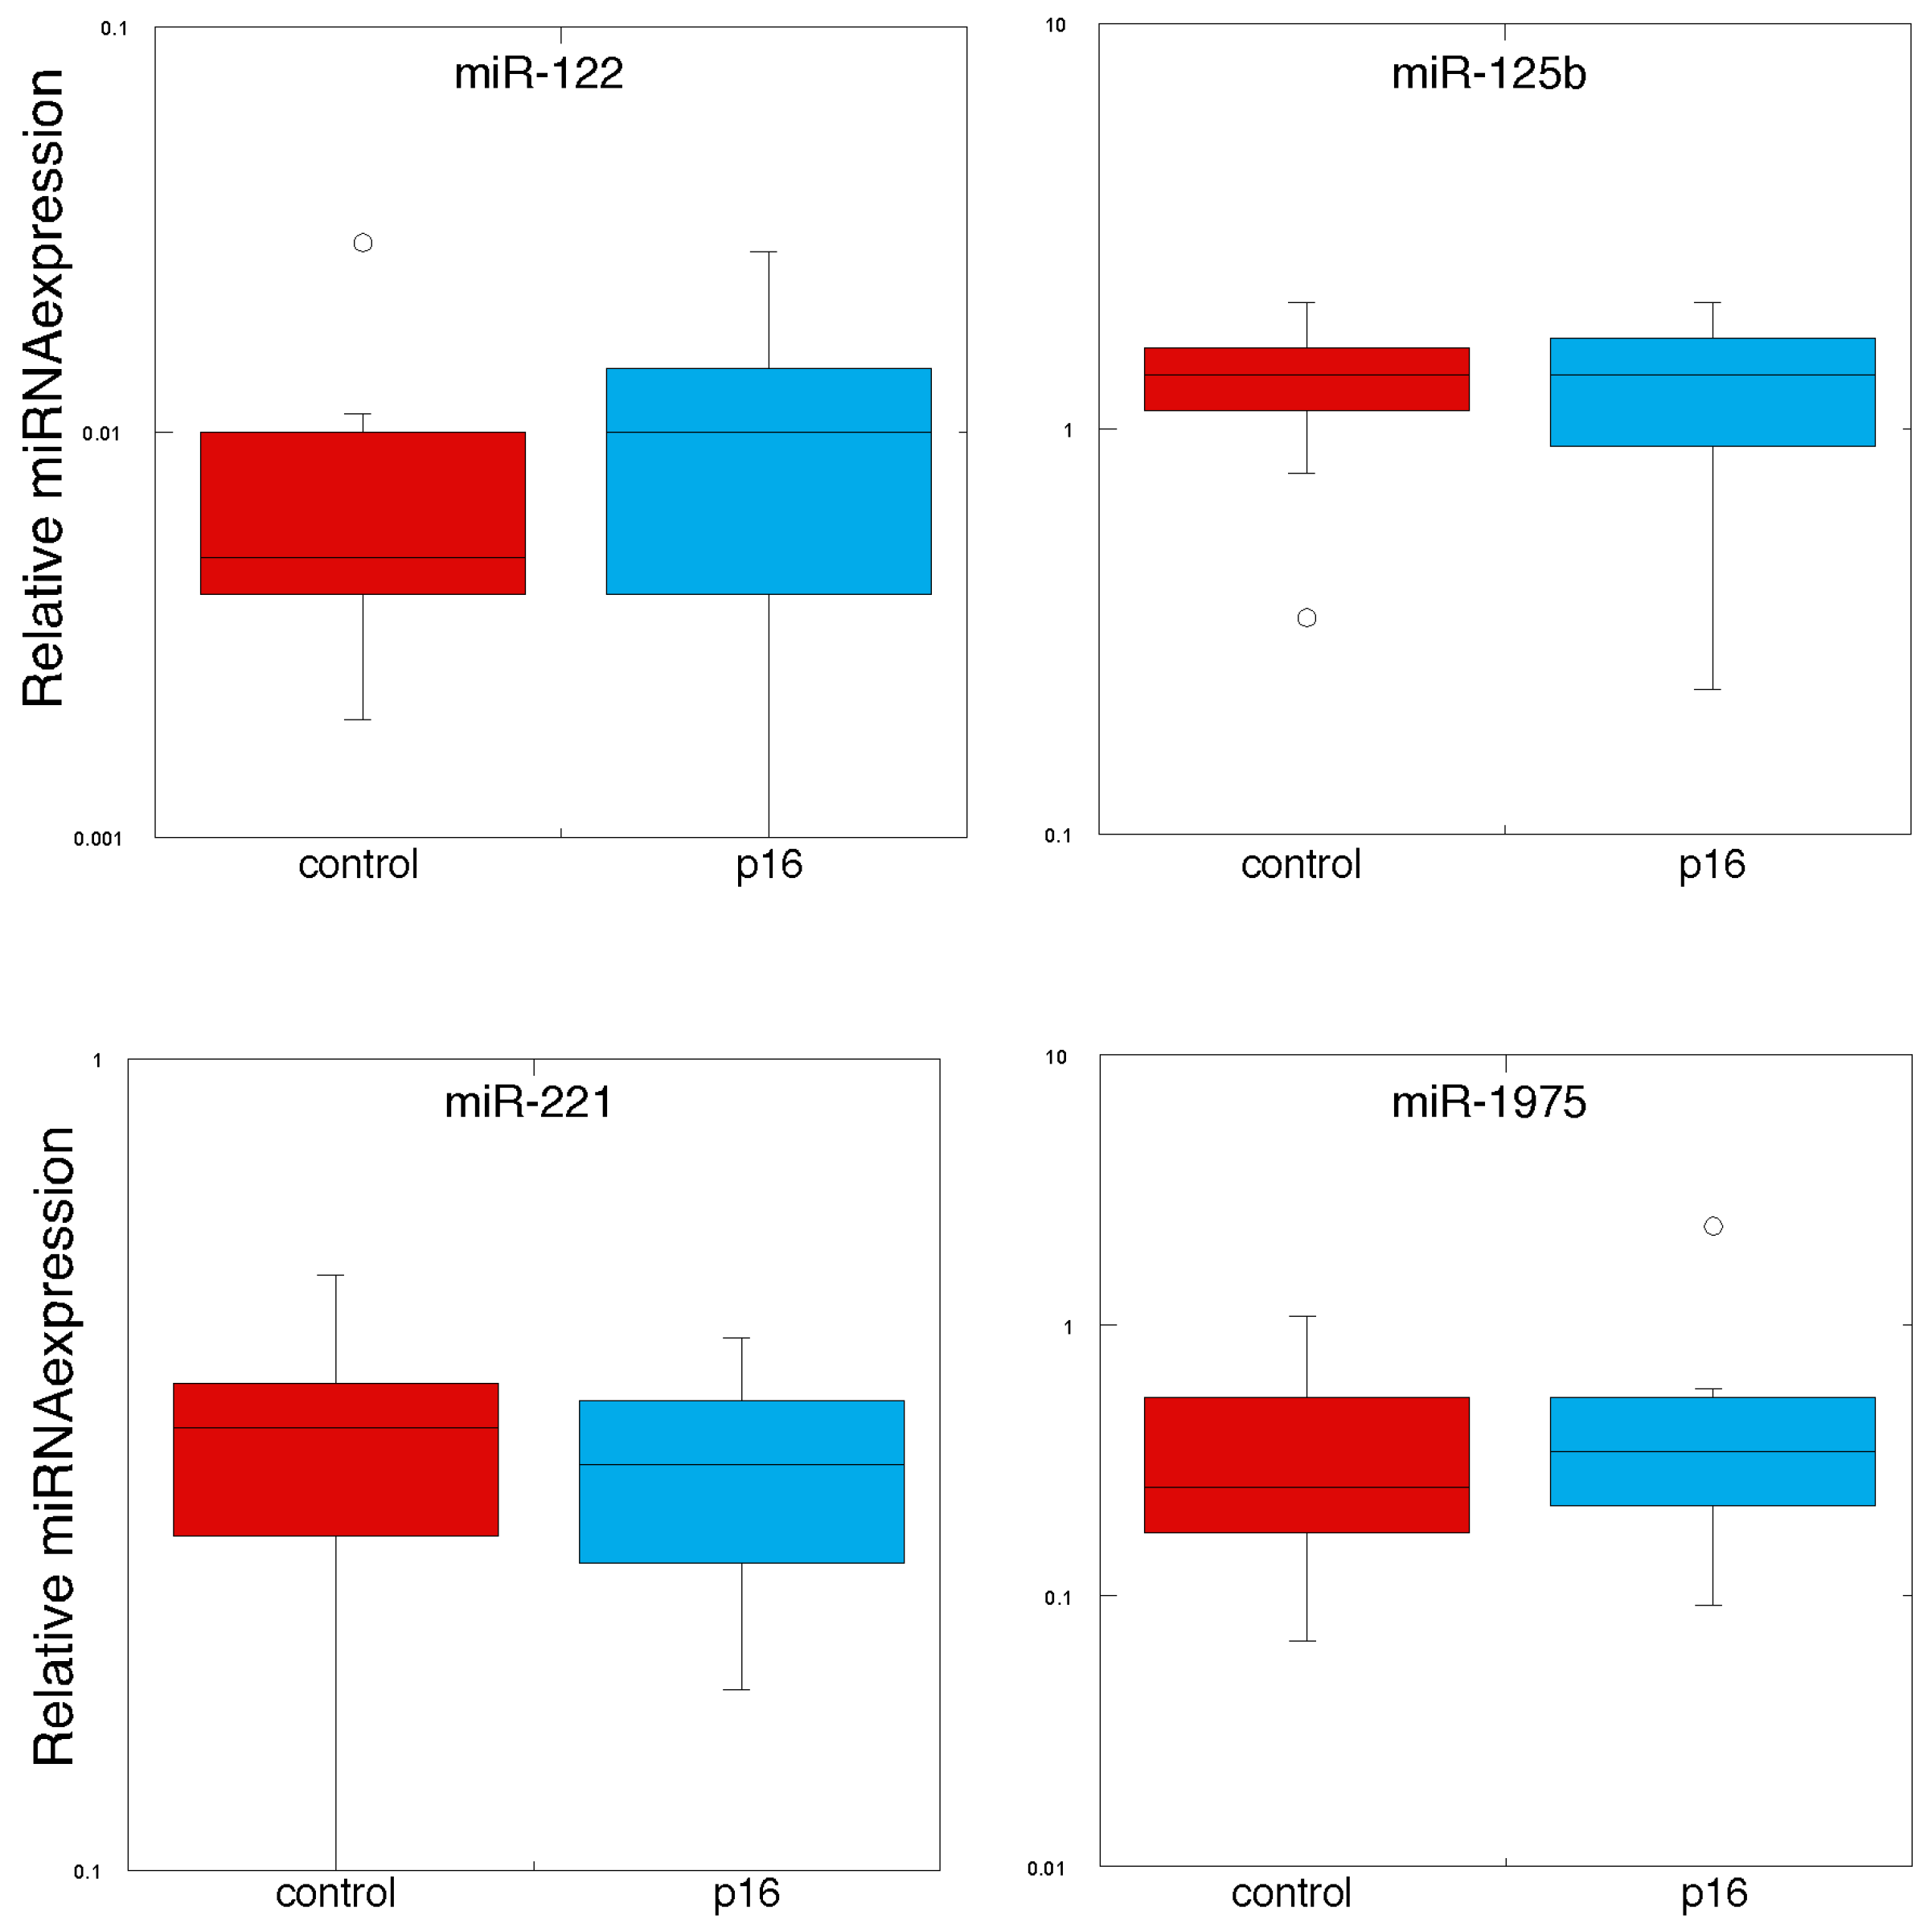
2.2. Detection of Circulating miRNA in Plasma-Derived Exosomes
| MiRNA | Control | p16 Carriers | p Value |
|---|---|---|---|
| hsa-let-7b | 0.118 ± 0.001 | 0.104 ± 0.012 | 0.217 |
| hsa-let-7g | 0.056 ± 0.007 | 0.051 ± 0.011 | 0.350 |
| hsa-miR-125b | 1.319 ± 0.125 | 1.251 ± 0.150 | 0.368 |
| hsa-miR-126 | 0.113 ± 0.019 | 0.127 ± 0.018 | 0.425 |
| hsa-miR-128 | 2.034 ± 0.210 | 1.826 ± 0.206 | 0.242 |
| hsa-miR-137 | 0.052 ± 0.005 | 0.045 ± 0.006 | 0.252 |
| hsa-miR-148a | 0.094 ± 0.011 | 0.083 ± 0.008 | 0.224 |
| hsa-miR-149 | 0.024 ± 0.004 | 0.028 ± 0.006 | 0.310 |
| hsa-miR-17 | 0.101 ± 0.17 | 0.097 ± 0.013 | 0.418 |
| hsa-miR-199a | 0.017 ± 0.004 | 0.016 ± 0.010 | 0.451 |
| hsa-miR-19a | 0.421 ± 0.067 | 0.409 ± 0.053 | 0.446 |
| hsa-miR-19b | 0.558 ± 0.090 | 0.543 ± 0.077 | 0.450 |
| hsa-miR-20b | 0.123 ± 0.020 | 0.107 ± 0.012 | 0.273 |
| hsa-miR-21 | 0.775 ± 0.074 | 0.789 ± 0.054 | 0.441 |
| hsa-miR-221 | 0.335 ± 0.030 | 0.311 ± 0.023 | 0.273 |
| hsa-miR-222 | 0.589 ± 0.062 | 0.519 ± 0.062 | 0.182 |
| hsa-miR-23a | 0.520 ± 0.095 | 0.473 ± 0.072 | 0.350 |
| hsa-miR-29a | 0.625 ± 0.054 | 0.593 ± 0.044 | 0.323 |
| hsa-miR-423-3p | 0.088 ± 0.014 | 0.078 ± 0.006 | 0.264 |
| hsa-miR-92a | 0.341 ± 0.053 | 0.306 ± 0.034 | 0.292 |
| MiRNA | p16 No Melanoma | p16 with Melanoma | p Value |
|---|---|---|---|
| hsa-let-7b | 0.119 ± 0.017 | 0.094 ± 0.016 | 0.162 |
| hsa-let-7g | 0.048 ± 0.007 | 0.052 ± 0.018 | 0.422 |
| hsa-miR-125b | 1.571 ± 0.081 | 1.052 ± 0.214 | 0.025 |
| hsa-miR-126 | 0.140 ± 0.007 | 0.120 ± 0.030 | 0.274 |
| hsa-miR-128 | 1.908 ± 0.223 | 1.774 ± 0.315 | 0.368 |
| hsa-miR-137 | 0.036 ± 0.004 | 0.051 ± 0.009 | 0.103 |
| hsa-miR-148a | 0.089 ± 0.004 | 0.079 ± 0.013 | 0.256 |
| hsa-miR-149 | 0.021 ± 0.002 | 0.032 ± 0.010 | 0.172 |
| hsa-miR-17 | 0.111 ± 0.012 | 0.088 ± 0.021 | 0.187 |
| hsa-miR-199a | 0.020 ± 0.006 | 0.013 ± 0.002 | 0.183 |
| hsa-miR-19a | 0.404 ± 0.037 | 0.411 ± 0.087 | 0.471 |
| hsa-miR-19b | 0.485 ± 0.053 | 0.579 ± 0.123 | 0.252 |
| hsa-miR-20b | 0.121 ± 0.016 | 0.099 ± 0.018 | 0.191 |
| hsa-miR-21 | 0.757 ± 0.046 | 0.809 ± 0.085 | 0.301 |
| hsa-miR-221 | 0.354 ± 0.029 | 0.285 ± 0.031 | 0.068 |
| hsa-miR-222 | 0.577 ± 0.046 | 0.483 ± 0.061 | 0.125 |
| hsa-miR-23a | 0.542 ± 0.069 | 0.430 ± 0.110 | 0.205 |
| hsa-miR-29a | 0.544 ± 0.061 | 0.623 ± 0.061 | 0.193 |
| hsa-miR-423-3p | 0.094 ± 0.012 | 0.068 ± 0.005 | 0.063 |
| hsa-miR-92a | 0.382 ± 0.075 | 0.258 ± 0.018 | 0.088 |
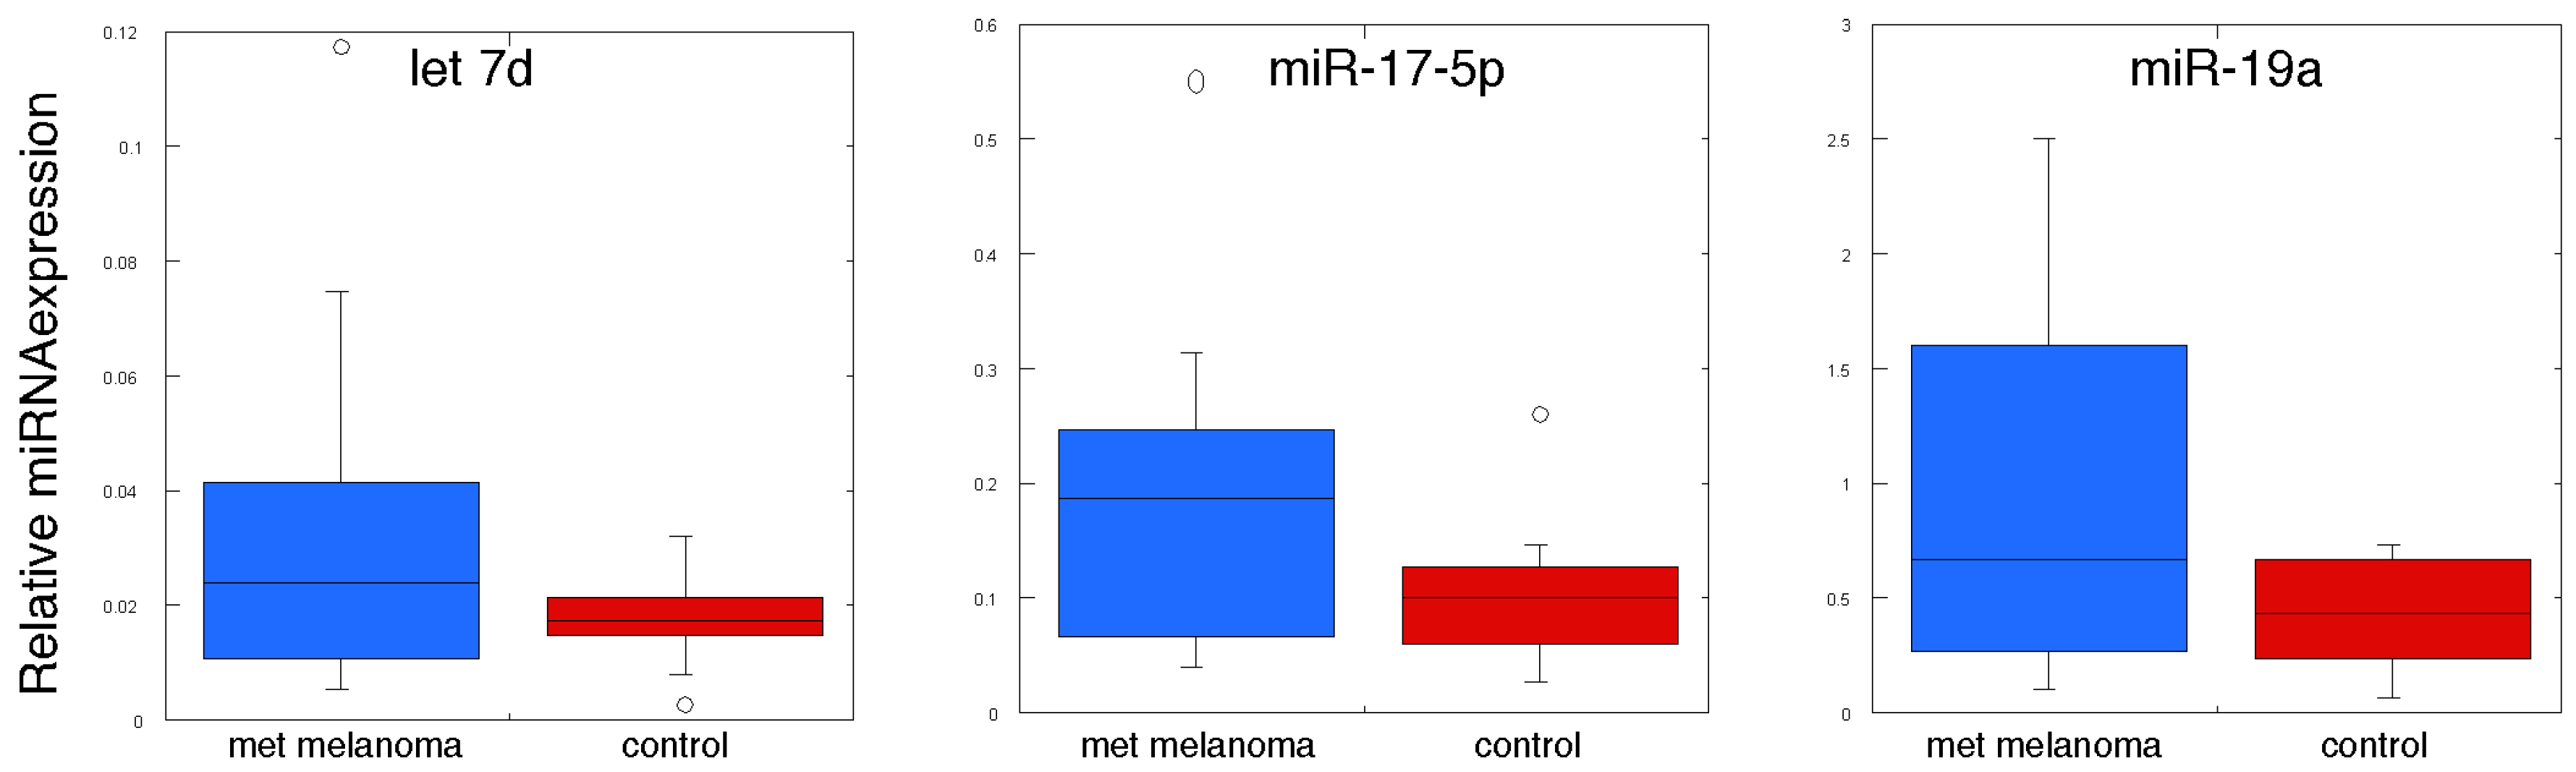
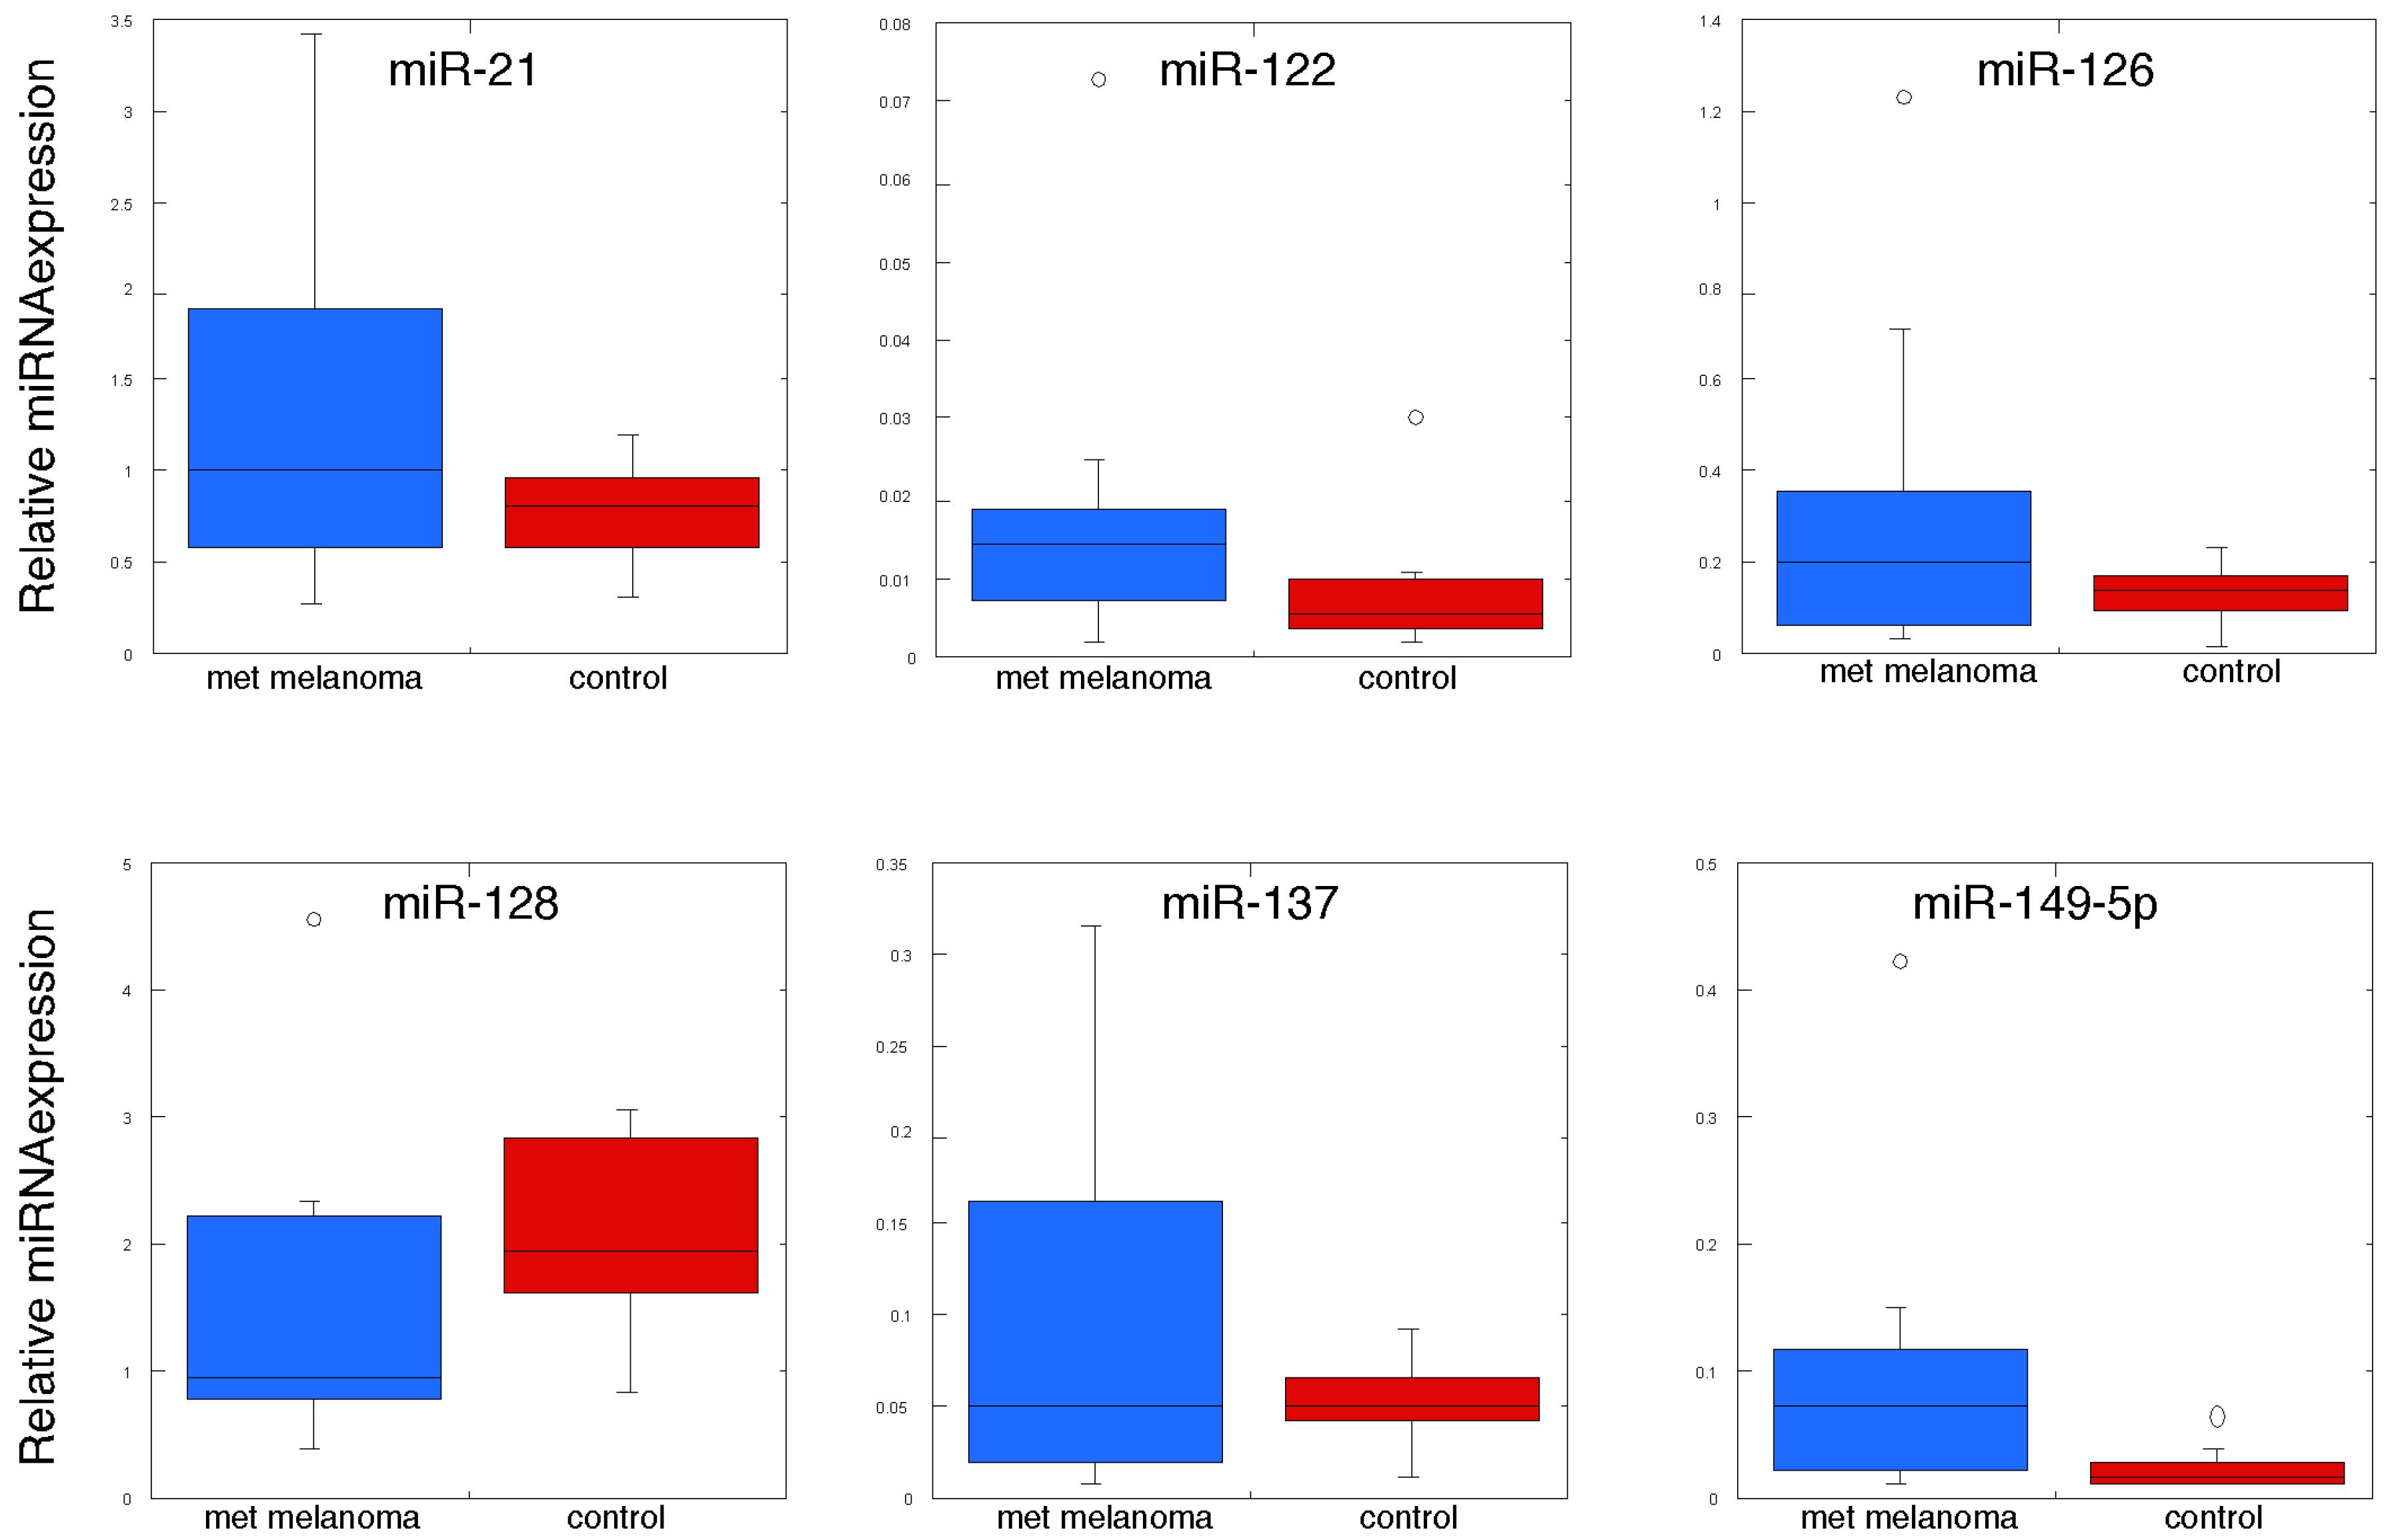
| MiRNA | Control | Metastatic Melanoma | p Value |
|---|---|---|---|
| hsa-let-7b | 0.118 ± 0.001 | 0.192 ± 0.066 | 0.146 |
| hsa-let-7g | 0.056 ± 0.007 | 0.065 ± 0.027 | 0.378 |
| hsa-miR-125b | 1.319 ± 0.125 | 1.219 ± 0.468 | 0.420 |
| hsa-miR-126 | 0.113 ± 0.019 | 0.320 ± 0.096 | 0.040 |
| hsa-miR-128 | 2.034 ± 0.210 | 1.420 ± 0.322 | 0.063 |
| hsa-miR-137 | 0.052 ± 0.005 | 0.102 ± 0.030 | 0.067 |
| hsa-miR-148a | 0.094 ± 0.011 | 0.126 ± 0.028 | 0.150 |
| hsa-miR-149 | 0.024 ± 0.004 | 0.094 ± 0.030 | 0.021 |
| hsa-miR-17 | 0.101 ± 0.17 | 0.181 ± 0.040 | 0.044 |
| hsa-miR-199a | 0.017 ± 0.004 | 0.028 ± 0.006 | 0.084 |
| hsa-miR-19a | 0.421 ± 0.067 | 0.986 ± 0.222 | 0.015 |
| hsa-miR-19b | 0.558 ± 0.090 | 1.203 ± 0.290 | 0.259 |
| hsa-miR-20b | 0.123 ± 0.020 | 0.202 ± 0.046 | 0.071 |
| hsa-miR-21 | 0.775 ± 0.074 | 1.305 ± 0.268 | 0.038 |
| hsa-miR-221 | 0.335 ± 0.030 | 0.390 ± 0.085 | 0.279 |
| hsa-miR-222 | 0.589 ± 0.062 | 0.680 ± 0.123 | 0.258 |
| hsa-miR-23a | 0.520 ± 0.095 | 0.773 ± 0.208 | 0.142 |
| hsa-miR-29a | 0.625 ± 0.054 | 0.795 ± 0.150 | 0.154 |
| hsa-miR-423-3p | 0.088 ± 0.014 | 0.082 ± 0.010 | 0.369 |
| hsa-miR-92a | 0.341 ± 0.053 | 0.267 ± 0.036 | 0.133 |


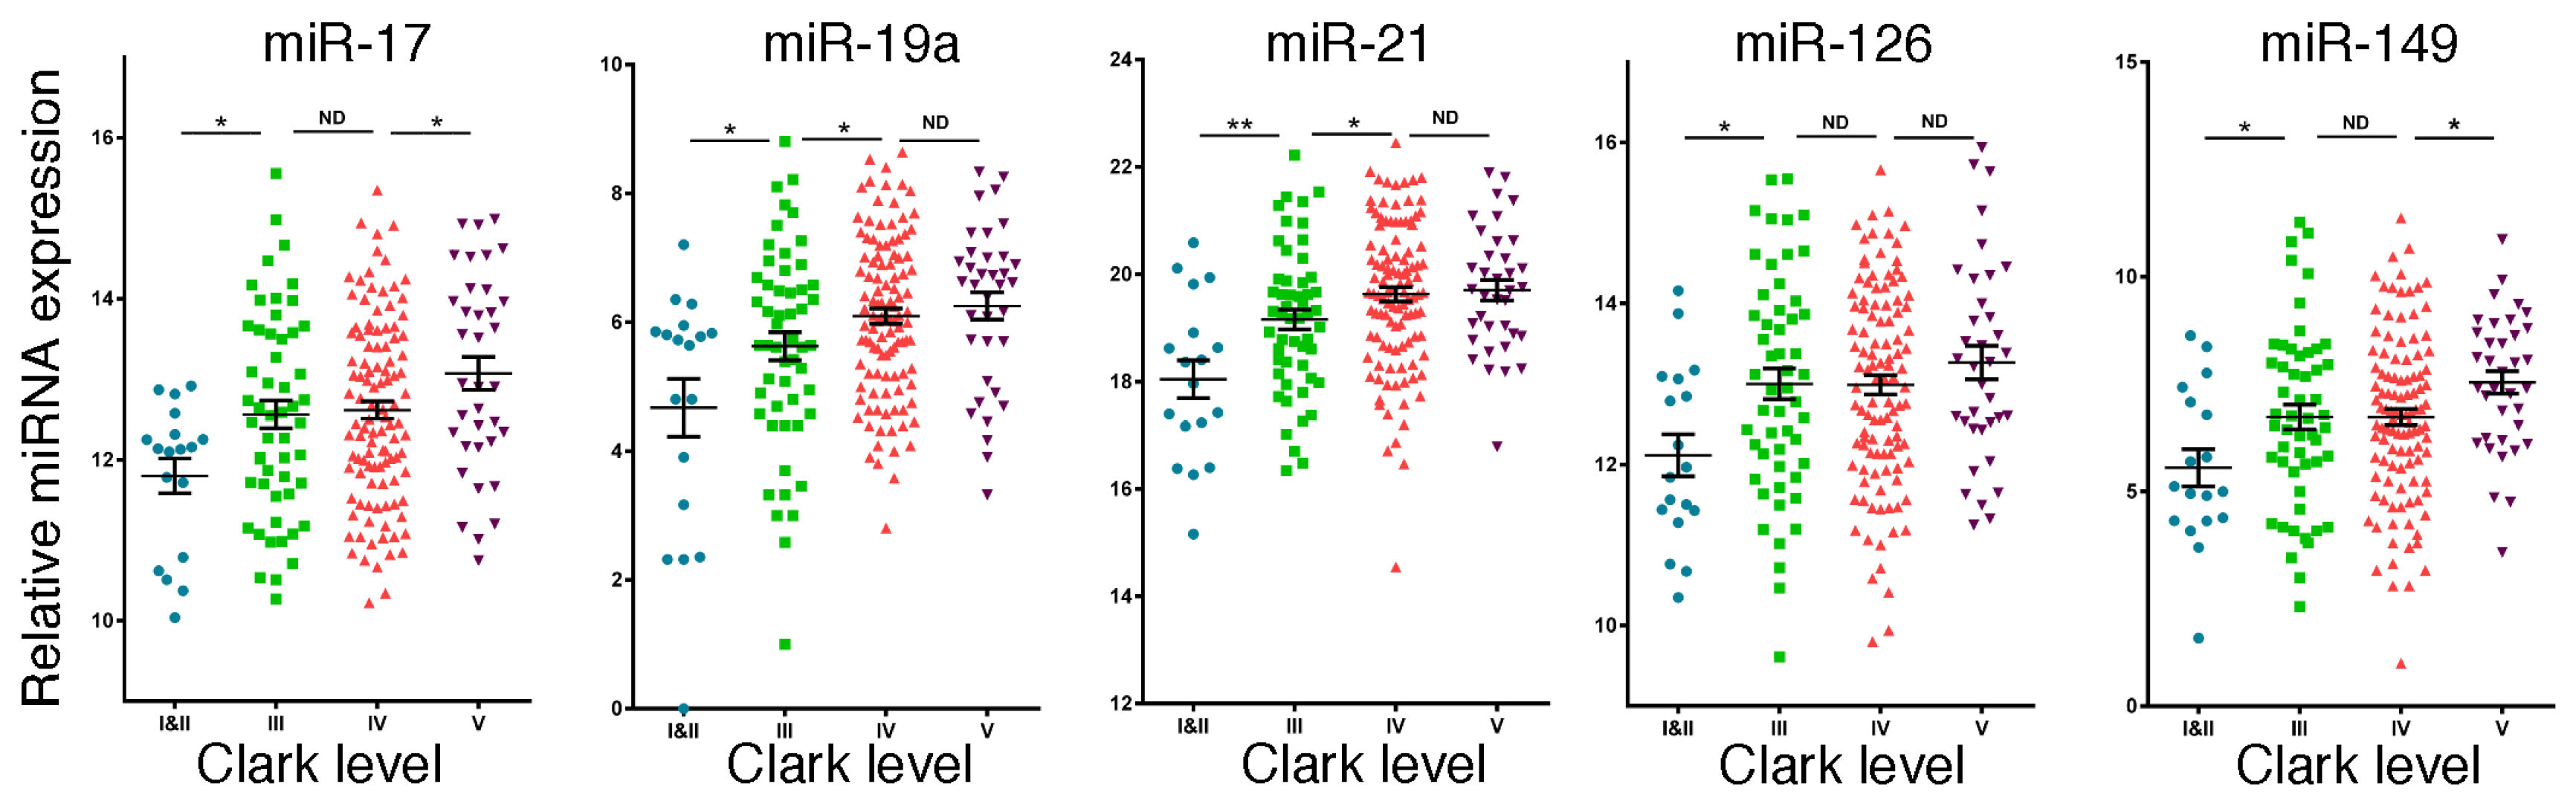
2.3. Expression of Potential miRNA Biomarkers in Melanoma
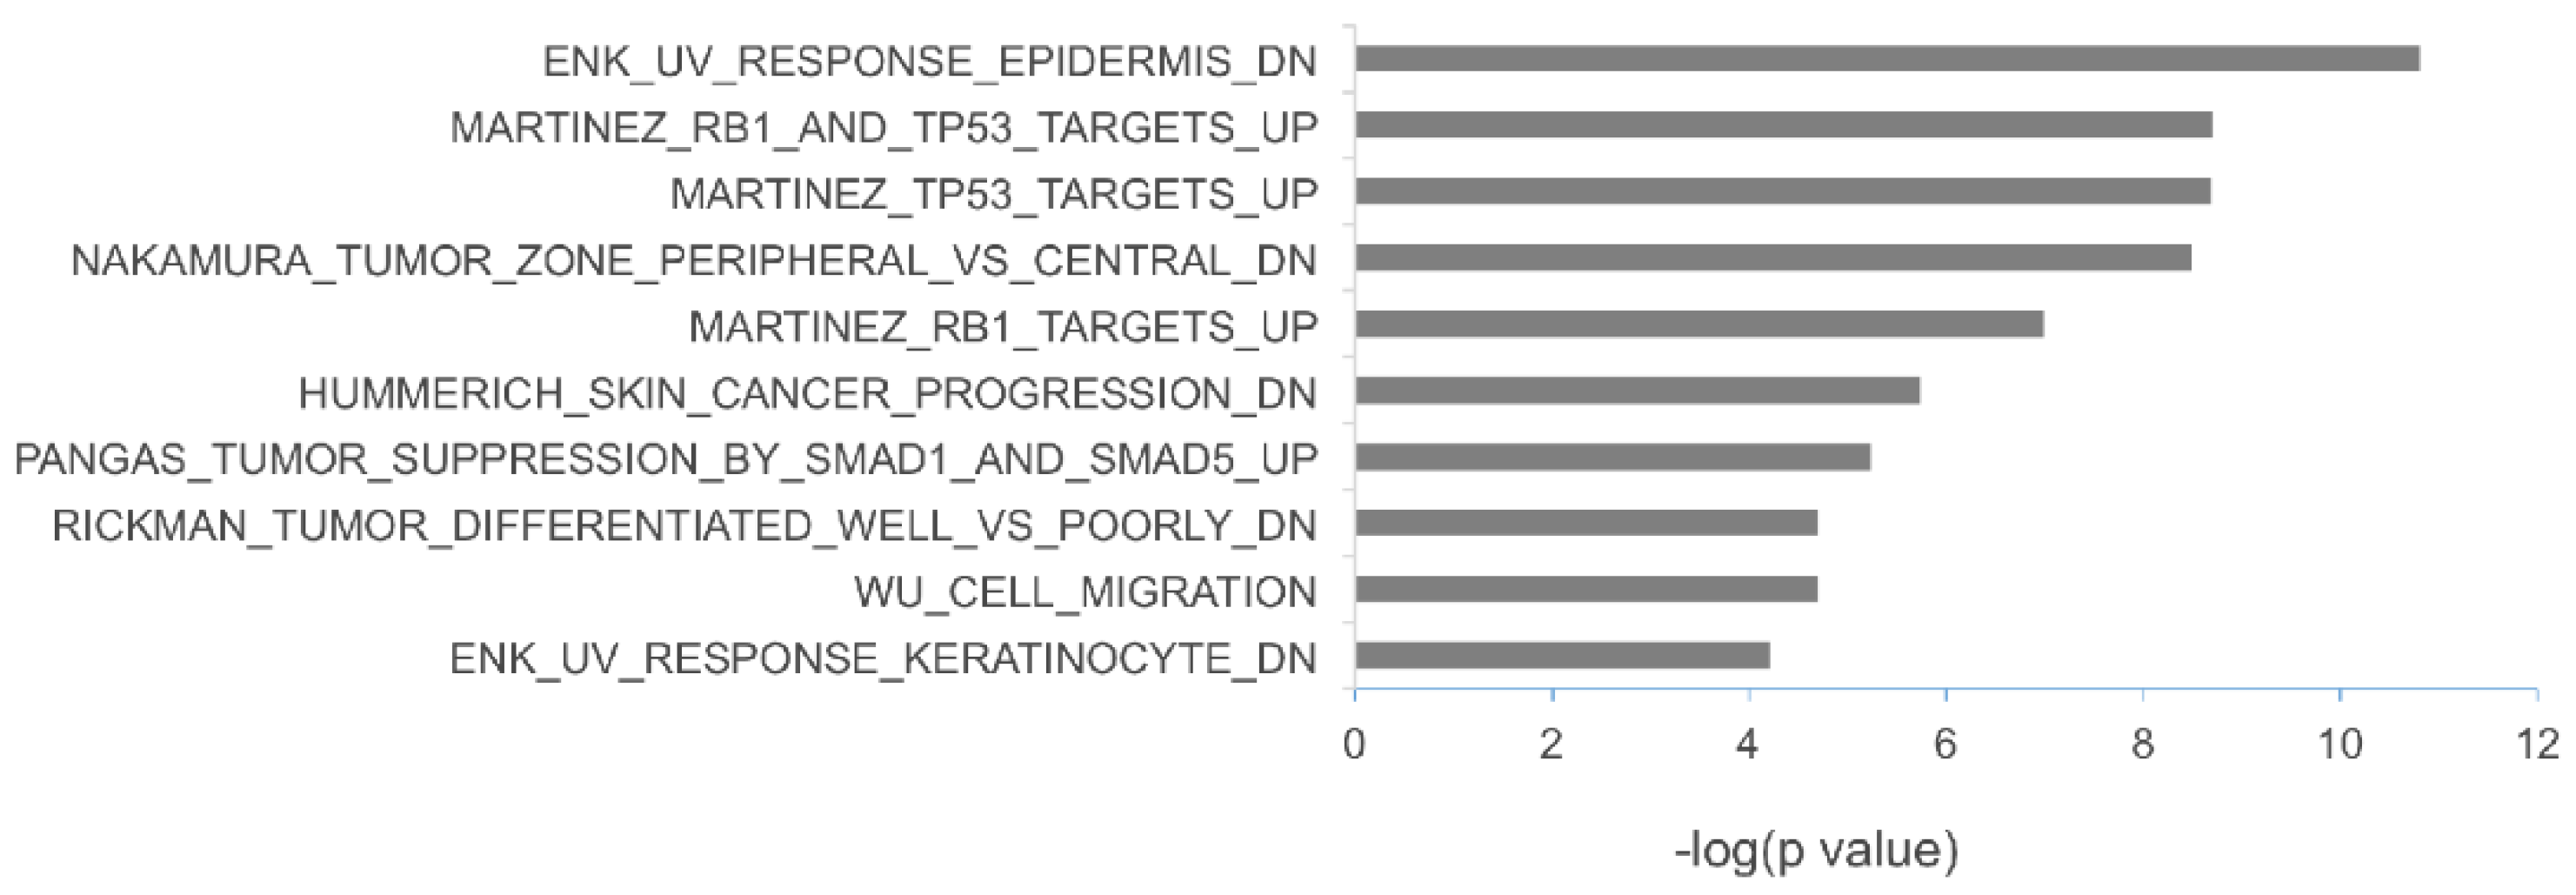
2.4. The Potential Biological Functions of the miRNAs Upregulated in Metastatic Melanoma
| Genes | miR-17 | miR-19a | miR-149 | miR-21 | |
|---|---|---|---|---|---|
| ADD3 | adducin 3 (gamma) | y | |||
| ARL4C | ADP-ribosylation factor-like 4C | y | |||
| BCL11A | B-cell CLL/lymphoma 11A (zinc finger protein) | y | y | ||
| BCL11B | B-cell CLL/lymphoma 11B (zinc finger protein) | y | y | ||
| CD34 | CD34 molecule | y | |||
| CDS1 | CDP-diacylglycerol synthase (phosphatidate cytidylyltransferase) 1 | y | |||
| CXCL12 | chemokine (C-X-C motif) ligand 12 (stromal cell-derived factor 1) | y | |||
| CYBB | cytochrome b-245, beta polypeptide | y | |||
| DSC3 | desmocollin 3 | y | |||
| EREG | epiregulin | y | y | ||
| ESR1 | estrogen receptor 1 | y | y | ||
| FAT2 | FAT tumor suppressor homolog 2 | y | |||
| FBLN1 | fibulin 1 | y | y | ||
| GJA1 | gap junction protein, alpha 1, 43 kDa | y | y | ||
| GRHL2 | grainyhead-like 2 (Drosophila) | y | |||
| HLF | hepatic leukemia factor | y | y | ||
| ID2 | inhibitor of DNA binding 2, dominant negative helix-loop-helix protein | y | |||
| LRIG1 | leucine-rich repeats and immunoglobulin-like domains 1 | y | y | ||
| LRRK1 | leucine-rich repeat kinase 1 | y | |||
| LTB4R | leukotriene B4 receptor | y | |||
| MACF1 | microtubule-actin crosslinking factor 1 | y | |||
| MBNL1 | muscleblind-like (Drosophila) | y | y | y | |
| MGEA5 | meningioma expressed antigen 5 (hyaluronidase) | y | |||
| MPZL2 | myelin protein zero-like 2 | y | |||
| NFATC3 | nuclear factor of activated T-cells, cytoplasmic, calcineurin-dependent 3 | y | |||
| NLRP3 | NLR family, pyrin domain containing 3 | y | |||
| NMT2 | N-myristoyltransferase 2 | y | |||
| NTRK2 | neurotrophic tyrosine kinase, receptor, type 2 | y | y | ||
| PAIP2B | poly(A) binding protein interacting protein 2B | y | y | ||
| PTGER3 | prostaglandin E receptor 3 (subtype EP3) | y | |||
| PTGS1 | prostaglandin-endoperoxide synthase 1 (prostaglandin G/H synthase and cyclooxygenase) | y | |||
| RAPGEFL1 | Rap guanine nucleotide exchange factor (GEF)-like 1 | y | y | ||
| RORA | RAR-related orphan receptor A | y | y | y | |
| RTN1 | reticulon 1 | y | |||
| TCF4 | transcription factor 4 | y | |||
| TMEM45A | transmembrane protein 45A | y | |||
| TNFRSF25 | tumor necrosis factor receptor superfamily, member 25 | y | |||
| TP63 | tumor protein p63 | y | y | ||
| TXNIP | thioredoxin interacting protein | y | |||
| ZFP36L2 | zinc finger protein 36, C3H type-like 2 | y |

3. Discussion
4. Materials and Methods
4.1. Plasma
4.2. Preparation of Plasma-Derived Exosomes and Isolation of RNA
4.3. miRNA Expression Profiling
4.4. miRNA Expression Using SYBR Green Real Time PCR
4.5. TCGA Data Query
4.6. Statistical Analysis
Acknowledgments
Author Contributions
Conflicts of Interest
References
- Vasudevan, S.; Tong, Y.; Steitz, J.A. Switching from repression to activation: MicroRNAs can up-regulate translation. Science 2007, 318, 1931–1934. [Google Scholar] [CrossRef] [PubMed]
- Bartel, D.P. MicroRNAs: Genomics, biogenesis, mechanism, and function. Cell 2004, 116, 281–297. [Google Scholar] [CrossRef]
- Cho, W.C. Oncomirs: The discovery and progress of microRNAs in cancers. Mol. Cancer 2007, 6, 60. [Google Scholar] [CrossRef] [PubMed]
- Rabinowits, G.; Gercel-Taylor, C.; Day, J.M.; Taylor, D.D.; Kloecker, G.H. Exosomal microRNA: A diagnostic marker for lung cancer. Clin. Lung Cancer 2009, 10, 42–46. [Google Scholar] [CrossRef] [PubMed]
- Thery, C.; Ostrowski, M.; Segura, E. Membrane vesicles as conveyors of immune responses. Nat. Rev. Immunol. 2009, 9, 581–593. [Google Scholar] [CrossRef] [PubMed]
- Pegtel, D.M.; Cosmopoulos, K.; Thorley-Lawson, D.A.; van Eijndhoven, M.A.; Hopmans, E.S.; Lindenberg, J.L.; de Gruijl, T.D.; Wurdinger, T.; Middeldorp, J.M. Functional delivery of viral miRNAs via exosomes. Proc. Natl. Acad. Sci. USA 2010, 107, 6328–6333. [Google Scholar] [CrossRef] [PubMed]
- Kottel, R.H.; Hoch, S.O.; Parsons, R.G.; Hoch, J.A. Serum ribonuclease activity in cancer patients. Br. J. Cancer 1978, 38, 280–286. [Google Scholar] [CrossRef] [PubMed]
- Quackenbush, J.F.; Cassidy, P.B.; Pfeffer, L.M.; Boucher, K.M.; Hawkes, J.E.; Pfeffer, S.R.; Kopelovich, L.; Leachman, S.A. Isolation of circulating microRNAs from microvesicles found in human plasma. Methods Mol. Biol. 2014, 1102, 641–653. [Google Scholar] [PubMed]
- Siegel, R.; Naishadham, D.; Jemal, A. Cancer statistics, 2012. CA Cancer J. Clin. 2012, 62, 10–29. [Google Scholar] [CrossRef] [PubMed]
- Aoude, L.G.; Wadt, K.A.; Pritchard, A.L.; Hayward, N.K. Genetics of familial melanoma: 20 years after CDKN2A. Pigment Cell Melanoma Res. 2015, 28, 148–160. [Google Scholar] [CrossRef] [PubMed]
- Eliason, M.J.; Larson, A.A.; Florell, S.R.; Zone, J.J.; Cannon-Albright, L.A.; Samlowski, W.E.; Leachman, S.A. Population-based prevalence of CDKN2A mutations in Utah melanoma families. J. Investig. Dermatol. 2006, 126, 660–666. [Google Scholar] [CrossRef] [PubMed]
- Goldstein, A.M.; Chan, M.; Harland, M.; Hayward, N.K.; Demenais, F.; Bishop, D.T.; Azizi, E.; Bergman, W.; Bianchi-Scarra, G.; Bruno, W.; et al. Features associated with germline CDKN2A mutations: A genomel study of melanoma-prone families from three continents. J. Med. Genet. 2007, 44, 99–106. [Google Scholar] [CrossRef] [PubMed]
- Hodis, E.; Watson, I.R.; Kryukov, G.V.; Arold, S.T.; Imielinski, M.; Theurillat, J.P.; Nickerson, E.; Auclair, D.; Li, L.; Place, C.; et al. A landscape of driver mutations in melanoma. Cell 2012, 150, 251–263. [Google Scholar] [CrossRef] [PubMed]
- Stott, F.J.; Bates, S.; James, M.C.; McConnell, B.B.; Starborg, M.; Brookes, S.; Palmero, I.; Ryan, K.; Hara, E.; Vousden, K.H.; et al. The alternative product from the human CDKN2A locus, p14(ARF), participates in a regulatory feedback loop with p53 and MDM2. EMBO J. 1998, 17, 5001–5014. [Google Scholar] [CrossRef] [PubMed]
- Bishop, D.T.; Demenais, F.; Goldstein, A.M.; Bergman, W.; Bishop, J.N.; de Paillerets, B.; Chompret, A.; Ghiorzo, P.; Gruis, N.; Hansson, J.; et al. Geographical variation in the penetrance of CDKN2A mutations for melanoma. J. Natl. Cancer Inst. 2002, 94, 894–903. [Google Scholar] [CrossRef] [PubMed]
- Fan, M.; Pfeffer, S.R.; Lynch, H.T.; Cassidy, P.; Leachman, S.; Pfeffer, L.M.; Kopelovich, L. Altered transcriptome signature of phenotypically normal skin fibroblasts heterozygous for CDKN2A in familial melanoma: Relevance to early intervention. Oncotarget 2013, 4, 128–141. [Google Scholar] [CrossRef] [PubMed]
- Caramuta, S.; Egyhazi, S.; Rodolfo, M.; Witten, D.; Hansson, J.; Larsson, C.; Lui, W.O. MicroRNA expression profiles associated with mutational status and survival in malignant melanoma. J. Investig. Dermatol. 2010, 130, 2062–2070. [Google Scholar] [CrossRef] [PubMed]
- Glud, M.; Klausen, M.; Gniadecki, R.; Rossing, M.; Hastrup, N.; Nielsen, F.C.; Drzewiecki, K.T. MicroRNA expression in melanocytic nevi: The usefulness of formalin-fixed, paraffin-embedded material for miRNA microarray profiling. J. Investig. Dermatol. 2009, 129, 1219–1224. [Google Scholar] [CrossRef] [PubMed]
- Segura, M.F.; Belitskaya-Levy, I.; Rose, A.E.; Zakrzewski, J.; Gaziel, A.; Hanniford, D.; Darvishian, F.; Berman, R.S.; Shapiro, R.L.; Pavlick, A.C.; et al. Melanoma microRNA signature predicts post-recurrence survival. Clin. Cancer Res. 2010, 16, 1577–1586. [Google Scholar] [CrossRef] [PubMed]
- Mitchell, P.S.; Parkin, R.K.; Kroh, E.M.; Fritz, B.R.; Wyman, S.K.; Pogosova-Agadjanyan, E.L.; Peterson, A.; Noteboom, J.; O'Briant, K.C.; Allen, A.; et al. Circulating microRNAs as stable blood-based markers for cancer detection. Proc. Natl. Acad. Sci USA 2008, 105, 10513–10518. [Google Scholar] [CrossRef] [PubMed]
- Talantov, D.; Mazumder, A.; Yu, J.X.; Briggs, T.; Jiang, Y.; Backus, J.; Atkins, D.; Wang, Y. Novel genes associated with malignant melanoma but not benign melanocytic lesions. Clin. Cancer Res. 2005, 11, 7234–7242. [Google Scholar] [CrossRef] [PubMed]
- Smith, A.P.; Hoek, K.; Becker, D. Whole-genome expression profiling of the melanoma progression pathway reveals marked molecular differences between nevi/melanoma in situ and advanced-stage melanomas. Cancer Biol. Ther. 2005, 4, 1018–1029. [Google Scholar] [CrossRef] [PubMed]
- Jaeger, J.; Koczan, D.; Thiesen, H.J.; Ibrahim, S.M.; Gross, G.; Spang, R.; Kunz, M. Gene expression signatures for tumor progression, tumor subtype, and tumor thickness in laser-microdissected melanoma tissues. Clin. Cancer Res. 2007, 13, 806–815. [Google Scholar] [CrossRef] [PubMed]
- Molecular Signatures Database v5.0. Available online: http://software.broadinstitute.org/gsea/index.jsp (accessed on 30 June 2015).
- Subramanian, A.; Tamayo, P.; Mootha, V.K.; Mukherjee, S.; Ebert, B.L.; Gillette, M.A.; Paulovich, A.; Pomeroy, S.L.; Golub, T.R.; Lander, E.S.; et al. Gene set enrichment analysis: A knowledge-based approach for interpreting genome-wide expression profiles. Proc. Natl. Acad. Sci. USA 2005, 102, 15545–15550. [Google Scholar] [CrossRef] [PubMed]
- Lim, L.P.; Lau, N.C.; Garrett-Engele, P.; Grimson, A.; Schelter, J.M.; Castle, J.; Bartel, D.P.; Linsley, P.S.; Johnson, J.M. Microarray analysis shows that some microRNAs downregulate large numbers of target mRNAs. Nature 2005, 433, 769–773. [Google Scholar] [CrossRef] [PubMed]
- Reid, G.; Kirschner, M.B.; van Zandwijk, N. Circulating microRNAs: Association with disease and potential use as biomarkers. Crit. Rev. Oncol. Hematol. 2011, 80, 193–208. [Google Scholar] [CrossRef] [PubMed]
- Friedman, E.B.; Shang, S.; de Miera, E.; Fog, J.U.; Teilum, M.W.; Ma, M.W.; Berman, R.S.; Shapiro, R.L.; Pavlick, A.C.; Hernando, E.; et al. Serum microRNAs as biomarkers for recurrence in melanoma. J. Trans. Med. 2012, 10, 155. [Google Scholar] [CrossRef] [PubMed]
- Kanemaru, H.; Fukushima, S.; Yamashita, J.; Honda, N.; Oyama, R.; Kakimoto, A.; Masuguchi, S.; Ishihara, T.; Inoue, Y.; Jinnin, M.; et al. The circulating microRNA-221 level in patients with malignant melanoma as a new tumor marker. J. Dermatol. Sci. 2011, 61, 187–193. [Google Scholar] [CrossRef] [PubMed]
- Greenberg, E.; Hershkovitz, L.; Itzhaki, O.; Hajdu, S.; Nemlich, Y.; Ortenberg, R.; Gefen, N.; Edry, L.; Modai, S.; Keisari, Y.; et al. Regulation of cancer aggressive features in melanoma cells by microRNAs. PLoS ONE 2011, 6, e18936. [Google Scholar] [CrossRef] [PubMed]
- Wong, P.; Iwasaki, M.; Somervaille, T.C.; Ficara, F.; Carico, C.; Arnold, C.; Chen, C.Z.; Cleary, M.L. The miR-17-92 microRNA polycistron regulates MLL leukemia stem cell potential by modulating p21 expression. Cancer Res. 2010, 70, 3833–3842. [Google Scholar] [CrossRef] [PubMed]
- Rao, E.; Jiang, C.; Ji, M.; Huang, X.; Iqbal, J.; Lenz, G.; Wright, G.; Staudt, L.M.; Zhao, Y.; McKeithan, T.W.; et al. The miRNA-17 approximately 92 cluster mediates chemoresistance and enhances tumor growth in mantle cell lymphoma via pi3k/akt pathway activation. Leukemia 2012, 26, 1064–1072. [Google Scholar] [CrossRef] [PubMed]
- Hayashita, Y.; Osada, H.; Tatematsu, Y.; Yamada, H.; Yanagisawa, K.; Tomida, S.; Yatabe, Y.; Kawahara, K.; Sekido, Y.; Takahashi, T. A polycistronic microRNA cluster, miR-17-92, is overexpressed in human lung cancers and enhances cell proliferation. Cancer Res. 2005, 65, 9628–9632. [Google Scholar] [CrossRef] [PubMed]
- Ebi, H.; Sato, T.; Sugito, N.; Hosono, Y.; Yatabe, Y.; Matsuyama, Y.; Yamaguchi, T.; Osada, H.; Suzuki, M.; Takahashi, T. Counterbalance between rb inactivation and miR-17-92 overexpression in reactive oxygen species and DNA damage induction in lung cancers. Oncogene 2009, 28, 3371–3379. [Google Scholar] [CrossRef] [PubMed]
- Levy, C.; Khaled, M.; Iliopoulos, D.; Janas, M.M.; Schubert, S.; Pinner, S.; Chen, P.H.; Li, S.; Fletcher, A.L.; Yokoyama, S.; et al. Intronic miR-211 assumes the tumor suppressive function of its host gene in melanoma. Mol. Cell 2010, 40, 841–849. [Google Scholar] [CrossRef] [PubMed]
- Wu, Q.; Yang, Z.; An, Y.; Hu, H.; Yin, J.; Zhang, P.; Nie, Y.; Wu, K.; Shi, Y.; Fan, D. MiR-19a/b modulate the metastasis of gastric cancer cells by targeting the tumour suppressor MXD1. Cell Death Dis. 2014, 5, e1144. [Google Scholar] [CrossRef] [PubMed]
- Lepore, I.; Dell’Aversana, C.; Pilyugin, M.; Conte, M.; Nebbioso, A.; de Bellis, F.; Tambaro, F.P.; Izzo, T.; Garcia-Manero, G.; Ferrara, F.; et al. HDAC inhibitors repress BARD1 isoform expression in acute myeloid leukemia cells via activation of miR-19a and/or b. PLoS ONE 2013, 8, e83018. [Google Scholar] [CrossRef] [PubMed]
- Si, M.L.; Zhu, S.; Wu, H.; Lu, Z.; Wu, F.; Mo, Y.Y. MiR-21-mediated tumor growth. Oncogene 2007, 26, 2799–2803. [Google Scholar] [CrossRef] [PubMed]
- Volinia, S.; Calin, G.A.; Liu, C.G.; Ambs, S.; Cimmino, A.; Petrocca, F.; Visone, R.; Iorio, M.; Roldo, C.; Ferracin, M.; et al. A microRNA expression signature of human solid tumors defines cancer gene targets. Proc. Natl. Acad. Sci. USA 2006, 103, 2257–2261. [Google Scholar] [CrossRef] [PubMed]
- Folini, M.; Gandellini, P.; Longoni, N.; Profumo, V.; Callari, M.; Pennati, M.; Colecchia, M.; Supino, R.; Veneroni, S.; Salvioni, R.; et al. miR-21: An oncomir on strike in prostate cancer. Mol. Cancer 2010, 9, 12. [Google Scholar] [CrossRef] [PubMed]
- Loffler, D.; Brocke-Heidrich, K.; Pfeifer, G.; Stocsits, C.; Hackermuller, J.; Kretzschmar, A.K.; Burger, R.; Gramatzki, M.; Blumert, C.; Bauer, K.; et al. Interleukin-6 dependent survival of multiple myeloma cells involves the stat3-mediated induction of microRNA-21 through a highly conserved enhancer. Blood 2007, 110, 1330–1333. [Google Scholar] [CrossRef] [PubMed]
- Chan, J.A.; Krichevsky, A.M.; Kosik, K.S. MicroRNA-21 is an antiapoptotic factor in human glioblastoma cells. Cancer Res. 2005, 65, 6029–6033. [Google Scholar] [CrossRef] [PubMed]
- Zhu, S.; Wu, H.; Wu, F.; Nie, D.; Sheng, S.; Mo, Y.Y. MicroRNA-21 targets tumor suppressor genes in invasion and metastasis. Cell Res. 2008, 18, 350–359. [Google Scholar] [CrossRef] [PubMed]
- Wang, P.; Zou, F.; Zhang, X.; Li, H.; Dulak, A.; Tomko, R.J., Jr.; Lazo, J.S.; Wang, Z.; Zhang, L.; Yu, J. MicroRNA-21 negatively regulates Cdc25A and cell cycle progression in colon cancer cells. Cancer Res. 2009, 69, 8157–8165. [Google Scholar] [CrossRef] [PubMed]
- Sheedy, F.J. Turning 21: Induction of miR-21 as a key switch in the inflammatory response. Front. Immunol. 2015, 6, 19. [Google Scholar] [CrossRef] [PubMed]
- Yang, C.H.; Yue, J.; Fan, M.; Pfeffer, L.M. IFN induces miR-21 through a signal transducer and activator of transcription 3-dependent pathway as a suppressive negative feedback on IFN-induced apoptosis. Cancer Res. 2010, 70, 8108–8116. [Google Scholar] [CrossRef] [PubMed]
- Yang, C.H.; Yue, J.; Pfeffer, S.R.; Handorf, C.R.; Pfeffer, L.M. MicroRNA miR-21 regulates the metastatic behavior of b16 melanoma cells. J. Biol. Chem. 2011, 286, 39172–39178. [Google Scholar] [CrossRef] [PubMed]
- Jiang, L.; Lv, X.; Li, J.; Li, J.; Li, X.; Li, W.; Li, Y. The status of microRNA-21 expression and its clinical significance in human cutaneous malignant melanoma. Acta Histochem. 2012, 114, 582–588. [Google Scholar] [CrossRef] [PubMed]
- Felli, N.; Felicetti, F.; Lustri, A.M.; Errico, M.C.; Bottero, L.; Cannistraci, A.; de Feo, A.; Petrini, M.; Pedini, F.; Biffoni, M.; et al. miR-126&126* restored expressions play a tumor suppressor role by directly regulating ADAM9 and MMP7 in melanoma. PLoS ONE 2013, 8, e56824. [Google Scholar] [CrossRef] [PubMed]
- Jin, L.; Hu, W.L.; Jiang, C.C.; Wang, J.X.; Han, C.C.; Chu, P.; Zhang, L.J.; Thorne, R.F.; Wilmott, J.; Scolyer, R.A.; et al. MicroRNA-149*, a p53-responsive microRNA, functions as an oncogenic regulator in human melanoma. Proc. Natl. Acad. Sci. USA 2011, 108, 15840–15845. [Google Scholar] [CrossRef] [PubMed]
- Sauroja, I.; Smeds, J.; Vlaykova, T.; Kumar, R.; Talve, L.; Hahka-Kemppinen, M.; Punnonen, K.; Jansen, C.T.; Hemminki, K.; Pyrhonen, S. Analysis of G(1)/S checkpoint regulators in metastatic melanoma. Genes Chromosomes Cancer 2000, 28, 404–414. [Google Scholar] [CrossRef]
- Perrot, C.Y.; Javelaud, D.; Mauviel, A. Insights into the transforming growth factor-beta signaling pathway in cutaneous melanoma. Ann. Dermatol. 2013, 25, 135–144. [Google Scholar] [CrossRef] [PubMed]
- Lynch, H.T.; Fusaro, R.M.; Lynch, J.F.; Brand, R. Pancreatic cancer and the fammm syndrome. Fam. Cancer 2008, 7, 103–112. [Google Scholar] [CrossRef] [PubMed]
- TCGA Data Portal. Available online: https://tcga-data.nci.nih.gov/tcga/tcgaHome2.jsp (accessed on 23 July 2015).
© 2015 by the authors; licensee MDPI, Basel, Switzerland. This article is an open access article distributed under the terms and conditions of the Creative Commons by Attribution (CC-BY) license (http://creativecommons.org/licenses/by/4.0/).
Share and Cite
Pfeffer, S.R.; Grossmann, K.F.; Cassidy, P.B.; Yang, C.H.; Fan, M.; Kopelovich, L.; Leachman, S.A.; Pfeffer, L.M. Detection of Exosomal miRNAs in the Plasma of Melanoma Patients. J. Clin. Med. 2015, 4, 2012-2027. https://doi.org/10.3390/jcm4121957
Pfeffer SR, Grossmann KF, Cassidy PB, Yang CH, Fan M, Kopelovich L, Leachman SA, Pfeffer LM. Detection of Exosomal miRNAs in the Plasma of Melanoma Patients. Journal of Clinical Medicine. 2015; 4(12):2012-2027. https://doi.org/10.3390/jcm4121957
Chicago/Turabian StylePfeffer, Susan R., Kenneth F. Grossmann, Pamela B. Cassidy, Chuan He Yang, Meiyun Fan, Levy Kopelovich, Sancy A. Leachman, and Lawrence M. Pfeffer. 2015. "Detection of Exosomal miRNAs in the Plasma of Melanoma Patients" Journal of Clinical Medicine 4, no. 12: 2012-2027. https://doi.org/10.3390/jcm4121957