The Effect of Lean-Seafood and Non-Seafood Diets on Fasting and Postprandial Serum Metabolites and Lipid Species: Results from a Randomized Crossover Intervention Study in Healthy Adults

 , , , ,
Abstract
:1. Introduction
2. Materials and Methods
2.1. Study Design
2.2. Subjects
2.3. Diets
2.4. Serum Sampling and Analyses
2.5. Metabolite Profiling
2.5.1. NMR Spectroscopy
2.5.2. Liquid Chromatogram-Mass Spectrometry Lipidomics
Chemicals
Lipid Extraction
Ultrahigh Performance Liquid Chromatography (UPLC) Conditions
Mass Spectrometry Conditions
Data Preprocessing
2.6. Data Analysis
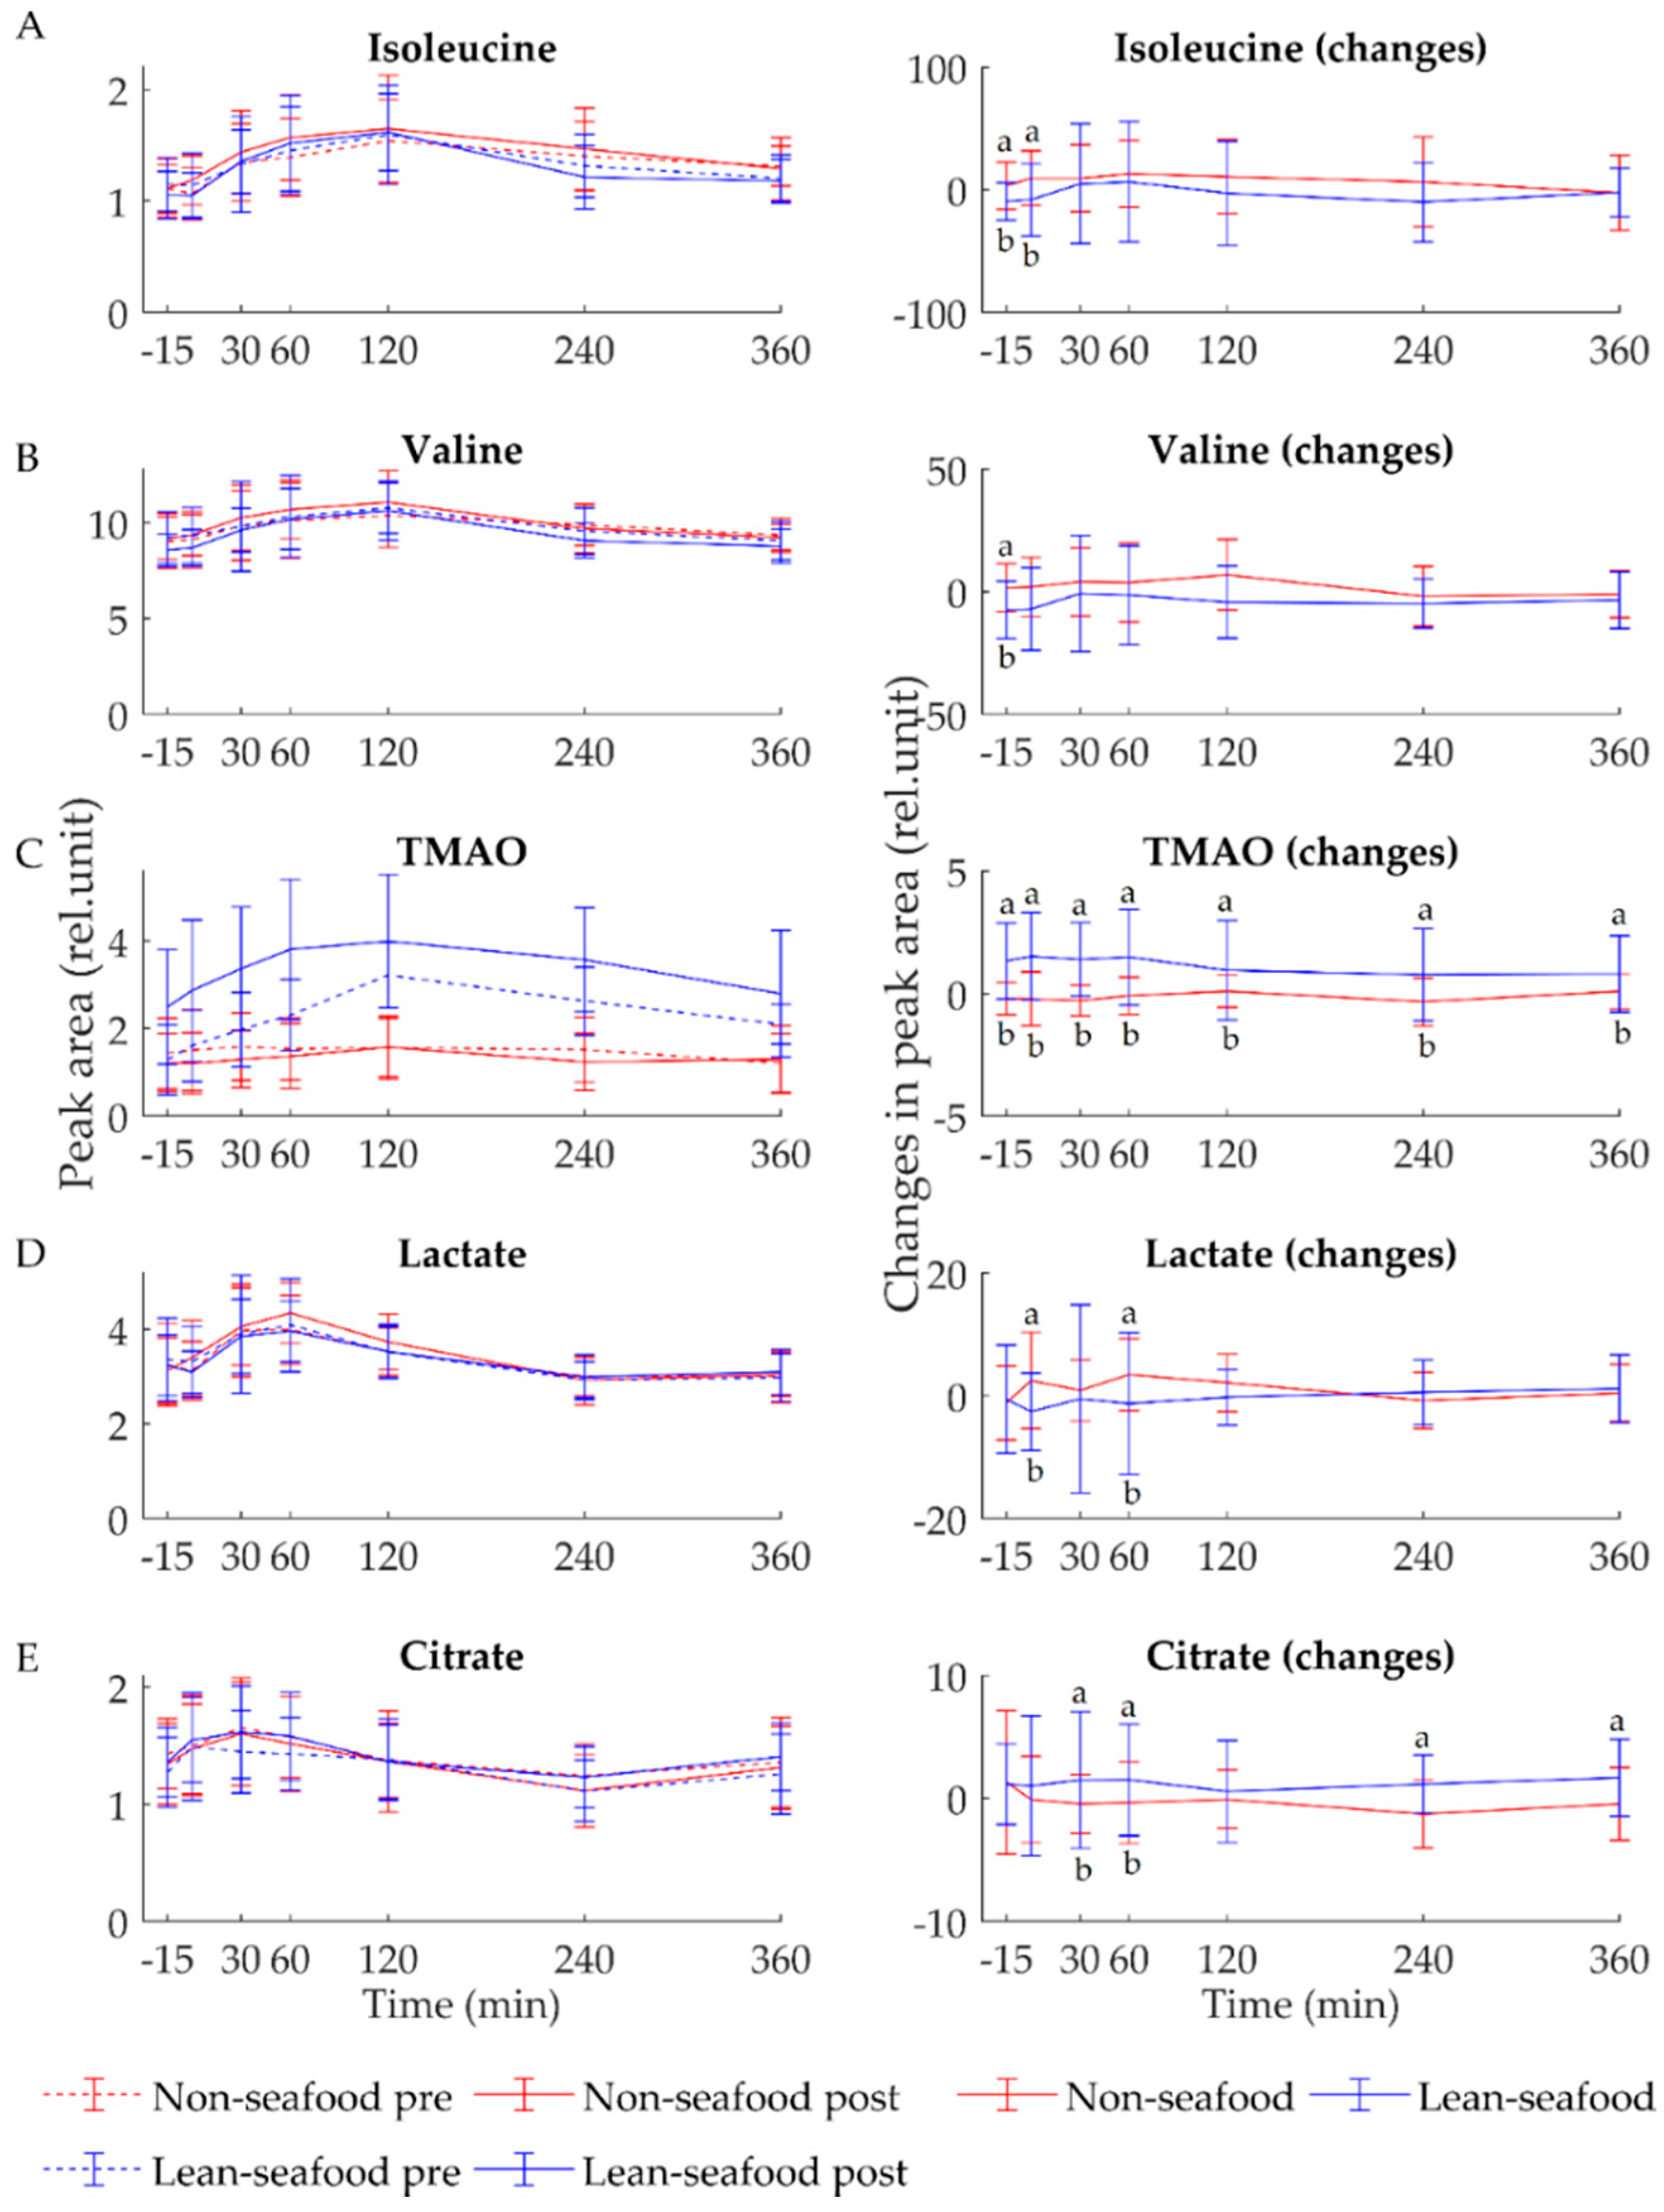
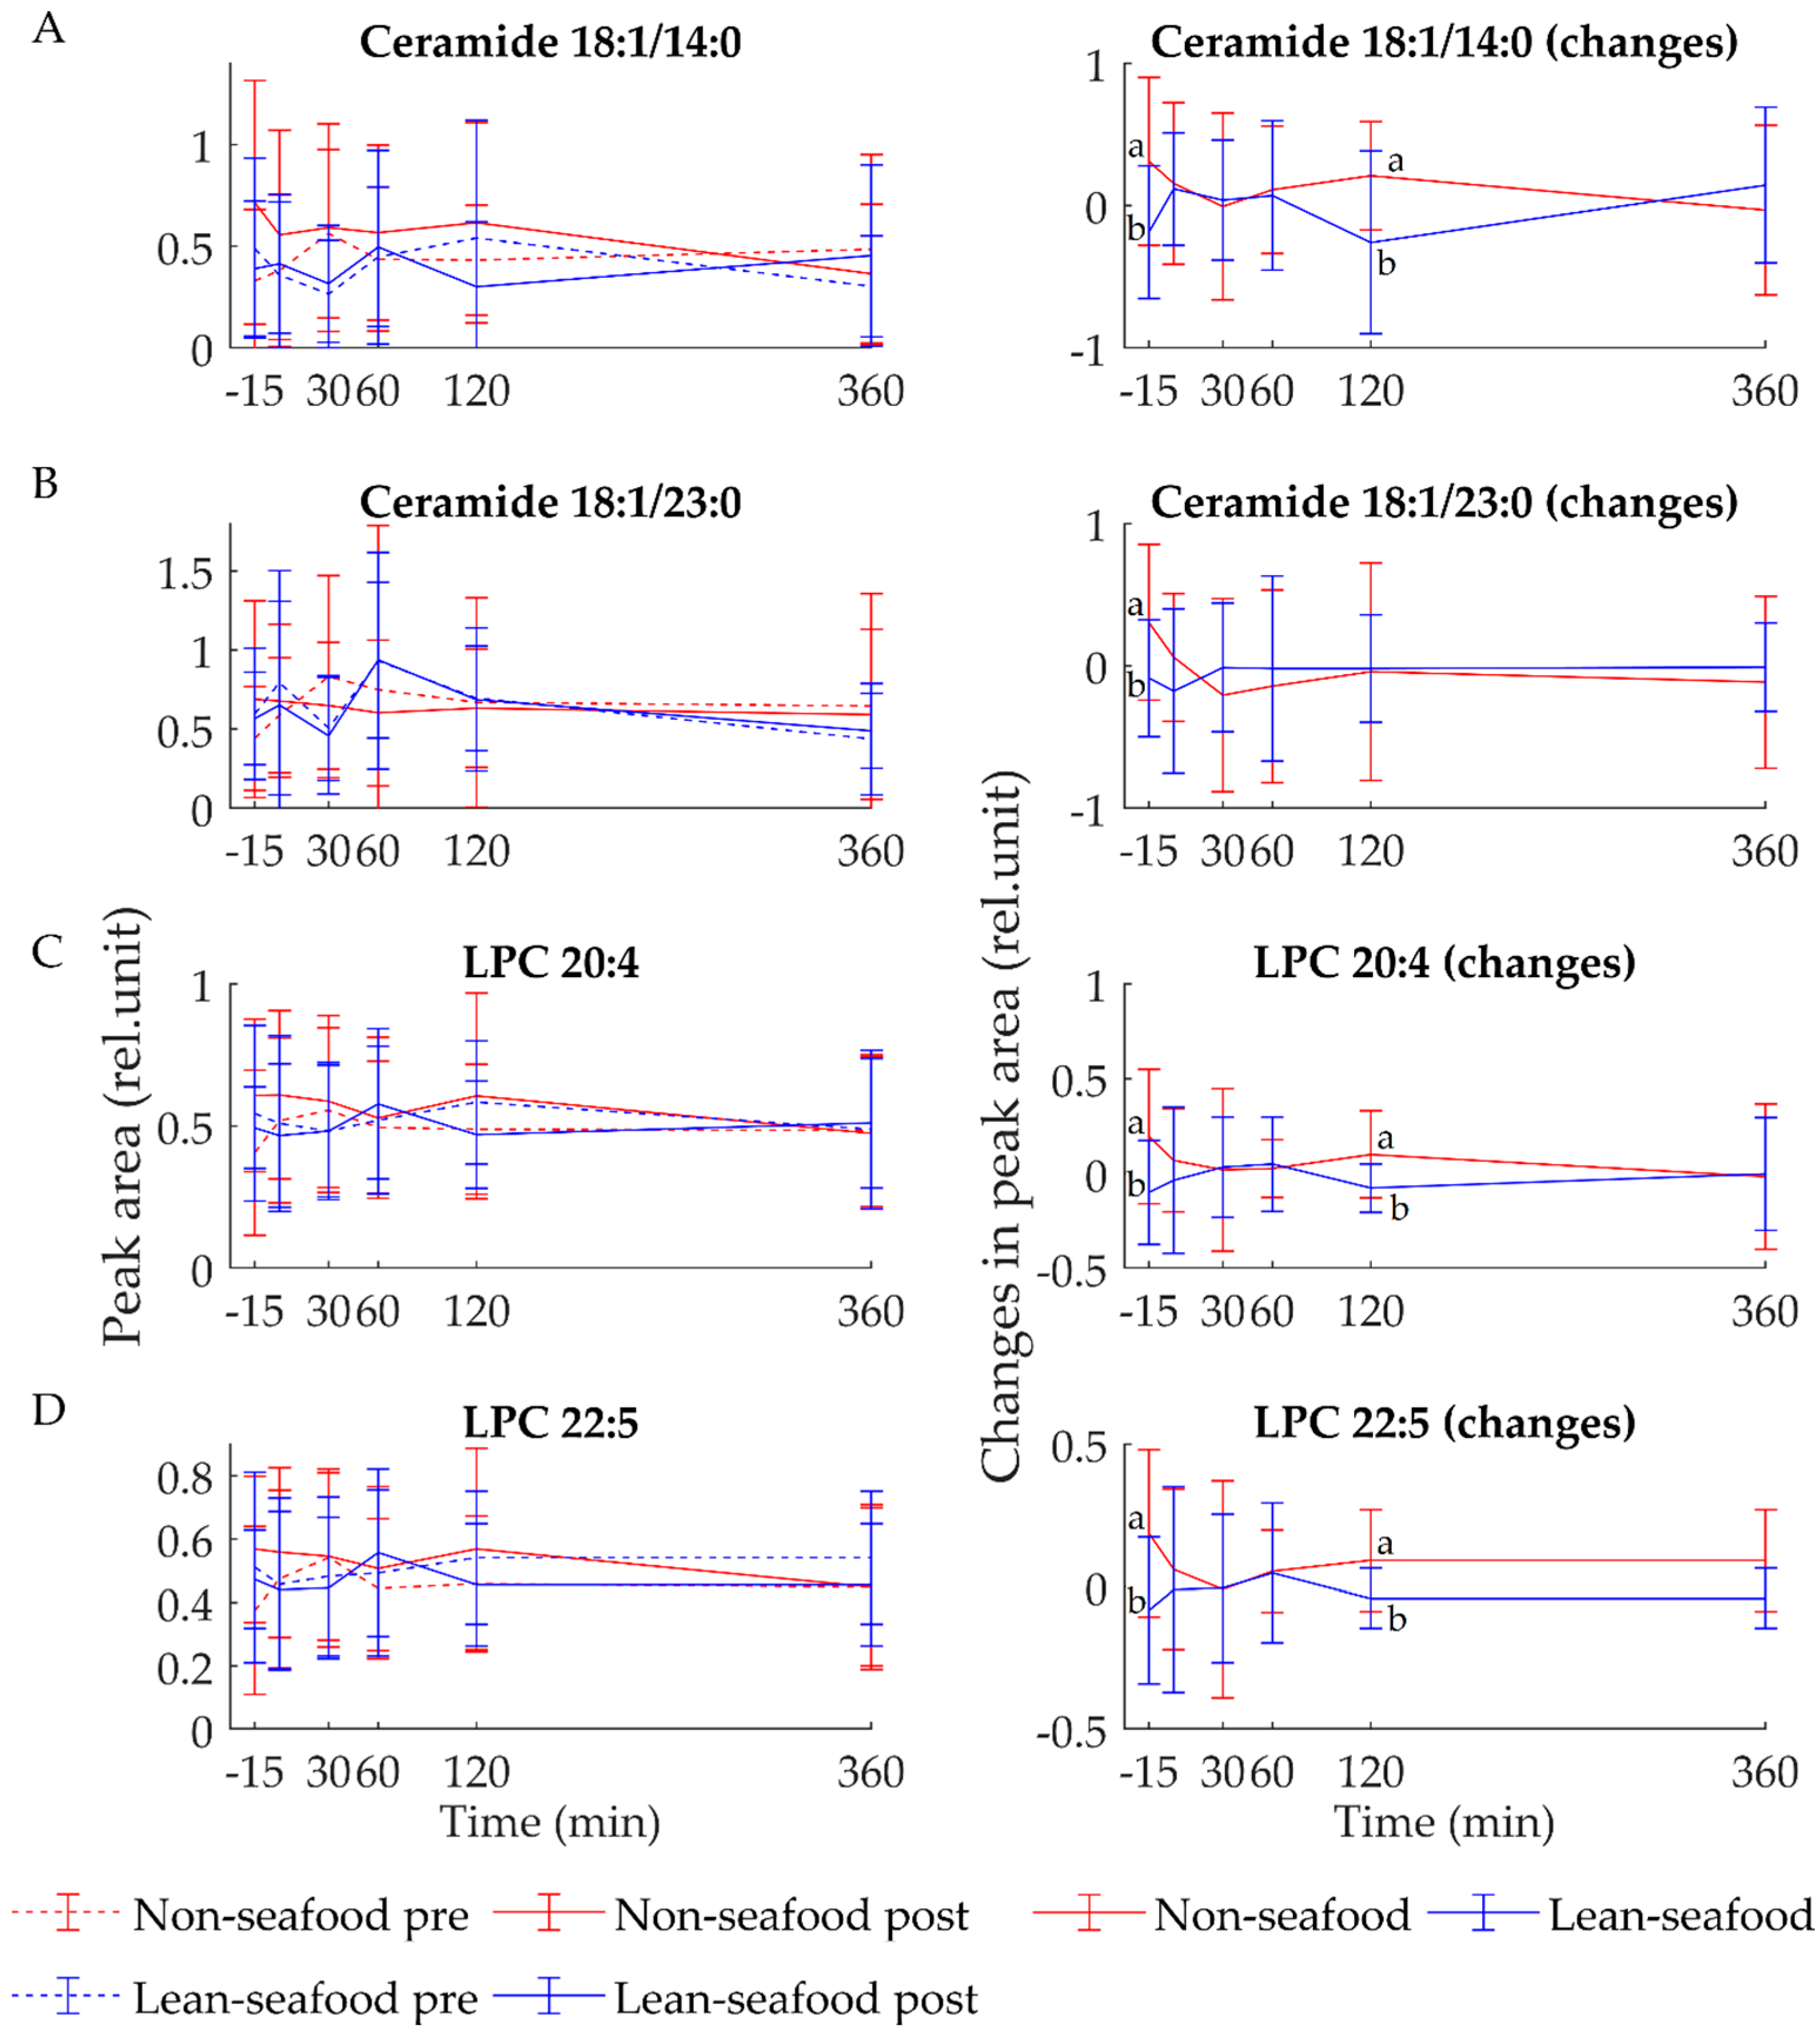
3. Results
3.1. Fasting State
3.2. Postprandial State
3.3. Dietary Amino Acid Composition
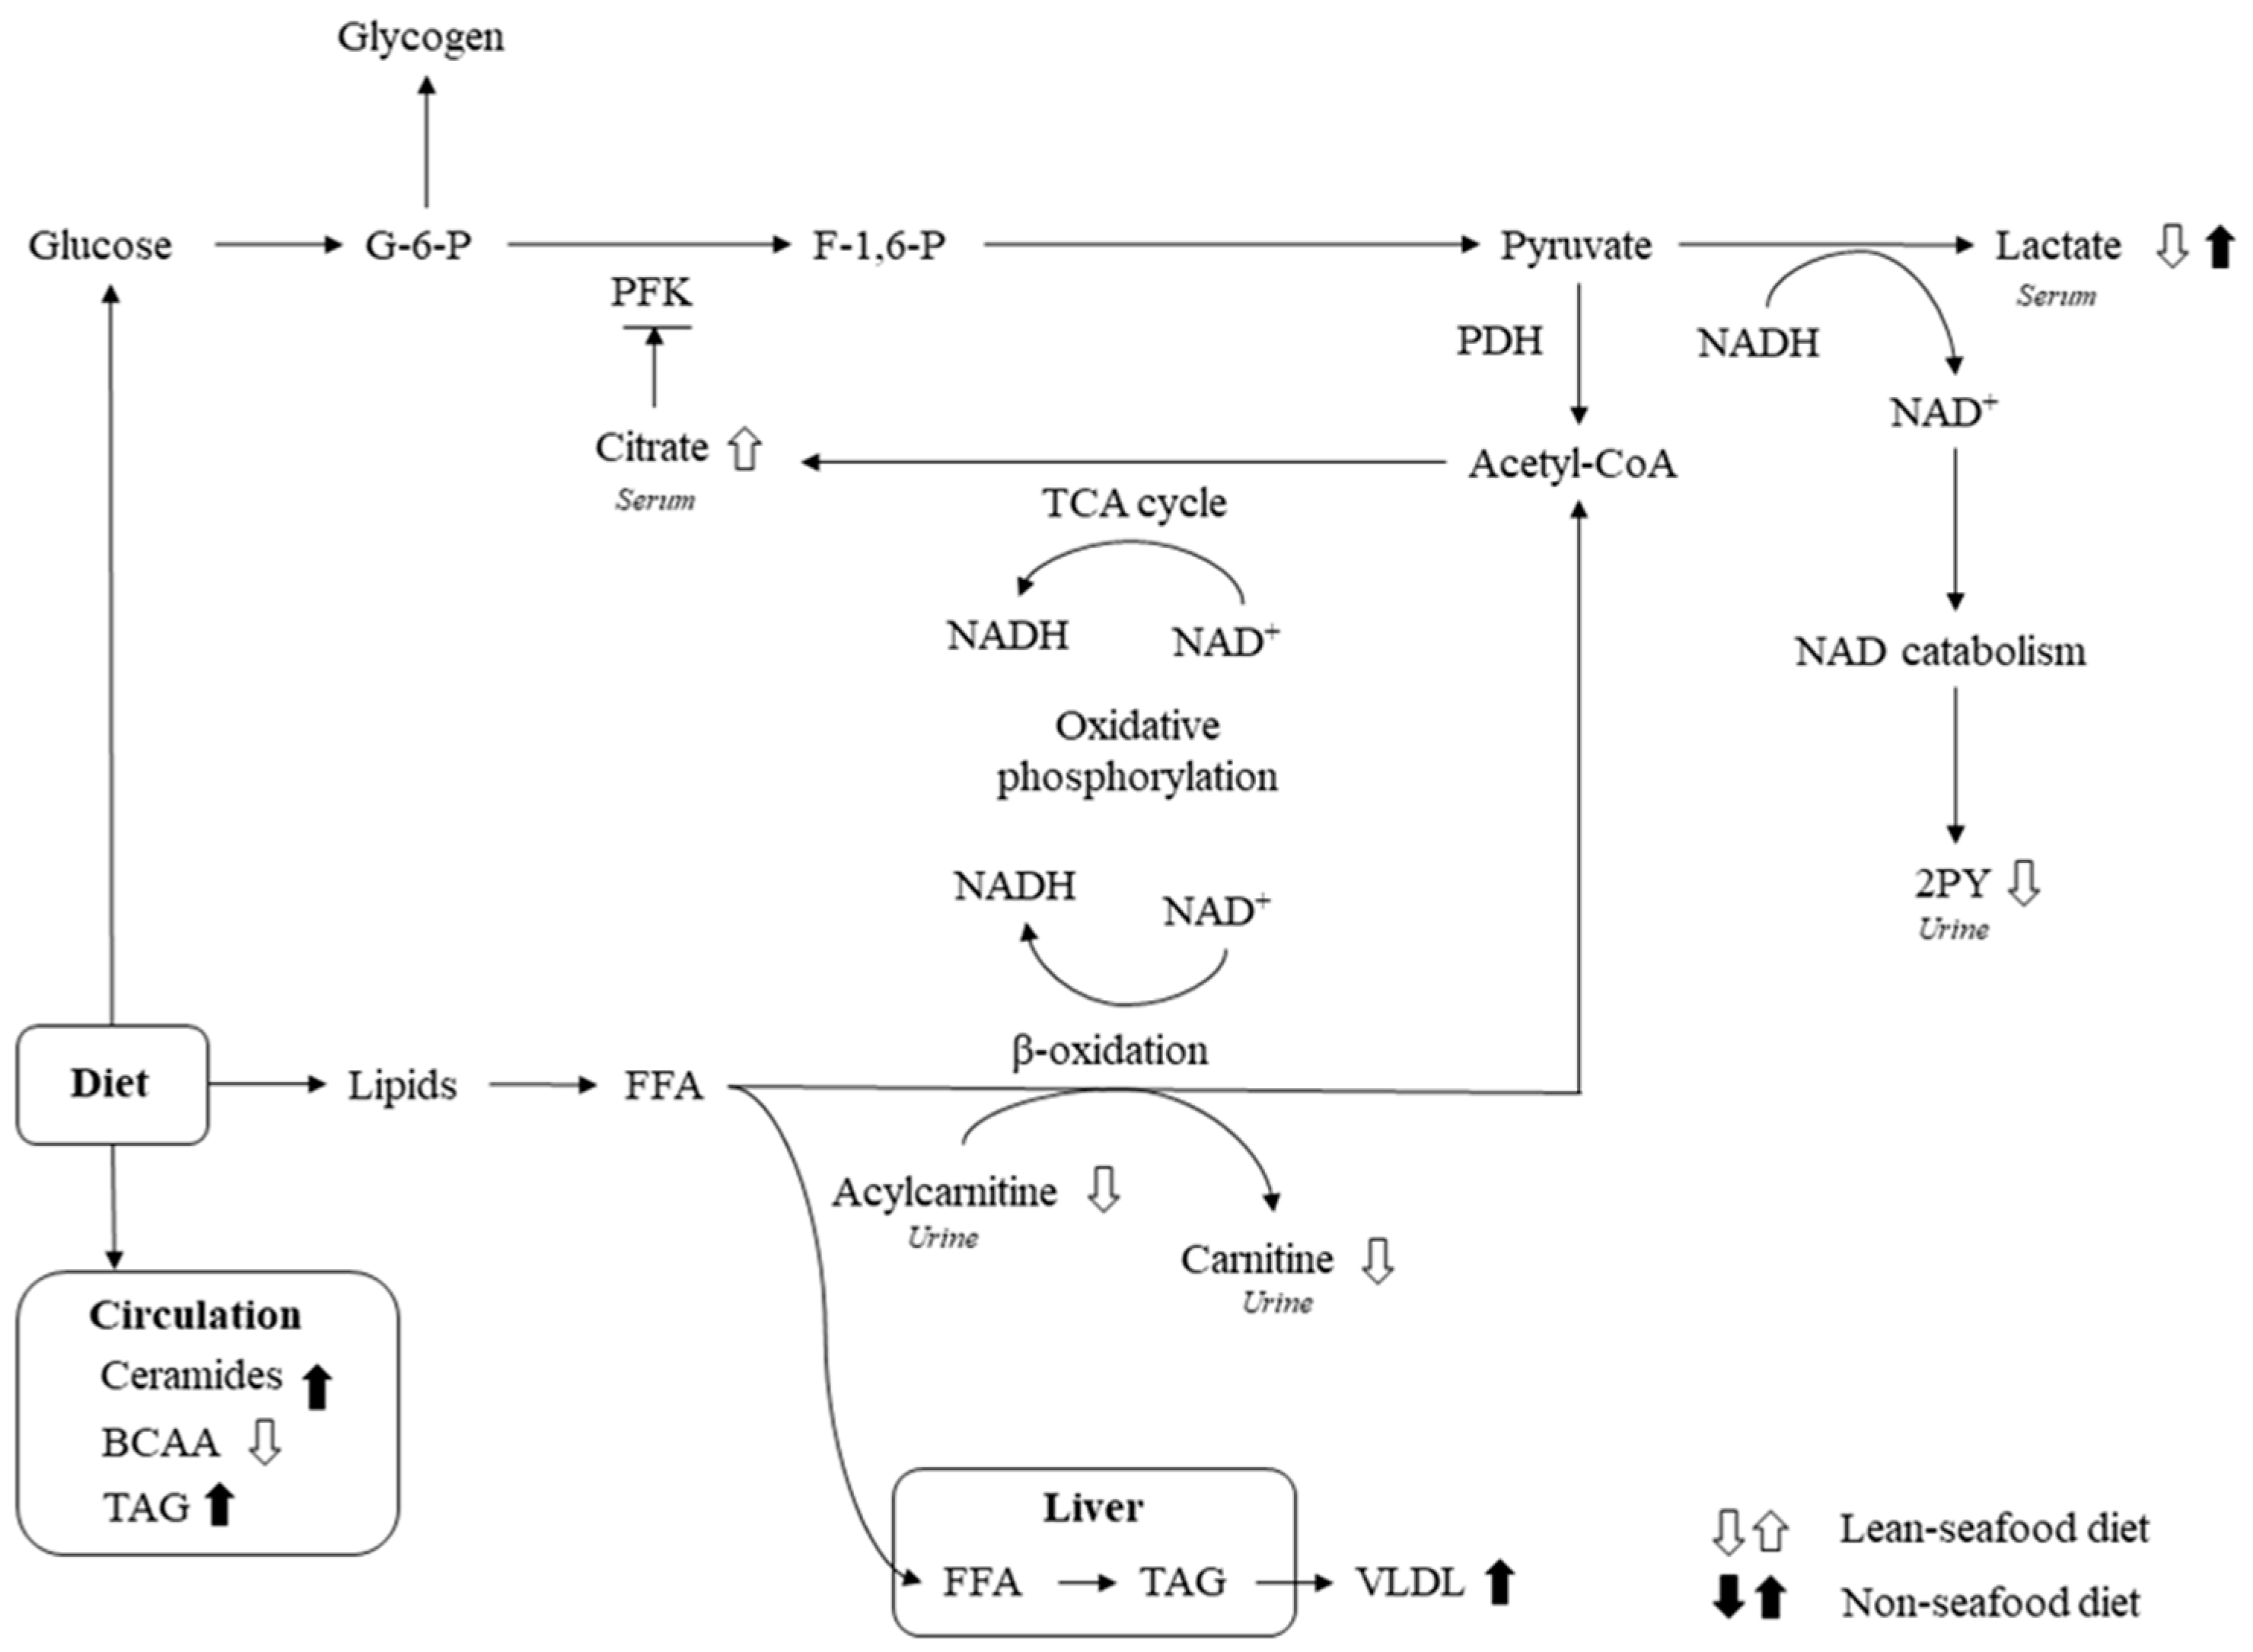
4. Discussion
4.1. Lean-Seafood Intake Modulate Markers of Energy Metabolism
4.2. Lean-Seafood Intake Decreases Circulating BCAAs
4.3. Non-Seafood Intake Increases Circulating Ceramides and Lysophosphatidylcholine Species
4.4. Lean-Seafood Intake Increases Circulating TMAO Levels but Decreases Other Risk Markers of CVD
4.5. Dietary Exposure Markers
5. Conclusions
Supplementary Materials
Author Contributions
Acknowledgments
Conflicts of Interest
References
- Huber, M.; Knottnerus, J.A.; Green, L.; van der Horst, H.; Jadad, A.R.; Kromhout, D.; Leonard, B.; Lorig, K.; Loureiro, M.I.; van der Meer, J.W.M.; et al. How should we define health? BMJ 2011, 343. [Google Scholar] [CrossRef] [PubMed]
- Pellis, L.; van Erk, M.J.; van Ommen, B.; Bakker, G.C.; Hendriks, H.F.; Cnubben, N.H.; Kleemann, R.; van Someren, E.P.; Bobeldijk, I.; Rubingh, C.M.; et al. Plasma metabolomics and proteomics profiling after a postprandial challenge reveal subtle diet effects on human metabolic status. Metabolomics 2012, 8, 347–359. [Google Scholar] [CrossRef] [PubMed]
- Mah, E.; Bruno, R.S. Postprandial hyperglycemia on vascular endothelial function: Mechanisms and consequences. Nutr. Res. 2012, 32, 727–740. [Google Scholar] [CrossRef] [PubMed]
- Bansal, S.; Buring, J.E.; Rifai, N.; Mora, S.; Sacks, F.M.; Ridker, P.M. Fasting compared with nonfasting triglycerides and risk of cardiovascular events in women. JAMA 2007, 298, 309–316. [Google Scholar] [CrossRef] [PubMed]
- Pauling, L.; Robinson, A.B.; Teranishi, R.; Cary, P. Quantitative analysis of urine vapor and breath by gas-liquid partition chromatography. Proc. Natl. Acad. Sci. USA 1971, 68, 2374–2376. [Google Scholar] [CrossRef] [PubMed]
- Wang, T.J.; Larson, M.G.; Vasan, R.S.; Cheng, S.; Rhee, E.P.; McCabe, E.; Lewis, G.D.; Fox, C.S.; Jacques, P.F.; Fernandez, C.; et al. Metabolite profiles and the risk of developing diabetes. Nat. Med. 2011, 17, 448–453. [Google Scholar] [CrossRef] [PubMed]
- Goffredo, M.; Santoro, N.; Trico, D.; Giannini, C.; D’Adamo, E.; Zhao, H.; Peng, G.; Yu, X.; Lam, T.T.; Pierpont, B.; et al. A Branched-Chain Amino Acid-Related Metabolic Signature Characterizes Obese Adolescents with Non-Alcoholic Fatty Liver Disease. Nutrients 2017, 9, 642. [Google Scholar] [CrossRef] [PubMed]
- Foster, G.D.; Wyatt, H.R.; Hill, J.O.; Makris, A.P.; Rosenbaum, D.L.; Brill, C.; Stein, R.I.; Mohammed, B.S.; Miller, B.; Rader, D.J.; et al. Weight and metabolic outcomes after 2 years on a low-carbohydrate versus low-fat diet: A randomized trial. Ann. Intern. Med. 2010, 153, 147–157. [Google Scholar] [CrossRef] [PubMed]
- Shai, I.; Schwarzfuchs, D.; Henkin, Y.; Shahar, D.R.; Witkow, S.; Greenberg, I.; Golan, R.; Fraser, D.; Bolotin, A.; Vardi, H.; et al. Weight loss with a low-carbohydrate, Mediterranean, or low-fat diet. N. Engl. J. Med. 2008, 359, 229–241. [Google Scholar] [CrossRef] [PubMed]
- Hu, T.; Bazzano, L.A. The low-carbohydrate diet and cardiovascular risk factors: Evidence from epidemiologic studies. Nutr. Metab. Cardiovasc. Dis. 2014, 24, 337–343. [Google Scholar] [CrossRef] [PubMed]
- Farvid, M.S.; Malekshah, A.F.; Pourshams, A.; Poustchi, H.; Sepanlou, S.G.; Sharafkhah, M.; Khoshnia, M.; Farvid, M.; Abnet, C.C.; Kamangar, F.; et al. Dietary Protein Sources and All-Cause and Cause-Specific Mortality: The Golestan Cohort Study in Iran. Am. J. Prev. Med. 2017, 52, 237–248. [Google Scholar] [CrossRef] [PubMed]
- Sinha, R.; Cross, A.J.; Graubard, B.I.; Leitzmann, M.F.; Schatzkin, A. Meat intake and mortality: A prospective study of over half a million people. Arch. Intern. Med. 2009, 169, 562–571. [Google Scholar] [CrossRef] [PubMed]
- Snowdon, D.A.; Phillips, R.L.; Fraser, G.E. Meat consumption and fatal ischemic heart disease. Prev. Med. 1984, 13, 490–500. [Google Scholar] [CrossRef]
- Bernstein, A.M.; Sun, Q.; Hu, F.B.; Stampfer, M.J.; Manson, J.E.; Willett, W.C. Major Dietary Protein Sources and Risk of Coronary Heart Disease in Women. Circulation 2010, 122, 876–883. [Google Scholar] [CrossRef] [PubMed]
- Richter, C.K.; Skulas-Ray, A.C.; Champagne, C.M.; Kris-Etherton, P.M. Plant Protein and Animal Proteins: Do They Differentially Affect Cardiovascular Disease Risk? Adv. Nutr. Int. Rev. J. 2015, 6, 712–728. [Google Scholar] [CrossRef] [PubMed]
- Zheng, J.; Huang, T.; Yu, Y.; Hu, X.; Yang, B.; Li, D. Fish consumption and CHD mortality: An updated meta-analysis of seventeen cohort studies. Public Health Nutr. 2012, 15, 725–737. [Google Scholar] [CrossRef] [PubMed]
- He, K.; Song, Y.Q.; Daviglus, M.L.; Liu, K.; Van Horn, L.; Dyer, A.R.; Greenland, P. Accumulated evidence on fish consumption and coronary heart disease mortality—A meta-analysis of cohort studies. Circulation 2004, 109, 2705–2711. [Google Scholar] [CrossRef] [PubMed]
- Mozaffarian, D.; Wu, J.H. Omega-3 fatty acids and cardiovascular disease: Effects on risk factors, molecular pathways, and clinical events. J. Am. Coll. Cardiol. 2011, 58, 2047–2067. [Google Scholar] [CrossRef] [PubMed]
- Beauchesne-Rondeau, E.; Gascon, A.; Bergeron, J.; Jacques, H. Plasma lipids and lipoproteins in hypercholesterolemic men fed a lipid-lowering diet containing lean beef, lean fish, or poultry. Am. J. Clin. Nutr. 2003, 77, 587–593. [Google Scholar] [CrossRef] [PubMed]
- Rylander, C.; Sandanger, T.M.; Engeset, D.; Lund, E. Consumption of Lean Fish Reduces the Risk of Type 2 Diabetes Mellitus: A Prospective Population Based Cohort Study of Norwegian Women. PLoS ONE 2014, 9, e89845. [Google Scholar] [CrossRef] [PubMed] [Green Version]
- Ouellet, V.; Marois, J.; Weisnagel, S.J.; Jacques, H. Dietary cod protein improves insulin sensitivity in insulin-resistant men and women. Diabetes Care 2007, 30, 2816–2821. [Google Scholar] [CrossRef] [PubMed]
- Tørris, C.; Molin, M.; Småstuen, M. Lean Fish Consumption Is Associated with Beneficial Changes in the Metabolic Syndrome Components: A 13-Year Follow-Up Study from the Norwegian Tromsø Study. Nutrients 2017, 9, 247. [Google Scholar] [CrossRef] [PubMed]
- Aadland, E.K.; Lavigne, C.; Graff, I.E.; Eng, Ø.; Paquette, M.; Holthe, A.; Mellgren, G.; Jacques, H.; Liaset, B. Lean-seafood intake reduces cardiovascular lipid risk factors in healthy subjects: Results from a randomized controlled trial with a crossover design. Am. J. Clin. Nutr. 2015, 102, 582–592. [Google Scholar] [CrossRef] [PubMed]
- Aadland, E.K.; Graff, I.E.; Lavigne, C.; Eng, Ø.; Paquette, M.; Holthe, A.; Mellgren, G.; Madsen, L.; Jacques, H.; Liaset, B. Lean Seafood Intake Reduces Postprandial C-peptide and Lactate Concentrations in Healthy Adults in a Randomized Controlled Trial with a Crossover Design. J. Nutr. 2016, 146, 1027–1034. [Google Scholar] [CrossRef] [PubMed]
- Schmedes, M.; Aadland, E.K.; Sundekilde, U.K.; Jacques, H.; Lavigne, C.; Graff, I.E.; Eng, O.; Holthe, A.; Mellgren, G.; Young, J.F.; et al. Lean-seafood intake decreases urinary markers of mitochondrial lipid and energy metabolism in healthy subjects: Metabolomics results from a randomized crossover intervention study. Mol. Nutr. Food Res. 2016, 60, 1661–1672. [Google Scholar] [CrossRef] [PubMed]
- Schmedes, M.; Brejnrod, A.D.; Aadland, E.K.; Kiilerich, P.; Kristiansen, K.; Jacques, H.; Lavigne, C.; Graff, I.E.; Eng, Ø.; Holthe, A.; et al. The Effect of Lean-Seafood and Non-Seafood Diets on Fecal Metabolites and Gut Microbiome: Results From a Randomized Crossover Intervention Study. Mol. Nutr. Food Res. 2018. [Google Scholar] [CrossRef] [PubMed]
- Matyash, V.; Liebisch, G.; Kurzchalia, T.V.; Shevchenko, A.; Schwudke, D. Lipid extraction by methyl-tert-butyl ether for high-throughput lipidomics. J. Lipid Res. 2008, 49, 1137–1146. [Google Scholar] [CrossRef] [PubMed]
- Katajamaa, M.; Miettinen, J.; Oresic, M. MZmine: Toolbox for processing and visualization of mass spectrometry based molecular profile data. Bioinformatics 2006, 22, 634–636. [Google Scholar] [CrossRef] [PubMed]
- Dunn, W.B.; Broadhurst, D.; Begley, P.; Zelena, E.; Francis-McIntyre, S.; Anderson, N.; Brown, M.; Knowles, J.D.; Halsall, A.; Haselden, J.N.; et al. Procedures for large-scale metabolic profiling of serum and plasma using gas chromatography and liquid chromatography coupled to mass spectrometry. Nat. Protoc. 2011, 6, 1060–1083. [Google Scholar] [CrossRef] [PubMed]
- Bates, D.; Mächler, M.; Bolker, B.; Walker, S. Fitting Linear Mixed-Effects Models Using lme4. J. Stat. Softw. 2015, 67, 48. [Google Scholar] [CrossRef]
- Halekoh, U.; Højsgaard, S. A Kenward-Roger Approximation and Parametric Bootstrap Methods for Tests in Linear Mixed Models—The R Package pbkrtest. J. Stat. Softw. 2014, 59, 1–30. [Google Scholar] [CrossRef]
- Lenth, R.V. Least-Squares Means: The R Package lsmeans. J. Stat. Softw. 2016, 69, 1–33. [Google Scholar] [CrossRef]
- RC Team. R: A Language and Environment for Statistical Computing. R Foundation for Statistical Computing. 2007. Available online: www.r-project.org (accessed on 3 March 2018).
- Wang, Z.; Klipfell, E.; Bennett, B.J.; Koeth, R.; Levison, B.S.; DuGar, B.; Feldstein, A.E.; Britt, E.B.; Fu, X.; Chung, Y.-M.; et al. Gut flora metabolism of phosphatidylcholine promotes cardiovascular disease. Nature 2011, 472, 57–63. [Google Scholar] [CrossRef] [PubMed]
- Tang, W.H.W.; Wang, Z.; Levison, B.S.; Koeth, R.A.; Britt, E.B.; Fu, X.; Wu, Y.; Hazen, S.L. Intestinal Microbial Metabolism of Phosphatidylcholine and Cardiovascular Risk. N. Engl. J. Med. 2013, 368, 1575–1584. [Google Scholar] [CrossRef] [PubMed]
- Muoio, D.M. Metabolic inflexibility: When mitochondrial indecision leads to metabolic gridlock. Cell 2014, 159, 1253–1262. [Google Scholar] [CrossRef] [PubMed]
- Salek, R.M.; Maguire, M.L.; Bentley, E.; Rubtsov, D.V.; Hough, T.; Cheeseman, M.; Nunez, D.; Sweatman, B.C.; Haselden, J.N.; Cox, R.D.; et al. A metabolomic comparison of urinary changes in type 2 diabetes in mouse, rat, and human. Physiol. Genom. 2007, 29, 99–108. [Google Scholar] [CrossRef] [PubMed]
- Mihalik, S.J.; Goodpaster, B.H.; Kelley, D.E.; Chace, D.H.; Vockley, J.; Toledo, F.G.S.; DeLany, J.P. Increased Levels of Plasma Acylcarnitines in Obesity and Type 2 Diabetes and Identification of a Marker of Glucolipotoxicity. Obesity 2010, 18, 1695–1700. [Google Scholar] [CrossRef] [PubMed]
- Ha, C.Y.; Kim, J.Y.; Paik, J.K.; Kim, O.Y.; Paik, Y.H.; Lee, E.J.; Lee, J.H. The association of specific metabolites of lipid metabolism with markers of oxidative stress, inflammation and arterial stiffness in men with newly diagnosed type 2 diabetes. Clin. Endocrinol. 2012, 76, 674–682. [Google Scholar] [CrossRef] [PubMed]
- Thorburn, A.W.; Gumbiner, B.; Bulacan, F.; Wallace, P.; Henry, R.R. Intracellular glucose oxidation and glycogen synthase activity are reduced in non-insulin-dependent (type II) diabetes independent of impaired glucose uptake. J. Clin. Investig. 1990, 85, 522–529. [Google Scholar] [CrossRef] [PubMed]
- Petersen, K.F.; Dufour, S.; Savage, D.B.; Bilz, S.; Solomon, G.; Yonemitsu, S.; Cline, G.W.; Befroy, D.; Zemany, L.; Kahn, B.B.; et al. The role of skeletal muscle insulin resistance in the pathogenesis of the metabolic syndrome. Proc. Natl. Acad. Sci. USA 2007, 104, 12587–12594. [Google Scholar] [CrossRef] [PubMed]
- Berg, J.M.; Tymoczko, J.L.; Stryer, L. The Glycolytic Pathway Is Tightly Controlled. In Biochemistry, 5th ed.; 2002. Available online: https://www.ncbi.nlm.nih.gov/books/NBK22395/ (accessed on 10 March 2018).
- Lillefosse, H.H.; Clausen, M.R.; Yde, C.C.; Ditlev, D.B.; Zhang, X.; Du, Z.-Y.; Bertram, H.C.; Madsen, L.; Kristiansen, K.; Liaset, B. Urinary Loss of Tricarboxylic Acid Cycle Intermediates as Revealed by Metabolomics Studies: An Underlying Mechanism to Reduce Lipid Accretion by Whey Protein Ingestion? J. Proteome Res. 2014, 13, 2560–2570. [Google Scholar] [CrossRef] [PubMed]
- Cline, G.W.; Petersen, K.F.; Krssak, M.; Shen, J.; Hundal, R.S.; Trajanoski, Z.; Inzucchi, S.; Dresner, A.; Rothman, D.L.; Shulman, G.I. Impaired Glucose Transport as a Cause of Decreased Insulin-Stimulated Muscle Glycogen Synthesis in Type 2 Diabetes. N. Engl. J. Med. 1999, 341, 240–246. [Google Scholar] [CrossRef] [PubMed]
- Shulman, G.I. Cellular mechanisms of insulin resistance. J. Clin. Investig. 2000, 106, 171–176. [Google Scholar] [CrossRef] [PubMed]
- Newgard, C.B.; An, J.; Bain, J.R.; Muehlbauer, M.J.; Stevens, R.D.; Lien, L.F.; Haqq, A.M.; Shah, S.H.; Arlotto, M.; Slentz, C.A.; et al. A branched-chain amino acid-related metabolic signature that differentiates obese and lean humans and contributes to insulin resistance. Cell Metab. 2009, 9, 311–326. [Google Scholar] [CrossRef] [PubMed]
- Lerin, C.; Goldfine, A.B.; Boes, T.; Liu, M.; Kasif, S.; Dreyfuss, J.M.; De Sousa-Coelho, A.L.; Daher, G.; Manoli, I.; Sysol, J.R.; et al. Defects in muscle branched-chain amino acid oxidation contribute to impaired lipid metabolism. Mol. Metab. 2016, 5, 926–936. [Google Scholar] [CrossRef] [PubMed]
- Herman, M.A.; She, P.; Peroni, O.D.; Lynch, C.J.; Kahn, B.B. Adipose tissue branched chain amino acid (BCAA) metabolism modulates circulating BCAA levels. J. Biol. Chem. 2010, 285, 11348–11356. [Google Scholar] [CrossRef] [PubMed]
- Cavallaro, N.L.; Garry, J.; Shi, X.; Gerszten, R.E.; Anderson, E.J.; Walford, G.A. A pilot, short-term dietary manipulation of branched chain amino acids has modest influence on fasting levels of branched chain amino acids. Food Nutr. Res. 2016, 60. [Google Scholar] [CrossRef] [PubMed]
- Pedersen, H.K.; Gudmundsdottir, V.; Nielsen, H.B.; Hyotylainen, T.; Nielsen, T.; Jensen, B.A.H.; Forslund, K.; Hildebrand, F.; Prifti, E.; Falony, G.; et al. Human gut microbes impact host serum metabolome and insulin sensitivity. Nature 2016, 535, 376–381. [Google Scholar] [CrossRef] [PubMed]
- Haus, J.M.; Kashyap, S.R.; Kasumov, T.; Zhang, R.; Kelly, K.R.; Defronzo, R.A.; Kirwan, J.P. Plasma ceramides are elevated in obese subjects with type 2 diabetes and correlate with the severity of insulin resistance. Diabetes 2009, 58, 337–343. [Google Scholar] [CrossRef] [PubMed]
- Pickersgill, L.; Litherland, G.J.; Greenberg, A.S.; Walker, M.; Yeaman, S.J. Key role for ceramides in mediating insulin resistance in human muscle cells. J. Biol. Chem. 2007, 282, 12583–12589. [Google Scholar] [CrossRef] [PubMed]
- Holland, W.L.; Brozinick, J.T.; Wang, L.P.; Hawkins, E.D.; Sargent, K.M.; Liu, Y.; Narra, K.; Hoehn, K.L.; Knotts, T.A.; Siesky, A.; et al. Inhibition of ceramide synthesis ameliorates glucocorticoid-, saturated-fat-, and obesity-induced insulin resistance. Cell Metab. 2007, 5, 167–179. [Google Scholar] [CrossRef] [PubMed]
- Chavez, J.A.; Knotts, T.A.; Wang, L.P.; Li, G.; Dobrowsky, R.T.; Florant, G.L.; Summers, S.A. A role for ceramide, but not diacylglycerol, in the antagonism of insulin signal transduction by saturated fatty acids. J. Biol. Chem. 2003, 278, 10297–10303. [Google Scholar] [CrossRef] [PubMed]
- JeBailey, L.; Wanono, O.; Niu, W.; Roessler, J.; Rudich, A.; Klip, A. Ceramide- and oxidant-induced insulin resistance involve loss of insulin-dependent Rac-activation and actin remodeling in muscle cells. Diabetes 2007, 56, 394–403. [Google Scholar] [CrossRef] [PubMed]
- Skovbro, M.; Baranowski, M.; Skov-Jensen, C.; Flint, A.; Dela, F.; Gorski, J.; Helge, J.W. Human skeletal muscle ceramide content is not a major factor in muscle insulin sensitivity. Diabetologia 2008, 51, 1253–1260. [Google Scholar] [CrossRef] [PubMed]
- Serlie, M.J.; Meijer, A.J.; Groener, J.E.; Duran, M.; Endert, E.; Fliers, E.; Aerts, J.M.; Sauerwein, H.P. Short-term manipulation of plasma free fatty acids does not change skeletal muscle concentrations of ceramide and glucosylceramide in lean and overweight subjects. J. Clin. Endocrinol. Metab. 2007, 92, 1524–1529. [Google Scholar] [CrossRef] [PubMed]
- Hannun, Y.A.; Luberto, C. Ceramide in the eukaryotic stress response. Trends Cell Biol. 2000, 10, 73–80. [Google Scholar] [CrossRef]
- Turner, N.; Kowalski, G.M.; Leslie, S.J.; Risis, S.; Yang, C.; Lee-Young, R.S.; Babb, J.R.; Meikle, P.J.; Lancaster, G.I.; Henstridge, D.C.; et al. Distinct patterns of tissue-specific lipid accumulation during the induction of insulin resistance in mice by high-fat feeding. Diabetologia 2013, 56, 1638–1648. [Google Scholar] [CrossRef] [PubMed]
- Fucho, R.; Casals, N.; Serra, D.; Herrero, L. Ceramides and mitochondrial fatty acid oxidation in obesity. FASEB J. Off. Publ. Fed. Am. Soc. Exp. Biol. 2017, 31, 1263–1272. [Google Scholar] [CrossRef] [PubMed]
- Schmitz, G.; Ruebsaamen, K. Metabolism and atherogenic disease association of lysophosphatidylcholine. Atherosclerosis 2010, 208, 10–18. [Google Scholar] [CrossRef] [PubMed]
- Liu-Wu, Y.; Hurt-Camejo, E.; Wiklund, O. Lysophosphatidylcholine induces the production of IL-1β by human monocytes. Atherosclerosis 1998, 137, 351–357. [Google Scholar] [CrossRef]
- Zeng, H.; Tong, R.; Tong, W.; Yang, Q.; Qiu, M.; Xiong, A.; Sun, S.; Ding, L.; Zhang, H.; Yang, L.; et al. Metabolic Biomarkers for Prognostic Prediction of Pre-diabetes: Results from a longitudinal cohort study. Sci. Rep. 2017, 7, 6575. [Google Scholar] [CrossRef] [PubMed]
- Tonks, K.T.; Coster, A.C.; Christopher, M.J.; Chaudhuri, R.; Xu, A.; Gagnon-Bartsch, J.; Chisholm, D.J.; James, D.E.; Meikle, P.J.; Greenfield, J.R.; et al. Skeletal muscle and plasma lipidomic signatures of insulin resistance and overweight/obesity in humans. Obesity 2016, 24, 908–916. [Google Scholar] [CrossRef] [PubMed]
- Seldin, M.M.; Meng, Y.; Qi, H.; Zhu, W.; Wang, Z.; Hazen, S.L.; Lusis, A.J.; Shih, D.M. Trimethylamine N-Oxide Promotes Vascular Inflammation through Signaling of Mitogen-Activated Protein Kinase and Nuclear Factor-kappaB. J. Am. Heart Assoc. 2016, 5, e002767. [Google Scholar] [CrossRef] [PubMed]
- Van Oostrom, A.J.; Rabelink, T.J.; Verseyden, C.; Sijmonsma, T.P.; Plokker, H.W.; De Jaegere, P.P.; Cabezas, M.C. Activation of leukocytes by postprandial lipemia in healthy volunteers. Atherosclerosis 2004, 177, 175–182. [Google Scholar] [CrossRef] [PubMed]
- Cho, C.E.; Taesuwan, S.; Malysheva, O.V.; Bender, E.; Tulchinsky, N.F.; Yan, J.; Sutter, J.L.; Caudill, M.A. Trimethylamine-N-oxide (TMAO) response to animal source foods varies among healthy young men and is influenced by their gut microbiota composition: A randomized controlled trial. Mol. Nutr. Food Res. 2017, 61. [Google Scholar] [CrossRef] [PubMed]
- Kris-Etherton, P.M.; Harris, W.S.; Appel, L.J. Fish consumption, fish oil, omega-3 fatty acids, and cardiovascular disease. Circulation 2002, 106, 2747–2757. [Google Scholar] [CrossRef] [PubMed]
- Kromhout, D.; Bosschieter, E.B.; Coulander, C.D.L. The Inverse Relation between Fish Consumption and 20-Year Mortality from Coronary Heart Disease. N. Engl. J. Med. 1985, 312, 1205–1209. [Google Scholar] [CrossRef] [PubMed]
- Jensen, I.-J.; Walquist, M.; Liaset, B.; Elvevoll, E.O.; Eilertsen, K.-E. Dietary intake of cod and scallop reduces atherosclerotic burden in female apolipoprotein E-deficient mice fed a Western-type high fat diet for 13 weeks. Nutr. Metab. 2016, 13, 8. [Google Scholar] [CrossRef] [PubMed]
- Tørris, C.; Molin, M.; Cvancarova, M.S. Lean fish consumption is associated with lower risk of metabolic syndrome: A Norwegian cross sectional study. BMC Public Health 2016, 16, 347. [Google Scholar] [CrossRef] [PubMed]
- Alhassan, A.; Young, J.; Lean, M.E.J.; Lara, J. Consumption of fish and vascular risk factors: A systematic review and meta-analysis of intervention studies. Atherosclerosis 2017, 266, 87–94. [Google Scholar] [CrossRef] [PubMed]
- Kruger, R.; Merz, B.; Rist, M.J.; Ferrario, P.G.; Bub, A.; Kulling, S.E.; Watzl, B. Associations of current diet with plasma and urine TMAO in the KarMeN study: Direct and indirect contributions. Mol. Nutr. Food Res. 2017. [Google Scholar] [CrossRef] [PubMed]
- Ramel, A.; Jonsdottir, M.T.; Thorsdottir, I. Consumption of cod and weight loss in young overweight and obese adults on an energy reduced diet for 8-week. Nutr. Metab. Cardiovasc. Dis. 2009, 19, 690–696. [Google Scholar] [CrossRef] [PubMed]
- Shukla, A.; Bettzieche, A.; Hirche, F.; Brandsch, C.; Stangl, G.I.; Eder, K. Dietary fish protein alters blood lipid concentrations and hepatic genes involved in cholesterol homeostasis in the rat model. Br. J. Nutr. 2006, 96, 674–682. [Google Scholar] [PubMed]
- Dyerberg, J.; Madsen, P.; Møller, J.M.; Aardestrup, I.; Schmidt, E.B. Bioavailability of marine n-3 fatty acid formulations. Prostaglandins Leukot. Essent. Fat. Acids 2010, 83, 137–141. [Google Scholar] [CrossRef] [PubMed]
- Lie, O.; Lambertsen, G. Fatty acid composition of glycerophospholipids in seven tissues of cod (Gadus morhua), determined by combined high-performance liquid chromatography and gas chromatography. J. Chromatogr. 1991, 565, 119–129. [Google Scholar] [CrossRef]
- Addison, R.F.; Ackman, R.G.; Hingley, J. Distribution of Fatty Acids in Cod Flesh Lipids. J. Fish. Res. Board Can. 1968, 25, 2083–2090. [Google Scholar] [CrossRef]
- Mathews, S.A.; Oliver, W.T.; Phillips, O.T.; Odle, J.; Diersen-Schade, D.A.; Harrell, R.J. Comparison of triglycerides and phospholipids as supplemental sources of dietary long-chain polyunsaturated fatty acids in piglets. J. Nutr. 2002, 132, 3081–3089. [Google Scholar] [CrossRef] [PubMed]


© 2018 by the authors. Licensee MDPI, Basel, Switzerland. This article is an open access article distributed under the terms and conditions of the Creative Commons Attribution (CC BY) license (http://creativecommons.org/licenses/by/4.0/).
Share and Cite
Schmedes, M.; Balderas, C.; Aadland, E.K.; Jacques, H.; Lavigne, C.; Graff, I.E.; Eng, Ø.; Holthe, A.; Mellgren, G.; Young, J.F.; et al. The Effect of Lean-Seafood and Non-Seafood Diets on Fasting and Postprandial Serum Metabolites and Lipid Species: Results from a Randomized Crossover Intervention Study in Healthy Adults. Nutrients 2018, 10, 598. https://doi.org/10.3390/nu10050598
Schmedes M, Balderas C, Aadland EK, Jacques H, Lavigne C, Graff IE, Eng Ø, Holthe A, Mellgren G, Young JF, et al. The Effect of Lean-Seafood and Non-Seafood Diets on Fasting and Postprandial Serum Metabolites and Lipid Species: Results from a Randomized Crossover Intervention Study in Healthy Adults. Nutrients. 2018; 10(5):598. https://doi.org/10.3390/nu10050598
Chicago/Turabian StyleSchmedes, Mette, Claudia Balderas, Eli Kristin Aadland, Hélène Jacques, Charles Lavigne, Ingvild Eide Graff, Øyvin Eng, Asle Holthe, Gunnar Mellgren, Jette Feveile Young, and et al. 2018. "The Effect of Lean-Seafood and Non-Seafood Diets on Fasting and Postprandial Serum Metabolites and Lipid Species: Results from a Randomized Crossover Intervention Study in Healthy Adults" Nutrients 10, no. 5: 598. https://doi.org/10.3390/nu10050598