Article

Consumption of Sugar-Sweetened Beverages Is Associated with Components of the Metabolic Syndrome in Adolescents

1
Graduate Institute of Medicine, College of Medicine and Department of Obstetrics and Gynecology, Kaohsiung Medical University Hospital, Kaohsiung Medical University, 100 Shih-Chuan 1st Road, Kaohsiung 807, Taiwan
2
Institute of Environmental and Occupational Health Sciences, National Yang Ming University, 155, Section 2, Li-Nong Street, Taipei 112, Taiwan
3
Department of Oral Hygiene, College of Dental Medicine, Kaohsiung Medical University, 100 Shih-Chuan 1st Road, Kaohsiung 807, Taiwan
4
Department of Public Health, College of Health Sciences, Kaohsiung Medical University, 100 Shih-Chuan 1st Road, Kaohsiung 807, Taiwan
5
Department of Family Medicine, Kaohsiung Medical University Hospital, Kaohsiung Medical University, 100 Shih-Chuan 1st Road, Kaohsiung 807, Taiwan
6
Health Policy and Systems Management Program, Health Sciences Center, School of Public Health, Louisiana State University, 433 Bolivar St, New Orleans, LA 70112, USA
7
Department of Laboratory Medicine, Kaohsiung Municipal Hsiao-Kang Hospital, 482 Shanming Road, Kaohsiung 812, Taiwan
8
Department of Surgery, College of Medicine, Kaohsiung Medical University Hospital, Kaohsiung Medical University, 100 Shih-Chuan 1st Road, Kaohsiung 807, Taiwan
*
Authors to whom correspondence should be addressed.
Nutrients 2014, 6(5), 2088-2103; https://doi.org/10.3390/nu6052088
Submission received: 6 March 2014 / Revised: 9 May 2014 / Accepted: 13 May 2014 / Published: 23 May 2014
(This article belongs to the Special Issue Sugar and Obesity)

Abstract

:
Sugar-sweetened beverages (SSBs) are the principle source of added sugar in diets. Cardiometabolic disturbances can occur from early childhood to adulthood. The aim of this cross-sectional study was to examine the gender-specific association of SSB intake with metabolic syndrome (MetS) and its components among adolescents in Taiwan. A total of 2727 adolescents aged 12 to 16 years randomly selected from three diverse economic areas in Southern Taiwan by using a multistage-sampling strategy participated in this study. Demographic, dietary, physical and anthropometric parameters were measured, and serum lipid profiles and glucose levels were determined. The International Diabetes Federation (IDF) specifies that MetS requires abdominal obesity and ≥2 abnormal components, and Cook criteria for MetS require ≥3 abnormal components. We applied survey-data modules to data analyses, and used multiple regression and logistic models to adjust for covariates. An increased SSB intake was linked to a greater waist circumference in both sexes and to systolic blood pressure in boys (P for trend: ≤0.043). Male moderate and high consuming SSB drinkers exhibited triglyceride levels that were 8.0 and 8.2 mg/dL significantly higher, respectively, than those of nondrinkers. Compared with nondrinkers, boys who consumed >500 mL/day (high quantity) of SSBs exhibited 10.3-fold (95% confidence intervals (CIs): 1.2-90.2) and 5.1-fold (95% CIs: 1.01-25.5) risks of contracting MetS, as defined by the IDF and Cook criteria for MetS, respectively. In girls, the risk estimates for the same comparison were not significant by the IDF criteria (6.5-fold risk, 95% CIs: 0.9-∞) or Cook criteria (5.9-fold risk, 95% CIs: 0.8-43.8) for MetS. High SSB consumption was also linked to 1.9-fold (95% CIs: 1.1-3.1) and 2.7-fold (95% CIs: 1.3-5.7) higher risks of being at a greater overall metabolic risk in girls and boys, respectively. In conclusion, a high SSB intake is associated with adolescent MetS among boys but not girls in Taiwan.

1. Introduction

Epidemiological evidence has indicated that cardiometabolic disturbances can occur from early childhood to adulthood [1,2,3]. Metabolic syndrome (MetS) is a clustering of three or more cardiometabolic risk factors, including abdominal obesity, elevated blood pressure, elevated fasting plasma glucose (FPG), high serum triglycerides (TG) and low high-density lipoprotein cholesterol (HDL-C) levels [4]. In adults, this metabolic disorder has been determined to induce an approximately 2-fold risk for cardiovascular death, a 3-fold risk for cardiovascular complications and a 5-fold risk for type 2 diabetes [5,6,7,8]. In children, obesity has been associated with the development of MetS [9,10], and in prospective studies, pediatric MetS has been identified as a crucial predictor for adult MetS, type 2 diabetes and cardiovascular disease [11,12]. Adolescents are one of the major groups who consume a high amount of sugar-sweetened beverages (SSBs) [13]; however, limited data are available regarding the effects of SSB consumption among adolescents on pediatric MetS.
SSBs, a liquid form of carbonated or noncarbonated energy, are the principle source of added sugar in diets [14]. In adults, the intake of SSBs has been associated with an enhanced risk of weight gain and of developing obesity and obesity-related disorders, such as MetS, type 2 diabetes, coronary heart disease and stroke [15,16,17]. Recent investigations have indicated that, compared with isoenergetic solid carbohydrates, liquid carbohydrates, especially SSBs, generate less satiety and overall energy intake is increased because of incomplete dietary compensation [18,19,20].
The prevalence of obesity among adolescents in Taiwan has increased by 27.7% in girls and 25.8% in boys in recent decades [21], and has become a critical concern in pediatric health nationwide. One study conducted in Taiwan reported that the consumption of SSBs was associated with a 3.2- to 4.9-fold risk of obesity [2]. The purpose of this study was to investigate the gender-specific association of SSB consumption with MetS and its components among adolescents in the same large-scale cross-sectional survey in Taiwan [2].

2. Materials and Methods

2.1. Participants and Study Design

This study was conducted in three areas characterized by various economic backgrounds and urbanization levels in Southern Taiwan—Kaohsiung City (urban region), Pingtung County (suburban region) and Taitung County (rural region)—and involved monitoring the Multilevel Risk Profiles for Adolescent Metabolic Syndrome (mRP-aMS). Adolescents aged 12 to 16 years who were included in the entry lists of junior high schools in these areas were the target population. The mRP-aMS protocol was approved by the ethics committee of Kaohsiung Medical University, and all data collection was conducted in accordance with the guidelines for ethical conduct in human research. Informed written consent was obtained from the adolescents and their parents or guardians.
The mRP-aMS, performed between 2007 and 2009, was a cross-sectional survey of a representative sample of adolescents in Grades 7-9 in Southern Taiwan. The study consisted of a school visit at which questionnaire surveys were administered, anthropometric measurements were obtained and blood samples were subsequently collected. The details of the research method were reported elsewhere [2]. Briefly, a multistage, geographically stratified cluster sampling design was used to recruit study participants. A total of 3784 students randomly selected from 36 schools agreed to participate in the questionnaire and anthropometric surveys (97.5% response rate). Among these students, 2727 adolescents (72.1%) participated in the clinical blood examinations.

2.2. Data Collection

A structured questionnaire was used to collect research data. Information obtained included demographic factors, personal disease history, lifestyle behaviors, dietary intake and physical activity, as well as cigarette smoking and alcohol consumption status. We used a semiquantitative food-frequency questionnaire containing 23 food groups to assess daily dietary patterns exhibited during the previous month. The intake of various SSBs, including soft drinks, fruit drinks and sweetened teas, was obtained from the responses provided in the completed food-frequency questionnaire. SSB drinkers were defined as adolescents who had consumed at least one serving of any type of SSB per week over the prior month. We calculated the total SSB consumption per day for each participant, and for data analysis, classified SSB consumption as non-intake, 1-500 mL and intake >500 mL according to the standard serving size in Taiwan. The Taiwanese Food and Nutrients Databank was employed to estimate the total calories consumed based on individual food consumption data [22]. Furthermore, weekday and weekend patterns of physical activity, including physical education classes in schools, after-school physical activity, extracurricular activities or training, physical activities in the evenings, spare time and weekend activities and static activities for each participant in a regular week were measured using nine group questions. We transformed the activity data into metabolic equivalent task (MET) measurements and calculated the overall MET-minutes per week [2]. The adolescents were categorized into three groups according to the tertiles of total physical activity.

2.3. Anthropometric and Clinical Measurements

Qualified examiners performed anthropometric measurements using a standardized process after collecting the questionnaire data. Anthropometric indicators comprised height, weight, hip circumference (HC) and waist circumference (WC), body fat, systolic blood pressure (SBP) and diastolic blood pressure (DBP). Body fat percentage was determined using a body impedance system (BF-800, Tanita Corp, Tokyo, Japan), and body adiposity index (BAI, %), another indicator for human body fat, was calculated as [(hip in cm)/(height in m)1.5] - 18 [23]. The formula (weight in kg)/(height in m)2 was used to compute body mass index (BMI) [24].
We collected blood samples from the participants after 3 weeks of data collection. Clinical specimens were obtained in the morning by conducting venipuncture after the participants underwent a 10-h overnight fast at the health center of each school. The lipid profiles, including HDL-C, low-density lipoprotein cholesterol (LDL-C), TGs and total cholesterol levels, as well as FPG levels, were enzymatically quantified by employing a chemistry autoanalyzer using commercially available reagents (TBA-c16000 automatic analyzer, Toshiba, Tokyo, Japan) [25].

2.4. Definitions of Metabolic Syndrome

Because metabolic and anthropometric parameters change with age and pubertal growth, applying the adult MetS definition to adolescents is problematic [7]. In this study, we measured adolescent MetS by using the International Diabetes Federation (IDF) consensus criteria [7] and the Cook et al. criteria for MetS, which involves considering age, sex and height for several MetS components [26]. In the IDF criteria, a diagnosis of pediatric MetS requires abdominal obesity (WC ≥ 90th percentile or adult cutoff if lower) and the presence of two or more of the following clinical features: low HDL-C (<40 mg/dL), elevated TGs (≥150 mg/dL), increased FPG (≥100 mg/dL or known type 2 diabetes) and high blood pressure (SBP ≥ 130 mmHg or DBP ≥ 85 mmHg). According to Cook et al. criteria for MetS [26], a diagnosis of adolescent MetS requires at least three of the following risk components: abdominal obesity (WC ≥ 90th age- and sex-specific percentile), low HDL-C (≤40 mg/dL), elevated TGs (≥110 mg/dL), increased FPG (≥110 mg/dL) and high blood pressure (blood pressure ≥90th age-, sex- and height-specific percentile).

2.5. Statistical Analysis

The data were first arranged based on computed complex sampling weights. Stata v13 survey-data statistical modules (StataCorp., College Station, TX, USA) were applied to accommodate the complex sampling design. We used multivariate linear regression models to assess the association between SSB intake and cardiometabolic risk factors. Multivariate-adjusted mean and regression coefficients were employed to determine the effect of diverse levels of SSB intake on continuous outcomes. A fundamental regression model including age, sex and study area was used to assess potential confounders. Factors that altered the effect of interest by >10% or that had been determined as confounders in prior studies were considered confounding factors [27,28]. Covariates, including study area, age, physical activity, total calories, the intake of meat, fruit, fried food, food with jelly/honey, alcohol consumption and cigarette smoking, were evaluated as confounders.
Because the IDF diagnostic definition for pediatric MetS is an interim set of criteria, a range of cutoff values principally based on the Adult Treatment Panel III adult criteria for classifying MetS components have been used in previous studies [7]. To assist in the evaluation of IDF and Cook et al. criteria for MetS [7,26], a two-step cluster analysis was conducted to identify adolescents at low, median and high metabolic risk; this analysis method has been applied in previous studies [3,29]. This statistical method was used to determine the nature clusters of subjects, in which the subjects in the same cluster are more similar to each other than they are to subjects in other clusters. Because MetS is a cluster of risk factors that occur jointly, cluster analysis is an appropriate technique for identifying high-risk clusters [29]. In the first cluster step, we employed an agglomerative hierarchical clustering procedure, in which each observation was first considered as a separate group, the closest two groups were then combined, and this process was continued until all observations merged with progress up the hierarchy. The k-means partition cluster method was employed as the second cluster step. Subclusters and seed values generated from the first cluster step were used as inputs, and an iterative process, in which each observation was assigned to subclusters whose mean was closest, was performed. These steps continued until no changes were observed in subclusters. Standardized components of MetS, including WC, HDL-C, TG, FPG, SBP and DBP levels, were used to identify low, median and high overall metabolic risk clusters for girls and boys, respectively. Furthermore, to evaluate the effect of SSB intake on binary outcomes for the MetS components and trinary outcomes for the BMI and metabolic risk clusters, we employed the adjusted odds ratio (aOR) and 95% confidence intervals (CIs), which were respectively derived from binary and polytomous logistic regression models, to estimate the associated risks [30].

3. Results

Table 1 shows the distribution of demographic factors, physical activity and energy intake associated with the intake of SSBs among adolescents. After adjusting for the complex sampling design, we determined that a higher proportion of boys than girls consumed a high amount of SSBs (>500 mL; 32.1% vs. 18.5%). Adolescents who ingested a high amount of SSBs typically exhibited an increased total calorie intake (Ptrend < 0.001 for both sexes). Among the girls, discrepancies in the SSB intake pattern were noted across various economic areas.
Table 2 shows the multivariate-adjusted means and regression coefficients of the cardiometabolic risk factors associated with SSB intake. An increased consumption of SSBs was linked to a greater WC, with a significantly increased WC observed in girls who exhibited a >500 mL/day intake and in boys who exhibited SSB intake. Compared with nondrinkers, male median (1-500 mL/day) and high (>500 mL/day) SSB drinkers had an 8.0 and 8.2 mg/dL greater concentration of TGs (78.4 and 78.6 vs. 70.4 mg/dL), respectively. A higher level of SSB consumption was related to a higher level of SBP in boys (adjusted β = 0.6 mmHg, Ptrend = 0.043). In both girls and boys, a notable dose-dependent effect of SSB intake on HC, body fat, BAI and BMI was observed.
Table 3 shows the prevalence rate and risks of developing MetS and its components among adolescents according to the IDF and Cook et al. criteria for MetS. The prevalence rate of IDF MetS was 1.1% and 2.1% for girls with a median and high amount of SSB consumption, and 3.5% and 5.4% for boys, respectively, with a large WC being the major contributor of MetS (prevalence rates were 13.4% and 22.7% for median and high intake in girls, and 12.1% and 18.7% in boys, respectively). Compared with nondrinkers, boys who consumed >500 mL of SSBs per day exhibited a 10.3-fold risk (95% CIs: 1.2-90.2) of developing IDF MetS, and girls had a non-significant 6.5-fold risk (95% CIs: 0.9-∞) of developing MetS. Alternatively, the prevalence rate of MetS according to Cook criteria was 1.9% and 3.4% for median and high SSB intake in girls, and 4.1% and 5.1% in boys, respectively, with raised blood pressure being the main contributor of MetS (prevalence rates were 16.2% and 23.0% for median and high intake in girls, and 17.3% and 22.0% in boys, respectively). Compared with nondrinkers, boys who consumed >500 mL/day of SSBs exhibited a 5.1-fold (95% CIs: 1.01-25.5) risk of being diagnosed with Cook criteria for MetS, and girls who ingested >500 mL of SSBs per day had a non-significant 5.9-fold risk (95% CIs: 0.8-43.8) of developing MetS.
As shown in Figure 1, boys at a high metabolic risk exhibited greater WC and TG, FPG, SBP and DBP levels than did those at a low metabolic risk. Similarly, a higher level of these four MetS components and a lower concentration of HDL-C were observed in girls at a high metabolic risk compared with those at a low metabolic risk. These results indicated that the data-driven risk clusters were suitable for determining the risk of developing adolescent MetS.
Table 4 shows the effect of SSB intake on metabolic risk clusters among adolescents. Increased SSB consumption was determined to be associated with a high metabolic risk cluster in both sexes (Ptrend < 0.038). Adolescents who drank >500 mL of SSBs per day exhibited a 1.9-fold (95% CIs: 1.1-3.1) and a 2.7-fold (95% CIs: 1.3-5.7) risk of being classified as having a high overall metabolic risk in girls and boys, respectively.
Table 1. Distributions of demographic factors, physical activity and energy intake associated with sugar-sweetened beverage consumption (mL/day) among adolescents in Taiwan.
FactorsGirls Boys
Nonintake1–500>500p 3Nonintake1-500>500p 3
Study subjects (no.) 1196961242 120802406
Population distribution 2
Consumer pattern (%)15.665.918.5 8.859.132.1
Age, years (Mean ± SE)13.6 ± 0.113.5 ± 0.113.7 ± 0.10.57413.6 ± 0.113.5 ± 0.113.7 ± 0.10.058
Area (%)
Kaohsiung city19.463.217.40.0339.357.832.90.746
Pingtung county10.668.321.2 7.760.631.7
Taitung county11.074.214.8 9.262.828.0
Physical activity, MET-min/week (%)
<952.416.163.120.80.3249.454.835.80.106
952.5–2140.416.768.015.3 11.555.832.7
≥2140.512.065.922.1 6.063.930.1
Total calories, kcal/day (Mean ± SE)1835.3 ± 61.31903.4 ± 29.92044.8 ± 45.3<0.0012083.7 ± 60.82151.5 ± 39.92448.2 ± 67.2<0.001
1 Raw number of study samples (the number that is not adjusted for sample survey design); 2 Data was presented adjusted for sample weight and complex sample design; 3p for associations between sugar-sweetened beverage consumption and the factors investigated.
Table 2. Multivariate-adjusted means (aMean) 1,2 and regression coefficients (adj. β) 1,3 of cardiometabolic risk factors associated with sugar-sweetened beverage consumption (mL/day) among adolescents in Taiwan.
FactorsGirls Boys
Nonintake1–500>500 Nonintake1–500>500
aMeanSEaMeanSEaMeanSEadj. βSEptrendaMeanSEaMeanSEaMeanSEadj. βSEptrend
Waist circumference, cm68.00.969.40.771.1 *0.81.50.60.01172.60.975.0 *0.676.3 *0.91.60.70.039
HDL cholesterol, mg/dL58.81.359.01.257.61.6−0.60.90.52856.01.356.30.754.91.6−0.91.00.401
Triglyceride, mg/dL74.42.376.01.979.33.22.51.70.16070.43.278.4 *1.678.6 *2.82.62.40.278
Plasma glucose, mg/dL89.10.989.60.790.60.90.70.50.11992.11.093.10.691.41.0−0.90.60.167
SBP, mmHg106.21.3106.50.6107.71.20.80.60.174111.91.3112.20.9114.30.61.60.70.043
DBP, mmHg65.20.864.50.365.30.70.10.50.89065.51.165.30.665.10.6−0.20.60.753
Total cholesterol, mg/dL161.13.9164.22.4166.13.72.52.20.274154.22.4158.11.5156.54.40.12.80.984
Hip circumference, cm89.80.690.10.492.3 *0.71.30.40.00790.20.891.70.593.8 *0.72.00.60.002
Body fat, %26.10.526.70.328.5 *0.51.20.40.00517.71.019.8 *0.520.8 *0.61.30.60.030
Body adiposity index, %27.60.327.90.229.1 *0.30.80.20.00124.90.426.2 *0.226.7 *0.30.80.30.005
Body mass index, kg/m220.30.320.70.221.5 *0.30.60.20.00721.00.422.0 *0.222.7 *0.30.80.30.009
Abbreviations: * p < 0.05; HDL, high-density lipoprotein; SBP, systolic blood pressure; DBP, diastolic blood pressure; adj., adjusted. 1 Models were adjusted for study area, age, physical activity, total calories, the intake of meat, fruit, fried food, food with jelly/honey, alcohol drinking and cigarette smoking; 2 Adjusted mean displays the estimated prediction when the covariates were set as mean values; 3 Adjused regression coefficients were estimated for a linear dose-response effect of sugar-sweetened beverage consumption.
Table 3. Prevalence rates and adjusted odds ratios (aOR) 1 of metabolic syndrome (MetS) defined by IDF and Cook criteria associated with sugar-sweetened beverage consumption (mL/day) among adolescents in Taiwan.
FactorsGirlsBoys
Prevalence, %1–500 vs. NI>500 vs. NI Prevalence, %1–500 vs. NI>500 vs. NI
NI1–500>500aOR(95% CI)aOR(95% CI)ptrendNI1–500>500aOR(95% CI)aOR(95% CI)ptrend
IDF criteria
Large WC8.213.422.72.0(0.99–3.9)4.1(1.9–8.8)<0.0017.412.118.72.0(0.8–5.1)3.0(1.2–7.6)0.011
Low HDL-C5.29.111.21.8(0.8–4.4)2.1(0.7–6.7)0.1944.39.513.52.4(0.7–8.1)3.9(0.9–16.4)0.067
Elevated TG2.34.04.61.9(0.8–4.4)2.1(0.7–6.8)0.1973.95.57.11.3(0.5–3.7)1.7(0.6–5.1)0.289
Increased FPG9.010.811.81.3(0.6–2.5)1.5(0.9–2.4)0.20317.219.417.31.2(0.6–2.4)1.1(0.6–2.2)0.908
High BP3.64.34.91.2(0.3–4.3)1.5(0.5–5.2)0.42312.910.815.50.8(0.3–2.3)1.2(0.5–3.1)0.244
Component (c) no.
1c21.829.627.7 23.226.627.8
2c3.34.310.6 10.49.113.1
3c0.01.12.1 0.62.25.5
MetS (WC + ≥2c)0.01.12.13.8 2(0.6–∞)6.5 2(0.9–∞)0.049 20.63.55.46.9(0.7–63.2)10.3(1.2–90.2)0.007
Cook criteria
Large WC6.110.710.52.1(1.0–4.4)2.3(1.1–4.8)0.0145.99.714.72.1(0.9–5.0)3.1(1.4–6.9)0.008
Low HDL-C5.29.111.31.8(0.8–4.4)2.2(0.7–6.7)0.1844.99.513.52.1(0.7–6.7)3.4(0.8–14.0)0.083
Elevated TG9.212.915.01.6(0.9–2.9)1.9(0.96–3.7)0.0659.716.318.91.9(0.9–4.0)2.3(1.1–5.0)0.045
High FPG1.41.91.81.9(0.7–4.9)1.6(0.2–10.8)0.6900.01.91.53.6 2(0.6–-∞)2.0 2(0.3–∞)1.000 2
Raised BP12.516.223.01.3(0.8–2.1)2.1(1.3–3.7)0.01518.017.322.00.9(0.4–1.9)1.2(0.6–2.6)0.266
Component (c) no.
1c22.529.121.1 26.624.831.5
2c5.18.014.7 4.48.311.6
3c0.61.72.5 1.03.14.5
MetS (≥3c)0.61.93.43.2(0.6–17.8)5.9(0.8–43.8)0.0851.04.15.14.9(1.1–21.1)5.1(1.01–25.5)0.251
Abbreviations: NI, nonintake; IDF, International Diabetes Federation; WC, waist circumference; HDL-C, high-density lipoprotein cholesterol; TG, triglyceride; FPG, fasting plasma glucose; BP, blood pressure; 1 ORs were adjusted for study area, age, physical activity, total calories, the intake of meat, fruit, fried food, food with jelly/honey, alcohol drinking and cigarette smoking; 2 ORs were calculated using the median unbiased estimates with the aid of exact logistic regression.
Table 4. Prevalence rates and adjusted odds ratios (aOR) 1 of high metabolic risk cluster associated with sugar-sweetened beverage consumption (mL/day) among adolescents in Taiwan.
FactorsGirlsBoys
Prevalence, %1–500 vs. NI>500 vs. NI Prevalence, %1–500 vs. NI>500 vs. NI
NI1–500>500aOR(95% CI)aOR(95% CI)ptrendNI1–500>500aOR(95% CI)aOR(95% CI)ptrend
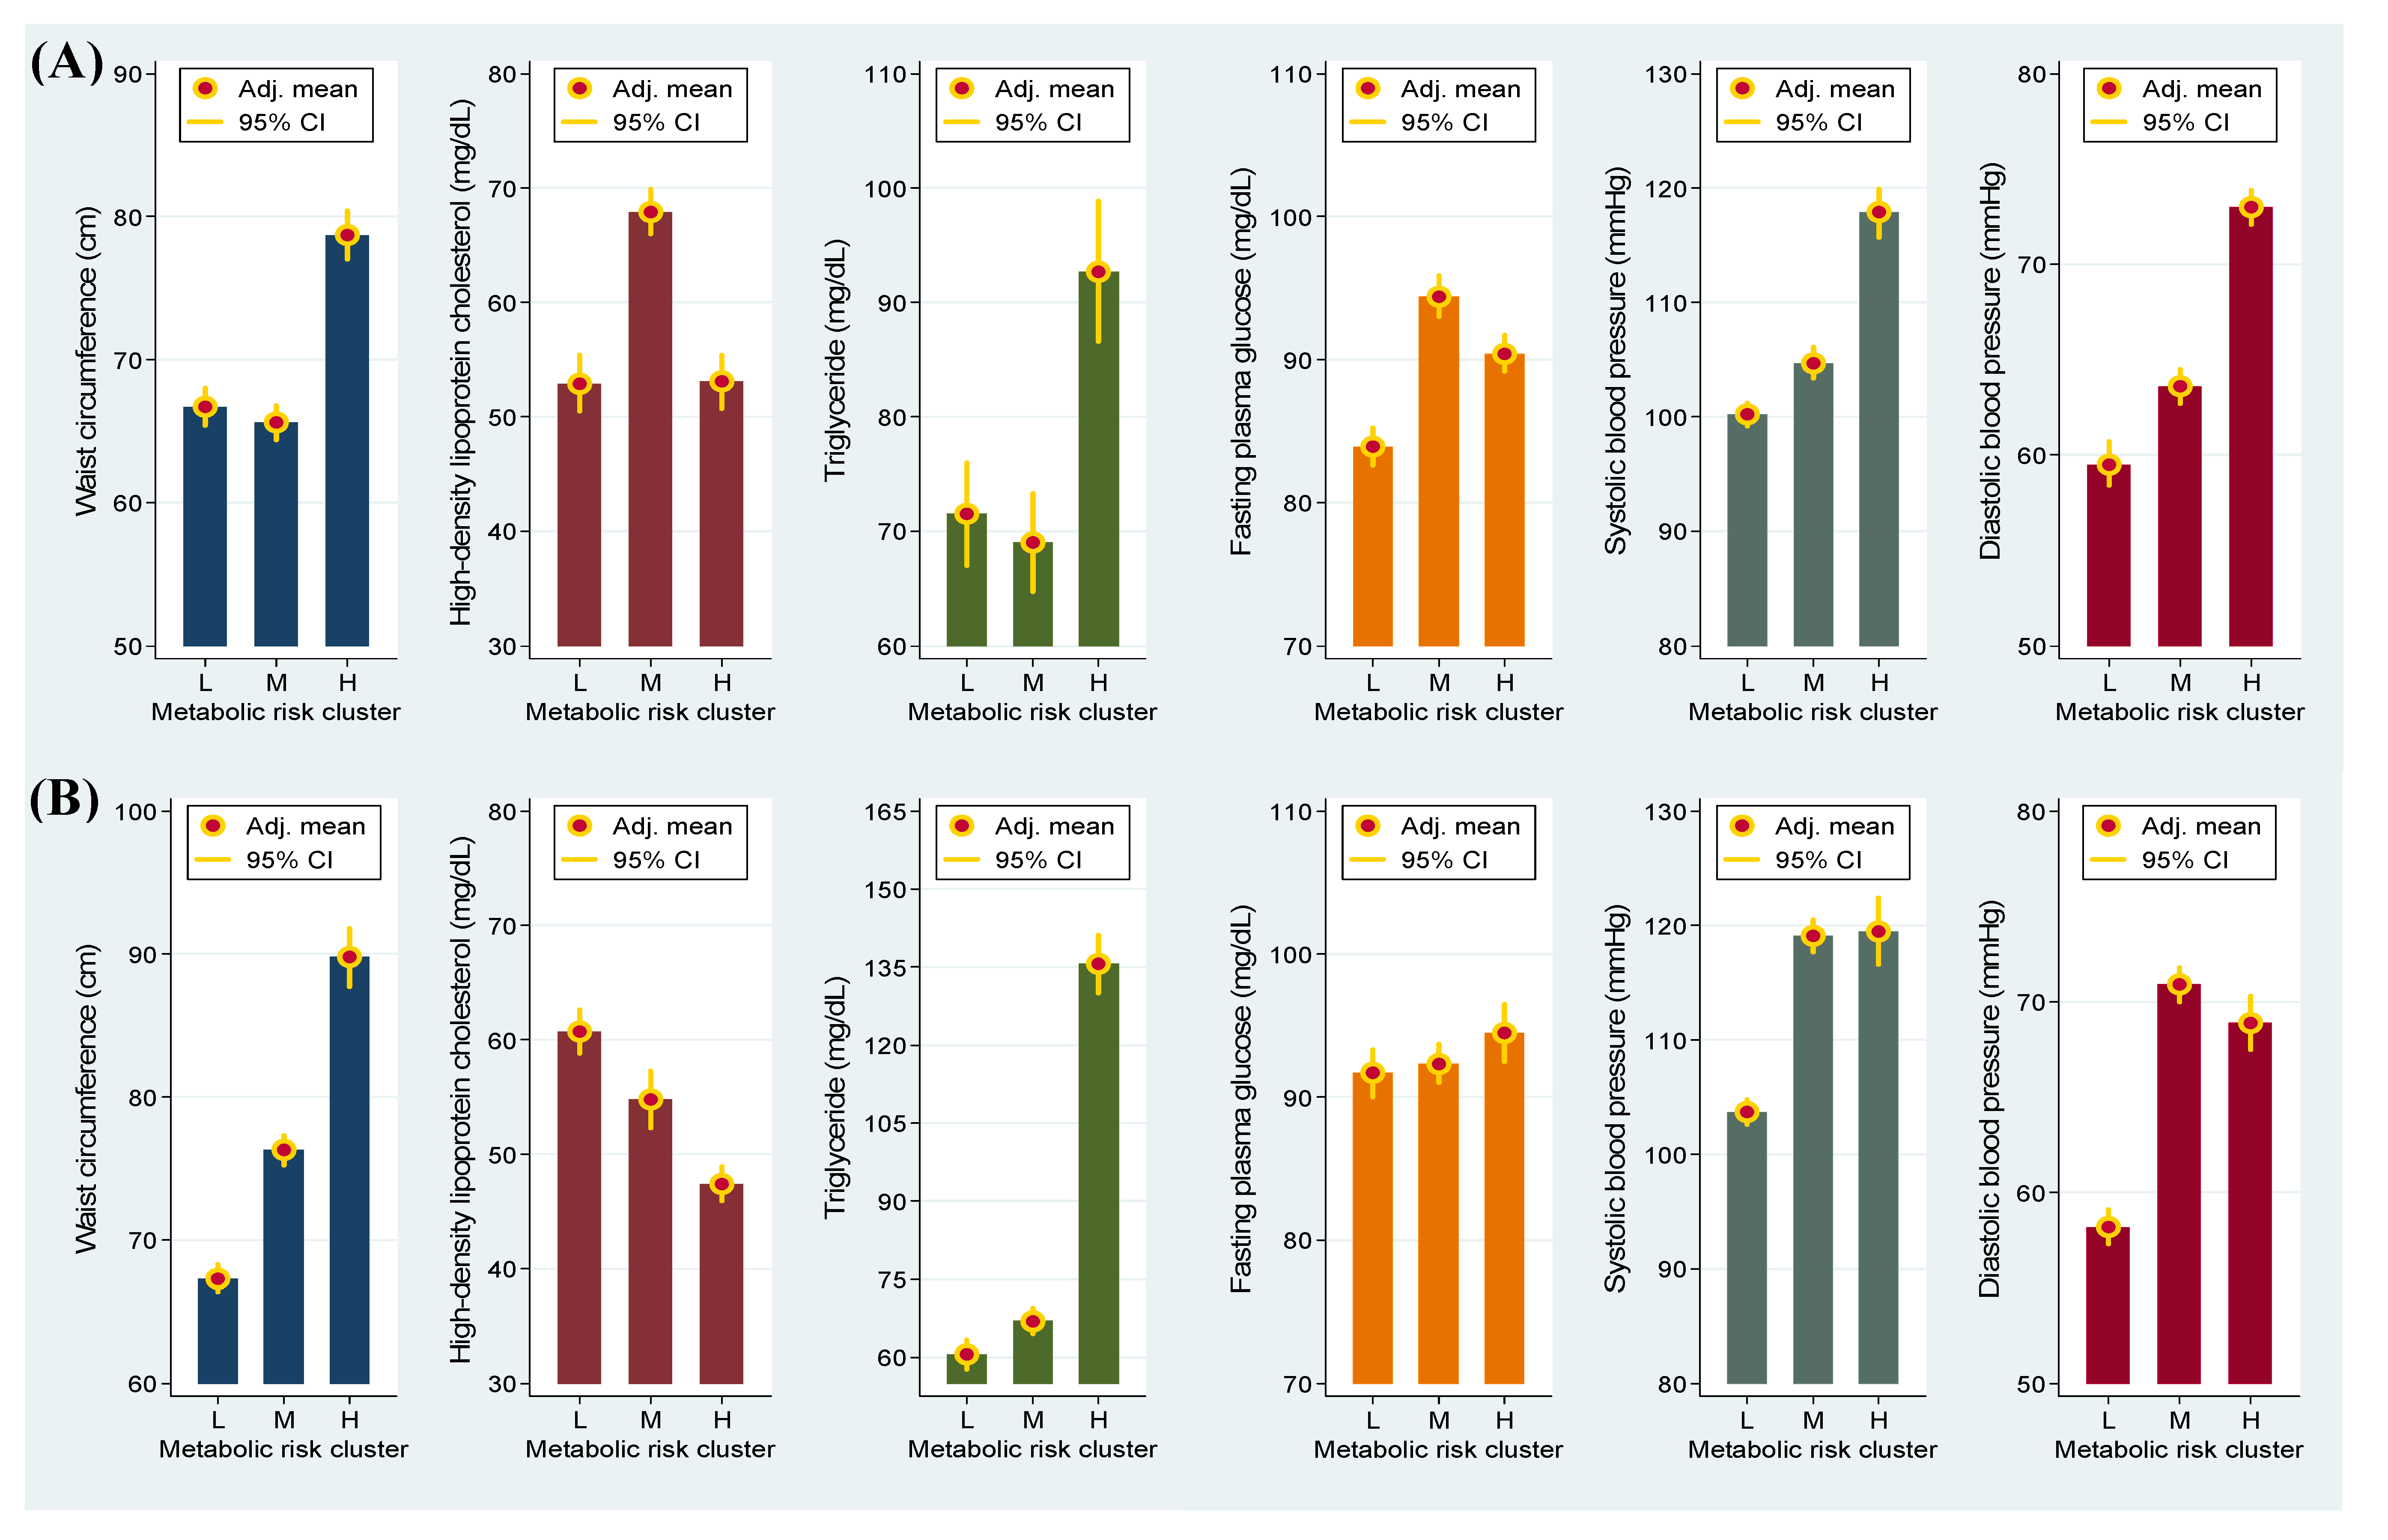
Metabolic risk cluster 2
Low35.234.733.51.0 1.0 42.843.637.11.0 1.0
Median42.038.534.51.2(0.8–1.8)1.2(0.7–2.2)0.43347.436.640.90.8(0.5–1.3)1.0(0.6–1.6)0.530
High22.826.932.11.4(0.9–2.3)1.9(1.1–3.1)0.0209.819.822.12.2(1.0–4.8)2.7(1.3–5.7)0.038
Abbreviations: NI, nonintake; 1 ORs were adjusted for study area, age, physical activity, total calories, the intake of meat, fruit, fried food, food with jelly/honey, alcohol drinking and cigarette smoking; risk cluster groups were derived from a two-step cluster analysis.
Figure 1. Adjusted (adj.) mean and 95% confidence intervals (CI) of metabolic syndrome components associated with low (L), median (M) and high (H) metabolic risk clusters in girls (A) and in boys (B).
Nutrients 06 02088 g001

4. Discussion

This study presents data indicating that increased SSB intake is associated with an increased WC, HC, total cholesterol, body fat, BAI and BMI among schoolchildren. In boys, the consumption of a high amount of SSBs exhibited a significant effect on development of MetS; adolescents who ingested >500 mL of SSBs per day were likely to exhibit a high overall metabolic risk.
Several mechanisms explaining the link between SSB consumption and weight gain have been suggested [18,19,20]. Although satiety responses vary according to race, sex and body weight, liquid carbohydrates generally provide a lower level of satiety than do solid carbohydrates [18,19]. Energy obtained from liquid sources that provide low levels of satiety has been observed to result in poor compensation by subsequent energy intake, thereby inducing an increase in total energy intake [19,20]. In addition, adult diets containing SSBs have been linked to an increase in self-selected daily energy intake [20]. Recently, a systematic review and meta-analysis reported that the intake of SSBs is clearly associated with increased energy intake and body weight [31]. The results obtained in this investigation support this argument.
The association between SSB intake and adiposity has been extensively assessed in observational studies, experimental trials and meta-analyses [20,32,33]. The majority of well-designed observational studies have reported that the consumption of several types of SSB has detrimental effects on adiposity and obesity [20,33]. Numerous findings of studies that were designed to reduce and increase SSB consumption have supported a causal relationship between SSB intake and weight gain [32,33]. Taking all concerns regarding risk evaluation into account, a meta-analysis study identified a significant 0.08-unit change in BMI associated with each 355 mL of SSB intake [32]. In this study, we observed that the BMI values increased as SSB consumption increased in both girls and boys. The phenotypes of weight gain were observed in WC, HC and body fat. Among these, a large WC was the criterion required for an IDF MetS diagnosis [7]. Compared with nondrinkers, the results indicated that boys and girls who drank a high amount of SSBs exhibited 4.6% and 5.1% significantly higher WC, respectively (68.0 cm boosted to 71.1 cm in girls and 72.6 cm boosted to 76.3 cm in boys). A recent prospective investigation reported compatible results; specifically, compared to the lowest tertile, a 2.3%-4.2% notably higher WC occurred among teens aged 14-17 years who were in the highest tertile for amount of SSBs consumed [3]. In two U.S. National Health and Nutrition Examination Survey studies conducted in 1999-2004, in which data obtained from young children (3-11 years) and adolescents (12-19 years) were examined, a significant association between SSB consumption and WC was identified among the 9-11- and 12-19-year-old subgroups [34,35]. These findings emphasized that WC is a central MetS component among adolescents.
The present study indicated that boys who ingested 1-500 and >500 mL of SSBs per day exhibited TG levels that were 8.0 and 8.2 mg/dL higher than those of nondrinkers, respectively. Comparable findings have been observed among female teenagers aged 12-19 years (each additional intake of 250 g/day of SSBs was related to a 2.3 mg/dL increase in TG levels) according to a nationwide survey conducted in the United States, although a nonsignificant increase in TG was observed among male teenagers [35]. In an adolescent cohort study conducted in Australia, a BMI-independent link between high quantities of SSB intake and TG concentrations was recognized among both girls and boys, indicating that the effect of high SSB consumption on lipid accumulation may occur through various mechanisms, excluding excess weight [3]. Alternatively, elevated serum TG levels have been associated with a high intake of fructose-rich SSBs in adolescents [36].
Research findings concerning the effects of SSB consumption on adolescent blood pressure have been inconclusive, although an adverse effect on SBP has been suggested [3,35,37]. A large-scale cross-sectional study demonstrated that adolescents aged 12-18 years who had consumed a high amount of SSBs exhibited a 2-mmHg (95% CIs: 1 to 2 mmHg) higher SBP compared with nondrinkers [37]. A 0.16-mmHg elevated SBP associated with consuming one serving of SSB was also observed among nationally representative teenagers aged 12-19 years in the U.S. [35]. In a prospective study of adolescents, a 1.7% higher SBP was observed in girls who exhibited high SSB consumption; however, the effect was not significant in boys [3]. The present findings support the detrimental effect on SBP, because a positive dose-response relationship between SSB intake and SBP was identified among boys. In assessing study findings obtained from five electronic databases, a comprehensive systemic review indicated that SSB consumption is linked to increased BP and an increased incidence of hypertension [38].
Although the IDF criteria and Cook et al. criteria for diagnosing adolescent MetS are slightly different [7,26], this study revealed that the prevalence of MetS increases as the intake of SSBs increases in both girls and boys. Because MetS prevalence is relatively lower in adolescents than in adults, risk assessments of pediatric MetS related to SSB intake that have been conducted in prior studies have focused on MetS components [34,35,37]. The present results indicated that boys who consumed a high amount of SSB exhibited a 5.1- to 10.3-fold risk of developing MetS, even if the prevalence of this metabolic disorder was low. In the two-step cluster analysis, which was used to determine the nature clusters of adolescents with similar levels of metabolic risk, adolescents who drank a high amount of SSBs were determined to have a 1.9- to 2.7-fold risk of being included in a high metabolic risk cluster. Recently, a longitudinal study provided comparable results; specifically, a high SSB intake was dose-dependently linked to a high prospective metabolic risk in girls [3]. Because the development of MetS in childhood is a significantly predictor of adult MetS, type 2 diabetes and cardiovascular disease 25 to 30 years later [11,12], public health advocates must become aware of the problems associated with SSB intake and the likelihood of developing MetS in adolescents.
The major strength of this study is that several crucial confounding variables were adjusted for all of the assessments. A high metabolic risk group derived from the two-step cluster analysis was used to facilitate the risk evaluation of SSB intake in an adolescent population with a low prevalence of MetS. Alternatively, the results of this investigation must be interpreted carefully because SSB consumption, anthropometric parameters and biochemical outcomes were measured only once. We were unable to provide causal explanations because of the cross-sectional nature of the findings.

5. Conclusions

In conclusion, a high SSB intake is associated with adolescent MetS among boys but not girls in Taiwan.

Acknowledgments

This work was supported by the Taiwan National Science Council (NSC), project number: 96-2314-B-037-041-MY3, NSC 99-2314-B-037-057-MY3, NSC99-2314-B-037-046-MY3 and NSC 102-2314-B-037-060, and was partially supported by grants from the Kaohsiung Medical University Research foundation, project number: KMUH99-9R29, KMUH 100-0R26, KMUH101-1R28 and KMHK-102-035.

Author Contributions

Conceived and designed the experiments: Lee CH and Lin CL. Performed the experiments: Chan TF, Huang HL, Lee CY, Wu PW, Chiu YW, Huang CC, Tsai S. Analyzed the data: Lin WT and Lee CH. Wrote the paper: Chan TF and Lee CH.

Abbreviations

aOR
adjusted odds ratio
BAI
body adiposity index
BMI
body mass index
CI
confidence interval
DBP
diastolic blood pressure
FPG
fasting plasma glucose
HC
hip circumference
HDL-C
high-density lipoprotein cholesterol
IDF
International Diabetes Federation
LDL-C
low-density lipoprotein cholesterol
MET
metabolic equivalent task
MetS
metabolic syndrome
SSB
sugar-sweetened beverage
SBP
systolic blood pressure
TG
triglycerides
WC
waist circumference

Conflicts of interest

The authors declare no conflict of interest.

References

  1. Bao, W.; Srinivasan, S.R.; Valdez, R.; Greenlund, K.J.; Wattigney, W.A.; Berenson, G.S. Longitudinal changes in cardiovascular risk from childhood to young adulthood in offspring of parents with coronary artery disease: The Bogalusa Heart Study. JAMA 1997, 278, 1749–1754. [Google Scholar] [CrossRef]
  2. Lin, W.T.; Huang, H.L.; Huang, M.C.; Chan, T.F.; Ciou, S.Y.; Lee, C.Y.; Chiu, Y.W.; Duh, T.H.; Lin, P.L.; Wang, T.N.; et al. Effects on uric acid, body mass index and blood pressure in adolescents of consuming beverages sweetened with high-fructose corn syrup. Int. J. Obes. 2013, 37, 532–539. [Google Scholar] [CrossRef]
  3. Ambrosini, G.L.; Oddy, W.H.; Huang, R.C.; Mori, T.A.; Beilin, L.J.; Jebb, S.A. Prospective associations between sugar-sweetened beverage intakes and cardiometabolic risk factors in adolescents. Am. J. Clin. Nutr. 2013, 98, 327–334. [Google Scholar] [CrossRef]
  4. Alberti, K.G.; Eckel, R.H.; Grundy, S.M.; Zimmet, P.Z.; Cleeman, J.I.; Donato, K.A.; Fruchart, J.C.; James, W.P.; Loria, C.M.; Smith, S.C., Jr. Harmonizing the metabolic syndrome: A joint interim statement of the International Diabetes Federation Task Force on Epidemiology and Prevention; National Heart, Lung, and Blood Institute; American Heart Association; World Heart Federation; International Atherosclerosis Society; and International Association for the Study of Obesity. Circulation 2009, 120, 1640–1645. [Google Scholar] [CrossRef]
  5. Isomaa, B.; Almgren, P.; Tuomi, T.; Forsen, B.; Lahti, K.; Nissen, M.; Taskinen, M.R.; Groop, L. Cardiovascular morbidity and mortality associated with the metabolic syndrome. Diabetes Care 2001, 24, 683–689. [Google Scholar] [CrossRef]
  6. Stern, M.P.; Williams, K.; Gonzalez-Villalpando, C.; Hunt, K.J.; Haffner, S.M. Does the metabolic syndrome improve identification of individuals at risk of type 2 diabetes and/or cardiovascular disease? Diabetes Care 2004, 27, 2676–2681. [Google Scholar]
  7. Zimmet, P.; Alberti, K.G.; Kaufman, F.; Tajima, N.; Silink, M.; Arslanian, S.; Wong, G.; Bennett, P.; Shaw, J.; Caprio, S. The metabolic syndrome in children and adolescents—An IDF consensus report. Pediatr. Diabetes 2007, 8, 299–306. [Google Scholar] [CrossRef]
  8. Eckel, R.H.; Grundy, S.M.; Zimmet, P.Z. The metabolic syndrome. Lancet 2005, 365, 1415–1428. [Google Scholar] [CrossRef]
  9. Goodman, E.; Daniels, S.R.; Morrison, J.A.; Huang, B.; Dolan, L.M. Contrasting prevalence of and demographic disparities in the World Health Organization and National Cholesterol Education Program Adult Treatment Panel III definitions of metabolic syndrome among adolescents. J. Pediatr. 2004, 145, 445–451. [Google Scholar] [CrossRef]
  10. Johnson, W.D.; Kroon, J.J.; Greenway, F.L.; Bouchard, C.; Ryan, D.; Katzmarzyk, P.T. Prevalence of risk factors for metabolic syndrome in adolescents: National Health and Nutrition Examination Survey (NHANES), 2001–2006. Arch. Pediatr. Adolesc. Med. 2009, 163, 371–377. [Google Scholar] [CrossRef]
  11. Morrison, J.A.; Friedman, L.A.; Gray-McGuire, C. Metabolic syndrome in childhood predicts adult cardiovascular disease 25 years later: The Princeton Lipid Research Clinics Follow-up Study. Pediatrics 2007, 120, 340–345. [Google Scholar] [CrossRef]
  12. Morrison, J.A.; Friedman, L.A.; Wang, P.; Glueck, C.J. Metabolic syndrome in childhood predicts adult metabolic syndrome and type 2 diabetes mellitus 25 to 30 years later. J. Pediatr. 2008, 152, 201–206. [Google Scholar] [CrossRef]
  13. Reedy, J.; Krebs-Smith, S.M. Dietary sources of energy, solid fats, and added sugars among children and adolescents in the United State. J. Am. Diet. Assoc. 2010, 110, 1477–1484. [Google Scholar] [CrossRef]
  14. Popkin, B.M.; Armstrong, L.E.; Bray, G.M.; Caballero, B.; Frei, B.; Willett, W.C. A new proposed guidance system for beverage consumption in the United States. Am. J. Clin. Nutr. 2006, 83, 529–542. [Google Scholar]
  15. Malik, V.S.; Popkin, B.M.; Bray, G.A.; Despres, J.P.; Hu, F.B. Sugar-sweetened beverages, obesity, type 2 diabetes mellitus, and cardiovascular disease risk. Circulation 2010, 121, 1356–1364. [Google Scholar] [CrossRef]
  16. Malik, V.S.; Pan, A.; Willett, W.C.; Hu, F.B. Sugar-sweetened beverages and weight gain in children and adults: A systematic review and meta-analysis. Am. J. Clin. Nutr. 2013, 98, 1084–1102. [Google Scholar] [CrossRef]
  17. Richelsen, B. Sugar-sweetened beverages and cardio-metabolic disease risks. Curr. Opin. Clin. Nutr. Metab. Care 2013, 16, 478–484. [Google Scholar] [CrossRef]
  18. Cassady, B.A.; Considine, R.V.; Mattes, R.D. Beverage consumption, appetite, and energy intake: What did you expect? Am. J. Clin. Nutr. 2012, 95, 587–593. [Google Scholar] [CrossRef]
  19. Pan, A.; Hu, F.B. Effects of carbohydrates on satiety: Differences between liquid and solid food. Curr. Opin. Clin. Nutr. Metab. Care 2011, 14, 385–390. [Google Scholar] [CrossRef]
  20. Woodward-Lopez, G.; Kao, J.; Ritchie, L. To what extent have sweetened beverages contributed to the obesity epidemic? Public Health Nutr. 2011, 14, 499–509. [Google Scholar] [CrossRef]
  21. Chu, N.F. Prevalence of obesity in Taiwan. Obes. Rev. 2005, 6, 271–274. [Google Scholar] [CrossRef]
  22. Taiwanese Food and Nutrients Databank. Available online: https://consumer.fda.gov.tw/ FoodAnalysis/ingredients.htm (accessed on 10 October 2012).
  23. Bergman, R.N.; Stefanovski, D.; Buchanan, T.A.; Sumner, A.E.; Reynolds, J.C.; Sebring, N.G.; Xiang, A.H.; Watanabe, R.M. A better index of body adiposity. Obesity 2011, 19, 1083–1089. [Google Scholar] [CrossRef]
  24. Cole, T.J.; Bellizzi, M.C.; Flegal, K.M.; Dietz, W.H. Establishing a standard definition for child overweight and obesity worldwide: International survey. BMJ 2000, 320, 1240–1243. [Google Scholar] [CrossRef]
  25. Allain, C.C.; Poon, L.S.; Chan, C.S.; Richmond, W.; Fu, P.C. Enzymatic determination of total serum cholesterol. Clin. Chem. 1974, 20, 470–475. [Google Scholar]
  26. Cook, S.; Auinger, P.; Li, C.; Ford, E.S. Metabolic syndrome rates in United States adolescents, from the National Health and Nutrition Examination Survey, 1999–2002. J. Pediatr. 2008, 152, 165–170. [Google Scholar] [CrossRef]
  27. Mickey, R.M.; Greenland, S. The impact of confounder selection criteria on effect estimation. Am. J. Epidemiol. 1989, 129, 125–137. [Google Scholar]
  28. Lee, C.H.; Yang, S.F.; Peng, C.Y.; Li, R.N.; Chen, Y.C.; Chan, T.F.; Tsai, E.M.; Kuo, F.C.; Huang, J.J.; Tsai, H.T.; et al. The precancerous effect of emitted cooking oil fumes on precursor lesions of cervical cancer. Int. J. Cancer 2010, 127, 932–941. [Google Scholar]
  29. Huang, R.C.; Mori, T.A.; Burke, V.; Newnham, J.; Stanley, F.J.; Landau, L.I.; Kendall, G.E.; Oddy, W.H.; Beilin, L.J. Synergy between adiposity, insulin resistance, metabolic risk factors, and inflammation in adolescents. Diabetes Care 2009, 32, 695–701. [Google Scholar] [CrossRef]
  30. Lee, C.H.; Wu, D.C.; Lee, J.M.; Wu, I.C.; Goan, Y.G.; Kao, E.L.; Huang, H.L.; Chan, T.F.; Chou, S.H.; Chou, Y.P.; et al. Anatomical subsite discrepancy in relation to the impact of the consumption of alcohol, tobacco and betel quid on esophageal cancer. Int. J. Cancer 2007, 120, 1755–1762. [Google Scholar] [CrossRef]
  31. Vartanian, L.R.; Schwartz, M.B.; Brownell, K.D. Effects of soft drink consumption on nutrition and health: A systematic review and meta-analysis. Am. J. Public Health 2007, 97, 667–675. [Google Scholar] [CrossRef]
  32. Malik, V.S.; Schulze, M.B.; Hu, F.B. Intake of sugar-sweetened beverages and weight gain: A systematic review. Am. J. Clin. Nutr. 2006, 84, 274–288. [Google Scholar]
  33. Gibson, S. Sugar-sweetened soft drinks and obesity: A systematic review of the evidence from observational studies and interventions. Nutr. Res. Rev. 2008, 21, 134–147. [Google Scholar] [CrossRef]
  34. Kosova, E.C.; Auinger, P.; Bremer, A.A. The relationships between sugar-sweetened beverage intake and cardiometabolic markers in young children. J. Acad. Nutr. Diet. 2013, 113, 219–227. [Google Scholar] [CrossRef]
  35. Bremer, A.A.; Auinger, P.; Byrd, R.S. Relationship between insulin resistance-associated metabolic parameters and anthropometric measurements with sugar-sweetened beverage intake and physical activity levels in US adolescents: Findings from the 1999–2004 National Health and Nutrition Examination Survey. Arch. Pediatr. Adolesc. Med. 2009, 163, 328–335. [Google Scholar] [CrossRef]
  36. Chan, T.F.; Lin, W.T.; Chen, Y.L.; Huang, H.L.; Yang, W.Z.; Lee, C.Y.; Chen, M.H.; Wang, T.N.; Huang, M.C.; Chiu, Y.W.; et al. Elevated serum triglyceride and retinol-binding protein 4 levels associated with fructose-sweetened beverages in adolescents. PLoS One 2014, 9, e82004. [Google Scholar]
  37. Nguyen, S.; Choi, H.K.; Lustig, R.H.; Hsu, C.Y. Sugar-sweetened beverages, serum uric acid, and blood pressure in adolescents. J. Pediatr. 2009, 154, 807–813. [Google Scholar] [CrossRef]
  38. Malik, A.H.; Akram, Y.; Shetty, S.; Malik, S.S.; Njike, V. Impact of sugar-sweetened beverages on blood pressure. Am. J. Cardiol. 2014, 113, 1574–1580. [Google Scholar] [CrossRef]

