The Metabolic Effects of Oats Intake in Patients with Type 2 Diabetes: A Systematic Review and Meta-Analysis

 and
and
Abstract
:1. Introduction
2. Methods
2.1. Literature Search and Study Selection
2.2. Data Extraction
2.3. Quality Assessment
2.4. Statistical Methods and Evidence Assessment
3. Results
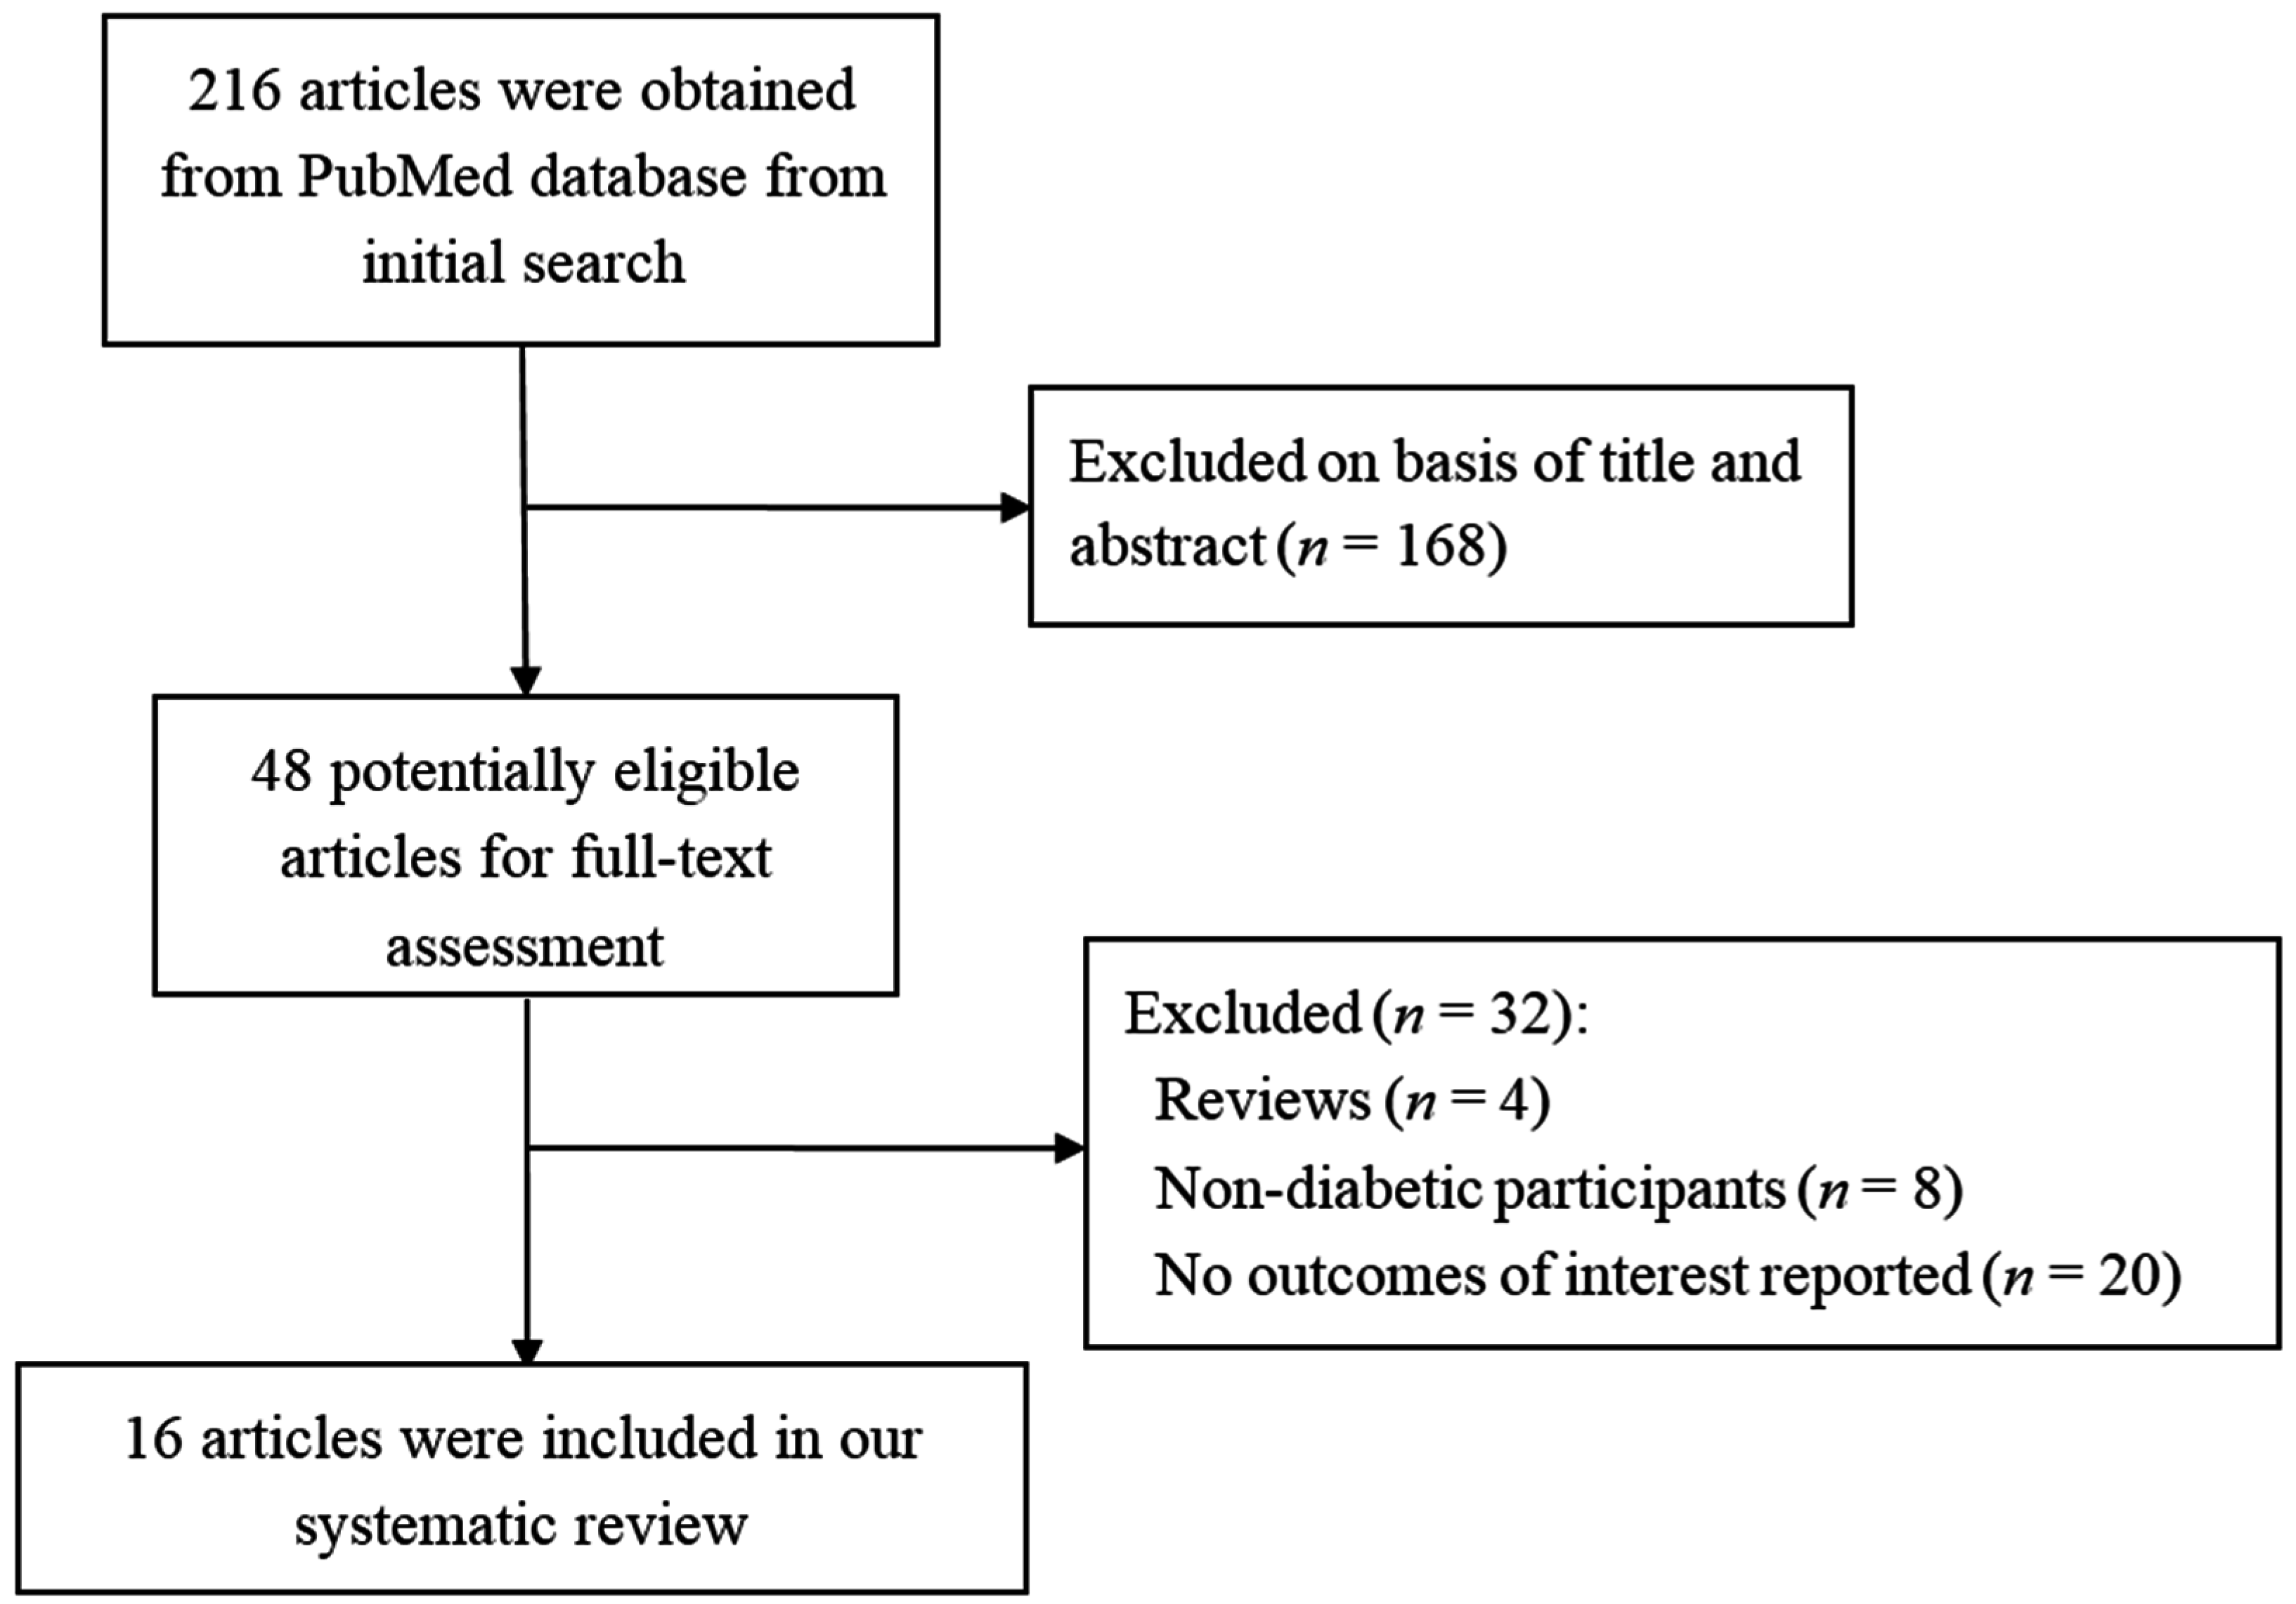
3.1. Search Results


| Study | Country | No. of Subjects | Sex (F %) | Age (Year) | Subject Type | Design | Follow-up Duration | Baseline HbA1c (%) |
|---|---|---|---|---|---|---|---|---|
| Reyna, 2003 [9] | Venezuela | 16 | Male | 45–55 | Well controlled T2DM | Parallel RCT | 4 weeks | 8.3 |
| Ma, 2013 [16] | China | 260 | M & F (56.9) | 50–65 | T2DM, MetS | Parallel RCT | 30 days | 9.9 |
| Liatis, 2009 [17] | Greece | 46 | M & F (43.9) | 63 | T2DM | Parallel RCT | 3 weeks | 7.1 |
| Cugnet-Anceau, 2009 [18] | France & Sweden | 53 | M & F (39.6) | 30–75 | Free-living T2DM | Parallel RCT | 8 weeks | 7.4 |
| Tappy, 1996 [19] | Switzerland | 8 | M & F (12.5) | 34–65 | T2DM | Crossover RCT | Single meal | 6.4 |
| Jenkins, 2002 [20] | Canada | 16 | M & F (37.5) | 46–70 (61 ± 2) | T2DM | Crossover RCT | Single meal | 7.4 |
| Rendell, 2005 [21] | USA | 18 | M & F (33.3) | 62 ± 3 | T2DM only under diet management | Crossover RCT | Single meal | NA |
| Tapola, 2005 [22] | Finland | 12 | M & F (58.3) | 18–75 (66 ± 7) | T2DMonly under diet management | Crossover RCT | Single meal | NA |
| Yu, 2014 [23] | China | 30 | M & F (56.7) | 48–73 (66 ± 6) | T2DM without insulin therapy | Crossover RCT | Single meal | 6.8 |
| Braaten, 1994 [24] | Canada | 8 | M & F (62.5) | 59 (50–68) | T2DM | Non-randomised crossover trial | Single meal | 8.3 |
| Pick, 1996 [25] | Canada | 8 | Male | 39–57 (46 ± 1) | T2DM | Crossover RCT | 2 consecutive 12-week | 7.0 |
| McGeoch, 2013 [26] | UK | 27 | M & F (33.3) | 46–71 | T2DM under diet and lifestyle management | Crossover RCT | 2 consecutive 8-week | 6.8 |
| Kabir, 2002 [27] | France | 13 | Male | 41–67 (59 ± 2) | T2DM | Crossover RCT | 2 periods of 4 weeks with a 15-day washout interval | 8.3 |
| Ballesteros, 2015 [28] | Mexico | 29 | M & F (34.5) | 54 ± 8 | Well controlled T2DM | Crossover RCT | 2 periods of 5 weeks with a 3-week washout interval | 6.8 |
| Lammert, 2007 [29] | Germany | 14 | M & F (71.1) | 60 ± 10 | Uncontrolled T2DM, insulin resistance, MetS | Uncontrolled prospective observational study | 2 days & 4 weeks | 8.6 |
| Zerm, 2013 [30] | Germany | 50 | M & F (52.0) | 65 ± 10 | Poorly controlled T2DM, insulin resistance, obese | Uncontrolled retrospective observational study | 2 days | 9.6 |
3.2. Glucose Control and Insulin Profiles
| Study | Comparison | FBG (mmol/L) | PBG (mmol/L) | FINS (μU/mL) | PINS (μU/mL) | HbA1c (%) | HOMA-IR (μU × mol/L2) | HOMA-B (mU/mmol) |
|---|---|---|---|---|---|---|---|---|
| Reyna, 2003 [9] | Modified diet V. baseline | 0.37 ↓ | NA | NA | NA | 0.40 ↓§,* | NA | NA |
| ADA’s diet V. baseline | 0.39 ↓ | NA | NA | NA | 0.20 ↓§ | NA | NA | |
| Ma, 2013 [16] | Usual care V. baseline | 0.22 ↓ | 0.01 ↓ | NA | NA | 0.22 ↓ | 0.11 ↓ | NA |
| Diet V. baseline | 1.18 ↓§,a | 2.49 ↓§,a | NA | NA | 1.71 ↓§,a | 0.27 ↓§ | NA | |
| 50 g-ONOG V. baseline | 1.64 ↓§,a | 3.25 ↓§,a | NA | NA | 2.21 ↓§,a | 0.11 ↓ | NA | |
| 100 g-ONOG V. baseline | 1.91 ↓§,a,b | 3.70 ↓§,a,b | NA | NA | 2.22 ↓§,a,b | 0.33 ↓§,a,c | NA | |
| Liatis, 2009 [17] | β-glucan bread V. baseline | 0.72 ↓§ | NA | 3.23 ↓* | NA | 0.28 ↓§ | 2.08 ↓* | NA |
| White bread V. baseline | 0.07 ↓ | NA | 3.77 ↑ | NA | 0.13 ↓ | 1.33 ↑ | NA | |
| Cugnet-Anceau, 2009 [18] | β-glucan soup V. baseline | 0.11 ↑ | NA | NA | NA | 0.00 ↑ | NA | NA |
| Control soup V. baseline | 0.80 ↑ | NA | NA | NA | 0.17 ↑ | NA | NA | |
| McGeoch, 2013 [26] | Oat-enriched diet V. habitual diet (baseline) | 0.30 ↑ | NA | 0.40 ↓ | NA | 0.10 ↑ | 0.10 ↑ | 5.30 ↓ |
| Standard dietary advice V. habitual diet (baseline) | 0.60 ↑ | NA | 0.00 | NA | 0.20 ↑ | 0.30 ↑ | 1.00 ↓ | |
| Oat-enriched diet V. standard dietary advice | 0.30 ↓ | NA | 0.40 ↓ | NA | 0.10 ↓ | 0.20 ↓ | 4.30 ↓ | |
| Kabir, 2002 [27] | Low-GIB (GI: 40%) V. baseline | 0.30 ↓ | NA | 2.78 ↑ | NA | 0.50 ↓ | NA | NA |
| High-GIB (GI: 64%) V. baseline | 0.30 ↓ | NA | 5.00 ↑ | NA | 0.20 ↓ | NA | NA | |
| Ballesteros, 2015 [28] | Oatmeal breakfast V. egg breakfast | 0.20 ↓ | NA | 2.03 ↓ | NA | 0.05 ↑ | 0.60 ↓ | NA |
| Lammert, 2007 [29] | After 2 days of oatmeal V. baseline | MBG: 2.39 ↓§ | MDI: 62.00 U/d ↓§ | NA | NA | NA | ||
| 4 weeks after 2 days of oatmeal V. baseline | MBG: 0.94 ↓ | MDI: 46.80 IU/d ↓§ | 0.40 ↓ | NA | NA | |||
| Zerm, 2013 [30] | Day 2 after 2 days of oatmeal V. baseline | MBG: 1.08 ↓§ | MDI: 62.00 U/d ↓§ | NA | NA | NA | ||
| Day 3 after 2 days of oatmeal V. baseline | MBG: 1.42 ↓§ | MDI: 36.60 IU/d ↓§ | NA | NA | NA | |||
| No. of Subjects | Test of Heterogeneity | |||||||
|---|---|---|---|---|---|---|---|---|
| Variables | No. of Studies | Intervention Group | Control Group | MD | 95% CI | ph | I2 (%) | pz |
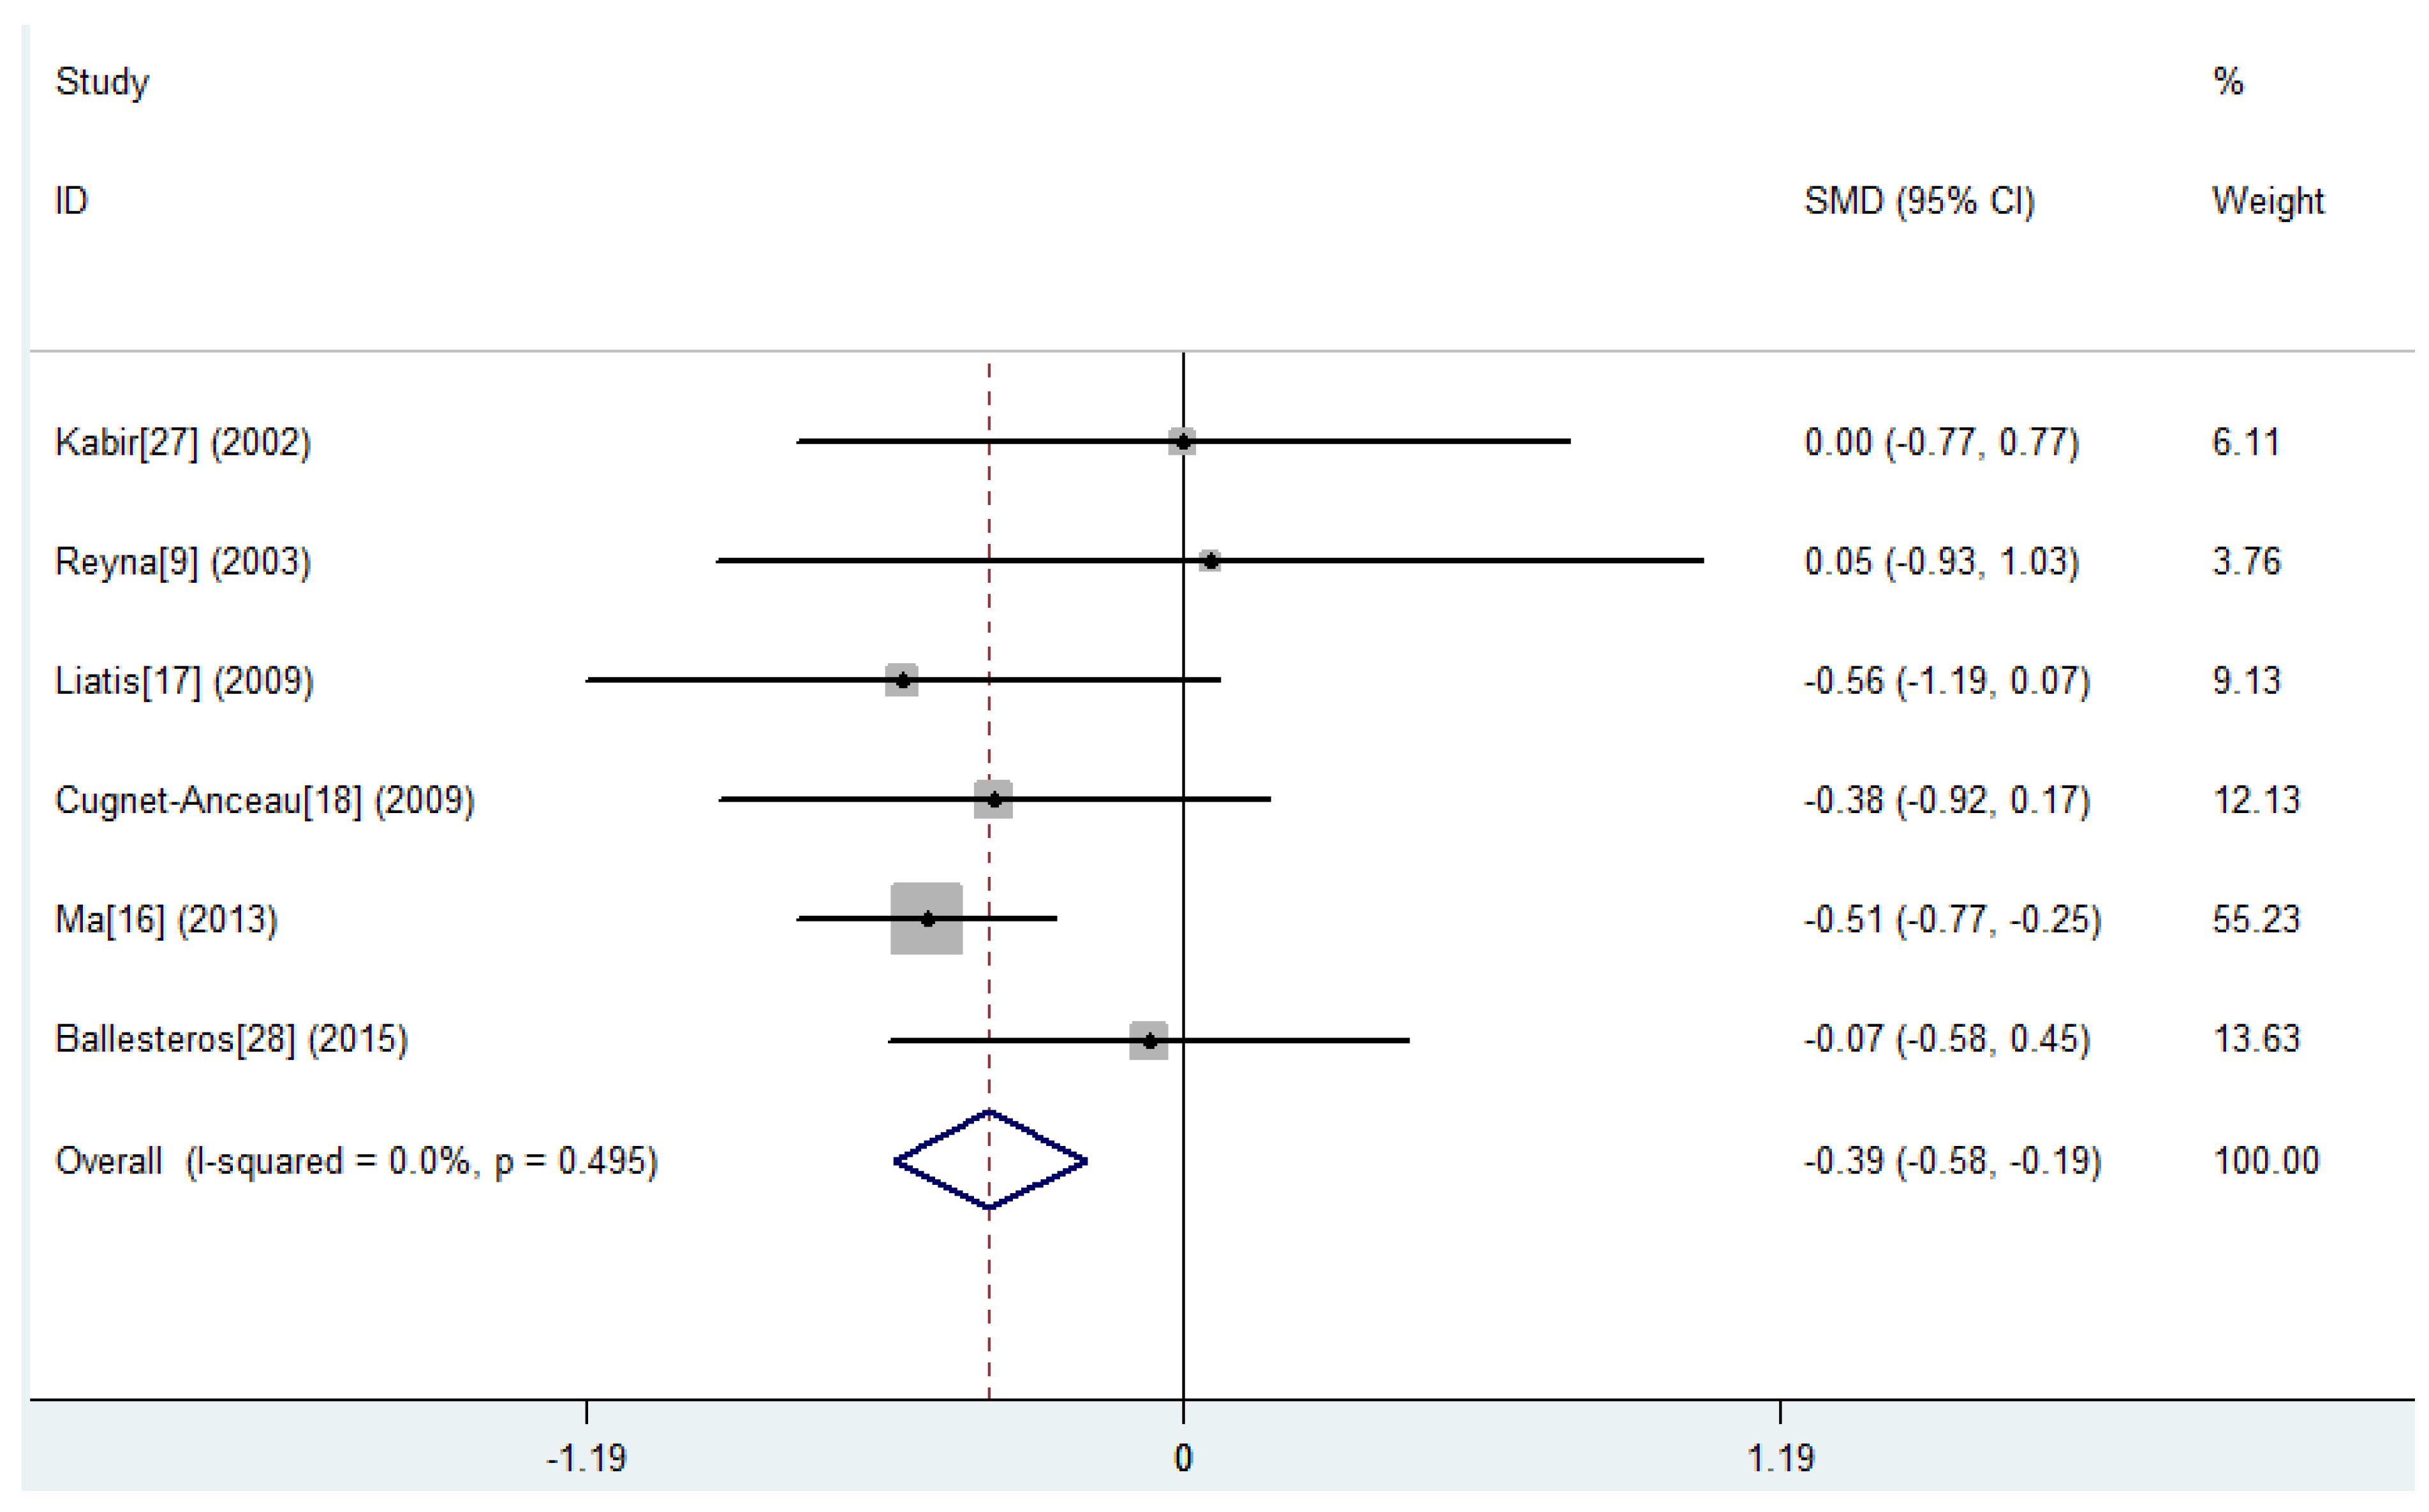
| FBG (mmol/L) | 6 | 229 | 208 | −0.39 | −0.58, −0.19 | 0.495 | 0.0 * | <0.001 |
| FINS (μU/mL) | 2 | 36 | 31 | −0.22 | −1.28, 0.84 | 0.035 | 77.5 § | 0.681 |
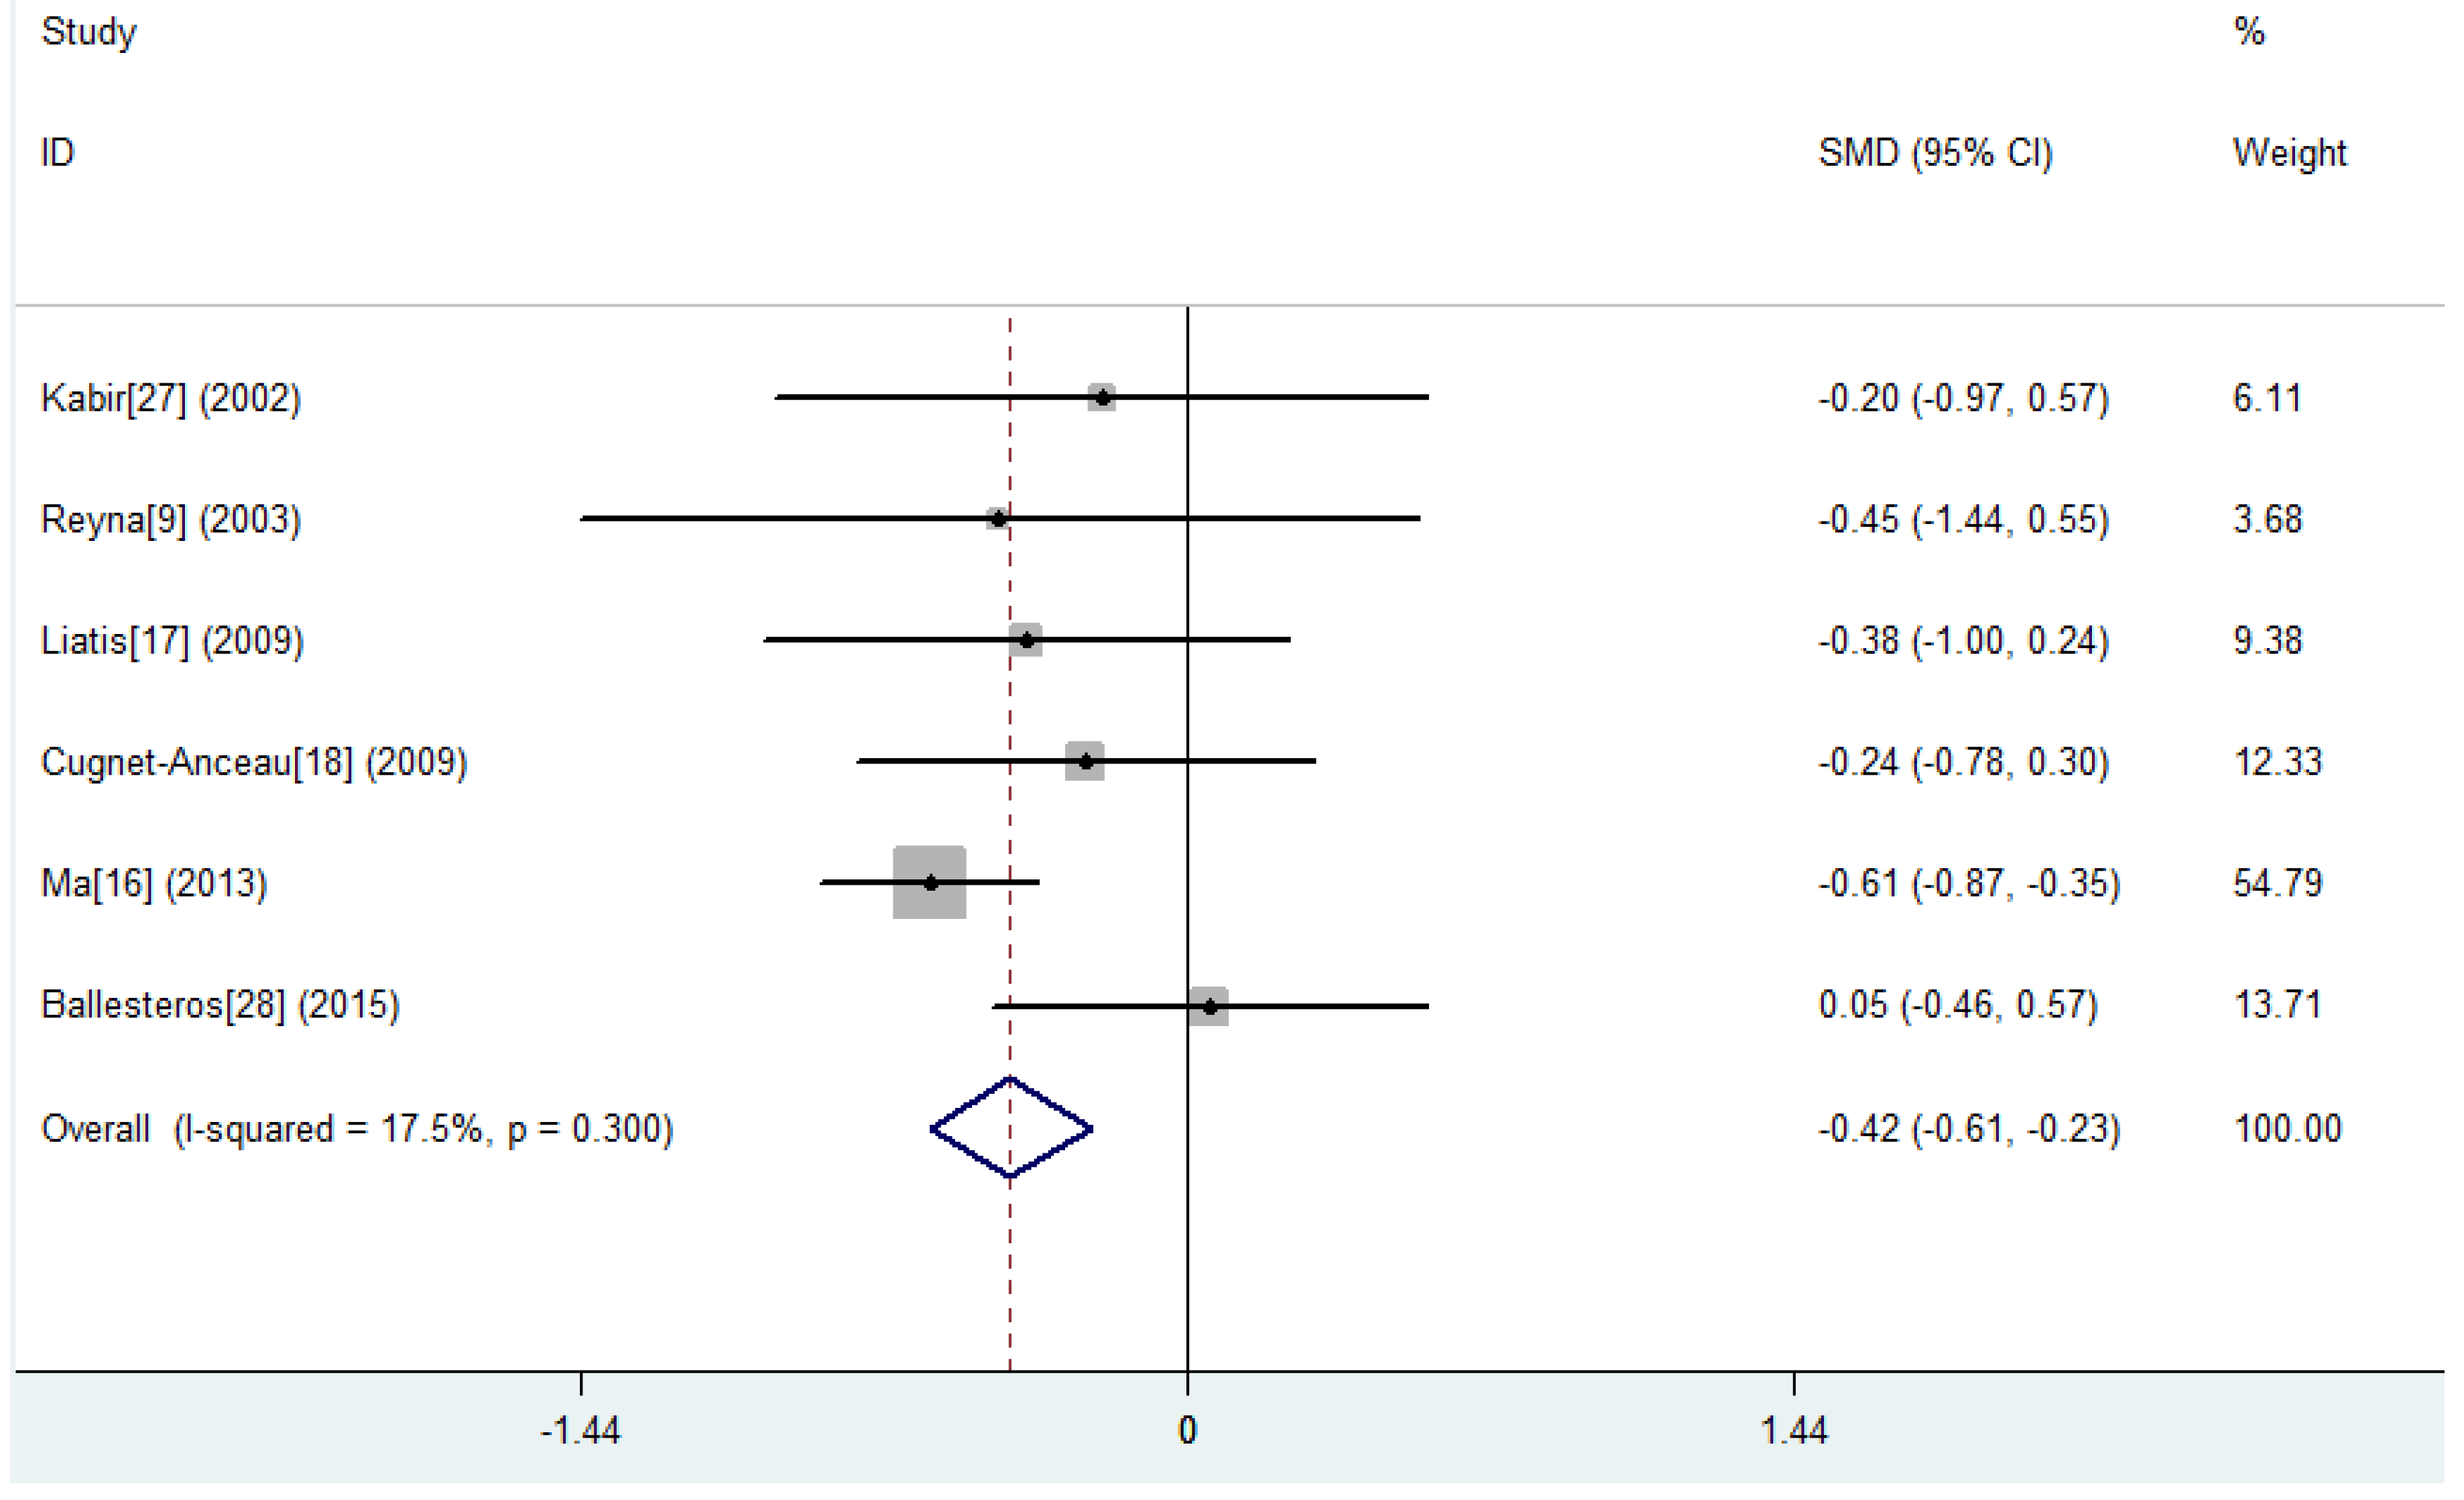
| HbA1c (%) | 6 | 229 | 208 | −0.42 | −0.61, −0.23 | 0.300 | 17.5 * | <0.001 |
| HOMA-IR (μU × mol/L2) | 2 | 150 | 134 | −0.51 | −1.05, 0.02 | 0.107 | 61.6 § | 0.061 |
| TC (mmol/L) | 7 | 237 | 216 | −0.49 | −0.86, −0.12 | 0.016 | 61.7 § | 0.010 |
| LDL-C (mmol/L) | 5 | 216 | 195 | −0.29 | −0.48, −0.09 | 0.284 | 20.5 * | 0.004 |
| HDL-C (mmol/L) | 6 | 229 | 208 | −0.05 | −0.24, 0.14 | 0.608 | 0.0 * | 0.599 |
| TG (mmol/L) | 7 | 237 | 216 | −0.16 | −0.34, 0.03 | 0.351 | 10.2 * | 0.097 |
| Weight (kg) | 3 | 158 | 142 | −0.10 | −0.33, 0.12 | 0.505 | 0.0 * | 0.372 |
| BMI (kg/m2) | 4 | 187 | 166 | −0.14 | −0.35, 0.07 | 0.566 | 0.0 * | 0.205 |


3.3. Single Meal Responses of Glucose and Insulin
| Study | Comparison | Glucose Response | Insulin Response | ||
|---|---|---|---|---|---|
| AUC | Peak | AUC | Peak | ||
| Tappy, 1996 [19] | 4.0 g V. 0 g β-glucan | 4 h: 29.00% ↓ | 33.00% ↓# | NA | 4 h:33.00% ↓# |
| 6.0 g V. 0 g β-glucan | 59.00% ↓# | 58.00% ↓# | NA | 38.00% ↓# | |
| 8.4 g V. 0 g β-glucan | 65.00% ↓# | 62.00% ↓# | NA | 41.00% ↓# | |
| Jenkins, 2002 [20] | Oat bran cereal (3.7 g β-glucan) V. white bread | 3 h: 11.09% ↓# | NA | NA | NA |
| β-glucan bar (6.2 g β-glucan) V. white bread | 55.77% ↓# | NA | NA | NA | |
| β-glucan cereal (7.3 g β-glucan) V. white bread | 46.78% ↓# | NA | NA | NA | |
| Rendell, 2005 [21] | Prowash (9.9 g β-glucan) V. liquid meal replacer | 3 h: 42.36% ↓# | 59.37% ↓# | 3 h: 67.74% ↓# | 83.48% ↓# |
| Prowash V. oatmeal (3.1 g β-glucan) | 58.50% ↓# | 64.85% ↓# | 67.74% ↓# | 72.83% ↓# | |
| Tapola, 2005 [22] | Oat bran flour V. 12.5 g glucose load | 1 h: 79.41% ↓#; 2 h: 60.17% ↓# | 81.82% ↓# | NA | NA |
| Oat bran crisp V. 12.5 g glucose load | 1 h: 49.02% ↓#; 2 h: 21.19% ↓ | 45.45% ↓# | NA | NA | |
| 25 g glucose load + 30 g oat bran flour V. 25 g glucose load | 1 h: 35.00% ↓#; 2 h: 22.00% ↓# | 34.00% ↓# | NA | NA | |
| Yu, 2014 [23] | SDF liquid (7.5 g β-glucan) V. SDF-free liquid | NA | 26.38% ↓# | NA | 32.72% ↓# |
| Braaten, 1994 [24] | Wheat farina with oat gum (8.8 g β-glucan) V. wheat farina | 3 h: 20.35% ↓# | 26.76% ↓# | 3 h: 18.89% ↓# | NA |
| Oat bran (8.8 g β-glucan) V. wheat farina | 19.95% ↓# | 26.76% ↓# | 8.39% ↑# | NA | |
| Pick, 1996 [25] | Oat bran concentrate bread V. white bread | Total 8 h: 46.06% ↓#; breakfast (4 h): 41.98% ↓#; lunch (4 h): 52.07% ↓ | breakfast (4 h): 12.99% ↓; lunch (4 h): 15.27% ↓ | Total 8 h: 18.66% ↓; breakfast (4 h): 24.52% ↓#; lunch (4 h): 13.61% ↓ | breakfast (4 h): 15.24% ↓#; lunch (4 h): 10.99% ↓ |
| McGeoch, 2013 [26] | Oat-enriched diet V. habitual diet (baseline) | 3 h: 8.75% ↑§ | NA | 3 h: 3.84% ↑ | NA |
| Standard dietary advice V. habitual diet (baseline) | 10.92% ↑§ | NA | 3.99% ↑ | NA | |
| Oat-enriched diet V. standard dietary advice | 1.96% ↓ | NA | 0.15% ↑ | NA | |
| Kabir, 2002 [27] | Low-GIB (GI: 40%) V. baseline | 3 h: 14.58% ↑ | 6.90% ↑ | 3 h: 10.77% ↓ | 8.00% ↑ |
| High-GIB (GI: 64%) V. baseline | 3.66% ↑ | 2.00% ↑ | 0.00% | 4.76% ↓ | |
3.4. Lipid Profiles
| Study | Comparison | TC (mmol/L) | LDL-C (mmol/L) | HDL-C (mmol/L) | TG (mmol/L) | Weight (kg) | BMI (kg/m2) |
|---|---|---|---|---|---|---|---|
| Reyna, 2003 [9] | Modified diet V. baseline | 0.38 ↓§ | 0.26 ↓§ | 0.15 ↑§,* | 0.25 ↓ | 3.20 ↓§,* | 1.20 ↓§,* |
| ADA’s diet V. baseline | 0.17 ↓ | 0.03 ↓ | 0.01 ↑ | 0.34 ↓ | 1.50 ↓§ | 0.40 ↓§ | |
| Ma, 2013 [16] | Usual care V. baseline | 0.01 ↓ | 0.02 ↑ | 0.01 ↑ | 0.08 ↓ | 0.37 ↓ | 0.14 ↓ |
| Diet V. baseline | 0.23 ↓§,a | 0.03 ↓ | 0.07 ↓§,a | 0.41 ↓§ | 0.86 ↓§ | 0.31 ↓§ | |
| 50 g-ONOG V. baseline | 0.47 ↓§,a,b | 0.22 ↓§,a,b | 0.06 ↓§,a | 0.13 ↓ | 0.79 ↓§ | 0.28 ↓§ | |
| 100 g-ONOG V. baseline | 0.59 ↓§,a,b | 0.31 ↓§,a,b | 0.08 ↓§,a | 0.53 ↓§,a,c | 1.17 ↓§,a | 0.45 ↓§,a | |
| Liatis, 2009 [17] | β-glucan bread V. baseline | 0.80 ↓§,* | 0.66 ↓§,* | 0.05 ↓ | 0.21 ↓ | 1.03 ↓§ | 0.38 ↓§ |
| White bread V. baseline | 0.12 ↓ | 0.11 ↓ | 0.03 ↓ | 0.06 ↓ | 0.39 ↓ | 0.12 ↓ | |
| Cugnet-Anceau, 2009 [18] | β-glucan soup V. baseline | 0.06 ↓ | 0.05 ↓ | 0.05 ↑§ | 0.12 ↓§,* | NA | 0.18 ↑ |
| Control soup V. baseline | 0.01 ↑ | 0.10 ↓ | 0.03 ↑ | 0.12 ↑§ | NA | 0.36 ↑ | |
| Pick, 1996 [25] | Oat bran concentrate bread V. white bread | 0.74 ↓# | 0.77 ↓# | 0.08 ↑ | 0.11 ↓ | NA | NA |
| McGeoch, 2013 [26] | Oat-enriched diet V. habitual diet (baseline) | 0.10 ↓§ | 0.10 ↓ | 0.00 | 0.16 ↑ | 0.30 ↑§ | 0.20 ↑§ |
| Standard dietary advice V. habitual diet (baseline) | 0.10 ↑§ | 0.10 ↑ | 0.10 ↑ | 0.13 ↑ | 0.30 ↓§ | 0.10 ↓§ | |
| Oat-enriched diet V. standard dietary advice | 0.20 ↓# | 0.20 ↓ | 0.10 ↓ | 0.03 ↑ | 0.60 ↑# | 0.30 ↑# | |
| Kabir, 2002 [27] | Low-GIB (GI: 40%) V. baseline | 0.30 ↓* | NA | 0.03 ↑ | 0.10 ↑ | NA | NA |
| High-GIB (GI: 64%) V. baseline | 0.20 ↑ | NA | 0.03 ↓ | 0.20 ↓ | NA | NA | |
| Ballesteros, 2015 [28] | Oatmeal breakfast V. egg breakfast | 0.10 ↓ | 0.10 ↓ | 0.03 ↓ | 0.05 ↑ | 0.00 | 0.00 |
| Lammert, 2007 [29] | After 2 days of oatmeal V. baseline | 0.47 ↓§ | 0.36 ↓ | 0.03 ↓ | 0.68 ↓§ | NA | NA |
| 4 weeks after 2 days of oatmeal V. baseline | 0.00 | 0.13 ↓ | 0.10 ↑ | 0.41 ↓ | NA | NA |
3.5. Weight and Body Mass Index
3.6. Quality of Evidence
4. Discussion
5. Conclusions
Supplementary Materials
Acknowledgments
Author Contributions
Conflicts of Interest
References
- Shaw, J.E.; Sicree, R.A.; Zimmet, P.Z. Global estimates of the prevalence of diabetes for 2010 and 2030. Diabetes Res. Clin. Pract. 2010, 87, 4–14. [Google Scholar] [CrossRef] [PubMed]
- Zhang, P.; Zhang, X.; Brown, J.; Vistisen, D.; Sicree, R.; Shaw, J.; Nichols, G. Global healthcare expenditure on diabetes for 2010 and 2030. Diabetes Res. Clin. Pract. 2010, 87, 293–301. [Google Scholar] [CrossRef] [PubMed]
- Evert, A.B.; Boucher, J.L.; Cypress, M.; Dunbar, S.A.; Franz, M.J.; Mayer-Davis, E.J.; Neumiller, J.J.; Nwankwo, R.; Verdi, C.L.; Urbanski, P.; et al. Nutrition therapy recommendations for the management of adults with diabetes. Diabetes Care 2014, 37 (Suppl. S1), S120–S143. [Google Scholar] [CrossRef] [PubMed]
- Brennan, C.S. Dietary fibre, glycaemic response, and diabetes. Mol. Nutr. Food Res. 2005, 49, 560–570. [Google Scholar] [CrossRef] [PubMed]
- Clemens, R.; van Klinken, B.J. The future of oats in the food and health continuum. Br. J. Nutr. 2014, 112 (Suppl. S2), S75–S79. [Google Scholar] [CrossRef] [PubMed]
- El Khoury, D.; Cuda, C.; Luhovyy, B.L.; Anderson, G.H. Beta glucan: Health benefits in obesity and metabolic syndrome. J. Nutr. Metab. 2012, 2012, 851362. [Google Scholar] [CrossRef] [PubMed]
- Wang, Q.; Ellis, P.R. Oat β-glucan: Physico-chemical characteristics in relation to its blood-glucose and cholesterol-lowering properties. Br. J. Nutr. 2014, 112, S4–S13. [Google Scholar] [CrossRef] [PubMed]
- Food and Drug Administration (FDA), Code of Federal Regulations. Available online: http://www.ecfr.gov/cgi-bin/text-idx?SID=23f8ec3719c5d0e75285aa894ab1e5b0&mc=true&node=se21.2.101_181&rgn=div8 (accessed on 14 September 2015).
- Reyna, N.Y.; Cano, C.; Bermudez, V.J.; Medina, M.T.; Souki, A.J.; Ambard, M.; Nuñez, M.; Ferrer, M.A.; Inglett, G.E. Sweeteners and beta-glucans improve metabolic and anthropometrics variables in well controlled type 2 diabetic patients. Am. J. Ther. 2003, 10, 438–443. [Google Scholar] [CrossRef] [PubMed]
- Poppitt, S.D.; van Drunen, J.D.; McGill, A.T.; Mulvey, T.B.; Leahy, F.E. Supplementation of a high-carbohydrate breakfast with barley beta-glucan improves postprandial glycaemic response for meals but not beverages. Asia Pac. J. Clin. Nutr. 2007, 16, 16–24. [Google Scholar] [PubMed]
- Weickert, M.O.; Möhlig, M.; Schöfl, C.; Arafat, A.M.; Otto, B.; Viehoff, H.; Koebnick, C.; Kohl, A.; Spranger, J.; Pfeiffer, A.F. Cereal fiber improves whole-body insulin sensitivity in overweight and obese women. Diabetes Care 2006, 29, 775–780. [Google Scholar] [CrossRef] [PubMed]
- Guevara-Cruz, M.; Tovar, A.R.; Aguilar-Salinas, C.A.; Medina-Vera, I.; Gil-Zenteno, L.; Hernandez-Viveros, I.; Lopez-Romero, P.; Ordaz-Nava, G.; Canizales-Quinteros, S.; Guillen Pineda, L.E.; et al. A dietary pattern including nopal, chia seed, soy protein, and oat reduces serum triglycerides and glucose intolerance in patients with metabolic syndrome. J. Nutr. 2012, 142, 64–69. [Google Scholar] [CrossRef] [PubMed]
- European Food Safety Authority (EFSA). Scientific Opinion on the Substantiation of Health Claims Related to Beta-Glucans and Maintenance or Achievement of Normal Blood Glucose Concentrations (ID 756, 802, 2935) Pursuant to Article 13(1) of Regulation (EC) No 1924/2006.2010; European Food Safety Authority (EFSA): Parma, Italy, 2010. [Google Scholar]
- Oremus, M.; Wolfson, C.; Perrault, A.; Demers, L.; Momoli, F.; Moride, Y. Interrater reliability of the modified Jadad quality scale for systematic reviews of Alzheimer’s disease drug trials. Dement. Geriatr. Cogn. Disord. 2001, 12, 232–236. [Google Scholar] [CrossRef] [PubMed]
- Wells, G.A.; Shea, B.; O’connell, D.; Peterson, J.; Welch, V.; Losos, M.; Tugwell, P. The Newcastle–Ottawa Scale (NOS) for assessing the quality of non randomised studies in meta-analyses. Available online: http://www.ohri.ca/programs/clinical_epidemiology/oxford.asp (accessed on 1 June 2011).
- Ma, X.; Gu, J.; Zhang, Z.; Jing, L.; Xu, M.; Dai, X.; Jiang, Y.; Li, Y.; Bao, L.; Cai, X.; et al. Effects of Avena nuda L. on metabolic control and cardiovascular disease risk among chinese patients with diabetes and meeting metabolic syndrome criteria: Secondary analysis of a randomized clinical trial. Eur. J. Clin. Nutr. 2013, 67, 1291–1297. [Google Scholar] [CrossRef] [PubMed]
- Liatis, S.; Tsapogas, P.; Chala, E.; Dimosthenopoulos, C.; Kyriakopoulos, K.; Kapantais, E.; Katsilambros, N. The consumption of bread enriched with betaglucan reduces LDL-cholesterol and improves insulin resistance in patients with type 2 diabetes. Diabetes Metab. 2009, 35, 115–120. [Google Scholar] [CrossRef] [PubMed]
- Cugnet-Anceau, C.; Nazare, J.A.; Biorklund, M.; le Coquil, E.; Sassolas, A.; Sothier, M.; Holm, J.; Landin-Olsson, M.; Onning, G.; Laville, M.; et al. A controlled study of consumption of beta-glucan-enriched soups for 2 months by type 2 diabetic free-living subjects. Br. J. Nutr. 2010, 103, 422–428. [Google Scholar] [CrossRef] [PubMed]
- Tappy, L.; Gügolz, E.; Würsch, P. Effects of breakfast cereals containing various amounts of beta-glucan fibers on plasma glucose and insulin responses in NIDDM subjects. Diabetes Care 1996, 19, 831–834. [Google Scholar] [CrossRef] [PubMed]
- Jenkins, A.L.; Jenkins, D.J.; Zdravkovic, U.; Würsch, P.; Vuksan, V. Depression of the glycemic index by high levels of beta-glucan fiber in two functional foods tested in type 2 diabetes. Eur. J. Clin. Nutr. 2002, 56, 622–628. [Google Scholar] [CrossRef] [PubMed]
- Rendell, M.; Vanderhoof, J.; Venn, M.; Shehan, M.A.; Arndt, E.; Rao, C.S.; Gill, G.; Newman, R.K.; Newman, C.W. Effect of a barley breakfast cereal on blood glucose and insulin response in normal and diabetic patients. Plant Foods Hum. Nutr. 2005, 60, 63–67. [Google Scholar] [CrossRef] [PubMed]
- Tapola, N.; Karvonen, H.; Niskanen, L.; Mikola, M.; Sarkkinen, E. Glycemic responses of oat bran products in type 2 diabetic patients. Nutr. Metab. Cardiovasc. Dis. 2005, 15, 255–261. [Google Scholar] [CrossRef] [PubMed]
- Yu, K.; Ke, M.Y.; Li, W.H.; Zhang, S.Q.; Fang, X.C. The impact of soluble dietary fibre on gastric emptying, postprandial blood glucose and insulin in patients with type 2 diabetes. Asia Pac. J. Clin. Nutr. 2014, 23, 210–218. [Google Scholar] [PubMed]
- Braaten, J.T.; Scott, F.W.; Wood, P.J.; Riedel, K.D.; Wolynetz, M.S.; Brulé, D.; Collins, M.W. High beta-glucan oat bran and oat gum reduce postprandial blood glucose and insulin in subjects with and without type 2 diabetes. Diabet. Med. 1994, 11, 312–318. [Google Scholar] [CrossRef] [PubMed]
- Pick, M.E.; Hawrysh, Z.J.; Gee, M.I.; Toth, E.; Garg, M.L.; Hardin, R.T. Oat bran concentrate bread products improve long-term control of diabetes. J. Am. Diet. Assoc. 1996, 96, 1254–1261. [Google Scholar] [CrossRef]
- McGeoch, S.C.; Johnstone, A.M.; Lobley, G.E.; Adamson, J.; Hickson, K.; Holtrop, G.; Fyfe, C.; Clark, L.F.; Pearson, D.W.; Abraham, P.; et al. A randomized crossover study to assess the effect of an oat-rich diet on glycaemic control, plasma lipids and postprandial glycaemia, inflammation and oxidative stress in type 2 diabetes. Diabet. Med. 2013, 30, 1314–1323. [Google Scholar] [CrossRef] [PubMed]
- Kabir, M.; Oppert, J.M.; Vidal, H.; Bruzzo, F.; Fiquet, C.; Wursch, P.; Slama, G.; Rizkalla, S.W. Four-week low-glycemic index breakfast with a modest amount of soluble fibers in type 2 diabetic men. Metabolism 2002, 51, 819–826. [Google Scholar] [CrossRef] [PubMed]
- Ballesteros, M.N.; Valenzuela, F.; Robles, A.E.; Artalejo, E.; Aguilar, D.; Andersen, C.J.; Valdez, H.; Fernandez, M.L. One egg per day improves inflammation when compared to an oatmeal-based breakfast without increasing other cardiometabolic risk factors in diabetic patients. Nutrients 2015, 7, 3449–3463. [Google Scholar] [CrossRef] [PubMed]
- Lammert, A.; Kratzsch, J.; Selhorst, J.; Humpert, P.M.; Bierhaus, A.; Birck, R.; Kusterer, K.; Hammes, H.P. Clinical benefit of a short term dietary oatmeal intervention in patients with type 2 diabetes and severe insulin resistance: A pilot study. Exp. Clin. Endocrinol. Diabetes 2008, 116, 132–134. [Google Scholar] [CrossRef] [PubMed]
- Zerm, R.; Helbrecht, B.; Jecht, M.; Hein, A.; Millet, E.; Girke, M.; Kroz, M. Oatmeal diet days may improve insulin resistance in patients with type 2 diabetes mellitus. Forsch. Komplement. 2013, 20, 465–468. [Google Scholar] [CrossRef] [PubMed]
- Wood, P.J.; Braaten, J.T.; Scott, F.W.; Riedel, K.D.; Wolynetz, M.S.; Collins, M.W. Effect of dose and modification of viscous properties of oat gum on plasma glucose and insulin following an oral glucose load. Br. J. Nutr. 1994, 72, 731–743. [Google Scholar] [CrossRef] [PubMed]
- Wolever, T.M.; Vuksan, V.; Eshuis, H.; Spadafora, P.; Peterson, R.D.; Chao, E.S.; Storey, M.L.; Jenkins, D.J. Effect of method of administration of psyllium on glycemic response and carbohydrate digestibility. J. Am. Coll. Nutr. 1991, 10, 364–371. [Google Scholar] [CrossRef] [PubMed]
- Stratton, I.M.; Adler, A.I.; Neil, H.A.; Matthews, D.R.; Manley, S.E.; Cull, C.A.; Hadden, D.; Turner, R.C.; Holman, R.R. Association of glycaemia with macrovascular and microvascular complications of type 2 diabetes (UKPDS 35): Prospective observational study. BMJ 2000, 321, 405–412. [Google Scholar] [CrossRef] [PubMed]
- Thies, F.; Masson, L.F.; Boffetta, P.; Kris-Etherton, P. Oats and CVD risk markers: A systematic literature review. Br. J. Nutr. 2014, 112 (Suppl. S2), S19–S30. [Google Scholar] [CrossRef] [PubMed]
- Tiwari, U.; Cummins, E. Meta-analysis of the effect of beta-glucan intake on blood cholesterol and glucose levels. Nutrition 2011, 27, 1008–1016. [Google Scholar] [CrossRef] [PubMed]
- Whitehead, A.; Beck, E.J.; Tosh, S.; Wolever, T.M. Cholesterol-lowering effects of oat beta-glucan: A meta-analysis of randomized controlled trials. Am. J. Clin. Nutr. 2014, 100, 1413–1421. [Google Scholar] [CrossRef] [PubMed]
- Stefanick, M.L.; Mackey, S.; Sheehan, M.; Ellsworth, N.; Haskell, W.L.; Wood, P.D. Effects of diet and exercise in men and postmenopausal women with low levels of HDL cholesterol and high levels of LDL cholesterol. N. Engl. J. Med. 1998, 339, 12–20. [Google Scholar] [CrossRef] [PubMed]
- Ng, D.S. Diabetic dyslipidemia: From evolving pathophysiological insight to emerging therapeutic targets. Can. J. Diabetes 2013, 37, 319–326. [Google Scholar] [CrossRef] [PubMed]
- National Cholesterol Education Program (NCEP) Expert Panel on Detection, Evaluation, and Treatment of High Blood Cholesterol in Adults (Adult Treatment Panel III). Third Report of the National Cholesterol Education Program (NCEP) Expert Panel on Detection, Evaluation, and Treatment of High Blood Cholesterol in Adults (Adult Treatment Panel III) Final Report. Circulation 2002, 106, 3143–3421. [Google Scholar]
- Singh, R.; De, S.; Belkheir, A. Avena sativa (oat), a potential neutraceutical and therapeutic agent: An overview. Crit. Rev. Food Sci. Nutr. 2013, 53, 126–144. [Google Scholar] [CrossRef] [PubMed]
- Battilana, P.; Ornstein, K.; Minehira, K.; Schwarz, J.M.; Acheson, K.; Schneiter, P.; Burri, J.; Jéquier, E.; Tappy, L. Mechanisms of action of beta-glucan in postprandial glucose metabolism in healthy men. Eur. J. Clin. Nutr. 2001, 55, 327–333. [Google Scholar] [CrossRef] [PubMed]
- Tosh, S.M. Review of human studies investigating the post-prandial blood-glucose lowering ability of oat and barley food products. Eur. J. Clin. Nutr. 2013, 67, 310–317. [Google Scholar] [CrossRef] [PubMed]
- Lyly, M.; Ohls, N.; Lähteenmäki, L.; Salmenkallio-Marttila, M.; Liukkonen, K.H.; Karhunen, L.; Poutanen, K. The effect of fiber amount, energy level and viscosity of beverages containing oat fiber supplement on perceived satiety. Food Nutr. Res. 2010, 54, 2149. [Google Scholar] [CrossRef] [PubMed]
- Nazare, J.A.; Normand, S.; Oste Triantafyllou, A.; Brac de la Perriere, A.; Desage, M.; Laville, M. Modulation of the postprandial phase by beta-glucan in overweight subjects: Effects on glucose and insulin kinetics. Mol. Nutr. Food Res. 2009, 53, 361–369. [Google Scholar] [CrossRef] [PubMed]
- Rubin, H. The paradox of the contrasting roles of chronic magnesium deficiency in metabolic disorders and field cancerization. Magnes. Res. 2014, 27, 94–102. [Google Scholar] [PubMed]
- Chu, Y.F.; Wise, M.L.; Gulvady, A.A.; Chang, T.; Kendra, D.F.; Jan-Willem van Klinken, B.; Shi, Y.; O’Shea, M. In vitro antioxidant capacity and anti-inflammatory activity of seven common oats. Food Chem. 2013, 139, 426–431. [Google Scholar] [CrossRef] [PubMed]
- Decker, E.A.; Rose, D.J.; Stewart, D. Processing of oats and the impact of processing operations on nutrition and health benefits. Br. J. Nutr. 2014, 112 (Suppl. S2), S58–S64. [Google Scholar] [CrossRef] [PubMed]
- Naumann, E.; van Rees, A.B.; Onning, G.; Oste, R.; Wydra, M.; Mensink, R.P. Beta-glucan incorporated into a fruit drink effectively lowers serum LDL-cholesterol concentrations. Am. J. Clin. Nutr. 2006, 83, 601–605. [Google Scholar] [PubMed]
- Amigo, C.D.; Popping, B. Gluten and gluten-free: Issues and considerations of labeling regulations, detection methods, and assay validation. J. AOAC Int. 2012, 95, 337–348. [Google Scholar] [CrossRef]
- Ciacci, C.; Ciclitira, P.; Hadjivassiliou, M.; Kaukinen, K.; Ludvigsson, J.F.; McGough, N.; Sanders, D.S.; Woodward, J.; Leonard, J.N.; Swift, G.L. The gluten-free diet and its current application in coeliac disease and dermatitis herpetiformis. United Eur. Gastroenterol. J. 2015, 3, 121–135. [Google Scholar] [CrossRef] [PubMed]
- Pourpak, Z.; Mesdaghi, M.; Mansouri, M.; Kazemnejad, A.; Toosi, S.B.; Farhoudi, A. Which cereal is a suitable substitute for wheat in children with wheat allergy? Pediatr. Allergy Immunol. 2005, 16, 262–266. [Google Scholar] [CrossRef] [PubMed]
- Frederiksen, B.; Kroehl, M.; Lamb, M.M.; Seifert, J.; Barriga, K.; Eisenbarth, G.S.; Rewers, M.; Norris, J.M. Infant exposures and development of type 1 diabetes mellitus: The diabetes autoimmunity study in the young (daisy). JAMA Pediatr. 2013, 167, 808–815. [Google Scholar] [CrossRef] [PubMed]
- Virtanen, S.M.; Takkinen, H.M.; Nevalainen, J.; Kronberg-Kippila, C.; Salmenhaara, M.; Uusitalo, L.; Kenward, M.G.; Erkkola, M.; Veijola, R.; Simell, O.; et al. Early introduction of root vegetables in infancy associated with advanced β-cell autoimmunity in young children with human leukocyte antigen-conferred susceptibility to type 1 diabetes. Diabet Med. 2011, 28, 965–971. [Google Scholar] [CrossRef] [PubMed]
- Kleinman, R.E. American Academy of Pediatricsrecommendations for complementary feeding. Pediatrics 2000, 106, 1274. [Google Scholar] [PubMed]
© 2015 by the authors; licensee MDPI, Basel, Switzerland. This article is an open access article distributed under the terms and conditions of the Creative Commons by Attribution (CC-BY) license (http://creativecommons.org/licenses/by/4.0/).
Share and Cite
Hou, Q.; Li, Y.; Li, L.; Cheng, G.; Sun, X.; Li, S.; Tian, H. The Metabolic Effects of Oats Intake in Patients with Type 2 Diabetes: A Systematic Review and Meta-Analysis. Nutrients 2015, 7, 10369-10387. https://doi.org/10.3390/nu7125536
Hou Q, Li Y, Li L, Cheng G, Sun X, Li S, Tian H. The Metabolic Effects of Oats Intake in Patients with Type 2 Diabetes: A Systematic Review and Meta-Analysis. Nutrients. 2015; 7(12):10369-10387. https://doi.org/10.3390/nu7125536
Chicago/Turabian StyleHou, Qingtao, Yun Li, Ling Li, Gaiping Cheng, Xin Sun, Sheyu Li, and Haoming Tian. 2015. "The Metabolic Effects of Oats Intake in Patients with Type 2 Diabetes: A Systematic Review and Meta-Analysis" Nutrients 7, no. 12: 10369-10387. https://doi.org/10.3390/nu7125536