Short- and Long-Term Effects of Wholegrain Oat Intake on Weight Management and Glucolipid Metabolism in Overweight Type-2 Diabetics: A Randomized Control Trial


 ,
,
Abstract
:1. Introduction
2. Methods
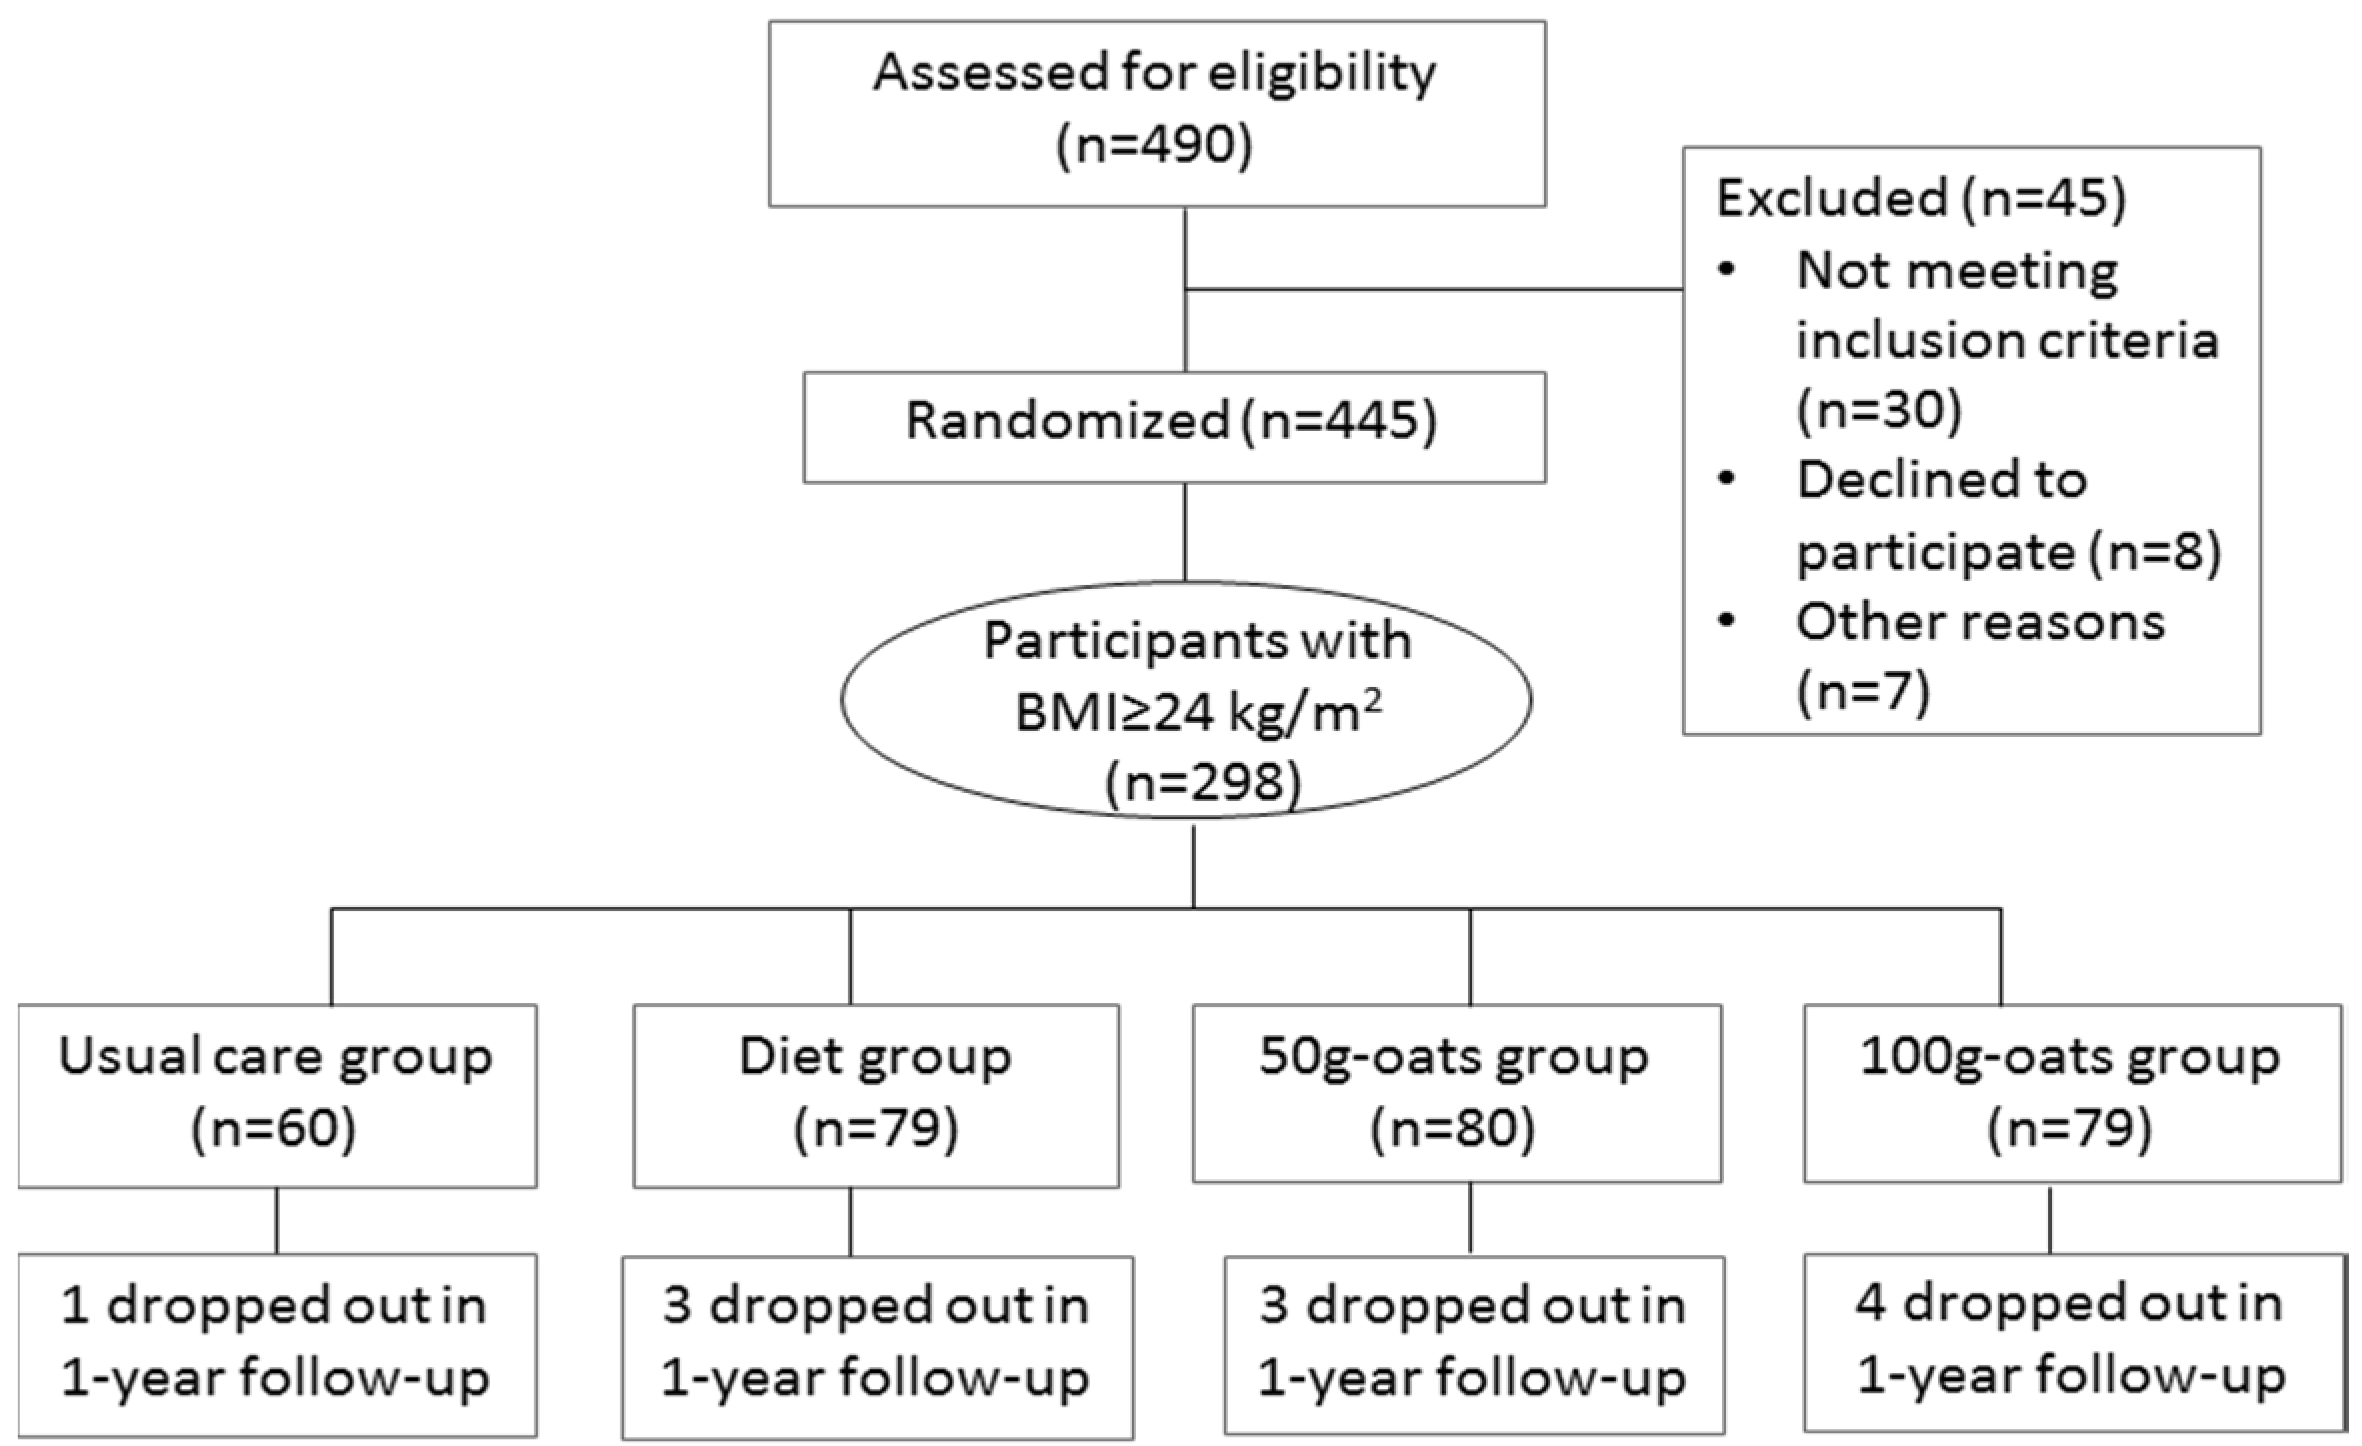
2.1. Participants
2.2. Ethics
2.3. Study Design
2.4. Wholegrain Oats
2.5. Outcome Measurement
2.6. Statistical Analyses
3. Results
4. Discussion
5. Conclusions
Supplementary Materials
Acknowledgments
Author Contributions
Conflicts of Interest
References
- Series, W.T. Obesity: Preventing and managing the global epidemic. Report of a WHO consultation. World Health Organ. Tech. Rep. Ser. 2000, 894, 1–253. [Google Scholar]
- NCD Risk Factor Collaboration. Effects of diabetes definition on global surveillance of diabetes prevalence and diagnosis: A pooled analysis of 96 population-based studies with 331,288 participants. Lancet Diabetes Endocrinol. 2015, 3, 624–637. [Google Scholar]
- Yaturu, S. Obesity and type 2 diabetes. J. Diabetes Mellit. 2011, 1, 79–95. [Google Scholar] [CrossRef]
- Mokdad, A.H.; Ford, E.S.; Bowman, B.A.; Nelson, D.E.; Engelgau, M.M.; Vinicor, F.; Marks, J.S. Diabetes trends in the U.S.: 1990–1998. Diabetes Care 2000, 23, 1278–1283. [Google Scholar] [CrossRef] [PubMed]
- American Diabetes Association. Standards of medical care in diabetes-2015 abridged for primary care providers. Clin. Diabetes 2015, 33, 97–111. [Google Scholar]
- American Diabetes Association. Evidence-based nutrition principles and recommendations for the treatment and prevention of diabetes and related complications. Diabetes Care 2002, 25, 202–212. [Google Scholar]
- Fung, T.T.; Hu, F.B.; Pereira, M.A.; Liu, S.; Stampfer, M.J.; Colditz, G.A.; Willett, W.C. Whole-grain intake and the risk of type 2 diabetes: A prospective study in men. Am. J. Clin. Nutr. 2002, 76, 535–540. [Google Scholar] [PubMed]
- Brennan, C.S.; Cleary, L.J. The potential use of cereal (1→3,1→4)-β-d-glucans as functional food ingredients. J. Cereal Sci. 2005, 42, 1–13. [Google Scholar] [CrossRef]
- Clemens, R.; van Klinken, B.J. Oats, more than just a whole grain: An introduction. Br. J. Nutr. 2014, 112 (Suppl. S2), S1–S3. [Google Scholar] [CrossRef] [PubMed]
- Whitehead, A.; Beck, E.J.; Tosh, S.; Wolever, T.M. Cholesterol-lowering effects of oat beta-glucan: A meta-analysis of randomized controlled trials. Am. J. Clin. Nutr. 2014, 100, 1413–1421. [Google Scholar] [CrossRef] [PubMed]
- Bao, L.; Cai, X.; Xu, M.; Li, Y. Effect of oat intake on glycaemic control and insulin sensitivity: A meta-analysis of randomised controlled trials. Br. J. Nutr. 2014, 112, 457–466. [Google Scholar] [CrossRef] [PubMed]
- Saltzman, E.; Das, S.K.; Lichtenstein, A.H.; Dallal, G.E.; Corrales, A.; Schaefer, E.J.; Greenberg, A.S.; Roberts, S.B. An oat-containing hypocaloric diet reduces systolic blood pressure and improves lipid profile beyond effects of weight loss in men and women. J. Nutr. 2001, 131, 1465–1470. [Google Scholar] [PubMed]
- Othman, R.A.; Moghadasian, M.H.; Jones, P.J. Cholesterol-lowering effects of oat beta-glucan. Nutr. Rev. 2011, 69, 299–309. [Google Scholar] [CrossRef] [PubMed]
- Shen, X.L.; Zhao, T.; Zhou, Y.; Shi, X.; Zou, Y.; Zhao, G. Effect of oat beta-glucan intake on glycaemic control and insulin sensitivity of diabetic patients: A meta-analysis of randomized controlled trials. Nutrients 2016, 8, 39. [Google Scholar] [CrossRef] [PubMed]
- Institute of Nutrition and Food Safety. China CDC 2005 China Food Composition; Peking University Medical Press: Beijing, China, 2005. [Google Scholar]
- Chinese Nutrition Society. Dietary Guidelines for Chinese Residents; Tibet People’s Publishing House: Lhasa, China, 2010. [Google Scholar]
- Chinese Diabetes Society. China Medical Nutrition Therapy Guideline for Diabetes. Available online: http://www.cdschina.org/news_show.jsp?id=509.html (accessed on 16 October 2012).
- Sun, Z. Process for Dehulling Oats without Removing Plumules. CN101264459 17 September 2008. [Google Scholar]
- Hlebowicz, J. Postprandial blood glucose response in relation to gastric emptying and satiety in healthy subjects. Appetite 2009, 53, 249–252. [Google Scholar] [CrossRef] [PubMed]
- Wang, Q.; Ellis, P.R. Oat beta-glucan: Physico-chemical characteristics in relation to its blood-glucose and cholesterol-lowering properties. Br. J. Nutr. 2014, 112 (Suppl. S2), S4–S13. [Google Scholar] [CrossRef] [PubMed]
- Pick, M.E.; Hawrysh, Z.J.; Gee, M.I.; Toth, E.; Garg, M.L.; Hardin, R.T. Oat bran concentrate bread products improve long-term control of diabetes: A pilot study. J. Am. Diet. Assoc. 1996, 96, 1254–1261. [Google Scholar] [CrossRef]
- Shen, R.L.; Cai, F.L.; Dong, J.L.; Hu, X.Z. Hypoglycemic effects and biochemical mechanisms of oat products on streptozotocin-induced diabetic mice. J. Agric. Food Chem. 2011, 59, 8895–8900. [Google Scholar] [CrossRef] [PubMed]
- Schuster, J.; Beninca, G.; Vitorazzi, R.; Morelo Dal Bosco, S. Effects of oats on lipid profile, insulin resistance and weight loss. Nutr. Hosp. 2015, 32, 2111–2116. [Google Scholar] [PubMed]
- Qatanani, M.; Lazar, M.A. Mechanisms of obesity-associated insulin resistance: Many choices on the menu. Genes Dev. 2007, 21, 1443–1455. [Google Scholar] [CrossRef] [PubMed]
- Charlton, K.E.; Tapsell, L.C.; Batterham, M.J.; O’Shea, J.; Thorne, R.; Beck, E.; Tosh, S.M. Effect of 6 weeks’ consumption of beta-glucan-rich oat products on cholesterol levels in mildly hypercholesterolaemic overweight adults. Br. J. Nutr. 2012, 107, 1037–1047. [Google Scholar] [CrossRef] [PubMed]
- Ma, X.; Gu, J.; Zhang, Z.; Jing, L.; Xu, M.; Dai, X.; Jiang, Y.; Li, Y.; Bao, L.; Cai, X.; et al. Effects of avena nuda l. On metabolic control and cardiovascular disease risk among Chinese patients with diabetes and meeting metabolic syndrome criteria: Secondary analysis of a randomized clinical trial. Eur. J. Clin. Nutr. 2013, 67, 1291–1297. [Google Scholar] [CrossRef] [PubMed]
- Torronen, R.; Kansanen, L.; Uusitupa, M.; Hanninen, O.; Myllymaki, O.; Harkonen, H.; Malkki, Y. Effects of an oat bran concentrate on serum lipids in free-living men with mild to moderate hypercholesterolaemia. Eur. J. Clin. Nutr. 1992, 46, 621–627. [Google Scholar] [PubMed]
- Kerckhoffs, D.A.; Hornstra, G.; Mensink, R.P. Cholesterol-lowering effect of beta-glucan from oat bran in mildly hypercholesterolemic subjects may decrease when beta-glucan is incorporated into bread and cookies. Am. J. Clin. Nutr. 2003, 78, 221–227. [Google Scholar] [PubMed]
- Lyly, M.; Liukkonen, K.H.; Salmenkallio-Marttila, M.; Karhunen, L.; Poutanen, K.; Lahteenmaki, L. Fibre in beverages can enhance perceived satiety. Eur. J. Nutr. 2009, 48, 251–258. [Google Scholar] [CrossRef] [PubMed]
- Rose, D.J. Impact of whole grains on the gut microbiota: The next frontier for oats? Br. J. Nutr. 2014, 112 (Suppl. S2), S44–S49. [Google Scholar] [CrossRef] [PubMed]
- Viscidi, K.A.; Dougherty, M.P.; Briggs, J.; Camire, M.E. Complex phenolic compounds reduce lipid oxidation in extruded oat cereals. Food Sci. Technol. 2004, 37, 789–796. [Google Scholar] [CrossRef]
- El Khoury, D.; Cuda, C.; Luhovyy, B.L.; Anderson, G.H. Beta glucan: Health benefits in obesity and metabolic syndrome. J. Nutr. Metab. 2012, 2012, 851362. [Google Scholar] [CrossRef] [PubMed]
- Den Besten, G.; van Eunen, K.; Groen, A.K.; Venema, K.; Reijngoud, D.J.; Bakker, B.M. The role of short-chain fatty acids in the interplay between diet, gut microbiota, and host energy metabolism. J. Lipid Res. 2013, 54, 2325–2340. [Google Scholar] [CrossRef] [PubMed]
- Ross, A.B.; Pere-Trepat, E.; Montoliu, I.; Martin, F.P.; Collino, S.; Moco, S.; Godin, J.P.; Cleroux, M.; Guy, P.A.; Breton, I.; et al. A whole-grain-rich diet reduces urinary excretion of markers of protein catabolism and gut microbiota metabolism in healthy men after one week. J. Nutr. 2013, 143, 766–773. [Google Scholar] [CrossRef] [PubMed]
- Martinez, I.; Lattimer, J.M.; Hubach, K.L.; Case, J.A.; Yang, J.; Weber, C.G.; Louk, J.A.; Rose, D.J.; Kyureghian, G.; Peterson, D.A.; et al. Gut microbiome composition is linked to whole grain-induced immunological improvements. ISME J. 2013, 7, 269–280. [Google Scholar] [CrossRef] [PubMed]
- De Vos, W.M.; de Vos, E.A. Role of the intestinal microbiome in health and disease: From correlation to causation. Nutr. Rev. 2012, 70 (Suppl. S1), S45–S56. [Google Scholar] [CrossRef] [PubMed]


| Dietary Components | Usual Care Group | Treatment Diet | ||
|---|---|---|---|---|
| Healthy Diet Group | 50 g-oats Group | 100 g-oats Group | ||
| Energy (kcal) * | 2441 (478) | 2279 (196) | 2281 (185) | 2233 (204) |
| Carbohydrate (% of total energy) | 50 | 60 | 59 | 58 |
| Fat (% of total energy) | 31 | 22 | 23 | 23 |
| Protein (% of total energy) | 19 | 18 | 18 | 19 |
| Total fiber (g) * | 22.1 (4.0) | 33.0 (5.8) | 36.1 (4.2) | 39.0 (4.8) |
| Oat β-glucan (g) | 0 | 0 | 2.65 | 5.30 |
| Variables | Usual Care Group (n = 60) | Healthy Diet Group (n = 79) | 50 g-oats Group (n = 80) | 100 g-oats Group (n = 79) | p-Value |
|---|---|---|---|---|---|
| Male/female | 39/21 | 42/37 | 41/39 | 33/46 | 0.059 |
| Age (years) | 59.00 (3.94) | 59.73 (6.53) | 59.72 (6.10) | 59.44 (6.78) | 0.886 |
| Mild drinking | 15 (25.0%) | 20 (25.3%) | 17 (21.3%) | 16 (20.3%) | 0.838 |
| Mild smoking | 14 (23.3%) | 16 (20.3%) | 14 (17.5%) | 11 (13.9%) | 0.523 |
| Physical activity level | - | - | - | - | 0.541 |
| Low | 13 (21.7%) | 18 (22.8%) | 17 (21.2%) | 22 (27.8%) | - |
| Moderate | 30 (50.0%) | 42 (53.1%) | 45 (56.3%) | 46 (58.2%) | - |
| High | 17 (28.3%) | 19 (24.1%) | 18 (22.5%) | 11 (13.9%) | - |
| Education level | - | - | - | - | 0.473 |
| Less than primary school | 9 (15.0%) | 9 (11.4%) | 15 (18.8%) | 8 (10.1%) | - |
| Middle and high school | 39 (65.0%) | 56 (70.9%) | 47 (58.8%) | 49 (62.0%) | - |
| College or more | 12 (20.0%) | 14 (17.7%) | 18 (22.5%) | 22 (27.8%) | - |
| Duration of diabetes (month) | 79.00 (36.52) | 74.87 (61.92) | 100.08 (75.73) | 94.71 (76.63) | 0.060 |
| Family history of diabetes | 19 (31.7%) | 24 (30.4%) | 36 (45.0%) | 38 (48.1%) | 0.051 |
| Diabetic medications | - | - | - | - | 0.999 |
| No diabetic medication | 5 (8.3%) | 7 (8.9%) | 6 (7.5%) | 6 (7.6%) | - |
| Oral diabetic medication | 32 (53.3%) | 45 (57.0%) | 43 (53.8%) | 47 (59.5%) | - |
| Insulin injection | 12 (20.0%) | 14 (17.7%) | 16 (20.0%) | 12 (15.2%) | - |
| Combined treatment | 11 (18.3%) | 13 (16.4%) | 15 (18.7%) | 14(17.7%) | - |
| Systolic blood pressure (mmHg) | 143.71 (15.83) | 147.23 (21.31) | 144.90 (19.18) | 147.19 (17.68) | 0.613 |
| Diastolic blood pressure (mmHg) | 84.43 (16.05) | 84.63 (11.78) | 82.93 (9.39) | 83.10 (10.20) | 0.737 |
| Variables | Usual Care Group (n = 60) | Healthy Diet Group (n = 79) | 50 g-oats Group (n = 80) | 100 g-oats Group (n = 79) | p-Value |
|---|---|---|---|---|---|
| Weight (kg) | |||||
| Baseline | 71.54 (5.82) | 73.77 (8.58) | 72.60 (8.67) | 74.44 (7.63) | 0.141 |
| 30-day intervention | 71.45 (6.00) | 72.59 (7.94) | 71.74 (8.50) | 72.70 (7.21) | - |
| Adjusted changes | −0.18 (−1.39, 1.02) | −1.20 (−2.22, −0.19) | −1.67(−2.69, −0.65) | −1.74 (−2.76, −0.71) | 0.178 |
| MD (vs. usual care group) | - | −1.02 (−2.56, 0.52) | −1.49 (−3.03, 0.05) | −1.56 (−3.14, 0.02) | - |
| MD (vs. diet group) | - | - | −0.47 (−1.89, 0.96) | −0.54 (−1.97, 0.89) | - |
| BMI (kg/m2) | |||||
| Baseline | 25.17 (0.89) | 27.19 (2.82) | 26.91 (2.69) | 27.39 (2.42) | 0.000 |
| 30-day intervention | 25.14 (0.94) | 26.77 (2.66) | 26.28 (3.86) | 26.77 (2.33) | - |
| Adjusted changes | −0.08 (−0.49, 0.33) | −0.43 (−0.78, −0.08) | −0.60(−0.95, −0.25) | −0.63 (−0.98, −0.28) | 0.160 |
| MD (vs. usual care group) | - | −0.35 (−0.88, 0.18) | −0.52 (−1.05, 0.01) | −0.55 (−1.10, 0.00) | - |
| MD (vs. diet group) | - | - | −0.17 (−0.66, 0.32) | −0.20 (−0.69, 0.29) | - |
| Waist circumference (cm) | |||||
| Baseline | 92.69 (7.94) | 94.81 (7.01) | 93.38 (6.79) | 94.86 (7.65) | 0.210 |
| 30-day intervention | 91.92 (8.22) | 92.02 (8.63) | 91.08 (3.98) | 92.07 (7.27) | - |
| Adjusted changes | −0.78 (−2.92, 1.36) | −2.79 (−3.85, −1.73) | −2.32 (−3.37, −1.27) | −2.77 (−3.83, −1.70) | 0.028 |
| MD (vs. usual care group) | - | −2.01 (−3.54, −0.48) | −1.54 (−3.08, 0.00) | −1.99 (−3.48, −0.50) | - |
| MD (vs. diet group) | - | - | 0.47 (−1.01, 1.95) | 0.02 (−1.47, 1.50) | - |
| Waist-to-hip ratio(WHR) | |||||
| Baseline | 0.91 (0.05) | 0.92 (0.05) | 0.91 (0.05) | 0.92 (0.05) | 0.398 |
| 30-day intervention | 0.90 (0.05) | 0.91(0.07) | 0.90 (0.05) | 0.90 (0.05) | - |
| Adjusted changes | −0.01(−0.02, 0.01) | −0.01 (−0.02, 0.01) | −0.01 (−0.02, 0.01) | −0.02 (−0.03, −0.01) | 0.259 |
| MD (vs. usual care group) | - | 0.00 (−0.02, 0.02) | 0.00 (−0.02, 0.02) | −0.01 (−0.03, 0.01) | - |
| MD (vs. diet group) | - | - | 0.00 (−0.02, 0.02) | 0.00 (−0.02, 0.02) | - |
| Body fat percent (%) | |||||
| Baseline | 32.46 (5.49) | 31.58 (6.11) | 31.54 (5.87) | 33.31 (5.12) | 0.162 |
| 30-day intervention | 32.21 (5.88) | 31.05 (6.23) | 31.37 (5.75) | 32.78 (5.34) | - |
| Adjusted changes | −0.25 (−1.09, 0.59) | −0.59 (−1.20, 0.02) | −0.52 (−1.12, 0.08) | −0.52 (−1.13, 0.08) | 0.878 |
| MD (vs. usual care group) | - | −0.34 (−1.06, 0.36) | −0.27 (−0.85, 0.31) | −0.27 (−0.81, 0.26) | - |
| MD (vs. diet group) | - | - | 0.07 (−0.51, 0.65) | 0.07 (−0.51, 0.65) | - |
| Visceral fat index (VFI) | |||||
| Baseline | 12.37 (3.64) | 12.38 (3.86) | 12.53 (4.14) | 12.33 (3.59) | 0.988 |
| 30-day intervention | 12.13 (3.77) | 12.13 (3.53) | 12.06 (4.42) | 11.87 (3.47) | - |
| Adjusted changes | −0.25 (−0.55, 0.05) | −0.27 (−0.62, 0.07) | −0.48 (−0.69, −0.27) | −0.44 (−0.78, −0.10) | 0.380 |
| MD (vs. usual care group) | - | −0.02 (−0.44, 0.40) | −0.24 (−0.74, 0.26) | −0.19 (−0.73, 0.35) | - |
| MD (vs. diet group) | - | - | −0.22 (−0.70, 0.27) | −0.17 (−0.64, 0.31) | - |
| Fasting plasma glucose (mmol/L) | |||||
| Baseline | 9.38 (2.81) | 9.52 (2.87) | 9.87 (2.83) | 9.70 (3.30) | 0.719 |
| 30-day intervention | 9.40 (0.75) | 8.16 (2.53) | 8.67 (2.49) | 8.03 (2.56) | - |
| Adjusted changes | −0.20 (−0.91, 0.52) | −1.27 (−1.88, −0.67) | −1.23 (−1.84, −0.62) | −1.70 (−2.31, −1.10) | 0.002 |
| MD (vs. usual care group) | - | −1.07 (−1.99, −0.15) | −1.03 (−1.94, −0.11) | −1.50 (−2.42, −0.58) | - |
| MD (vs. diet group) | - | - | 0.04 (−0.81, 0.89) | −0.43 (−1.28, 0.42) | - |
| 2-h postprandial plasma glucose (mmol/L) | |||||
| Baseline | 19.10 (3.22) | 17.58 (4.87) | 18.23 (4.84) | 17.89 (5.45) | 0.284 |
| 30-day intervention | 18.66 (3.07) | 15.42 (4.31) | 14.97 (4.10) | 14.08 (4.62) | - |
| Adjusted changes | −0.53 (−1.45, 0.39) | −2.14 (−2.92, −1.36) | −3.18 (−3.95, −2.41) | −3.62 (−4.39., −2.84) | 0.001 |
| MD (vs. usual care group) | - | −1.61 (−2.79, −0.43) | −2.65 (−3.82, −1.47) | −3.09 (−4.27, −1.91) | - |
| MD (vs. diet group) | - | - | −1.04 (−2.03, −0.05) | −1.48 (−2.57, −0.39) | - |
| HbA1c (%) | |||||
| Baseline | 8.05 (1.52) | 8.10 (1.77) | 8.37 (1.44) | 8.28 (1.35) | 0.463 |
| 30-day intervention | 8.07 (1.52) | 7.88 (1.82) | 7.71 (1.94) | 7.65 (1.93) | - |
| Adjusted changes | 0.10 (−0.34, 0.54) | −0.61 (−0.98, −0.24) | −0.76 (−1.13, −0.39) | −0.71 (−1.09, −0.34) | 0.001 |
| MD (vs. usual care group) | - | −0.71 (−1.29, −0.13) | −0.86 (−1.43, −0.29) | −0.81 (−1.37, −0.24) | - |
| MD (vs. diet group) | - | - | −0.14 (−0.67, 0.39) | −0.10 (−0.63, 0.43) | - |
| HOMA-IR (mU·mol/L2) | |||||
| Baseline | 5.49 (4.99) | 5.48 (5.40) | 4.68 (3.78) | 6.20 (5.78) | 0.312 |
| 30-day intervention | 5.31 (3.16) | 4.50 (4.89) | 3.41 (3.23) | 3.76 (4.75) | - |
| Adjusted changes | −0.25 (−2.66, 2.16) | −0.89 (−3.52, 1.74) | −1.80 (−3.48, −0.12) | −2.65 (−4.72, −0.58) | 0.010 |
| MD (vs. usual care group) | - | −0.64 (−2.40, 1.12) | −1.55 (−3.30, 0.20) | −2.41 (−4.59, −0.23) | - |
| MD (vs. diet group) | - | - | −0.91 (−1.93, 0.11) | −1.77 (−3.49, −0.05) | - |
| TC (total cholesterol) (mmol/L) | |||||
| Baseline | 5.84 (1.83) | 4.98 (0.86) | 5.04 (0.98) | 5.24 (1.03) | 0.000 |
| 30-day intervention | 5.82 (1.88) | 4.81 (0.87) | 4.66 (0.87) | 4.72 (0.85) | - |
| Adjusted changes | −0.07 (−0.26, 0.12) | −0.18 (−0.34, −0.02) | −0.42 (−0.59, −0.26) | −0.51 (−0.67, −0.35) | 0.000 |
| MD (vs. usual care group) | - | −0.11 (−0.35, 0.14) | −0.35 (−0.60, −0.10) | −0.44 (−0.69, −0.19) | |
| MD (vs. diet group) | - | - | −0.24 (−0.47, −0.01) | −0.33 (−0.56, −0.10) | - |
| TG (total triglycerides) (mmol/L) | |||||
| Baseline | 1.92 (0.94) | 1.83 (0.88) | 2.06 (1.06) | 1.98 (1.00) | 0.510 |
| 30-day intervention | 1.95 (1.02) | 1.57 (0.84) | 1.98 (1.65) | 1.56 (0.77) | - |
| Adjusted changes | 0.01 (−0.25, 0.27) | −0.25 (−0.47, −0.03) | −0.09 (−0.31, 0.13) | −0.43 (−0.65, −0.21) | 0.003 |
| MD (vs. usual care group) | - | −0.26 (−0.60, 0.08) | −0.10 (−0.43, 0.23) | −0.44 (−0.78, −0.10) | - |
| MD (vs. diet group) | - | - | 0.16 (−0.26, 0.58) | −0.17 (−0.59, 0.26) | - |
| LDL-c (low-density lipoprotein cholesterol) (mmol/L) | |||||
| Baseline | 3.20 (1.05) | 2.96 (0.71) | 2.90 (0.77) | 3.15 (0.85) | 0.128 |
| 30-day intervention | 3.18 (1.05) | 2.85 (0.74) | 2.70 (0.70) | 2.79 (0.63) | - |
| Adjusted changes | −0.06 (−0.21, 0.10) | −0.12 (−0.25, 0.01) | −0.23 (−0.36, −0.10) | −0.34 (−0.47, −0.21) | 0.001 |
| MD (vs. usual care group) | - | −0.06 (−0.26, 0.14) | −0.17 (−0.37, 0.02) | −0.28 (−0.48, −0.08) | - |
| MD (vs. diet group) | - | - | −0.10 (−0.28, 0.08) | −0.22 (−0.41, −0.03) | - |
| HDL-c (high-density lipoprotein cholesterol) (mmol/L) | |||||
| Baseline | 1.41 (0.45) | 1.30 (0.24) | 1.25 (0.21) | 1.36 (0.36) | 0.022 |
| 30-day intervention | 1.39 (0.42) | 1.22 (0.24) | 1.20 (0.22) | 1.28 (0.26) | - |
| Adjusted changes | −0.02 (−0.07, 0.04) | −0.08 (−0.19, 0.03) | −0.07 (−0.11, −0.02) | −0.08 (−0.13, −0.03) | 0.635 |
| MD (vs. usual care group) | - | −0.06 (−0.14, 0.01) | −0.05 (−0.12, 0.02) | −0.06 (−0.14, 0.02) | - |
| MD (vs. diet group) | - | - | 0.01 (−0.05, 0.07) | 0.00 (−0.07, 0.07) | - |
| Variables | Usual Care Group (n = 59) | Healthy Diet Group (n = 76) | 50 g-oats Group (n = 77) | 100 g-oats Group (n = 75) | p-Value |
|---|---|---|---|---|---|
| Weight (kg) | |||||
| Baseline | 71.54 (5.82) | 73.77 (8.58) | 72.60 (8.67) | 74.44 (7.63) | 0.141 |
| 1-year follow-up | 71.47 (7.35) | 72.76 (8.70) | 71.39 (8.68) | 72.43 (7.58) | - |
| Adjusted changes | −0.11 (−0.68, 0.46) | −1.08 (−2.31, 0.16) | −1.44 (−2.74, −0.15) | −1.97 (−3.06, −0.88) | 0.012 |
| MD (vs. usual care group) | - | −0.97 (−2.23, 0.29) | −1.33 (−2.69, 0.03) | −1.86 (−3.25, −0.47) | - |
| MD (vs. diet group) | - | - | −0.36 (−1.10, 0.38) | −0.89 (−1.56, −0.22) | - |
| BMI (kg/m2) | |||||
| Baseline | 25.17 (0.89) | 27.19 (2.82) | 26.91 (2.69) | 27.39 (2.42) | 0.000 |
| 1-year follow-up | 25.13 (1.25) | 26.80 (2.91) | 26.48 (2.33) | 26.64 (2.74) | - |
| Adjusted changes | −0.05 (−0.39, 0.29) | −0.37 (−0.74, 0.00) | −0.50 (−0.91, −0.09) | −0.73 (−1.08, −0.39) | 0.128 |
| MD (vs. usual care group) | - | −0.33 (−1.05, 0.39) | −0.45 (−1.19, 0.29) | −0.68 (−1.43, 0.07) | - |
| MD (vs. diet group) | - | - | −0.12 (−0.64, 0.40) | −0.33 (−0.83, 0.17) | - |
| Fasting plasma glucose (mmol/L) | |||||
| Baseline | 9.38 (2.81) | 9.52 (2.87) | 9.87 (2.83) | 9.70 (3.30) | 0.719 |
| 1-year follow-up | 9.52 (1.44) | 7.94 (2.14) | 8.19 (2.01) | 7.74 (2.43) | - |
| Adjusted changes | 0.08 (−0.63, 0.46) | −1.65 (−2.21, −1.10) | −1.62 (−2.17, −1.07) | −1.87 (−2.44, −1.31) | 0.000 |
| MD (vs. usual care group) | - | −1.57 (−2.36, −0.78) | −1.54 (−2.33, −0.75) | −1.79 (−2.58, −1.00) | - |
| MD (vs. diet group) | - | - | 0.03 (−0.76, 0.82) | −0.22 (−1.02, 0.58) | - |
| 2-h postprandial plasma glucose (mmol/L) | |||||
| Baseline | 19.10 (3.22) | 17.58 (4.87) | 18.23 (4.84) | 17.89 (5.45) | 0.284 |
| 1-year follow-up | 19.69 (3.27) | 15.01 (3.63) | 14.98 (3.02) | 14.22 (3.78) | - |
| Adjusted changes | 0.63 (−0.36, 1.63) | −2.41 (−3.40, −1.42) | −3.16 (−4.16, −2.16) | −3.58 (−4.63, −2.53) | 0.000 |
| MD (vs. usual care group) | - | −3.04 (−4.48, −1.60) | −3.79 (−5.22, −2.36) | −4.21 (−5.67, −2.75) | - |
| MD (vs. diet group) | - | - | −0.75 (−1.91, 0.41) | −1.17 (−2.27, −0.07) | - |
| HbA1c (%) | |||||
| Baseline | 8.05 (1.52) | 8.10 (1.77) | 8.37 (1.44) | 8.28 (1.35) | 0.463 |
| 1-year follow-up | 8.47 (1.86) | 7.63 (1.89) | 7.41 (1.18) | 7.27 (1.72) | - |
| Adjusted changes | 0.35 (−0.01, 0.71) | −0.42 (−0.79, −0.06) | −0.90 (−1.27, −0.54) | −1.06 (−1.44, −0.69) | 0.000 |
| MD (vs. usual care group) | - | −0.77 (−1.31, −0.23) | −1.25 (−1.79, −0.71) | −1.41 (−1.95, −0.87) | - |
| MD (vs. diet group) | - | −0.48 (−1.02, 0.06) | −0.64 (−1.19, −0.09) | - | |
| TC (mmol/L) | |||||
| Baseline | 5.84 (1.83) | 4.98 (0.86) | 5.04 (0.98) | 5.24 (1.03) | 0.000 |
| 1-year follow-up | 6.01 (1.87) | 4.8 (1.04) | 4.69 (0.95) | 4.76 (0.97) | - |
| Adjusted changes | 0.12 (0.07, 0.31) | −0.19 (−0.38, −0.01) | −0.37 (−0.56, −0.18) | −0.49 (−0.68, −0.29) | 0.000 |
| MD (vs. usual care group) | - | −0.31 (−0.62, 0.00) | −0.49 (−0.75, −0.23) | −0.61 (−0.88, −0.34) | - |
| MD (vs. diet group) | - | - | −0.18 (−0.45, 0.09) | −0.30 (−0.57, −0.03) | - |
| TG (mmol/L) | |||||
| Baseline | 1.92 (0.94) | 1.83 (0.88) | 2.06 (1.06) | 1.98 (1.00) | 0.510 |
| 1-year follow-up | 2.13 (1.41) | 2.00 (1.91) | 1.83 (1.19) | 1.55 (0.97) | - |
| Adjusted changes | 0.21 (−0.08, 0.50) | 0.17 (−0.12, 0.46) | −0.27 (−0.56, 0.02) | −0.45 (−0.75, −0.16) | 0.005 |
| MD (vs. usual care group) | - | −0.04 (−0.45, 0.38) | −0.46 (−0.87, −0.05) | −0.66 (−1.07, −0.25) | - |
| MD (vs. diet group) | - | - | −0.42 (−0.83, −0.01) | −0.70 (−1.11, −0.29) | - |
| LDL-c (mmol/L) | |||||
| Baseline | 3.20 (1.05) | 2.96 (0.71) | 2.90 (0.77) | 3.15 (0.85) | 0.128 |
| 1-year follow-up | 3.35 (0.99) | 2.84 (0.88) | 2.50 (0.79) | 2.64 (0.75) | - |
| Adjusted changes | 0.16 (−0.01, 0.33) | −0.14 (−0.30, 0.01) | −0.41 (−0.56, −0.26) | −0.51 (−0.67, −0.35) | 0.000 |
| MD (vs. usual care group) | - | −0.30 (−0.51, −0.09) | −0.57 (−0.78, −0.36) | −0.67 (−0.89, −0.45) | - |
| MD (vs. diet group) | - | - | −0.27 (−0.49, −0.05) | −0.37 (−0.59, −0.15) | - |
| HDL-c (mmol/L) | |||||
| Baseline | 1.41 (0.45) | 1.30 (0.24) | 1.25 (0.21) | 1.36 (0.36) | 0.022 |
| 1-year follow-up | 1.39 (0.34) | 1.34 (0.57) | 1.29 (0.40) | 1.39 (0.41) | - |
| Adjusted changes | −0.02 (−0.11, 0.07) | 0.06 (−0.15, 0.03) | 0.06 (−0.03, 0.15) | 0.01 (−0.09, 0.10) | 0.636 |
| MD (vs. usual care group) | - | 0.08 (−0.09, 0.26) | 0.09 (−0.08, 0.26) | 0.03 (−0.15, 0.21) | - |
| MD (vs. diet group) | - | - | 0.00 (−0.17, 0.18) | −0.05 (−0.23, 0.12) | - |
© 2016 by the authors; licensee MDPI, Basel, Switzerland. This article is an open access article distributed under the terms and conditions of the Creative Commons Attribution (CC-BY) license (http://creativecommons.org/licenses/by/4.0/).
Share and Cite
Li, X.; Cai, X.; Ma, X.; Jing, L.; Gu, J.; Bao, L.; Li, J.; Xu, M.; Zhang, Z.; Li, Y. Short- and Long-Term Effects of Wholegrain Oat Intake on Weight Management and Glucolipid Metabolism in Overweight Type-2 Diabetics: A Randomized Control Trial. Nutrients 2016, 8, 549. https://doi.org/10.3390/nu8090549
Li X, Cai X, Ma X, Jing L, Gu J, Bao L, Li J, Xu M, Zhang Z, Li Y. Short- and Long-Term Effects of Wholegrain Oat Intake on Weight Management and Glucolipid Metabolism in Overweight Type-2 Diabetics: A Randomized Control Trial. Nutrients. 2016; 8(9):549. https://doi.org/10.3390/nu8090549
Chicago/Turabian StyleLi, Xue, Xiaxia Cai, Xiaotao Ma, Lulu Jing, Jiaojiao Gu, Lei Bao, Jun Li, Meihong Xu, Zhaofeng Zhang, and Yong Li. 2016. "Short- and Long-Term Effects of Wholegrain Oat Intake on Weight Management and Glucolipid Metabolism in Overweight Type-2 Diabetics: A Randomized Control Trial" Nutrients 8, no. 9: 549. https://doi.org/10.3390/nu8090549