Article

Reported Dietary Intake, Disparity between the Reported Consumption and the Level Needed for Adequacy and Food Sources of Calcium, Phosphorus, Magnesium and Vitamin D in the Spanish Population: Findings from the ANIBES Study †

by
Josune Olza
1,2,3,
Javier Aranceta-Bartrina
3,4,
Marcela González-Gross
3,5,
Rosa M. Ortega
6,
Lluis Serra-Majem
3,7,
Gregorio Varela-Moreiras
8,9 and
Ángel Gil
1,2,3,*
1
Department of Biochemistry and Molecular Biology II, Institute of Nutrition and Food Sciences, University of Granada, Campus de la Salud, Avda. del Conocimiento, Armilla, 18100 Granada, Spain
2
Instituto de Investigación Biosanitaria ibs.GRANADA, 18012 Granada, Spain
3
CIBEROBN, Biomedical Research Networking Center for Physiopathology of Obesity and Nutrition, Carlos III Health Institute, 28029 Madrid, Spain
4
Department of Preventive Medicine and Public Health, University of Navarra, c/Irunlarrea 1, 31008 Pamplona, Spain
5
ImFINE Research Group, Department of Health and Human Performance, Technical University of Madrid, c/Martín Fierro 7, 28040 Madrid, Spain
6
Department of Nutrition, Faculty of Pharmacy, Madrid Complutense University, Plaza Ramón y Cajal s/n, 28040 Madrid, Spain
7
Research Institute of Biomedical and Health Sciences, University of Las Palmas de Gran Canaria, Faculty of Health Science, c/Doctor Pasteur s/n Trasera del Hospital, Las Palmas de Gran Canaria, 35016 Las Palmas, Spain
8
Spanish Nutrition Foundation (FEN), 28010 Madrid, Spain
9
Department of Pharmaceutical and Health Sciences, Faculty of Pharmacy, CEU San Pablo University, Urb. Montepríncipe, Crta. Boadilla Km 53, Boadilla del Monte, 28668 Madrid, Spain
*
Author to whom correspondence should be addressed.
Nutrients 2017, 9(2), 168; https://doi.org/10.3390/nu9020168
Submission received: 22 December 2016 / Revised: 7 February 2017 / Accepted: 16 February 2017 / Published: 21 February 2017

Abstract

:
Calcium, phosphorus, magnesium and vitamin D have important biological roles in the body, especially in bone metabolism. We aimed to study the reported intake, the disparity between the reported consumption and the level needed for adequacy and food sources of these four nutrients in the Spanish population. We assessed the reported intake for both, general population and plausible reporters. Results were extracted from the ANIBES survey, n = 2009. Three-day dietary reported intake data were obtained and misreporting was assessed according to the European Food Safety Authority (EFSA). Mean ± SEM (range) total reported consumption of calcium, phosphorus, magnesium, and vitamin D for the whole population were 698 ± 7 mg/day (71–2551 mg/day), 1176 ± 8 mg/day, (331–4429 mg/day), 222 ± 2 mg/day (73–782 mg/day), and 4.4 ± 0.1 µg/day (0.0–74.2 µg/day), respectively. In the whole group, 76% and 66%; 79% and 72%; and 94% and 93% of the population had reported intakes below 80% of the national and European recommended daily intakes for calcium, magnesium and vitamin D, respectively; these percentages were over 40% when the plausible reporters were analysed separately. The main food sources were milk and dairy products for calcium and phosphorus, cereals and grains for magnesium and fish for vitamin D. In conclusion, there is an important percentage of the Spanish ANIBES population not meeting the recommended intakes for calcium, magnesium and vitamin D.

1. Introduction

The decline of essential nutrients deficiencies over the past century along with the improvement in the treatment of infectious diseases has contributed to the increase in population life expectancy [1]. However, in recent years, rates of nutrition-related chronic diseases, such as obesity, cardiovascular diseases and type 2 diabetes mellitus (T2DM) have increased, dwindling the quality of life of the population [1,2,3].
Studying the nutritional situation of the population as well as lifestyle habits is fundamental to design national guidelines and public policies. Calcium, phosphorus, magnesium and vitamin D participate mainly in bone development and maintenance, but they also have other relevant biological roles [4,5]. Inadequate intake and low nutritional status of calcium, magnesium and vitamin D, are well documented in many populations worldwide [5,6,7]. Some studies have demonstrated that the consumption of low-fat milk and dairy products is inversely associated with the risk of hypertension [8,9]. Likewise, several studies have shown that a higher consumption of milk and dairy products rich in calcium is associated with lower incidence of T2DM [10,11,12,13]. Nevertheless, it is important to highlight that the diet is not the only factor that increases or decreases the risk of developing chronic diseases; there are other factors as the genetic background and lifestyle habits that also contribute to the risk and prevalence of these diseases.
Calcium is the main mineral involved in the structural integrity of the organism; in addition to its role in the formation and maintenance of bones and teeth, it is essential for many metabolic processes, specifically, as cell second messenger. Besides, it is necessary for the maintenance of the blood coagulation. Calcium has the highest requirements among all minerals [14]. Phosphorus is also found in the mineral structure of bones and teeth and in soft tissues where it participates mainly in phosphorylation processes and acid-base equilibrium. Its deficiency is not common as it is present in most foods and its absorption is relatively high [15]. Magnesium is the second most abundant intracellular cation, 70% of this mineral is in the skeleton and the rest in the cells. This mineral participates in more that 300 enzyme reactions and has similar functions as calcium, such as muscular contraction, gland secretions and nerve transmission, among others [16]. Magnesium absorption is approx. 50%, and in general population its deficiency is not uncommon, as its intake has diminished over the years [17].
Vitamin D, a fat-soluble vitamin, is the main regulator of serum calcium and phosphorus homoeostasis. It also participates in cell differentiation and proliferation and has effects on the immune and nervous system responses [18]. Its deficiency is prevalent worldwide, but proportions vary among world regions [19]. The main source of vitamin D is endogenous; that is to say, the daily exposure to the sun. Without vitamin D food fortification, the dietary intake of this vitamin is low [20].
National diet and nutritional survey is the most used tool to assess the diet, nutrient reported intake and nutritional reported status of the population. The data collected in the surveys are mostly based on subjects self-reporting. As this method is indirect and has a pseudo-quantitative nature, the surveys frequently report data that do not represent the habitual intake of the studied population and estimate energy intakes (EI) that are not plausible physiologically [21]. In this respect, EFSA has published a protocol that has a harmonised approach to identify misreporting [22]. As we do in the present article, EFSA suggests that the data should be reported for the whole population as well as divided into plausible and non-plausible reporters. Additionally, it is important to mention that in recent years there has been an open discussion about the validity of the use of Memory-Based Dietary Assessment Methods (M-BMs) to collect dietary intake data [23]. Some authors believe that the use of 24-h recall is inappropriate to calculate EI and that these data are inadmissible in scientific research and for the formulation of national dietary guidelines, while others refute these statements [23,24]. It is well known that currently there is not a gold standard method to collect nutritional intake data and there is a need for an accurate scientific methodology. In this respect, some modest improvements have been made in the development of more objective tools to measure EI as digital photography or chewing and swallowing monitors; however, more research is needed to develop other objective tools [25]. In the recent years, EFSA has published the “Guidance on the EU Menu methodology”, which is a guidance document developed to facilitate the collection of more harmonised food consumption data from all EU Member States [26] and the present study is based on these guidelines. An additional aspect to consider is that the estimation of usual micronutrients intake using complex sample derived data from few days dietary food records, introduce excessive intra-individual variation, and to overcome this problem different statistical procedures have been reported [27,28,29] and provide another approach to managing and analysing intake population data.
The ANIBES Spanish study aimed to evaluate energy reported intake, energy expenditure, body composition, dietary patterns and dietary quality indexes in a national representative sample of the Spanish population by using innovative methodological tools [30]. The present article analyses the disparity between the reported consumption and the level needed for adequacy of the main nutrients involved in bone metabolism (calcium, phosphorus, magnesium and vitamin D), considering the coefficients of within-person variations for different age groups, as well as the food and beverages that contribute to their sources of intake in the Spanish population. We assessed the reported intake for both, general population and plausible reporters.

2. Materials and Methods

The complete design, protocol, and methodology of the ANIBES study have previously been described in detail elsewhere [30,31].

2.1. Sample

The ANIBES study is a cross-sectional study conducted using multistage stratified sampling. The sample for the ANIBES Study was designed based on 2012 census data published by the INE (Instituto Nacional de Estadística/Spanish Bureau of Statistics) for Gender, Age, Habitat Size and Region [30]. The fieldwork was performed at 128 sampling points across Spain to guarantee better coverage and representativeness. The design of the ANIBES study aims to define a sample size that represents all individuals living in Spain, aged 9–75 years and residing in municipalities of at least 2000 inhabitants. The initial potential sample was 2634 individuals, and the final sample was 2009 individuals (2.23% error and 95.5% confidence interval). In addition, for the youngest (9–12, 13–17 and 18–24 years old) and oldest (65–75 years) age groups, a boost sample was considered in order to have at least a n = 200 per age group and increase the statistical power of the study (error +/−6.9%) [30]. The booster sample is the process of increasing the number of interviews for a particular subgroup within the population. This method allows achieving an adequate number of interviews to allow the analysis of population subgroups, without the expense of increasing the sample size for the whole survey. Therefore, the random sample plus booster sample comprised 2285 participants [32]. For all analyses, in this study, the entire population was used.
The ANIBES sample was comprised of 50.4% of males and 49.6% females. The sample quotas according to the following variables were: age groups (9–12, 13–17, 18–64 and 65–75 years); sex (men/women); geographical distribution (Northeast, East, Southwest, North-Central, Barcelona, Madrid, Balearic and Canary Islands); and locality size: 2000 to 30,000 inhabitants (rural population); 30,000 to 200,000 inhabitants (semi-urban population) and over 200,000 inhabitants (urban population). Additionally, other factors for sample adjustment were considered: unemployment rate, the percentage of foreigners (immigrant population), physical activity level and educational or economic level [32,33].
The fieldwork for the ANIBES study was conducted from mid-September 2013 to mid-November 2013, and two previous pilot studies were also performed. Subjects participated during two weekdays and one weekend day to equally represent all days of the week. The final protocol was approved by the Ethical Committee for Clinical Research of the Region of Madrid (Spain) [32,33].

2.2. Food Record and Adequacy of Reported Intake

Study participants were provided with a tablet device (Samsung Galaxy Tab 2 7.0, Samsung Electronics, Suwon, Korea). They were trained in recording information by taking photos of all food and drinks consumed during the three days of the study, both before beginning to eat and drink, and again after finishing, to record the intake and the leftovers. Additionally, a brief description of meals, recipes, brands and other information was registered using the tablet. Participants who declared or demonstrated that they were unable to use the tablet device were offered other options, such as using a digital camera and paper record and telephone interviews. In total 79% of the sample used a tablet, 12% a digital camera and 9% opted for a telephone interview. As no differences in the percentage of misreporting were found according to the type of device used to assess dietary intake, we used the measurements of the three assessment methods in the analysis. Food records were returned from the field in real time, to be coded by trained coders who were supervised by dieticians. An ad hoc central server software/database was developed for this purpose, to work in parallel with the coding and verification processes [30]. The ANIBES software received the information from the field tablets every two seconds and updated it every 30 min. The Central Server verifies the information at the individual level; food weight and intakes; food codification and the assigning weight in grammes. Finally, 189,600 inputs (ingredients) were managed from the 2009 participants, about 73 items per participant, and 24.3 food/beverages items per person/day as mean [30].
Coders attempted to match each food or drink item recorded on the tablet device with a food/portion code. For composite items, which could be split into their parts, an individual component was assigned. If an item had been recorded and there was no suitable code, or there was an insufficient detail to code the food, the entry was flagged as a query. Each food code was linked to appropriate portion size descriptors, which were then linked to the correct weight for that descriptor. If the portion size was described as weight, the weight was entered directly into the system. Where the coder could not resolve the food or portion consumed, the entry was flagged as a query for action by a researcher who had greater nutrition knowledge and experience. The dieticians-nutritionists checked and solved all the queries raised by the coders. Where portion sizes were missing, an estimate was made using the same weight if the food was consumed on another dietary day, or a portion size consistent with the participant’s frequent consumption (e.g., small, medium or large), or an age-appropriate average portion. For new products not included in the software, the nutritional information was obtained and introduced in the software. If a new food code was required, the nutrient content was entered into the database. In the case of school meals, school caterers’ information about the nutrient content and portion size of dishes were considered [30].
The quality control of the collected information was supervised by trained dieticians-nutritionists, following the protocol:
1
The same dietician-nutritionist was responsible for checking the food records included by the participant during the three-day dietary food record study.
2
The initial quality control was based on the photographs and descriptions sent by the participants, but also in the brief description that was asked before/after each meal and/or intake. Particular care was given to validate some variables such as ingredients, brands of the processed and ready-to-eat foods, portion size or culinary technique to obtain accurate information for further codification.
3
The final approval of the received information was given by a dietician-nutritionist and supervisor.
It is also of importance that the software used had an alarm system when no records from any of the different three main meals were available. At the start of the coding process, dieticians-nutritionists worked together with the coders checking the information and giving them individual feedback on their work. Where errors were found, they were corrected. All of the entries flagged as a query by the coders were categorised into different query types, such as food code or portion code not available in the used software, recipes, missing or insufficient detail to code food or portion. Final quality checking was performed using each participant’s mean energy and nutrient reported intake over the food and beverages diary record period (three days). Extreme intakes were considered from the mean, and all entries in this region were checked against the diary [30].
Food, beverage and energy and nutrient reported intakes were calculated from food reported consumption records using VD-FEN 2.1 software, a Dietary Evaluation Program from the Spanish Nutrition Foundation (FEN). The program was newly developed for the ANIBES study by the FEN and is based mainly on Spanish food composition tables [34]. Data obtained from food manufacturers and nutritional information provided on food labels were also included. A food photographic atlas was used to assist in assigning gramme weights to portion sizes. Micronutrients reference intakes for Spain [35] and Europe (EFSA) [36] were used to compare the actual reported intake with those recommended. The disparity between reported consumption and the level needed for adequacy was calculated comparing with 80% of the Spanish dietary reference value (DRV) and EFSA population reference intake (PRI) or adequate intake (AI).

2.3. Evaluation of Misreporting

As mentioned in the introduction section, it is well known that when the data of a nutrition survey are self-collected, people tend to underreport the consumption of food and beverages; and although over-reporting is also observed, the proportion is lower. In the present article, the EFSA recommendations to calculate misreporting was followed; the protocol proposed by EFSA is based mainly on the Goldberg [37] and Black [38,39] work. This method evaluates the reported EI (EIrep) against the presumed energy requirements. EIrep is expressed as a multiple of the mean basal metabolic rate estimated (BMRest) (from formulas), and it is compared with the presumed energy expenditure of the studied population. Then the ratio EIrep:BMRest is referred to as the physical activity levels (PAL) [22]. The PAL is established for young (≤17 years) and adults (≥18 years) in three levels, low 1.6 and 1.4; moderate 1.8 and 1.6; and vigorous 2.0 and 1.8, respectively. Additionally, the protocol indicates that analyses should be done at two levels, group and individual. The group level determines the overall bias to the reported EI, and the individual level shows the rate of under and over reporters. In the present article, we calculated the BMRest using the Schöfield equations [40]. Physical activity was assessed during face-to-face interviews with the international physical activity questionnaire (IPAQ), details are published somewhere else [41].
Misreporting cut-offs at group and individual levels for the ANIBES study are shown in Table 1. CV-WEI (coefficient of variance for energy intake within-subject) for the ANIBES population were 36.6% for children and adolescents and 41.6% for adults, respectively; and S (the factor that takes into account the variation in energy intake, BMR and PAL) for children and adolescents was 27.3 and for adults 29.6.

2.4. Statistical Analysis

Data are expressed as mean ± standard error of the mean (SEM), median, ranges, percentiles and percentages. Kolmogorov–Smirnoff normality test was used to check the normality of the distribution: random sample (2009 participants) and random + booster sample (2285). For those variables that did not follow the normality, appropriated non-parametric statistical tests were used for comparisons of groups. The random sample was used to show the total sample data and to compare between sexes. To compare by sex in each age group, a booster sample was included to enlarge those groups less represented in the random sample. Comparisons between groups were performed by a Student’s t-test for independent samples or Mann–Whitney U test to evaluate differences by sex within the whole population and within each age group. Analyses of variance (ANOVA) tests with Bonferroni correction for multiple comparisons or Kruskal–Wallis analysis were used to calculate differences among each age group. These procedures have taken into account the sampling complexity during the stratification of the study design. The level of significance was set at p < 0.05. Analyses were performed using IBM SPSS version 22.0 (IBM Corp., Armonk, NY, USA).

3. Results

3.1. Calcium, Phosphorus, Magnesium and Vitamin D Reported Intake and Distribution in the Whole Population

Table 2 depicts the daily reported intake levels of calcium, phosphorus, magnesium and vitamin D; Tables S1–S4 depict the percentiles distribution of each nutrient in the whole population and separately by age groups and sexes.
Men reported significantly higher consumption of calcium, phosphorus and magnesium than women in the entire population; as well as separately by age group for calcium in children, adolescents and adults, and for magnesium in adolescents, adults, and elderly. Higher reported intake of calcium was observed in children and adolescents compared with adults and elderly (p < 0.05). The reported consumption of phosphorus decreased, and that of vitamin D increased, both, with advancing age.

3.2. Calcium, Phosphorus, Magnesium and Vitamin D Reported Intake in Plausible Reporters

Table 3 shows the misreporting data. In the entire population, the plausible reporters were 543 individuals (27%), and the non-plausible reporters were 1466 (73%). The percentages of plausible reporters by age groups were: children 56%, adolescents 36%, adults 26% and elderly 22%. According to the misreporting analysis, we observed that the reported consumption of the four nutrients was significantly higher (p < 0.001) in the plausible reporters than in the non-plausible reporters in the whole population, as well as divided by age group, except for vitamin D in the adolescents. Likewise, there were significant differences when comparing plausible and non-plausible reporters within sexes.

3.3. Disparity between Reported Intake and the Level Needed for Adequacy for Calcium, Magnesium and Vitamin D in the Whole Population

Table 4 shows the percentage of the whole population and the plausible reporters that did not met the 80% of the Spanish [35] and European [36] recommended daily intake. As we can observe neither the whole population nor the plausible reporters separately met the daily intake recommendations for calcium, magnesium or vitamin D in the whole population and in the plausible reporters by gender, by age group and by gender and age group, according to the reported intake.

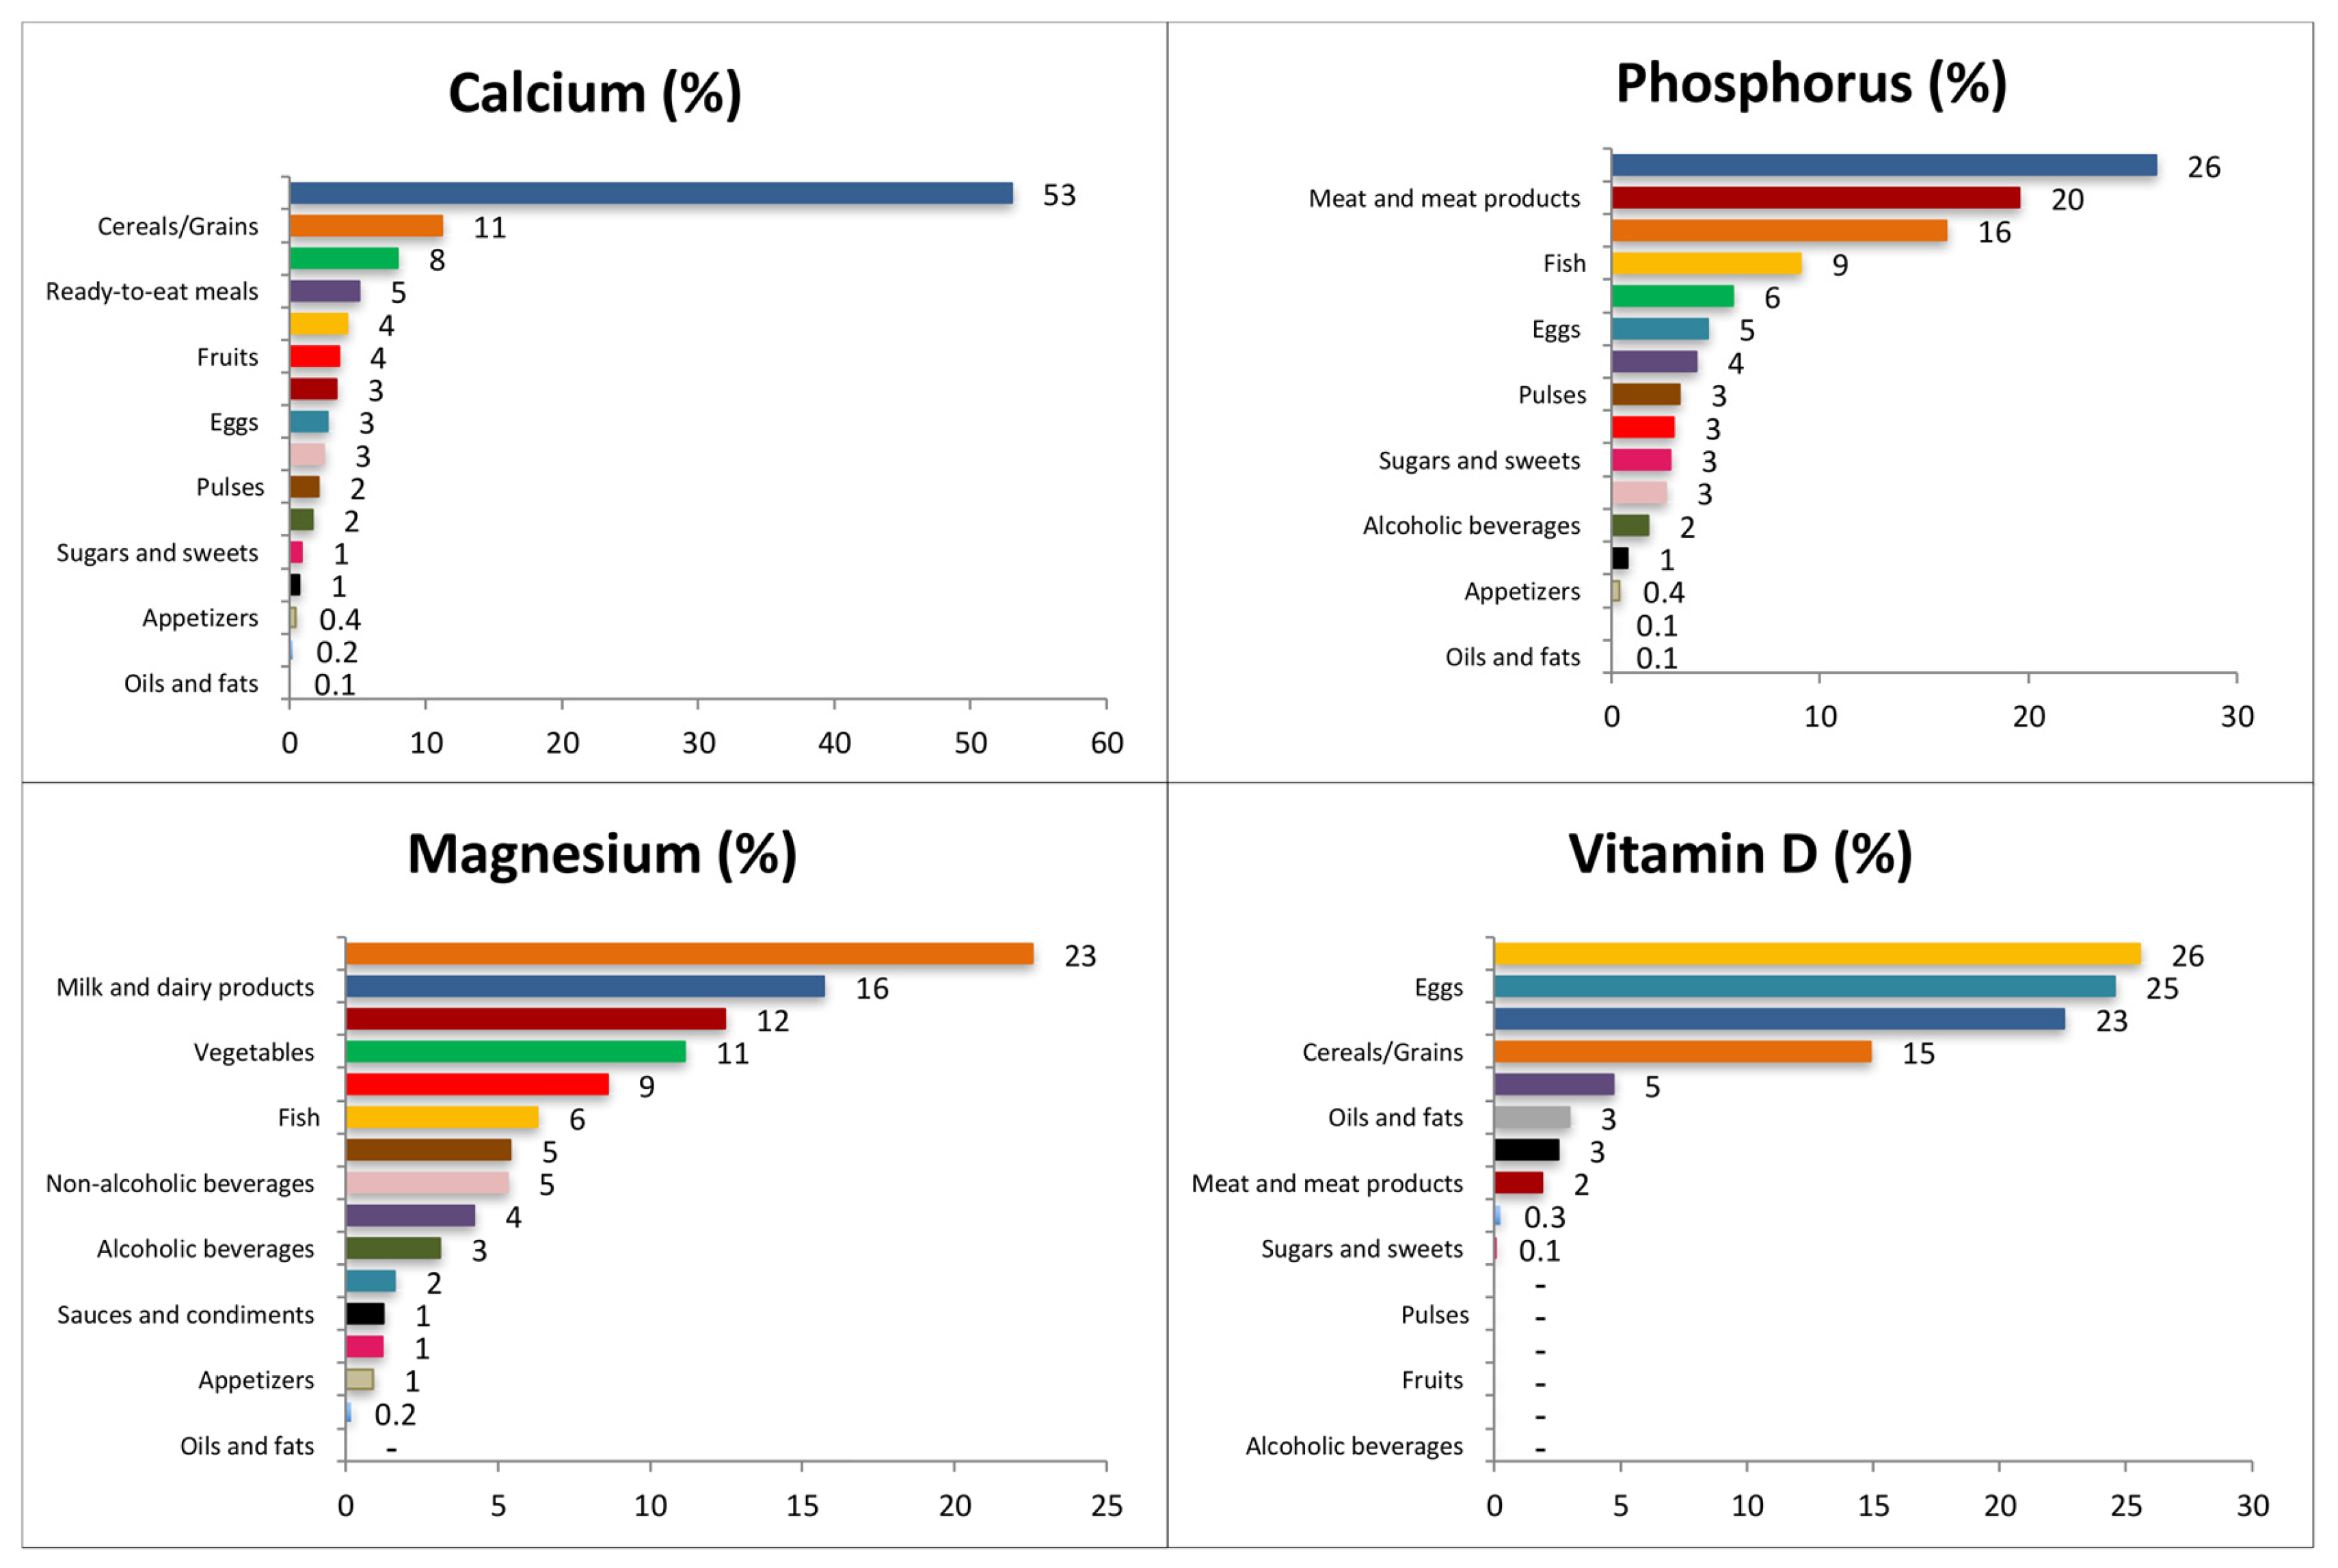
3.4. Contribution of Food Sources to Calcium, Phosphorus, Magnesium and Vitamin D Reported Intakes

The intake data were grouped into 16 food groups, 33 subgroups and 754 ingredients for in-depth analysis.
Figure 1 depicts the contribution (%) of food and beverage categories to the daily calcium, phosphorus, magnesium and vitamin D reported intake for the whole population. Tables S5–S8 show these data separately by age groups.

3.4.1. Calcium

The main sources of calcium for the entire population were milk and dairy products (53.1%; this contribution was higher in children, 60.3%), cereals and grains (11.2%), and vegetables (7.9%). Cereals and grains provided higher percentages to the younger groups whereas vegetables did so to the older. Ready to eat meals (5.1%), fish (4.2%), fruits (3.6%), and meat and meat products (3.4%) complete the list to reach more than the 85% of the total reported intake of calcium. Ready to eat meals afforded a higher percentage to the adolescent’s group while fish did for the older groups.

3.4.2. Phosphorus

The largest source of phosphorus for the whole population was milk and dairy products (26.1%), with a higher contribution for the children group (31%). Meat and meat products provided 19.6% and cereals and grains 16.1%. Fish contributed 9.1% and vegetables 5.8%; these last two food groups afforded less to the younger groups and more to the elderly. Eggs supplied 4.6%, and ready-to-eat meals 4.1%; both food groups contributed more to the younger groups and less to the older adults. All these groups afforded in more than 85% to the phosphorus reported intake.

3.4.3. Magnesium

Cereal and grain products were the main sources of magnesium for the whole population (22.6%), contributing in higher proportions to the younger groups than to the older adults. Milk and dairy products provided 15.7% to the whole population, contributing more to the younger groups. Meat and meat products ranked third (12.5%), and vegetables fourth (11.1%); this last food group provided less among younger groups and more among older adults. Fruits supplied 8.6%, fish 6.3%, and pulses (5.4%) to the magnesium reported consumption for the whole population; these food groups contributed less to the younger groups and more to the older adults. All these groups supplied more than 80% of the total magnesium reported intake.

3.4.4. Vitamin D

Fish was the main source of vitamin D (25.6%) for the whole population, although it contributed much less in younger groups than older adults. Eggs provided 24.6% and milk and dairy products 22.6%, this last food group in a higher proportion for the children group. Cereals and grains supplied 14.9% to the whole population, contributing to the largest proportion in younger groups. These four food groups contributed to more than 85% of the total daily vitamin D reported intake.

4. Discussion

Recent studies have demonstrated that the requirements for some minerals, namely calcium and magnesium, are not being met in all age groups, mainly because of the poor quality of the diet [5,42]. There are other micronutrients, such as vitamin D, that do not depend exclusively on food intake but also on other factors, such as endogenous synthesis [18]. Nevertheless, the diet is an important source of vitamin D, especially in places with low sun exposure. The present article shows that the reported daily dietary intakes of calcium, magnesium and vitamin D are not being met by the majority of the Spanish population included in the ANIBES study. It is important to highlight that ANIBES is the first national diet and nutrition survey in Spain, reporting nutrient intake for plausible and non-plausible reporters, based on well-harmonised procedures [22]. The ANIBES study is also based on EFSA “Guidance on the EU Menu Methodology”, guidelines designed to refine the methods and protocols described previously, and to indicate criteria for the collection of high-quality dietary information. Despite this, some authors have refuted the use of M-BMs because of the non-quantifiable nature of the error of self-reported data, and the fact that they are derived from non-empirical phenomena which are prone to omissions, false memories, intentional misreporting and misestimating [23,24,43]. However, in the ANIBES study, we used new tools like tablets and digital cameras as more accurate and objective measures of estimating food and nutrient intakes. Likewise, two pilot studies were performed before the beginning of the main study to optimise the procedures and minimise the limitations of M-BMs.
Previously, reported ANIBES results, addressed the reported intake of energy and the main macronutrients i.e. carbohydrates, lipids and proteins [30,31,32].
In the ANIBES study, the mean reported intake of calcium in all age groups was much lower than the national [35] and European (EFSA) [36] recommendations, even when the plausible reporters, whose reported intake was higher than the whole population, were taken separately. The calcium intake for the Spanish population in The Spanish National Survey of Dietary Intake, (Encuesta Nacional de Ingesta Dietética España, ENIDE) [44] for adults was around 900 mg/day, with very slight differences between sexes. In the present study, the reported intake of calcium for the whole population was 698 mg/day, but 862 mg/day for the plausible reporters; this last value is very similar to the one reported in the ENIDE study [44], although it used a different methodology. Previous studies have been performed in other European countries, indicating the consumption of calcium in the adult population. Germany [45], the Netherlands [46] and Finland [47] have reported mean intakes over 1000 mg/day; France [48], Italy [49] and Portugal [48] around 900 mg/day; and Greece [48] and the UK [50] around 850 mg/day. In general, all these countries have a low percentage of the population not meeting the recommended daily intakes [51].
A recent review regarding low nutrient intake in nine European countries (Belgium, Denmark, France, Germany, the Netherlands, Poland, Serbia, Spain, and the UK) [52] indicates that the intake of calcium in children ranges from 563 mg/day to 1106 mg/day; in adolescents from 651 mg/day to 1487 mg/day; in adults from 512 mg/day to 1329 mg/day and in older adults from 529 mg/day to 1031 mg/day. Comparing these results with those obtained in the ANIBES study, show that calcium children’s reported intake was around the mean intake of the European countries included in the review, whereas adolescents, adults, and older adults were closer to the lower intakes. When only the plausible reporters were considered, adolescents, adults, and older adults’ calcium reported intakes were higher, closer to the European countries mean intakes according to their age and sex groups, and, in some cases even superior to those values.
As expected, milk and dairy products were the main source of calcium for the ANIBES population, as was observed in the ENIDE study [44]. However, the other foods’ groups contributed to the reported intake of calcium were in different order and proportions. It is interesting to observe that contrary to many other countries in Europe [53], fish represents a good source of calcium for the Spanish population, specifically in the adult and elderly groups. Conversely, meat and meat products contribute only to a low percentage (3% in both Spanish studies) of the global intake of calcium.
In all studied groups, the reported intake of phosphorus met almost the totality of the Spanish [35] recommendations as well as the European [36]. The plausible reporter’s reported intake was adequate, and 100% of the population met the recommendations. Phosphorus is neither a shortfall nor an over-consumed mineral in this studied population. This mineral can be considered as sufficient in the majority of countries and, in some age groups even excessive [48].
In contrast to the ENIDE study [44], where fish was the main dietary source of phosphorus, in ANIBES, milk and milk products ranked first. In both cases, meat and meat products were in second place with similar percentages. However, the other food groups were positioned in a different order.
The body regulation of phosphorus is close related to calcium. The recommended intake ratios for these minerals range from 1:1 to 1.5:1. As the consumption of calcium uses to be lower than the recommended daily intake and the phosphorus higher, this ratio uses to be lower than the recommended one. Consequently, there is more predisposition to bone resorption, low peak bone mass and increased bone fragility [54]. In the ANIBES study, the ratio for the whole population was 0.60 (0.61 for women and 0.58 for men), the same ratio as for the plausible reporters separately, very low compared with the recommendations.
The reported intakes of magnesium of the studied population were much lower than the Spanish [35] and European [36] recommendations, in both the whole population and the plausible reporters. The mean of the observed intake of magnesium in the ENIDE study [44] was around 350 mg/day; adult intake was 379 mg/day for females and 409 mg/day for males. According to that survey, only 30% had an inadequate intake of this nutrient. The data from the ANIBES study were much lower, as the mean reported intake for the whole population was 222 mg/day and for the plausible reporter’s group alone 273 mg/day. This disparity might be because each study identified different patterns of consumption for food with high content of magnesium, namely cereals, legumes and nuts.
The results of surveys from most of the European countries indicated that the intake of magnesium was below the respective recommendations and that the inadequacy was higher in women than in men in some age groups, but not in all [48]. Specifically, data from the national surveys indicated that Finnish [55] and Swedish [56] adult intake of magnesium was over 330 mg/day for females and over 400 mg/day for males. In the Netherlands [57], Italy [58] and Ireland [59], the intake for women was between 275 mg/day and 311 mg/day and for males over 340 mg/day and under 400 mg/day; and, in France [60] and the UK [61], the intakes were around 250 mg/day for females and less than 325 mg/day for males. All these intakes are higher than the intakes reported for the whole population in the ANIBES; however, when we take only the plausible reporters, the intakes are similar to the data reported by France and the UK. In their review of the EU countries, Mesnkink et al. [52] indicated that the magnesium intake in children ranged from 185 mg/day to 290 mg/day, in adolescents from 190 mg/day to 531 mg/day, in adults from 209 mg/day to 522 mg/day, and in older adults from 227 mg/day to 421 mg/day. When they excluded the under-reporters, the mean intake increased from 5% to 28% in the different age and sex groups. The ANIBES reported intake of magnesium for children was around the mean of the mentioned range, but for the other age groups, it was close to the lower reported values. However, when we took only the plausible reporters, the reported intakes increased in 10%, 12%, 24% and 38% in children, adolescents, adults, and older adults, respectively.
The main food source for magnesium reported intake in ANIBES was the group of cereals and grains, whereas in ENIDE it was the group of pulses and nuts. The remainder of the main groups that completed the list in ANIBES included milk and dairy products, meat and meat products and vegetables. However, in ENIDE [44] the main food group that followed pulses and nuts was fish.
Spanish DRV [35] for vitamin D are set for those individuals that have zero or very low endogenous synthesis of this micronutrient. Considering these recommendations, as well as those from EFSA [36], the reported intake of vitamin D was by far lower than the daily recommendations in both the whole population and the plausible reporters alone. In the ENIDE study [44], the observed intake of this vitamin was also very low, 3.65 µg/day for women and 4.28 µg/day for men. In fact, in ANIBES the reported intake was higher than in ENIDE for the whole population as well as for plausible reporters. Although the percentages of the population at risk of disparity between reported intake and the level needed for adequacy of Vitamin D in both Spanish studies were high and very similar. The same situation has been reported in most European countries. Norway is one of the countries that are above the recommendation; this is because it is mandatory, as it is in all Nordic countries, to fortify milk products and margarine, because of the relatively low sun exposure during winter months, and the potentially low sun exposure through a lifestyle that is dominated by indoor activities [52]. In detail, the intakes of this vitamin in some European countries are: Norway over 10 µg/day [52]; Finland [47] and Sweden [62] around 6 µg/day; Ireland [63] and Portugal [51] around 3.6 µg/day; and Italy [49], the Netherlands [46] and the UK [50] around 3.1 µg/day. In general, the prevalence of vitamin D inadequacy for these countries was 40%. The ranges for the intake of vitamin D according to national surveys in nine European countries were for children 1.3 µg/day to 3.5 µg/day, adolescents 1.5 µg/day to 4.8 µg/day, adults 1.7 µg/day to 6 µg/day, and for older adults 0.7 µg/day to 5.2 µg/day. Comparing with data of the Menskin et al. review [52], the ANIBES mean reported intakes of Vitamin D for all age groups were higher than European countries reported values. Although vitamin D3 is synthesised in the skin by the action of ultraviolet light, data from across the world indicate that hypovitaminosis D is widespread, even in those countries considered sunny, and it is currently a global major public health problem [64]. Deficiency of vitamin D has been reported in some selected Spanish populations. This fact is perceived to be due to the use of sunscreen lotions and sedentary behaviour, which as previously mentioned, avoids frequent sun exposure [65].
The ANIBES study has several strengths, which include the careful design, protocol, and methodology used, conducted among a random representative sample of the Spanish population aged 9–75 years. It is the first Spanish study at national level that analysed the data for the whole population and the plausible reporters. One limitation of this study is its cross-sectional design, which provides evidence for associations but not causal relationships [41].

5. Conclusions

The reported intake of calcium and magnesium are low in the ANIBES population. In the whole studied group, 76% and 66%, and 79% and 72% of the population had reported intakes below the 80% of the national and European recommended daily intakes respectively; even when the plausible reporters, whose reported intakes were higher than the whole population, were analysed separately. Vitamin D reported intake is inadequate when compared to the level needed for adequacy, 94% and 93% of the population had reported intakes below 80% of the daily recommendations according to the national and European references. The main food sources of calcium and phosphorus were milk and dairy products, for magnesium were cereals and grains and for vitamin D it was fish. The results indicate that there is an important percentage of the Spanish ANIBES population not meeting the current recommended intakes for calcium, magnesium and vitamin D, even when considering only the plausible reporters.

Supplementary Materials

The following are available online at https://www.mdpi.com/2072-6643/9/2/168/s1.

Acknowledgments

The authors would like to thank Coca-Cola Iberia and IPSOS for its support and technical advice, particularly Rafael Urrialde and Javier Ruiz.

Author Contributions

J.O. and A.G. analysed the data; J.O. also drafted the manuscript. J.A.-B., A.G., R.M.O., M.G.-G. and L.S.-M. are members of the Scientific Advisory Board of the ANIBES study and were responsible for careful review of the protocol, design, and methodology. These authors provided continuous scientific advice for the study and for the interpretation of results. These authors also critically reviewed the manuscript. G.V.-M., Principal Investigator of the ANIBES study, was responsible for the design, protocol, methodology, and follow-up checks of the study. All authors approved the final version of the manuscript.

Conflicts of Interest

The ANIBES study was financially supported by a grant from Coca-Cola Iberia through an agreement with the Spanish Nutrition Foundation (FEN). The funding sponsors had no role in the design of the study, in the collection, analyses, or interpretation of the data; in the writing of the manuscript, and in the decision to publish the results. The authors declare no conflict of interest.

References

  1. Dietary Guidelines for Americans 2015–2020, Eight ed. Available online: http://health.gov/dietaryguidelines/2015/guidelines/message/ (accessed on 1 August 2016).
  2. World Health Organization (WHO). Global Status Report on Noncommunicables Diseases. 2014. Available online: http://apps.who.int/iris/bitstream/10665/148114/1/9789241564854_eng.pdf?ua=1 (accessed on 30 October 2016).
  3. Ezzati, M.; Riboli, E. Behavioral and Dietary Risk Factors for Noncommunicable Diseases. N. Engl. J. Med. 2013, 369, 954–964. [Google Scholar] [CrossRef] [PubMed]
  4. Institute of Medicine (IoM). Dietary Reference Intakes for Calcium, Phosphorus, Magnesium, Vitamin D, and Fluoride. Available online: https://www.nap.edu/catalog/5776/dietary-reference-intakes-for-calcium-phosphorus-magnesium-vitamin-d-and-fluoride (accessed on 10 October 2016).
  5. Rosanoff, A.; Dai, Q.; Shapses, S.A. Essential Nutrient Interactions: Does Low or Suboptimal Magnesium Status Interact with Vitamin D and/or Calcium Status? Adv. Nutr. 2016, 7, 25–43. [Google Scholar] [CrossRef] [PubMed]
  6. Muscogiuri, G.; Altieri, B.; Annweiler, C.; Balercia, G.; Pal, H.B.; Boucher, B.; Cannell, J.J.; Foresta, C.; Grübler, M.R.; Kotsa, K.; et al. Vitamin D and chronic diseases: The current state of the art. Arch. Toxicol. 2016. [Google Scholar] [CrossRef] [PubMed]
  7. Beto, J.A. The role of calcium in human aging. Clin. Nutr. Res. 2015, 4, 1–8. [Google Scholar] [CrossRef] [PubMed]
  8. Soedamah-Muthu, S.S.; Verberne, L.D.; Ding, E.L.; Engberink, M.F.; Geleijnse, J.M. Dairy consumption and incidence of hypertension a dose-response meta-analysis of prospective cohort studies. Hypertension 2012, 60, 1131–1137. [Google Scholar] [CrossRef] [PubMed]
  9. Louie, J.C.; Flood, V.M.; Rangan, A.M.; Burlutsky, G.; Gill, T.P.; Gopinath, B.; Mitchell, P. Higher regular fat dairy consumption is associated with lower incidence of metabolic syndrome but not type 2 diabetes. Nutr. Metab. Cardiovasc. Dis. 2013, 23, 816–821. [Google Scholar] [CrossRef] [PubMed]
  10. Malik, V.S.; Sun, Q.; van Dam, R.M.; Rimm, E.B.; Willett, W.C.; Rosner, B.; Hu, F.B. Adolescent dairy product consumption and risk of type 2 diabetes in middle-aged women. Am. J. Clin. Nutr. 2011, 94, 854–861. [Google Scholar] [CrossRef] [PubMed]
  11. Fumeron, F.; Lamri, A.; Abi Khalil, C.; Jaziri, R.; Porchay-Balderelli, I.; Lantieri, O.; Vol, S.; Balkau, B.; Marre, M. Dairy consumption and the incidence of hyperglycemia and the metabolic syndrome: Results from a French prospective study, data from the Epidemiological Study on the Insulin Resistance Syndrome (DESIR). Diabetes Care 2011, 34, 813–817. [Google Scholar] [CrossRef] [PubMed]
  12. Margolis, K.L.; Wei, F.; de Boer, I.H.; Howard, B.V.; Liu, S.; Manson, J.E.; Mossavar-Rahmani, Y.; Phillips, L.S.; Shikany, J.M.; Tinker, L.F. A diet high in low-fat dairy products lowers diabetes risk in postmenopausal women. J. Nutr. 2011, 141, 1969–1974. [Google Scholar] [CrossRef] [PubMed]
  13. Struijk, E.A.; Heraclides, A.; Witte, D.R.; Soedamah-Muthu, S.S.; Geleijnse, J.M.; Toft, U.; Lau, C.J. Dairy product intake in relation to glucose regulation indices and risk of type 2 diabetes. Nutr. Metab. Cardiovasc. Dis. 2013, 23, 822–828. [Google Scholar] [CrossRef] [PubMed]
  14. Ortega, R.M.; Jiménez, A.I.; López-Sabater, A.M. El calcio y la salud. Nutr. Hosp. 2015, 31 (Suppl. 2), 10–17. (In Spanish) [Google Scholar]
  15. Gutierrez, O.M. The connection between dietary phosphorus, cardiovascular disease, and mortality: Where we stand and what we need to know. Adv. Nutr. 2013, 4, 723–729. [Google Scholar] [CrossRef] [PubMed]
  16. Ayuk, J.; Gittoes, N.J. Contemporary view of the clinical relevance of magnesium homeostasis. Ann. Clin. Biochem. 2014, 51, 179–188. [Google Scholar] [CrossRef] [PubMed]
  17. Gröber, U.; Schmidt, J.; Kisters, K. Magnesium in Prevention and Therapy. Nutrients 2015, 7, 8199–8226. [Google Scholar] [CrossRef] [PubMed]
  18. European Food Safety Authority (EFSA). Dietary reference values for vitamin D, EFSA Panel on Dietetic Products, Nutrition and Allergies (NDA). EFSA J. 2016, 14, 4547. [Google Scholar]
  19. Fuleihan, G.-H.; Bouillon, R.; Clarke, B.; Chakhtoura, M.; Cooper, C.; McClung, M.; Singh, R.J. Serum 25-Hydroxyvitamin D Levels: Variability, Knowledge Gaps, and the Concept of a Desirable Range. J. Bone Miner. Res. 2015, 30, 1119–1133. [Google Scholar] [CrossRef] [PubMed]
  20. Glendenning, P.; Inderjeeth, C. Controversy and consensus regarding vitamin D: Recent methodological changes and the risks and benefits of vitamin D supplementation. Crit. Rev. Clin. Lab. Sci. 2016, 53, 13–28. [Google Scholar] [CrossRef] [PubMed]
  21. Archer, E.; Hand, G.A.; Blair, S.N. Validity of U.S. nutritional surveillance: National Health and Nutrition Examination Survey caloric energy intake data, 1971–2010. PLoS ONE 2013, 8, e76632. [Google Scholar] [CrossRef]
  22. European Food Safety Authority (EFSA). Example of a Protocol for Identification of Misreporting (Under- and Over-Reporting of Energy Intake) Based on the PILOT-PANEU Project. Available online: http://www.efsa.europa.eu/sites/default/files/efsa_rep/blobserver_assets/3944A-8–2-1.pdf (accessed on 10 February 2016).
  23. Archer, E.; Pavela, G.; Lavie, C.J. The Inadmissibility of What We Eat in America and NHANES Dietary Data in Nutrition and Obesity Research and the Scientific Formulation of National Dietary Guidelines. Mayo Clin. Proc. 2015, 90, 911–926. [Google Scholar] [CrossRef] [PubMed]
  24. Archer, E.; Pavela, G.; Lavie, C.J. A Discussion of the Refutation of Memory-Based Dietary Assessment Methods (M-BMs): The Rhetorical Defense of Pseudoscientific and Inadmissible Evidence. Mayo Clin. Proc. 2015, 90, 1736–1739. [Google Scholar] [CrossRef] [PubMed]
  25. Dhurandhar, N.V.; Schoeller, D.; Brown, A.W.; Heymsfield, S.B.; Thomas, D.; Sorensen, T.I.; Speakman, J.R.; Jeansonne, M.; Allison, D.B. Energy Balance Measurement Working Group. Energy balance measurement: When something is not better than nothing. Int. J. Obes. (Lond.) 2014, 39, 1109–1113. [Google Scholar] [CrossRef] [PubMed]
  26. Araujo, M.C.; Bezerra, I.N.; Barbosa Fdos, S.; Junger, W.L.; Yokoo, E.M.; Sichieri, R. Macro-nutrient consumption and inadequate micronutrient intake in adults. Rev. Saude Publica 2013, 47 (Suppl. 1), 177S–189S. [Google Scholar] [CrossRef] [PubMed]
  27. Tooze, J.A.; Midthune, D.; Dodd, K.W.; Freedman, L.S.; Krebs-Smith, S.M.; Subar, A.F.; Guenther, P.M.; Carroll, R.J.; Kipnis, V. A new statistical method for estimating the usual intake of episodically consumed foods with application to their distribution. J. Am. Diet. Assoc. 2006, 106, 1575–1587. [Google Scholar] [CrossRef] [PubMed]
  28. Barbosa Fdos, S.; Sichieri, R.; Junger, W.L. Assessing usual dietary intake in complex sample design surveys: The National Dietary Survey. Rev. Saude Publica 2013, 47 (Suppl. 1), 171S–176S. [Google Scholar] [CrossRef] [PubMed]
  29. European Food Safety Authority (EFSA). Guidance on the EU Menu methodology. EFSA J. 2014, 12, 3944. [Google Scholar]
  30. Ruiz, E.; Ávila, J.M.; Castillo, A.; Valero, T.; del Pozo, S.; Rodriguez, P.; Aranceta Bartrina, J.; Gil, A.; González-Gross, M.; Ortega, R.M.; et al. The ANIBES Study on Energy Balance in Spain: Design, Protocol and Methodology. Nutrients 2015, 7, 970–998. [Google Scholar] [CrossRef] [PubMed]
  31. Varela Moreiras, G.; Ávila, J.M.; Ruiz, E. Energy Balance, a new paradigm and methodological issues: The ANIBES study in Spain. Nutr. Hosp. 2015, 31, 101–112. [Google Scholar] [PubMed]
  32. Ruiz, E.; Ávila, J.M.; del Pozo, S.; Rodriguez, P.; Aranceta Bartrina, J.; Gil, A.; González-Gross, M.; Ortega, R.M.; Serra-Majem, L.; Varela-Moreiras, G. Macronutrient Distribution and Dietary Sources in the Spanish Population: Findings from the ANIBES Study. Nutrients 2016, 8, 177. [Google Scholar] [CrossRef] [PubMed]
  33. Nissensohn, M.; Sánchez-Villegas, A.; Ortega, R.M.; Aranceta-Bartrina, J.; Gil, Á.; González-Gross, M.; Varela-Moreiras, G.; Serra-Majem, L. Beverage Consumption Habits and Association with Total Water and Energy Intakes in the Spanish Population: Findings of the ANIBES Study. Nutrients 2016, 8, 232. [Google Scholar] [CrossRef] [PubMed]
  34. Moreiras, O.; Carbajal, A.; Cabrera, L.; Cuadrado, C. Tablas de Composición de Alimentos/Guía de Prácticas, 16th ed.; Ediciones Pirámide: Madrid, Spain, 2013. (In Spanish) [Google Scholar]
  35. Carbajal Azcona, Á. Ingestas recomendadas de energía y nutrientes. In Nutrición y Dietética; (revisited 2013); García-Arias, M.T., García-Fernández, M.C., Eds.; Secretariado de Publicaciones y Medios Audiovisuales, Universidad de León: León, Spain, 2003; pp. 1–26. Available online: https://www.ucm.es/data/cont/docs/458-2013-07-24-CARBAJAL-IR-2003-ISBN-84-9773-023–2-rev2013.pdf (accessed on 15 October 2016).
  36. EFSA. Dietary Reference Values and Dietary Guidelines. Available online: https://www.efsa.europa.eu/en/topics/topic/drv (accessed on 13 September 2016).
  37. Goldberg, G.R.; Black, A.E.; Jebb, S.A.; Cole, T.J.; Murgatroyd, P.R.; Coward, W.A.; Prentice, A.M. Critical evaluation of energy intake data using fundamental principles of energy physiology: 1. Derivation of cut-off limits to identify underrecording. Eur. J. Clin. Nut. 1991, 45, 569–581. [Google Scholar]
  38. Black, A.E. Critical evaluation of energy intake using the Goldberg cut-off for energy intake:basal metabolic rate. A practical guide to its calculation, use and limitations. Int. J. Obes. Relat. Metab. Disord. 2000, 24, 1119–1130. [Google Scholar] [CrossRef] [PubMed]
  39. Black, A.E. The sensitivity and specificity of the Goldberg cut-off for EI:BMR for identifying diet reports of poor validity. Eur. J. Clin. Nutr. 2000, 54, 395–404. [Google Scholar] [CrossRef] [PubMed]
  40. Schöfield, W.N. Predicting basal metabolic rate, new standards and review of previous work. Hum. Nutr. Clin. Nutr. 1985, 39 (Suppl. 1), 5–41. [Google Scholar] [PubMed]
  41. Mielgo-Ayuso, J.; Aparicio-Ugarriza, R.; Castillo, A.; Ruiz, E.; Ávila, J.M.; Aranceta Bartrina, J.; Gil, A.; Ortega, R.M.; Serra-Majem, L.; Varela-Moreiras, G.; et al. Physical Activity Patterns of the Spanish Population Are Mostly Determined by Sex and Age: Findings in the ANIBES Study. PLoS ONE 2016, 11, e0149969. [Google Scholar] [CrossRef] [PubMed]
  42. Rayssiguier, Y.; Libako, P.; Nowacki, W.; Rock, E. Magnesium deficiency and metabolic syndrome: Stress and inflammation may reflect calcium activation. Magnes. Res. 2010, 23, 73–80. [Google Scholar] [PubMed]
  43. Archer, E.; Blair, S.N. Reply to LS Freedman et al. Adv. Nutr. 2015, 6, 489–490. [Google Scholar] [CrossRef] [PubMed]
  44. Agencia Española de Seguridad Alimentaria y Nutrición (AESAN). Evaluación Nutricional de la Dieta Española II. Micronutrientes. Sobre Datos de la Encuesta Nacional de Ingesta Dietética (ENIDE); Agencia Española de Seguridad Alimentaria y Nutrición (AESAN): Madrid, Spain, 2011. (In Spanish) [Google Scholar]
  45. Max Rubner-Institut. Nationale Verzehrsstudie II. Ergebnisbericht Teil 2. Die bundesweite Befragung zur Ernährung von Jugendlichen und Erwachsenen; Max Rubner-Institut: Karlsruhe, Germany, 2008. Chapter 5. (In German) [Google Scholar]
  46. Hulshof, K.F.A.M.; Ocke, M.C.; van Rossum, C.T.M.; Buurma-Rethans, E.J.M.; Brants, H.A.M.; Drijvers, J.J.M.M.; ter Doest, D. Resultaten van de Voedselconsumptiepeiling 2003. Results of the National Food Consumption Survey 2003; RIVM Report 350030002; RIVM: Bilthoven, The Netherlands, 2004; Available online: http://www.rivm.nl/bibliotheek/rapporten/350030002.html (accessed on 17 October 2016).
  47. Peltonen, M.; Harald, K.; Männistö, S.; Saarikoski, L.; Peltomäki, P.; Lund, L.; Sundvall, J.; Juolevi, A.; Laatikainen, T.; Aldén-Nieminen, H.; et al. The National FINRISK 2007 Study; B34/2008; National Public Health Institute: Helsinki, Finland, 2008.
  48. Elmadfa, I.; Meyer, A.; Nowak, V.; Hasenegger, V.; Putz, P.; Verstraeten, R.; Remaut-DeWinter, A.M.; Kolsteren, P.; Dostálová, J.; Dlouhý, P.; et al. European Nutrition and Health Report 2009. Ann. Nutr. Metab. 2009, 55, 1–40. [Google Scholar] [PubMed]
  49. Turrini, A.; Saba, A.; Perrone, D.; Cialfa, E.; D’Amicis, A. Food consumption patterns in Italy: The INNCA Study 1994–1996. Eur. J. Clin. Nutr. 2001, 55, 571–588. [Google Scholar] [CrossRef] [PubMed]
  50. Henderson, L.; Irving, K.; Gregory, J.; Bates, C.J.; Prentice, A.; Swan, G.; Farron, M. The National Diet and Nutrition Survey: Adults Aged 19 to 64 Year. Volume 3: Vitamin and Mineral Intake and Urinary Analyses; The Stationery Office: London, UK, 2003. [Google Scholar]
  51. Roman Viñas, B.; Ribas Barba, L.; Ngo, J.; Gurinovic, M.; Novakovic, R.; Cavelaars, A.; de Groot, L.C.; van’t Veer, P.; Matthys, C.; Serra Majem, L. Projected prevalence of inadequate nutrient intakes in Europe. Ann. Nutr. Metab. 2011, 59, 84–95. [Google Scholar] [CrossRef] [PubMed]
  52. Mensink, G.B.; Fletcher, R.; Gurinovic, M.; Huybrechts, I.; Lafay, L.; Serra-Majem, L.; Szponar, L.; Tetens, I.; Verkaik-Kloosterman, J.; Baka, A.; et al. Mapping low intake of micronutrients across Europe. Br. J. Nutr. 2013, 110, 755–773. [Google Scholar] [CrossRef] [PubMed]
  53. Welch, A.A.; Fransen, H.; Jenab, M.; Boutron-Ruault, M.C.; Tumino, R.; Agnoli, C.; Ericson, U.; Johansson, I.; Ferrari, P.; Engeset, D.; et al. Variation in intakes of calcium, phosphorus, magnesium, iron and potassium in 10 countries in the European Prospective Investigation into Cancer and Nutrition study. Eur. J. Clin. Nutr. 2009, 63 (Suppl. 4), S101–S121. [Google Scholar] [CrossRef] [PubMed]
  54. Calvo, M.S.; Tucker, K.L. Is phosphorus intake that exceeds dietary requirements a risk factor in bone health? Ann. N. Y. Acad. Sci. 2013, 1301, 29–35. [Google Scholar] [CrossRef] [PubMed]
  55. Helldán, A.; Raulio, S.; Kosola, M.; Tapanainen, H.; Ovaskainen, M.L.; Virtanen, S. Finravinto 2012—Tutkimus; The National FINDIET 2012 Survey; THL Raportti 16/2013; Juvenes Print: Tampere, Finland, 2013; p. 217. (In Finnish) [Google Scholar]
  56. Amcoff, E.; Edberg, A.; Enghardt Barbieri, H.; Lindroos, A.; Nälsén, C.; Pearson, M.; Warensjö Lemming, E. Riksmatenvuxna 2010–11. Livsmedelsoch Näringsintag Bland Vuxna i Sverige. Resultat från Matvaneundersökning Utförd 2010–11; Livsmedelsverket: Uppsala, Sweden, 2012; p. 180. (In Swedish) [Google Scholar]
  57. Van Rossum, C.T.M.; Fransen, H.P.; Verkaik-Kloosterman, J.; Buurma-Rethans, E.J.M.; Ocké, M.C. Dutch National Food Consumption Survey 2007–2010: Diet of Children and Adults Aged 7 to 69 Years; RIVM Report Number: 350050006/2011; National Institute for Public Health and the Environment: Amsterdam, The Netherlands, 2011; p. 143. [Google Scholar]
  58. Sette, S.; Le Donne, C.; Piccinelli, R.; Arcella, D.; Turrini, A.; Leclercq, C. The third Italian National Food Consumption Survey, INRAN-SCAI 2005-06—Part 1: Nutrient intakes in Italy. Nut. Metab. Cardiovasc. Dis. 2011, 21, 922–932. [Google Scholar] [CrossRef] [PubMed]
  59. Irish Universities Nutrition Alliance (IUNA). National Adult Nutrition Survey; IUNA: Dublin, Ireland, 2011; p. 40. [Google Scholar]
  60. Agence Française de Sécurité Sanitaire des Aliments (AFSSA). Étude Individuelle Nationale des Consommations Alimentaires 2 (INCA 2) (2006–2007); Rapport 228; AFSSA: Maisons-Alfort, France, 2009. (In French) [Google Scholar]
  61. Bates, B.; Lennox, A.; Prentice, A.; Bates, C.; Swan, G. National Diet and Nutrition Survey. Headline Results from Years 1, 2 and 3 (Combined) of the Rolling Programme (2008/2009–2010/11); Department of Health and the Food Standards Agency: London, UK, 2011; p. 79.
  62. Becker, W.; Pearson, M. Riksmaten 1997–98. Dietary Habits and Nutrient Intake in Sweden 1997–98 (In Swedish/English Summary); Livsmedelsverket: Uppsala, Sweden, 2002. [Google Scholar]
  63. Harrington, J.; Perry, I.; Lutomski, J.; Morgan, K.; McGee, H.; Shelley, E.; Watson, D.; Barry, M. SLÁN 2007: Survey of Lifestyle, Attitudes and Nutrition in Ireland; Dietary Habits of the Irish Population, Department of Health and Children, The Stationery Office: Dublin, Ireland, 2008.
  64. Prentice, A. Vitamin D deficiency: A global perspective. Nutr. Rev. 2008, 66 (Suppl. 2), S153–S164. [Google Scholar] [CrossRef] [PubMed]
  65. Holick, M.F.; Binkley, N.C.; Bischoff-Ferrari, H.A.; Gordon, C.M.; Hanley, D.A.; Heaney, R.P.; Murad, M.H.; Weaver, C.M.; Endocrine Society. Evaluation, treatment, and prevention of vitamin D deficiency: An Endocrine Society clinical practice guideline. J. Clin. Endocrinol. Metab. 2011, 96, 1911–1930. [Google Scholar] [CrossRef] [PubMed]
Figure 1. Contribution of food categories to the daily calcium, phosphorus, magnesium and vitamin D reported intake in the ANIBES Study population.
Nutrients 09 00168 g001
Table 1. Calculated misreporting cut-off at group and individual levels for the ANIBES study.
Misreporting Cut-Off
Group LevelIndividual Level
PALLowerUpperLowerUpper
Children and adoles cents
1.61.551.660.932.76
1.81.731.861.043.10
2.01.932.071.163.45
Adults and elderly
1.41.381.420.772.53
1.61.581.620.882.89
1.81.772.831.003.25
PAL: Physical activity level. The PAL is established for children and adolescents; and adults and elderly in three levels, low 1.6 and 1.4; moderate 1.8 and 1.6; and vigorous 2.0 and 1.8, respectively.
Table 2. Daily calcium, phosphorus, magnesium and vitamin D reported intake by sex and age group in the ANIBES Study population.
TotalChildren 9–12 YearsAdolescents 13–17 YearsAdults 18–64 YearsElderly 65–75 Years
nMean ± SEMMedian (Range)nMean ± SEMMedian (Range)nMean ± SEMMedian (Range)nMean ± SEMMedian (Range)nMean ± SEMMedian (Range)
CALCIUM (mg/day)
Total2009698 ± 7664 (71–2551)213826 ± 17 a822 (302–1520)211817 ± 23 a774 (155–1960)1655689 ± 7 b659 (71–2551)206645 ± 19 b622 (157–2206)
Men1013726 ± 10 *681 (71–2551)126872 ± 22 *856 (302–1520)137875 ± 31 *831 (174–1960)798711 ± 11 *668 (71–2551)99662 ± 31642 (223–2206)
Women996670 ± 8650 (118–2399)87759 ± 26763 (305–1500)74708 ± 29667 (155–1276)857668 ± 9650 (118–2399)107629 ± 21613 (157–1344)
PHOSPHORUS (mg/day)
Total20091176 ± 81134 (331–4429)2131285 ± 22 a1286 (433–2086)2111261 ± 24 a1240 (414–2268)16551175 ± 9 b1128 (331–4429)2061097 ± 23 c1058 (453–2921)
Men10131246 ± 12 *1200 (433–4429)1261340 ± 27 *1362 (433–2086)1371323 ± 31 *1310 (441–2268)7981247 ± 14 *1197 (474–4429)991177 ± 38 *1117 (463–2921)
Women9961104 ± 91080 (331–2396)871206 ± 351184 (646–1972)741145 ± 351140 (414–1953)8571108 ± 101082 (331–2396)1071023 ± 251014 (453–1919)
MAGNESIUM (mg/day)
Total2009222 ± 2213 (73–782)213220 ± 4221 (75–471)211216 ± 4214 (80–410)1655223 ± 2213 (73–782)206226 ± 6210 (103–736)
Men1013233 ± 2 *224 (80–782)126224 ± 5222 (75–427)137224 ± 5 *224 (80–410)798236 ± 3 *225 (80–782)99246 ± 11 *222 (110–736)
Women996210 ± 2204 (73–592)87214 ± 7213 (124–471)74200 ± 7195 (93–387)857211 ± 2204 (73–592)107207 ± 6201 (103–430)
VITAMIN D (µg/day)
Total20094.4 ± 0.12.6 (0.0–74.2)2132.8 ± 0.2 a1.7 (0.1–13.5)2113.7 ± 0.4 a,b1.8 (0.0–73.9)16554.5 ± 0.1 b2.9 (0.0–74.2)2064.4 ± 0.4 b2.8 (0.0–34.2)
Men10134.4 ± 0.22.6 (0.0–74.2)1262.6 ± 0.21.7 (0.1–12.2)1374.0 ± 0.62.0 (0.0–73.9)7984.7 ± 0.22.8 (0.0–74.2)994.5 ± 0.53.2 (0.0–30.7)
Women9964.3 ± 0.22.7 (0.0–47.2)873.0 ± 0.31.8 (0.2–13.5)743.1 ± 0.51.2 (0.1–29.4)8574.4 ± 0.22.9 (0.0–47.2)1074.3 ± 0.52.6 (0.1–34.6)
Results are expressed as the mean ± standard error of the mean (SEM) and median with range (in brackets); (*) t-tests or Mann–Whitney U test were used to evaluate differences by sex within the whole population and within each age group. ANOVA or Kruskal–Wallis analysis were used to calculate differences among age groups (mean values within the same row with unlike superscript letters were significantly different). p < 0.05 was considered statistically significant.
Table 3. Daily calcium, phosphorus, magnesium and vitamin D reported intake by plausible reporters, non-plausible reporters and age group in the ANIBES Study population.
TotalChildren 9–12 YearsAdolescents 13–17 YearsAdults 18–64 YearsElderly 65–75 Years
nMean ± SEMMedian (Range)nMean ± SEMMedian (Range)nMean ± SEMMedian (Range)nMean ± SEMMedian (Range)nMean ± SEMMedian (Range)
CALCIUM (mg/day)
Total2009698 ± 7664 (71–2551)213826 ± 17822 (302–1520)211817 ± 23774 (155–1960)1655689 ± 7659 (71–2551)206645 ± 19622 (157–2206)
  Plausible reporters543862 ± 14824 (265–2399)120893 ± 22876 (337–1520)76978 ± 39959 (324–1960)433853 ± 16790 (265–2399)45807 ± 47795 (300–1943)
   Men232934 ± 23871 (300–2109)68954 ± 29940 (337–1520)481049 ± 55991 (324–1960)158938 ± 29851 (71–2551)24857 ± 71821 (300–1943)
   Women311807 ± 16778 (265–2399)52812 ± 32821 (354–1493)28855 ± 43834 (527–1276)275804 ± 17761 (265–2399)21750 ± 59705 (363–1344)
  Non–Plausible reporters1466637 ± 7613 (71–2551)93739 ± 25770 (302–1500)135726 ± 26675 (155–1855)1222631 ± 7605 (71–2551)161600 ± 18572 (157–2206)
   Men781664 ± 10631 (71–2551)58775 ± 30776 (302–1342)89782 ± 35725 (174–1855)640655 ± 11625 (71–2551)75600 ± 31553 (223–2206)
   Women685607 ± 9585 (118–1684)35681 ± 41637 (305–1500)46619 ± 32627 (155–1088)582604 ± 9579 (118–1684)86600 ± 21590 (157–1052)
PHOSPHORUS (mg/day)
Total20091176 ± 81134 (331–4429)2131285 ± 221286 (433–2086)2111261 ± 241240 (414–2268)16551175 ± 91128 (331–4429)2061097 ± 231058 (453–2921)
  Plausible reporters5431434 ± 141401 (708–3300)1201408 ± 241395 (795–2086)761502 ± 331502 (883–2268)4331433 ± 171396 (708–3300)451410 ± 511392 (885–2415)
   Men2321587 ± 231532 (901–3300)681456 ± 291447 (949–2086)481583 ± 411548 (984–2268)1581638 ± 301600 (901–3300)241537 ± 721469 (928–2415)
   Women3111321 ± 161304 (708–2396)521344 ± 391317 (795–1972)281362 ± 481329 (883–1953)2751315 ± 171288 (708–2396)211265 ± 571270 (885–1919)
  Non–Plausible reporters14661080 ± 81048 (331–4429)931128 ± 321098 (433–1989)1351125 ± 261111 (414–2083)12221084 ± 91047 (331–4429)1611009 ± 21993 (453–2921)
   Men7811145 ± 121114 (433–4429)581203 ± 401189 (433–1989)891183 ± 341162 (441–2083)6401151 ± 131119 (474–4429)751061 ± 361034 (463–2921)
   Women6851006 ± 10991 (331–1920)351002 ± 46960 (646–1756)461012 ± 361021 (414–1558)5821010 ± 11987 (331–1929)86963 ± 24982 (453–1749)
MAGNESIUM (mg/day)
Total2009222 ± 2213 (73–782)213220 ± 4221 (75–471)211216 ± 4214 (80–410)1655223 ± 2213 (73–782)206226 ± 6210 (103–736)
  Plausible reporters543273 ± 3261 (122–669)120242 ± 5241 (142–427)76263 ± 6255 (166–410)433278 ± 4266 (122–669)45300 ± 1626 (165–736)
   Men232301 ± 5287 (154–669)68248 ± 6248 (146–427)48274 ± 8275 (178–410)158319 ± 6300 (188–669)24327 ± 27266 (184–736)
   Women311253 ± 4244 (122–592)52233 ± 7237 (142–389)28242 ± 9235 (166–387)275254 ± 4246 (122–592)21269 ± 15253 (165–430)
  Non–Plausible reporters1466203 ± 2197 (73–782)93192 ± 6182 (75–471)135189 ± 4188 (80–298)1222204 ± 2197 (73–782)161205 ± 5200 (101–641)
   Men781214 ± 2207 (80–782)58196 ± 7189 (75–350)89197 ± 5192 (80–298)640215 ± 3207 (80–782)75220 ± 9210 (110–641)
   Women685191 ± 2188 (73–591)35185 ± 11179 (124–471)46175 ± 6172 (93–253)582191 ± 2187 (73–591)86192 ± 5188 (103–327)
VITAMIN D (µg/day)
Total20094.4 ± 0.12.6 (0.0–74.2)2132.8 ± 0.21.7 (0.1–13.5)2113.7 ± 0.41.8 (0.0–73.7)16554.5 ± 0.12.9 (0.0–74.2)2064.4 ± 0.42.8 (0.0–34.6)
  Plausible reporters5435.5 ± 0.33.6 (0.1–47.2)1203.2 ± 0.32.0 (0.2–12.8)763.8 ± 0.52.0 (0.1–20.9)4335.8 ± 0.34.1 (0.1–47.2)456.7 ± 0.95.2 (0.4–30–7)
   Men2325.5 ± 0.43.9 (0.1–38.3)683.0 ± 0.31.9 (0.2–12.2)484.0 ± 0.62.0 (0.1–20.9)1585.9 ± 0.54.4 (0.1–38.3)248.0 ± 1.36.3 (1.0–30.7)
   Women3115.5 ± 0.43.5 (0.1–47.2)523.3 ± 0.42.5 (0.2–12.8)283.3 ± 0.81.5 (0.4–18.2)2755.7 ± 0.43.9 (0.1–47.2)215.2 ± 1.23.3 (0.4–20.9)
  Non–Plausible reporters14664.0 ± 0.12.3 (0.0–74.2)932.3 ± 0.21.3 (0.1–13.5)1353.7 ± 0.61.8 (0.0–73.9)12224.1 ± 0.12.5 (0.0–74.2)1613.8 ± 0.42.2 (0.0–34.6)
   Men7814.1 ± 0.22.3 (0.0–74.2)582.2 ± 0.31.3 (0.1–9.2)894.0 ± 0.91.9 (0.0–73.9)6404.3 ± 0.22.5 (0.0–74.2)753.4 ± 0.42.2 (0.0–15.6)
   Women6853.8 ± 0.22.3 (0.0–37.2)352.5 ± 0.51.5 (0.2–13.5)462.9 ± 0.71.0 (0.0–29.4)5823.7 ± 0.22.4 (0.0–37.2)864.1 ± 0.62.2 (0.1–34.6)
Results are expressed as the mean ± standard error of the mean and median with range (in brackets). There were significant differences between plausible and non-plausible reporters for the whole population and within sexes into each age group (p < 0.05), except for vitamin D in the adolescents.
Table 4. Percentage of the population with disparity between reported intake and the level needed for adequacy for calcium, magnesium and vitamin D for the whole population and for the plausible reporters by age.
TotalChildren 9–12 YearsAdolescents 13–17 YearsAdults 18–64 YearsElderly 65–75 Years
SpainEFSASpainEFSASpainEFSASpainEFSASpainEFSA
CALCIUM (%)
Whole population76666238786574669073
  Men72635729715870648871
  Women80696853917778689275
Plausible reporters56444823654555476749
  Men49374412543545406346
  Women61505238796160517152
MAGNESIUM (%)
Whole population79726548905778737979
  Men78746953916076768181
  Women80705940895180717777
Plausible reporters53404929722651414444
  Men45385734732935355454
  Women58423823712160453333
VITAMIN D (%)
Whole population94939999959593939794
  Men93939999949492929993
  Women94949898979794949594
Plausible reporters90899898939389889484
  Men91899999929288889679
  Women89899898969689899090
Results are expressed in percentage. Recommended daily intakes for Spain [35] and Europe [36]. Adequacy was calculated comparing with 80% of the Spanish DRV and EFSA PRI or AI.

