1. Introduction
Geosocial-networking smartphone applications utilize global positioning system (GPS) technologies to connect users based on their physical proximity. Many gay, bisexual, and other men who have sex with men (MSM) have smartphones; a study including a venue-based sample of 660 men who have sex with men in New York City noted that 72% owned a smartphone and an additional 20% planned to buy one within the next year [
1]. These types of applications have been used among MSM to meet sexual partners [
2]. For example, a study among a venue-based sample of 379 MSM in Washington, DC found that 63.6% of these men reported having used a geosocial-networking smartphone application to meet a sexual partner in the past year [
3]. Among these geosocial-networking smartphone application users, 45% reported using these applications to search for male sexual partners at least once a week and 6.2% reported using these applications to search more frequently than daily [
3]. Grindr, the most commonly used of these applications among MSM, reported that it had six million users in 192 different countries worldwide as of 2013 [
4], and previous research has shown that MSM recruited from Grindr utilize other applications such as Jack’d, Scruff, and Hornet [
2].
These new mobile technologies have generated quicker and easier modes for MSM to meet potential partners. Among a sample of 1997 MSM recruited from these apps, 36.0% reported participating in at least one group sex event in the past year [
5]. Additionally, recent work among a sample of 7184 MSM visiting the Los Angeles Gay & Lesbian Center for STI screening between August 2011 and January 2013 found that individuals who used geosocial-networking smartphone applications for meeting sexual partners were at greater odds of testing positive for gonorrhea and for chlamydia compared to individuals who met partners through in-person methods only [
6]. A recent study of 1351 MSM using Grindr in New York City found that, while a majority (90%) had been tested for HIV within their lifetimes, among those who had never been tested, one-third had engaged in condomless anal intercourse in the prior three months [
7]. In a sample of 195 young MSM (aged 18 to 24 years old) using Grindr in Los Angeles, 15.4% reported engaging in condomless anal intercourse with their most recent sexual partner met on Grindr [
8].
2. Sampling and Recruitment via Broadcast and Banner Advertisement
MSM who use geosocial-networking smartphone applications represent a subset of MSM at increased risk for acquiring HIV and other STIs, warranting further investigation into the sexual behaviors and attitudes towards bio-behavioral interventions such as pre-exposure prophylaxis (PrEP) and treatment as prevention (TasP). Researchers have sought to recruit users of these applications (e.g., Grindr, Jack’d, Scruff) into HIV prevention studies, primarily through advertising on the application. For example, when logging on to Grindr, all users receive a broadcast advertisement, and any particular broadcast is sent out once in a defined area for a set time period, allowing every user to see the broadcast if they log on in that time period in a location and radius defined by advertisers. For example, researchers at University of California, Los Angeles, utilized this approach to recruit MSM into an ongoing rectal microbicide trial in 2010, linking the broadcast to the study’s contact information through a landing page describing more about the study that users saw when they clicked “more” [
9]. This approach has also been used to recruit MSM for an HIV testing program, a social epidemiological survey, and an HIV vaccine trial in New York City [
10].
Response rates have ranged widely in these advertising approaches, from 9.9% [
9] to 26.9% [
7]. These samples are likely biased by self-selection. It is possible that the highest risk users might be less likely to engage in an Internet-based survey while using these applications. For example, a user more immediately interested in engaging in sexual activity may ignore these advertisements so that they can message users. Additionally, these approaches are time-limited in nature, lasting anywhere from 24 to 48 h on dates typically decided by cost and advertising availability decided by the application’s advertising departments. These advertisements cannot reach those who are inactive on these applications during the broadcast. Furthermore, response rates are determined by calculating the number of respondents out of the total number of clicks to the advertisement, but do not account for the full reach of the advertisement (e.g., the number of users who viewed the advertisement but did not click through). Given that these advertisements are broadly targeted across a wide area; these approaches have generated samples of geosocial-networking smartphone application-using MSM in large urban centers that may not be representative of these areas. As such, we propose a novel method to generate a spatially representative sample of MSM via direct messaging on a given application using New York City and its geography as an example of this sampling and recruitment method.
3. New York City: A Case Study in Neighborhood Mapping
New York City is an ideal location for studying the health of MSM who use geosocial-networking smartphone applications, given the high population density in the city’s many diverse neighborhoods and the high prevalence of HIV infection [
11]. In addition, New York City is home to the largest number of Grindr users in the United States [
4]. New York City is composed of five boroughs, each of which is coterminous with one of five counties—the Bronx (Bronx County), Brooklyn (Kings County), Manhattan (New York County), Queens (Queens County), and Staten Island (Richmond County). By the most recent estimates, there were 8,405,837 people living in the boroughs in 2013, with 1,418,733 people (16.9%) in the Bronx, 2,592,149 people (30.8%) in Brooklyn, 1,626,159 people (19.3%) in Manhattan, 2,296,175 people (27.3%) in Queens, and 472,621 people (5.6%) in Staten Island [
12]. Neighborhoods across New York City have been operationalized in many ways with varying degrees of specificity—including census block groups, census tracts, United Hospital Fund-defined neighborhoods, community districts, ZIP codes, and boroughs/counties. Research among MSM has used several of these neighborhood definitions [
13,
14,
15]. The Office of City Planning divides the city into 59 residential community districts, and these districts delineate meaningful neighborhoods within the five boroughs. However, these areas can range widely in area, from 1.4 square miles (Bronx Community District #5) to 21.7 square miles (Staten Island Community District #3), and can lack the spatial resolution available in smaller geographic units (e.g., census tracts).
Public use microdata areas (PUMAs) are statistical geographic areas defined for the dissemination of the American Community Survey and creating population size estimates for survey-administrated years. Broadly, these areas nest within states or equivalent entities, contain at least 100,000 people, are built on census tracts and counties, and are geographically contiguous. In New York City, there are 55 PUMAs.
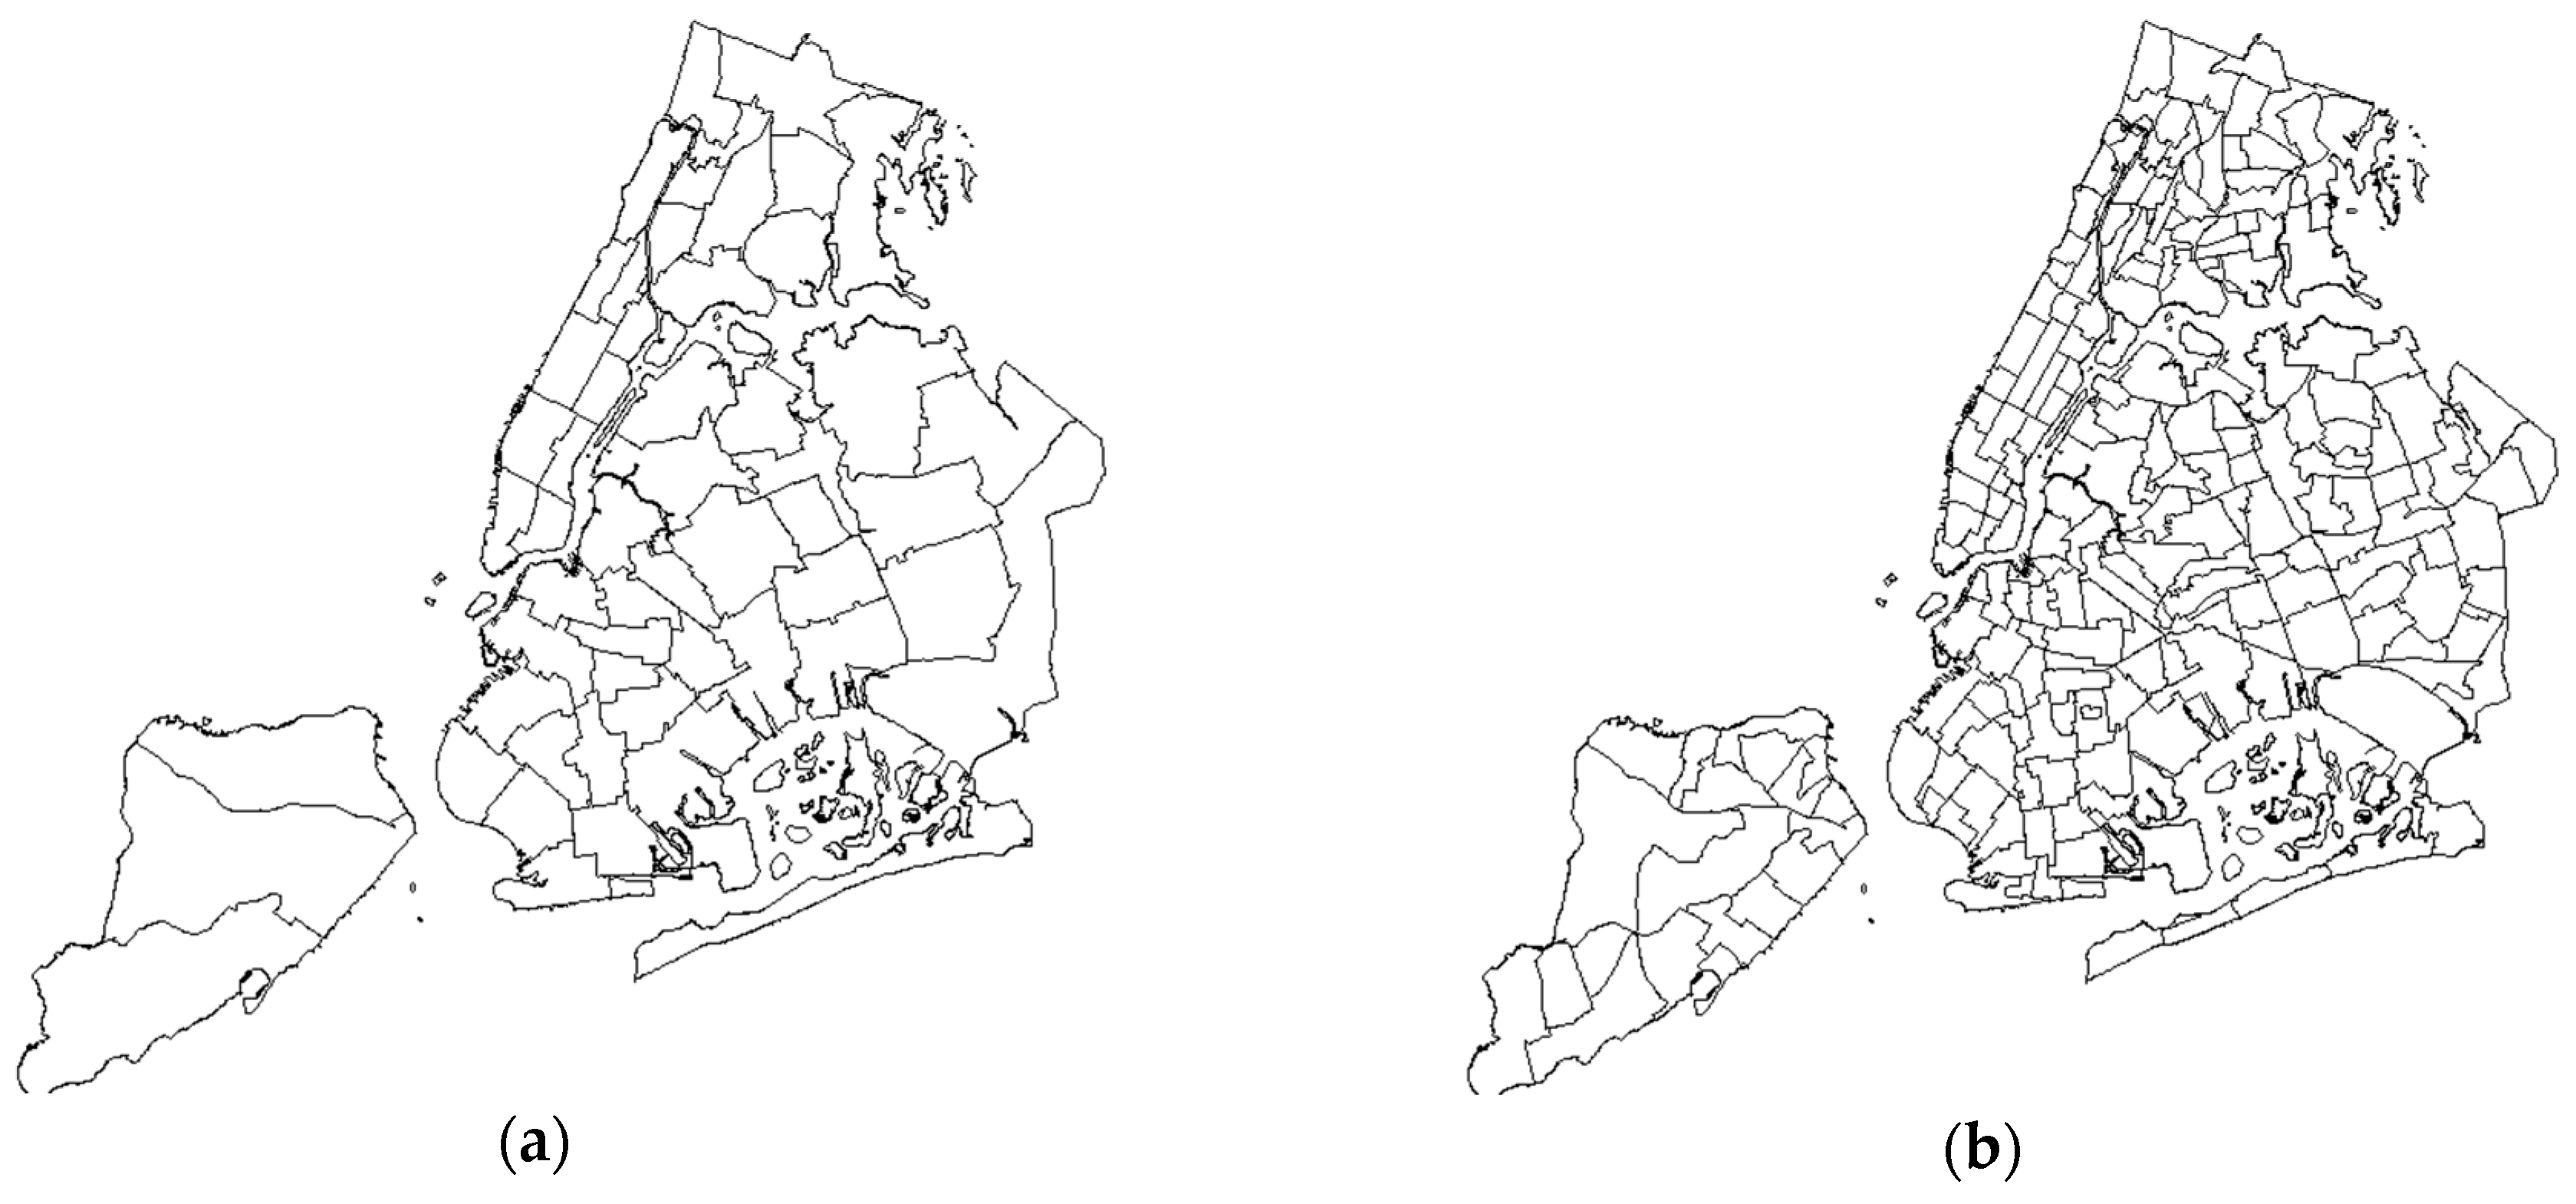
Table 1 lists the number of PUMAs within each borough, and
Figure 1a displays a map of PUMA boundaries. These areas roughly represent the 59 community districts, but they are not coterminous. Because the United States Census Bureau requires that these areas include at least 100,000 persons, some of these areas incorporate pieces of multiple community districts.
PUMAs, however, are similarly limited in nature as community districts. These areas are fairly coarse divisions of New York City and thus require smaller sub-divisions for increased specificity and spatial resolution. For example, one PUMA is defined by the portion of Manhattan west of Central Park and bounded by the park’s north and south edges. Neighborhood tabulation areas (NTAs) are nested within PUMAs. These areas are created from combinations of census tracts, so their names and boundaries may not necessarily represent “culturally-defined” neighborhoods, but these areas tend to correspond more closely to conventional views of New York neighborhoods. For example, the Lincoln Square area is a distinct, smaller NTA within the PUMA described above. There are 188 NTAs in New York City.
Table 1 also lists the number of NTAs within each borough, and
Figure 1b displays a map of NTA boundaries.
4. Sampling and Recruitment via Direct Messaging
From the total 55 PUMAs, 40 PUMAs can be selected through random stratified sampling, where each stratum represents one of the five boroughs of New York City to approximate the population distribution across the boroughs. The total number of PUMAs selected reflects the minimum number of PUMAs required so that at least two PUMAs are selected from each borough. The number of PUMAs selected from each borough roughly corresponds to the proportion of the population residing within each borough. Seven PUMAs can be selected from the Bronx (17.5%), 12 PUMAs can be selected from Brooklyn (30.0%), 8 PUMAs can be selected from Manhattan (20.0%), 11 PUMAs can be selected from Queens (27.5%), and 2 PUMAs can be selected from Staten Island (5.0%).
Within each of these 40 PUMAs, two NTAs can be randomly selected to serve as the primary recruitment units to create a geographically random sample of geosocial-networking smartphone application users. In total, 80 NTAs can be selected using this approach, where there will be 14 NTAs selected in the Bronx (17.5%), 24 NTAs selected in Brooklyn (30.0%), 16 NTAs selected in Manhattan (20.0%), 22 NTAs selected in Queens (27.5%), and 4 NTAs selected in Staten Island (5.0%).
Geosocial-networking smartphone applications provide researchers with an innovative tool for sampling and recruitment, as they create an immediate, virtual sampling frame where demographic or location screening is unnecessary. The coordinates of the centroid of each NTA can be reverse-geocoded using ArcGIS or other similar geographic information system (GIS) programs to the nearest intersection to create sampling points. At each sampling point, the recruiting staff member can record point coordinates using GeoLocation. GeoLocation is a free smartphone application that was previously used in a pilot study aiming to calculate the population density of MSM in Atlanta, Georgia, using a geosocial-networking smartphone application [
16]. Each recruitment location can be visited once during four different time blocks (e.g., 8 a.m. to 12 p.m.; 12 p.m. to 4 p.m.; 4 p.m. to 8 p.m.; 8 p.m. to 12 a.m.), as previous research has shown that users are more active at different times, and these four blocks have been selected to account for differences in activity patterns [
2].
Recruiting staff members can use profiles on a given geosocial-networking smartphone application identifying themselves as researcher staff members. At each recruitment location, the staff member can launch the application and send a message to the 25 closest users to the recruitment location. Users can be excluded if their distance from the centroid (as displayed in-app as the distance between a user and the recruiting staff members) is outside the boundary of the geographic sampling unit. The users can be sent an initial standardized message in order of proximity to the staff member. This message can contain information about the study, a unique login code, and a link to complete an anonymous online survey. The application automatically records all text messages sent and received. Using this feature, recruiting staff members can be able to ensure that no user will be approached more than once. Recruiting staff members are able to exchange text messages with the potential participant to answer any questions about the study. Recruiting staff members can log the number of participants contacted at each location during each time block to calculate response rates and reach.
Because it is possible that individuals may have accounts on any number of applications being used for recruitment, IP addresses will be recorded with the survey response on platforms such as Qualtrics to identify potential duplicates. In addition, these platforms record the approximate latitude and longitude of respondents, which can be used to characterize the spatial distribution of participants. Steps should be taken to protect all identifiable information, including IP addresses. Recruitment should be conducted using a dedicated password-protected smartphone or tablet accessible only to recruiting staff members and kept in a locked cabinet when recruitment is not occurring. Following the completion of all recruitment activities and data cleaning to eliminate potential duplicate responses, identifiable information should be removed. In addition, once the study is complete, researchers should delete the application and its contents.
There are some limitations to these methods. There is a high probability that this recruitment strategy will generate a random distribution of sampled users. However, it does not guarantee a random distribution of respondents, as there may be systematic differences in response rates by location, age, race or ethnicity, socioeconomic status, and other factors. In addition, cell phone users are mobile, so some users might be sampled outside of their residential areas.
5. Conclusions
While we have explored the application of these methods in New York City in this paper, we believe that these proposed methods can be implemented in other large urban centers with high population density, including Los Angeles, Philadelphia, and Miami. However, we acknowledge that there may be difficulties in generalizing these methods to cities with lower population density, including those in the Deep South, a region disproportionately impacted by HIV [
17]. To date, only one study has been conducted among geosocial-networking smartphone application-using MSM in the Deep South [
2]. There may be fewer PUMAs in these less dense areas, so we urge researchers to consider using local geographic areas as sampling units. For example, the city of New Orleans, Louisiana, which ranks second among all United States cities in terms of its rate of new HIV infection per capita, is divided into 13 planning districts and 72 distinct neighborhoods. Much like NTAs in New York City, most of these assigned boundaries match traditional local designations, and others differ from common traditional use, as the planning commission wished to divide the city into sections for governmental planning without crossing the boundaries of census tract boundaries.
These sampling and recruitment methods are highly adaptable to a number of other geosocial-networking smartphone applications used commonly by MSM, including Scruff, Jack’d, Hornet, and Adam4Adam—all of which use GPS technology and show nearby users in order of proximity. These methods have been discussed solely in the context of one geosocial-networking smartphone application (Grindr), one that requires research staff members to travel to given locations to send messages. However, MSM have been shown to use more than one application [
2], and applications such as Scruff, Jack’d, and Hornet allow users to virtually “travel” to the coordinates of a particular recruitment location, so these methods can be used to easily recruit geosocial-networking smartphone application-using MSM without spending time in transit from location to location, saving resources, and giving research teams access to application users outside of their geographic proximity. In summary, we present a method that is both highly rigorous with respect to geography and adaptable to various urban centers and geosocial-networking smartphone applications to sample spatially representative populations of MSM—which is rarely done in spatial epidemiology research.


