Published online Feb 28, 2011. doi: 10.3748/wjg.v17.i8.1045
Revised: September 13, 2010
Accepted: September 20, 2010
Published online: February 28, 2011
AIM: To verify whether arterial-phase contrast-enhanced ultrasonography (CEUS) of tumor parenchymal tissue is useful for evaluation of anti-angiogenesis agents.
METHODS: Rabbits with liver tumor were subjected to CEUS, and images of the nodular maximal diameter in vascular phase were recorded. Image analysis was performed to plot the time intensity curve (TIC) at the tumor parenchyma, which set the diameter of the region of interest of intensity measurement. The TIC was calculated to obtain the time to peak intensity (TPI) and the magnitude of PI. Rabbits were randomly assigned to a treatment group with sorafenib and a control group. Two weeks later, the same ultrasound examination was repeated followed by pathological testing to assess the effect of sorafenib on the liver tumor.
RESULTS: In four rabbits in the treatment group, the rate of change of tumor size was decreased compared with that of the control (the rate 2.3 vs 7.9, P = 0.02). The TPI of the treatment group elongated significantly (the rate 3.1 vs 1.1, P = 0.07 for SonoVue, 2.0 vs 0.88, P = 0.09 for Sonazoid). The magnitude of PI showed no significant changes. In pathological examination, capillary diameters in the treatment group were significantly smaller than those in the control group (26.4 vs 42.8 μm, P = 0.013).
CONCLUSION: Analysis of the TIC in the arterial phase of tumor tissue could evaluate the efficacy of anti-angiogenesis drug treatment in liver tumor.
- Citation: Yoshida K, Hirokawa T, Moriyasu F, Liu L, Liu GJ, Yamada M, Imai Y. Arterial-phase contrast-enhanced ultrasonography for evaluating anti-angiogenesis treatment: A pilot study. World J Gastroenterol 2011; 17(8): 1045-1050
- URL: https://www.wjgnet.com/1007-9327/full/v17/i8/1045.htm
- DOI: https://dx.doi.org/10.3748/wjg.v17.i8.1045
Hepatocellular carcinoma (HCC) is the sixth largest cause of neoplasms worldwide[1]. Although effective treatment for early-stage HCC exists in the form of surgery and locally destructive techniques such as radiofrequency ablation, there are few treatments for advanced HCC. Recent randomized control trials of the anti-angiogenesis drug sorafenib have shown effectiveness for the first time. Time to radiological progression and overall survival were prolonged in patients with advanced HCC who received sorafenib. However, some problems remain for anti-angiogenesis treatment. One of them is how to assess clinically whether the drugs are effective, because some tumors develop tolerance. Oncologists have to change the therapy as soon as they find that the liver tumor has become refractory to anti-angiogenesis therapy[2].
Enhanced computed tomography (CT) and magnetic resonance imaging (MRI) are generally used for this screening. They are convenient to assess the response of anti-angiogenesis therapy, because tumor size, necrotic lesions, vascularity and perfusion are evaluated at the same time. However, these modalities sometimes make incorrect assessments, because tumor perfusion is difficult to evaluate. Perfusion is more important than the size for anti-angiogenesis drug therapy[3].
Ultrasound examination can evaluate tumor size and necrotic lesions. Moreover, contrast-enhanced ultrasonography (CEUS) can evaluate tumor blood flow and perfusion more easily at the bedside than can CT and MRI with contrast agents[4]. Recently, CEUS has been used for differential diagnosis of liver tumor and to determine the degree of differentiation of HCC[5].
Previously, the usefulness of CEUS for the evaluation has been reported. However, a long time is needed for the ultrasound examination[6]. In response to this, we tried to simplify the evaluation method with CEUS. The purpose of this study was to probe whether the perfusion information from tumors at the arterial phase of CEUS is useful for monitoring the early-phase response of anti-angiogenesis treatment.
Twenty male Japanese white rabbits (body weight 2.5-5.0 kg, aged 12-16 wk) were used in this study. After habituation, implantation of Vx-2 tumor into the liver was performed. The Vx-2 tumor is a product of a virus-induced papilloma of rabbits, and the implanted nodules in liver are often used as an HCC model[7,8]. Rabbits were anesthetized by intravenous injection of 8 mg/kg pentobarbital. Each rabbit received a single percutaneous injection of about 1 mm × 1 mm × 2 mm of Vx-2 tumor directly into the liver parenchyma from a donor rabbit, with a fine 14 G needle guided by ultrasound. Every 2 wk after implantation, ultrasound examination was repeated until the tumor grew to 7-10 mm and was available for ultrasound evaluation. Tumors were successfully grown in 10 animals. Six rabbits were assigned randomly to receive sorafenib and the others were assigned to a control group. The study was approved by the animal ethical committee of Tokyo Medical University.
Sorafenib was used as an anti-angiogenesis drug. It inhibits multiple kinases and signaling pathways of angiogenesis including vascular endothelial growth factor (VEGF), and induces apoptosis of tumor cells[2]. Sorafenib was suspended into a carboxymethyl cellulose sodium salt solution and orally administered to six rabbits at a dose of 30 mg/kg once daily (30 mg/kg per day) for 14 d. The other four rabbits received no medication.
Ultrasonography was performed after placement of an intravenous catheter, and monitoring of respiration and heartbeat under anesthesia. Before injection of contrast agents, the livers were scanned in fundamental imaging mode. Ultrasound settings were as follows: diagnostic ultrasound system, SSA-770A (Toshiba Medical Systems, Japan) with PLT-1204AT (12 MHz) or PLT-704AT (7.5 MHz) probe, 2D mode for the abdomen, gain 80, dynamic range 65, rate 50 frames/s.
CEUS examination was performed by manually stabilizing the probe at the plane including its maximum diameter. Contrast agents were injected intravenously: SonoVue and Sonazoid. SonoVue is commercially available in Europe and China, and Sonazoid in Japan. A bolus of 0.05 mL/body of SonoVue was administered intravenously. After recording of images with SonoVue, 0.03 mL/body Sonazoid was given in the same way. For each agent, contrast-enhanced imaging of the tumor and surrounding parenchyma was performed for 3 min from just after injection, from the arterial to the portal phase, and for 7-8 min at the late phase.
Ultrasound settings were as follows: diagnostic ultrasound system, SSA-770A with PLT-1204AT (12 MHz) or PLT-704AT (7.5 MHz) probe, harmonic mode for CEUS, gain 70, dynamic range 50, rate 15 frames/s, mechanical index 0.23 for SonoVue and 0.32 for Sonazoid in harmonic imaging.
In the sorafenib group, the ultrasound examinations were performed on d 1 and 14 after sorafenib administration. In the control group, the same examinations were performed at 14 d after implantation and were repeated at 14 d after the first examination.
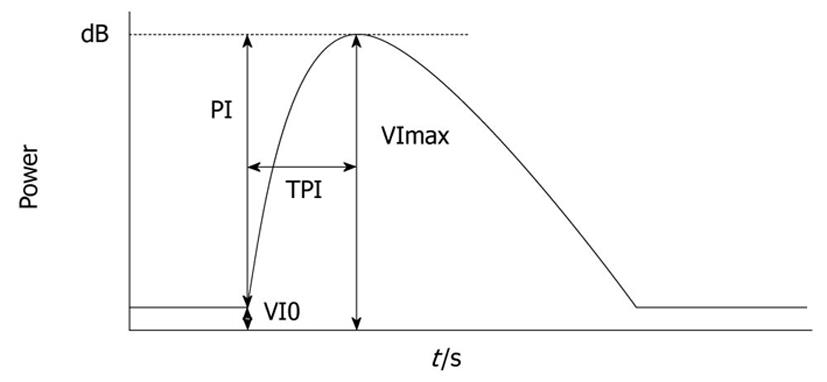
Images were recorded digitally on an optical disc and analyzed offline. Average video intensity (VI) of the region of interest (ROI) on every frame was measured automatically by the software Image Lab (Toshiba Corporation, Japan), after the ROI that included the most markedly enhanced area of a whole tumor region was identified. Necrotic regions, vessels, and liver parenchyma surrounding the tumor were excluded from the ROI. The corresponding time intensity curve (TIC) was plotted. The following parameters of blood flow were measured from the TIC: baseline intensity of ROI (VI0), maximal signal of the ROI (VImax), peak intensity (PI) that shows the difference between VImax and VI0 (VImax-VI0), and time to peak intensity (TPI) - time required from the onset of tumor contrast enhancement to VImax (Figure 1)[6]. Variation of TPI was the ratio of the post-treatment TPI to the pre-treatment TPI.
Animals were euthanized by injection of a lethal dose of pentobarbital just after the second ultrasound examination. Their livers were excised and examined pathologically to assess the response to sorafenib and its effects. After the examination of gross features, hematoxylin-eosin staining and immunological staining by anti-VEGF antibody were performed. Specimens were fixed in 10% formalin. Paraffin-embedded 5-μm-thick tissue sections were de-waxed, dehydrated, washed in distilled water, and rinsed in PBS, and then incubated with VEGF antibody (clone JH121; Thermo Fisher Scientific, CA, USA), which has species reactivity for humans and rabbits. Positive staining was identified when brown staining was found in the cytoplasm of the vascular endothelial cells.
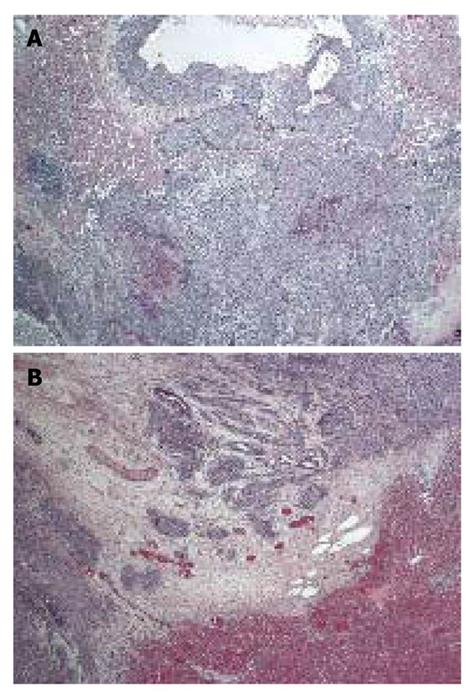
Cross-sectional images of the tumors were recorded in their maximum diameter as TIFF files at 40 × magnification using a BX50 microscope (Olympus, Tokyo, Japan) and Micropublisher 5.0 imaging system (Q Imaging, Canada). Blood vessels were identified in the image, and the diameters of the five largest vessels were measured macroscopically with Q Capture pro. 5.0 software (Q Imaging). The mean blood vessel diameters were compared. Vessels in the surrounding parenchyma and necrotic lesions and vessels that connected to the capsules were excluded because they were thought to correlate poorly with enhancement of the tumor.
SPSS version 16 software (SPSS Inc, Chicago, IL, USA) was used for all statistical analysis. The differences between the anti-angiogenesis treatment and control groups were compared using the Mann-Whitney test for tumor size and t test for other parameters. P < 0.10 was considered statistically significant.
Two rabbits in the treatment group died of systemic metastasis of the implanted tumor. The other four rabbits were used for evaluation.
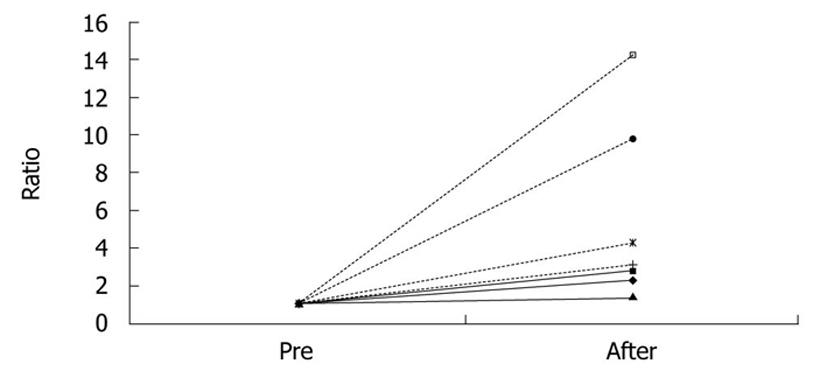
Tumor size was calculated by multiplying the longest diameter by the shortest. In the sorafenib group, the tumor grew more slowly than in the control group. Pre-treatment tumor size was a mean 107.5 mm2 (range: 58.6-192.9 mm2), and post-treatment size was a mean 255.6 mm2 (150.9-547.2 mm2) in the sorafenib group. In the control group, tumor size increased more rapidly. Baseline tumor size was a mean 45.7 mm2 (range: 24.5-78.8 mm2) and that at 14 days was a mean 283.2 mm2 (range: 210.3-436.6 mm2). Ratio (post-/pre-treatment) of the tumor size was a mean 2.3 (1.4-2.8) in the sorafenib group and 7.9 (3.1-14.2) in the control group (P = 0.02) (Figure 2, Table 1).
| Pre-treatment | Post-treatment | Ratio | |
| Sorafenib 1 | 69.4 | 159.0 | 2.3 |
| Sorafenib 2 | 58.6 | 165.3 | 2.8 |
| Sorafenib 3 | 109.0 | 150.9 | 1.4 |
| Sorafenib 4 | 192.9 | 547.2 | 2.8 |
| Control 1 | 49.0 | 210.3 | 4.3 |
| Control 2 | 24.5 | 240.0 | 9.8 |
| Control 3 | 78.8 | 246.1 | 3.1 |
| Control 4 | 30.6 | 436.6 | 14.0 |
There were no significant differences in variation of PI in the tumor. In SonoVue imaging, variation in PI in the sorafenib group was a mean 2.1 (range: 0.5-5.5) and that of the control group was a mean 1.3 (range: 0.9-1.7) (P = 0.84). In Sonazoid imaging, variation in PI in the sorafenib group was a mean 1.6 (range: 1.2-2.5) and that in the control group was a mean 1.2 (range: 1.0-1.4) (P = 0.28, , Table 2).
| Variation | |||||||
| V0 | VImax | TPI | PI | PI | TPI | ||
| SonoVue | |||||||
| Sorafenib 1 | 0W | -44.8 | -22.3 | 1.00 | 24.5 | ||
| 2W | -48.3 | -13.6 | 3.40 | 34.7 | 1.4 | 3.4 | |
| Sorafenib 2 | 0W | -45.5 | -19.6 | 0.27 | 25.8 | ||
| 2W | -48.4 | -35.3 | 0.87 | 13.1 | 0.51 | 3.2 | |
| Sorafenib 3 | 0W | -49.6 | -43.7 | 1.00 | 5.9 | ||
| 2W | -49.1 | -16.8 | 1.13 | 32.3 | 5.5 | 1.1 | |
| Sorafenib 4 | 0W | -39.6 | -14.9 | 0.86 | 24.7 | ||
| 2W | -45.6 | -18.8 | 4.14 | 26.8 | 1.1 | 4.8 | |
| Control 1 | 0W | -46.4 | -25.0 | 2.00 | 21.5 | ||
| 2W | -45.3 | -8.7 | 1.13 | 36.6 | 1.7 | 0.57 | |
| Control 2 | 0W | -48.5 | -14.6 | 2.53 | 34.0 | ||
| 2W | -47.8 | -16.0 | 2.60 | 31.8 | 0.94 | 1.0 | |
| Control 3 | 0W | -46.9 | -12.4 | 2.07 | 34.4 | ||
| 2W | -49.0 | -18.1 | 2.93 | 30.9 | 0.90 | 1.4 | |
| Control 4 | 0W | -49.9 | -37.2 | 1.06 | 12.7 | ||
| 2W | -50.0 | -28.5 | 1.47 | 21.5 | 1.7 | 1.4 | |
| Sonazoid | |||||||
| Sorafenib 1 | 0W | -49.1 | -21.9 | 2.27 | 27.2 | ||
| 2W | -48.1 | -13.5 | 3.67 | 34.5 | 1.3 | 1.6 | |
| Sorafenib 2 | 0W | -47.8 | -21.4 | 1.00 | 26.3 | ||
| 2W | -49.7 | -19.0 | 2.13 | 30.7 | 1.2 | 2.1 | |
| Sorafenib 3 | 0W | -34.5 | -19.1 | 2.60 | 15.4 | ||
| 2W | -47.9 | -10.0 | 2.67 | 37.9 | 2.5 | 1.0 | |
| Sorafenib 4 | 0W | -35.8 | -13.0 | 1.33 | 22.8 | ||
| 2W | -41.8 | -9.5 | 4.20 | 32.3 | 1.4 | 3.2 | |
| Control 1 | 0W | -42.5 | -16.2 | 2.33 | 26.3 | ||
| 2W | -48.6 | -13.0 | 2.80 | 35.6 | 1.4 | 1.2 | |
| Control 2 | 0W | -37.8 | -7.4 | 4.27 | 30.4 | ||
| 2W | -44.0 | -12.8 | 1.80 | 31.2 | 1.0 | 0.42 | |
| Control 3 | 0W | -41.7 | -14.7 | 1.60 | 27.0 | ||
| 2W | -49.2 | -18.0 | 2.14 | 31.2 | 1.2 | 1.3 | |
| Control 4 | 0W | -46.7 | -27.7 | 2.87 | 18.9 | ||
| 2W | -49.8 | -23.7 | 1.60 | 26.1 | 1.4 | 0.56 | |
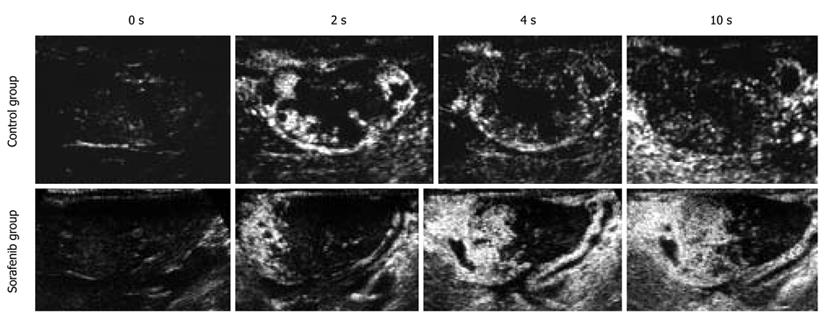
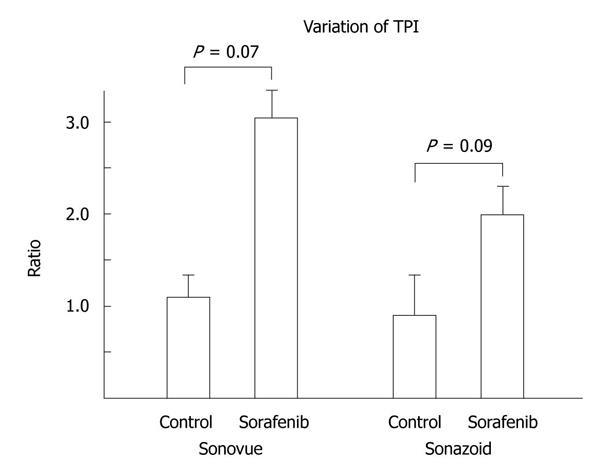
Variation in TPI in the tumor was prolonged in the sorafenib group. In contrast, variation in TPI in the tumor did not change or was shortened in the control group. In SonoVue imaging, variation in TPI in the sorafenib group was a mean 3.1 (range: 1.1-4.8) and that in the control group was a mean 1.1 (range: 0.56-1.4) (P = 0.07). In Sonazoid imaging, variation in TPI in the sorafenib group was a mean 2.0 (range: 1.0-3.2) and that in the control group was a mean 0.88 (range: 0.42-1.33) (P = 0.09, Figures 3 and 4, Table 2).
Pathological examination showed peritoneal dissemination and multiple metastases outside the liver. Some of the rabbits also showed ascites. Tumors appeared round, yellow/white, and separate from the surrounding parenchyma, with large necrotic lesions inside.
In vascular measurement, tumors in the sorafenib group had smaller vessels than in the control group. In the sorafenib group, the diameter of the tumor vessels was a mean 26.4 μm (range: 23.9-26.7 μm) and that in the control group was a mean 42.8 μm (range: 34.2-50.1 μm) (P = 0.013, Figure 5).
VEGF immunostaining examination presented no significant difference between both groups.
In the present study, prolonged TPI in arterial phase CEUS was shown during treatment with anti-angiogenesis agent.
Lavisse et al[6] have reported that TPI of tumor was elongated and PI was decreased in an anti-angiogenesis treatment group compared with a control group. Tumors induce new vessels to obtain oxygen and nutrition for their growth, and total blood flow of tumors increases, so-called angiogenesis. According to the study of Wilhelm et al[9], the anti-angiogenesis agent sorafenib inhibits angiogenesis and reduces microvessel density. This should be the reason why PI is reduced and TPI is prolonged in the sorafenib group.
In our study, TPI of tumors in the sorafenib group was similarly prolonged significantly, but no significant difference was detected in PI. In a previous study, entire tumors were estimated as the ROI, but in the present study, part of the viable region of the tumor was estimated as the ROI to simplify the measurement procedure. The analysis software that we used could not cover the entire tumor for the ROI. That was why no significant difference was detected in PI in our study.
The fact that we used rabbits in this study, unlike many previous studies that used mice and rats, is considered to have influenced the difference. First, rabbit liver is sufficiently large to be scanned by ultrasonography and more appropriate than that of mice and rats. The liver of mice is so small that we have to perform ultrasonography under different conditions. We implanted Vx-2 tumor in rabbit liver to satisfy conditions, because intrahepatic tumor and ectopic tumor behave differently in terms of proliferation. The blood supply and the biochemical environment are different in the skin and liver. Furthermore, there are enzymes that metabolize drugs in the liver. As a result, tumor responses to drugs differ depending on its location[10]. Second, we wanted to examine our simplified method, so nodules were implanted in the left lobe of the rabbits, where fixing the scan plane is difficult because of the movement of the heart and lungs. If a significant difference is shown under difficult conditions by a given method, then that method can be performed under most conditions and considered to be useful. As mentioned above, the TPI was significantly prolonged with both ultrasound contrast agents.
Ultrasound examination has less reproducibility and integrity than CT and MRI, because it needs more expertise and stable scanning fields. Our simplified method needs less examination time and no fixing probe or expensive location system. If the tumor has a rich parenchymal vascular network due to increased angiogenic activity, dilation of arterioles in the parenchyma can occur, and increased blood perfusion per unit volume should accelerate onset of tumor enhancement from ultrasound contrast agent. However, accurate blood flow, speed, and flux are difficult to evaluate, and TPI can show them better than other modalities can. When the administrated anti-angiogenesis drug induces a reaction in tumor vessels, the arterioles are not dilated, which results in a different enhancement pattern in CEUS in the arterial phase. TPI is considered to represent flux per unit volume of a scanning lesion. In spite of a lack of samples, the results of this study probably support this hypothesis.
In this study, we compared the dynamics of enhanced signals by a single dose of contrast agent. We did not use more accurate methods, such as the replenish curve or attenuation curve methods, because of complications[11].
In pathological examination, we detected a reduction of tumor vessel density in some parts of the tumors. Sorafenib is an anti-angiogenesis agent that prevents formation of new vessels and affects pre-existing capillaries to cause morphological alterations. As a result, the number of tumor vessels and their area and volume are reduced[12]. This is one of the explanations for prolongation of TPI in the sorafenib group. We could not evaluate endothelial cells because there is no appropriate antibody for CD34 immunostaining in rabbits. No significant difference was observed in VEGF immunostaining between the sorafenib and control groups, which is consistent with inhibition of VEGF signaling by sorafenib at the level of VEGF receptors.
Most HCC occurs in Eastern and Southeastern Asia, Africa and Melanesia. About 70% of patients are not eligible for curative treatment and prognosis is poor[1]. Treatment with anti-angiogenesis drugs such as sorafenib will become widespread and effective assessment of treatment will be needed. Although efficacy of antitumor drugs has previously been evaluated mainly by variation in tumor size, it is complex and demanding to evaluate the size of tumors with necrotic lesions. Tumor markers do not correspond with efficacy of anti-angiogenesis drugs.
It is undeniable that a greater number of samples were required than we used. However, an adequate number of animals were used to allow for proper statistical analysis.
In conclusion, Analyzing the TIC of arterial phase CEUS in tumor parenchyma could be helpful for evaluation of the efficacy of anti-angiogenesis drug treatment of liver tumor.
Although most patients with hepatocellular carcinoma are candidates for systemic therapy, conventional cytotoxic drugs yield poor therapeutic results. Recently, randomized control trials of the anti-angiogenesis drug sorafenib have shown effectiveness for the first time.
Therapeutic efficacy has been assessed by time to radiological progression and overall survival in previous studies. Anti-angiogenesis treatment might produce necrosis and no tumor shrinkage, so that new imaging techniques are needed to assess antitumor effects. In this study, we verified that arterial phase contrast-enhanced ultrasonography (CEUS) of tumor parenchymal tissue is useful for evaluation for anti-angiogenesis treatment.
Enhanced computed tomography (CT) and magnetic resonance imaging (MRI) are generally used to assess treatment, but tumor perfusion is difficult to evaluate by these methods. CEUS with our simplified method can evaluate the blood flow and perfusion of tumor more easily than CT and MRI at the bedside.
This was a pilot study with an animal model. A clinical study with a large number of patients and application of sorafenib to clinical practice are awaited.
Ultrasound contrast agents consist of microbubbles that visualize the blood flow. The time intensity curve is a graph that shows the variation in echo signal intensity with time. Peak intensity is the difference between maximal signal and baseline intensity, and correlates with blood flow volume. Time to peak intensity is the time to reach maximal intensity and correlates with blood flow volume per unit time. We can establish tumor perfusion by these parameters.
This is an interesting paper that looks at the role of CEUS in assessing sorafenib response and the value of using only arterial phase as compared to triphasic CEUS for evaluation. The use of the rabbit model was good and the comparisons between Sonovue and Sonovoid are useful. The initial tumor sizes for the treatment and control group however are too distinct, a mean 107.5 for the treatment group and 45.7 for the control group, which could have affected the validity of the observations at 14 d. Despite this, the study did demonstrate a significant reduction in vascular diameter in the sorafenib-treated group at 14 d compared to the controls.
| 1. | Parkin DM, Bray F, Ferlay J, Pisani P. Global cancer statistics, 2002. CA Cancer J Clin. 2005;55:74-108. [Cited in This Article: ] |
| 2. | Llovet JM, Ricci S, Mazzaferro V, Hilgard P, Gane E, Blanc JF, de Oliveira AC, Santoro A, Raoul JL, Forner A. Sorafenib in advanced hepatocellular carcinoma. N Engl J Med. 2008;359:378-390. [Cited in This Article: ] |
| 3. | Llovet JM, Di Bisceglie AM, Bruix J, Kramer BS, Lencioni R, Zhu AX, Sherman M, Schwartz M, Lotze M, Talwalkar J. Design and endpoints of clinical trials in hepatocellular carcinoma. J Natl Cancer Inst. 2008;100:698-711. [Cited in This Article: ] |
| 4. | Maruyama H, Takahashi M, Ishibashi H, Okabe S, Yoshikawa M, Yokosuka O. Changes in tumor vascularity precede microbubble contrast accumulation deficit in the process of dedifferentiation of hepatocellular carcinoma. Eur J Radiol. 2010;75:e102-e106. [Cited in This Article: ] |
| 5. | Choi BI. Doppler and harmonic ultrasound for hepatocellular carcinoma. Hepatol Res. 2007;37 Suppl 2:S172-S177. [Cited in This Article: ] |
| 6. | Lavisse S, Lejeune P, Rouffiac V, Elie N, Bribes E, Demers B, Vrignaud P, Bissery MC, Brulé A, Koscielny S. Early quantitative evaluation of a tumor vasculature disruptive agent AVE8062 using dynamic contrast-enhanced ultrasonography. Invest Radiol. 2008;43:100-111. [Cited in This Article: ] |
| 7. | Burgener FA, Violante MR. Comparison of hepatic VX2-carcinomas after intra-arterial, intraportal and intraparenchymal tumor cell injection. An angiographic and computed tomographic study in the rabbit. Invest Radiol. 1979;14:410-414. [Cited in This Article: ] |
| 8. | Vossen JA, Buijs M, Syed L, Kutiyanwala F, Kutiyanwala M, Geschwind JF, Vali M. Development of a new orthotopic animal model of metastatic liver cancer in the rabbit VX2 model: effect on metastases after partial hepatectomy, intra-arterial treatment with 3-bromopyruvate and chemoembolization. Clin Exp Metastasis. 2008;25:811-817. [Cited in This Article: ] |
| 9. | Wilhelm SM, Carter C, Tang L, Wilkie D, McNabola A, Rong H, Chen C, Zhang X, Vincent P, McHugh M. BAY 43-9006 exhibits broad spectrum oral antitumor activity and targets the RAF/MEK/ERK pathway and receptor tyrosine kinases involved in tumor progression and angiogenesis. Cancer Res. 2004;64:7099-7109. [Cited in This Article: ] |
| 10. | Yao X, Hu JF, Daniels M, Yien H, Lu H, Sharan H, Zhou X, Zeng Z, Li T, Yang Y. A novel orthotopic tumor model to study growth factors and oncogenes in hepatocarcinogenesis. Clin Cancer Res. 2003;9:2719-2726. [Cited in This Article: ] |
| 11. | Wei K, Jayaweera AR, Firoozan S, Linka A, Skyba DM, Kaul S. Quantification of myocardial blood flow with ultrasound-induced destruction of microbubbles administered as a constant venous infusion. Circulation. 1998;97:473-483. [Cited in This Article: ] |
| 12. | Righi M, Giacomini A, Lavazza C, Sia D, Carlo-Stella C, Gianni AM. A computational approach to compare microvessel distributions in tumors following antiangiogenic treatments. Lab Invest. 2009;89:1063-1070. [Cited in This Article: ] |


