Published online Aug 28, 2015. doi: 10.3748/wjg.v21.i32.9544
Peer-review started: January 26, 2015
First decision: March 10, 2015
Revised: April 27, 2015
Accepted: July 3, 2015
Article in press: July 3, 2015
Published online: August 28, 2015
AIM: To determine the feasibility and safety of establishing a porcine hepatic cirrhosis and portal hypertension model by hepatic arterial perfusion with 80% alcohol.
METHODS: Twenty-one healthy Guizhou miniature pigs were randomly divided into three experimental groups and three control groups. The pigs in the three experimental groups were subjected to hepatic arterial perfusion with 7, 12 and 17 mL of 80% alcohol, respectively, while those in the three control groups underwent hepatic arterial perfusion with 7, 12 and 17 mL of saline, respectively. Hepatic arteriography and direct portal phlebography were performed on all animals before and after perfusion, and the portal venous pressure and diameter were measured before perfusion, immediately after perfusion, and at 2, 4 and 6 wk after perfusion. The following procedures were performed at different time points: routine blood sampling, blood biochemistry, blood coagulation and blood ammonia tests before surgery, and at 2, 4 and 6 wk after surgery; hepatic biopsy before surgery, within 6 h after surgery, and at 1, 2, 3, 4 and 5 wk after surgery; abdominal enhanced computed tomography examination before surgery and at 6 wk after surgery; autopsy and multi-point sampling of various liver lobes for histological examination at 6 wk after surgery.
RESULTS: In experimental group 1, different degrees of hepatic fibrosis were observed, and one pig developed hepatic cirrhosis. In experimental group 2, there were cases of hepatic cirrhosis, different degrees of increased portal venous pressure, and intrahepatic portal venous bypass, but neither extrahepatic portal-systemic bypass circulation nor death occurred. In experimental group 3, two animals died and three animals developed hepatic cirrhosis, and different degrees of increased portal venous pressure and intrahepatic portal venous bypass were also observed, but there was no extrahepatic portal-systemic bypass circulation.
CONCLUSION: It is feasible to establish an animal model of hepatic cirrhosis and portal hypertension by hepatic arterial perfusion with 80% alcohol, however, the safety of this model depends on a suitable perfusion dose.
Core tip: We successfully established a porcine hepatic cirrhosis and portal hypertension model by hepatic arterial perfusion with 80% alcohol. The model accurately reproduced the pathophysiological development process similar to that occurring in humans.
- Citation: Wang L, He FL, Liu FQ, Yue ZD, Zhao HW. Establishment of a hepatic cirrhosis and portal hypertension model by hepatic arterial perfusion with 80% alcohol. World J Gastroenterol 2015; 21(32): 9544-9553
- URL: https://www.wjgnet.com/1007-9327/full/v21/i32/9544.htm
- DOI: https://dx.doi.org/10.3748/wjg.v21.i32.9544
Hepatic cirrhosis is most commonly caused by viral hepatitis and alcohol abuse[1]; the 5- and 10-year survival rates of patients with compensated hepatic cirrhosis are 84% and 68%, respectively, while the 5-year survival rate of decompensated hepatic cirrhosis is only 14%[2]. According to the World Health Organization (WHO), about 800000 patients die of hepatic cirrhosis each year worldwide[3]. Thus, in order to develop new strategies for the diagnosis and treatment of hepatic cirrhosis, it is essential, despite being a major challenge, to establish large animal models similar to humans, which are applicable in all-round research, especially models of hepatic cirrhosis for application in surgery, intervention and pharmaceutical research. Currently, the following methods are widely used to establish animal models of hepatic cirrhosis or portal hypertension: carbon tetrachloride (CCl4); thioacetamide; surgical prehepatic portal ligation; and combinations of these methods. However, no approach is capable of fully simulating the entire pathophysiological process most frequently involved in the occurrence and development of posthepatitic and alcoholic cirrhosis[4]. In the present study, we successfully established a porcine hepatic cirrhosis and portal hypertension model through hepatic arterial perfusion with alcohol, which accurately reproduced the pathophysiological development process similar to that occurring in humans. The study results are reported below.
A total of 21 healthy Guizhou miniature pigs (male and female, 3-mo-old, 30-35 kg) were randomly assigned to six groups: experimental group 1 (n = 5), experimental group 2 (n = 5), experimental group 3 (n = 5), control group 1 (n = 2), control group 2 (n = 2) and control group 3 (n = 2). An intravenous channel was established via ear vein puncture, and an injection of propofol (Xi’an Libang Pharmaceuticals Co., Ltd., China) 2.5-3.5 mg/kg was used for combined anesthesia.
Percutaneous puncture of the porcine femoral artery or the external iliac artery was successfully performed using the Seldinger method under general anesthesia. A 5F or 6F arterial sheath (Avanti+, Cordis) was applied, followed by insertion of a 4F Cobra or hepatic catheter (Cordis, Miami, FL, United States) via the arterial sheath. Finally, one-step percutaneous portal vein puncture was successfully performed using a hepatic puncture needle (Angiotech, Vancouver, BC, Canada), followed by insertion of a 6F multi-sidehole pigtail catheter (Drainage Catheter-Locking Pigtail, Angiotech) into the portal vein, with its exposed part subcutaneously fixed into the lateral abdominal wall of the pig. Animals in the three experimental groups were perfused with 7, 12 and 17 mL of 80% alcohol (Beijing ZhenYuMinSheng Pharmaceutical Co., Ltd, Beijing, China), respectively, prepared using saline, via the common hepatic artery (the catheter was delivered avoiding the cystic and gastroduodenal arteries), while the animals in the three control groups were subjected to hepatic arterial perfusion with 7, 12 and 17 mL of saline, respectively. Before and after perfusion, hepatic arteriography was performed by means of DSA SimenziArtis using 9-15 mL Ultravist 370 (Bayer, Leverkusen, Germany) at 3 mL/s and 15 frames/s. Before perfusion, immediately after perfusion, and at 2, 4 and 6 wk after perfusion, portal phlebography was performed using 10-15 mL Ultravist 370 at 10 mL/s and 15 frame/s, and the portal venous pressure and diameter were then measured. If direct portal vein puncture failed, indirect portal phlebography was performed via the splenic artery using 10-15 mL Ultravist 370 at 2 mL/s and 15 frames/s, and the location of the portal vein was marked simultaneously, and direct portal vein puncture was performed thereafter with reference to this location. The following procedures were performed at different time points: routine blood sampling, biochemistry (liver function), blood coagulation and blood ammonia tests before surgery, and at 2, 4 and 6 wk after surgery; and multi-site, multi-point hepatic biopsies before surgery, within 6 h after surgery, and at 1, 2, 3, 4, and 5 wk after surgery (hepatic tissues collected by biopsy were subjected to pathological examination and METAVIR scoring). The METAVIR scoring criteria were as follows: 0 = no fibrosis; 1 = fibrosis without septum; 2 = fibrosis with a few septa; 3 = bridging fibrosis with numerous septa; 4 = cirrhosis. Abdominal enhanced CT examination was performed before surgery, and at 6 wk after surgery; and autopsy was conducted at 6 wk after surgery. The liver, spleen, esophagus, stomach, heart, lungs and kidneys were removed at autopsy and then fixed with 10% formalin for pathological examination. Multi-point histological samples of various liver lobes were obtained and evaluated by the following methods: firstly, samples were stained with hematoxylin, eosin and Masson’s trichrome stain, followed by observation under light microscope; and secondly, the degree of hepatic fibrosis was classified into levels 0 to 4 using image analysis software (0, no fibrosis; 1, < 10% fibrosis; 2, 10%-20% fibrosis; 3, 21%-50% fibrosis; 4, ≥ 51% fibrosis). And 1000 mg of cefminox sodium (BBCA Pharmaceutical, Hefei, China) was injected intravenously during surgery, 0.5 mg cefadroxil tablets (Qingyuan Huaneng Pharmaceutical Co., Ltd., Guangdong, China) were orally administered at a dose of 1 tablet/day for 2 wk, commencing 12 h after surgery, and enteric-coated aspirin tablets (Bayer) were orally administered at a dose of 100 mg/d for 6 wk for post-operative anticoagulation.
SPSS 17.0 software was used for statistical analyses. The t-test was employed for comparison of quantitative data, and either the χ2 test or Fisher’s exact test was used for comparison of qualitative data. A P-value < 0.05 was considered statistically significant.
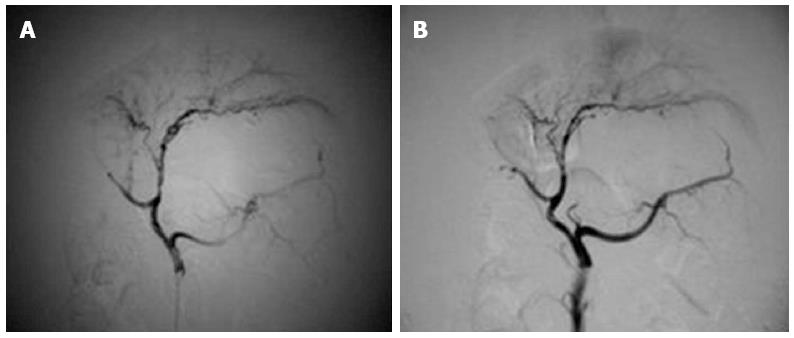
Hepatic arteriography: Before and after perfusion, there were no significant vascular changes in three pigs from experimental group 1 or in any of the pigs from the control groups. After perfusion, a slight decrease in peripheral branches of the hepatic artery (< level 4) was observed in two pigs from experimental group 1 and in one pig from experimental group 2, while there was a marked reduction in peripheral branches of the hepatic artery (< level 3) in four pigs from experimental group 2 and all pigs from experimental group 3 (Figure 1A, B).
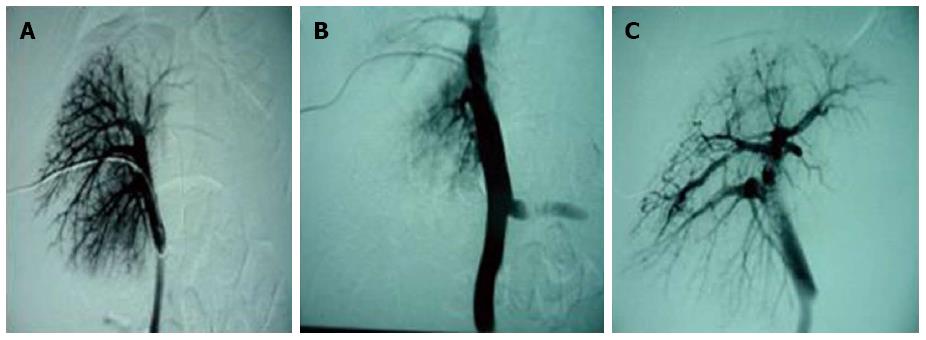
Changes in the portal vein: Immediately after perfusion, no changes in portal venous branches were observed in three animals from experimental group 1 or in any of the pigs from the control groups, while a slight decrease in portal venous branches (< level 4) was found in two animals from experimental group 1. In all animals in experimental groups 2 and 3, a significant reduction in portal venous branches (< level 3) (Figure 2A, B) was observed. In addition, a widened portal venous diameter (t2 = 9.679, P = 0.001; t3 = 17.800, P = 0.0001) and an increased portal venous pressure (t2 = 16.808, P = 0.0001; t3 = 13.431, P = 0.0002) were found. Two weeks after perfusion, different degrees of bypass branches of the intrahepatic portal vein were found in the experimental groups during the observation period (Figure 2C). The main portal venous diameter also varied significantly, and was still greater at 6 wk after perfusion than before perfusion (t2 = 4.007, P = 0.016; t3 = 2.870, P = 0.028). At this time point, the portal venous pressure was higher than that before perfusion (t2 = 3.586, P = 0.023; t3 = 3.927, P = 0.008) (Table 1 and Table 2). Before and after perfusion, no significant changes in portal venous diameter or pressure were observed in experimental group 1 or the control groups (diameter: t1 = 2.269, P = 0.086; tcontrol = 2.236, P = 0.076) (pressure: t1 = 0.885, P = 0.426; tcontrol = 0, P = 1.0) (Table 3 and Table 4).
| Portal venous diameter (mm) | Pressure (kPa) | Extrahepatic portal venous bypass | Intrahepatic portal venous bypass |
| Before perfusion (n = 5) | |||
| 1 | 10.3 | 1.4 | -- |
| 1 | 9.8 | 1.5 | -- |
| 1 | 11.4 | 1.4 | -- |
| 1 | 12.2 | 1.6 | -- |
| 1 | 10.0 | 1.5 | -- |
| mean ± SD | 10.74 ± 1.02 | 1.48 ± 0.84 | |
| Immediately after perfusion (n = 5) | |||
| 1 | 18.2 | 2.5 | -- |
| 1 | 17.1 | 2.7 | -- |
| 1 | 20.2 | 2.6 | -- |
| 1 | 16.7 | 2.9 | -- |
| 1 | 18.4 | 2.4 | -- |
| mean ± SD | 18.12 ± 1.37 | 2.62 ± 0.19 | |
| 2 wk after perfusion (n = 5) | |||
| 1 | 13.6 | 1.8 | -- |
| 1 | 12.7 | 2.1 | -+ |
| 1 | 14.5 | 2.0 | -+ |
| 1 | 13.3 | 2.4 | -- |
| 1 | 12.9 | 1.9 | -+ |
| mean ± SD | 13.40 ± 0.71 | 2.04 ± 0.23 | |
| 4 wk after perfusion (n = 5) | |||
| 1 | 12.3 | 1.6 | -+ |
| 1 | 11.8 | 1.9 | -+ |
| 1 | 14.1 | 1.5 | -+ |
| 1 | 13.1 | 2.1 | -+ |
| 1 | 11.7 | 1.7 | -+ |
| mean ± SD | 12.60 ± 1.00 | 2.04 ± 0.23 | |
| 6 wk after perfusion (n = 5) | |||
| 1 | 11.5 | 1.7 | -+ |
| 1 | 11.9 | 1.8 | -+ |
| 1 | 16.1 | 1.4 | -+ |
| 1 | 16.5 | 2.1 | -+ |
| 1 | 11.8 | 1.9 | -+ |
| mean ± SD | 13.56 ± 2.51 | 1.78 ± 0.26 |
| Portal venous diameter (mm) | Pressure (kPa) | Extrahepatic portal venous bypass | Intrahepatic portal venous bypass |
| Before perfusion (n = 5) | |||
| 1 | 9.5 | 1.2 | -- |
| 1 | 10.3 | 1.6 | -- |
| 1 | 11.5 | 1.4 | -- |
| 1 | 9.8 | 1.3 | -- |
| 1 | 12.4 | 1.5 | -- |
| mean ± SD | 10.70 ± 1.22 | 1.40 ± 0.16 | |
| Immediately after perfusion (n = 5) | |||
| 1 | 19.4 | 3.1 | -- |
| 1 | 18.6 | 3.3 | -- |
| 1 | 21.1 | 3.5 | -- |
| 1 | 17.9 | 2.8 | -- |
| 1 | 19.7 | 2.9 | -- |
| mean ± SD | 19.34 ± 1.21 | 3.12 ± 0.29 | |
| 2 wk after perfusion (n = 4) | |||
| 1 | 14.2 | 2.4 | -+ |
| 1 | 15.4 | 2.6 | -+ |
| 1 | 16.3 | 2.8 | -- |
| 1 | 16.6 | 2.6 | -+ |
| mean ± SD | 15.80 ± 3.66 | 2.60 ± 0.16 | |
| 4 wk after perfusion (n = 3) | |||
| 1 | 11.4 | 2.2 | -+ |
| 1 | 16.5 | 1.8 | -+ |
| 1 | 17.9 | 2.1 | -+ |
| mean ± SD | 15.63 ± 1.08 | 2.03 ± 0.21 | |
| 6 wk after perfusion (n = 3) | |||
| 1 | 11.6 | 2.1 | -+ |
| 1 | 18.3 | 1.7 | -+ |
| 1 | 17.5 | 1.9 | -+ |
| mean ± SD | 15.27 ± 3.36 | 1.90 ± 0.20 |
| Portal venous diameter (mm) | Pressure (kPa) | Extrahepatic portal venous bypass | Intrahepatic portal venous bypass |
| Before perfusion (n = 5) | |||
| 1 | 10.5 | 1.5 | -- |
| 1 | 10.3 | 1.7 | -- |
| 1 | 10.6 | 1.7 | -- |
| 1 | 11.4 | 1.6 | -- |
| 1 | 10.2 | 1.6 | -- |
| mean ± SD | 10.60 ± 0.47 | 1.62 ± 0.84 | |
| Immediately after perfusion (n = 5) | |||
| 1 | 10.5 | 1.6 | -- |
| 1 | 10.8 | 1.9 | -- |
| 1 | 10.9 | 1.6 | -- |
| 1 | 11.4 | 1.5 | -- |
| 1 | 10.5 | 1.8 | -- |
| mean ± SD | 10.82 ± 0.37 | 1.68 ± 0.16 | |
| 2 wk after perfusion (n = 5) | |||
| 1 | 11.0 | 1.7 | -- |
| 1 | 10.6 | 1.8 | -- |
| 1 | 11.1 | 1.7 | -- |
| 1 | 10.9 | 1.7 | -- |
| 1 | 11.2 | 1.6 | -- |
| mean ± SD | 10.98 ± 0.23 | 1.70 ± 0.07 | |
| 4 wk after perfusion (n = 5) | |||
| 1 | 11.3 | 1.6 | -- |
| 1 | 10.4 | 1.9 | -- |
| 1 | 10.7 | 1.5 | -- |
| 1 | 11.6 | 1.5 | -- |
| 1 | 11.5 | 1.8 | -- |
| mean ± SD | 11.10 ± 0.52 | 1.66 ± 0.18 | |
| 6 wk after perfusion (n = 5) | |||
| 1 | 11.7 | 1.6 | -- |
| 1 | 11.1 | 1.8 | -- |
| 1 | 10.3 | 1.4 | -- |
| 1 | 11.0 | 1.6 | -- |
| 1 | 11.4 | 1.8 | -- |
| mean ± SD | 15.27 ± 3.36 | 1.64 ± 0.17 |
| Portal venous diameter (mm) | Pressure (kPa) | Extrahepatic portal venous bypass | Intrahepatic portal venous bypass |
| Before perfusion (n = 6) | |||
| 1 | 10.3 | 1.3 | -- |
| 1 | 10.1 | 1.7 | -- |
| 1 | 10.7 | 1.5 | -- |
| 1 | 10.2 | 1.8 | -- |
| 1 | 9.6 | 1.5 | -- |
| 1 | 9.9 | 1.6 | -- |
| mean ± SD | 10.13 ± 0.37 | 1.57 ± 0.18 | |
| Immediately after perfusion (n = 6) | |||
| 1 | 10.3 | 1.4 | -- |
| 1 | 10.2 | 1.6 | -- |
| 1 | 10.7 | 1.5 | -- |
| 1 | 10.3 | 1.8 | -- |
| 1 | 9.7 | 1.6 | -- |
| 1 | 10.2 | 1.5 | -- |
| mean ± SD | 10.24 ± 0.32 | 1.57 ± 0.14 | |
| 2 wk after perfusion (n = 5) | |||
| 1 | 10.1 | 1.7 | -- |
| 1 | 10.3 | 1.8 | -- |
| 1 | 10.4 | 1.7 | -- |
| 1 | 10.6 | 1.7 | -- |
| 1 | 9.9 | 1.6 | -- |
| 1 | 10.3 | 1.7 | -- |
| mean ± SD | 10.27 ± 0.24 | 1.62 ± 0.12 | |
| 4 wk after perfusion (n = 6) | |||
| 1 | 10.4 | 1.4 | -- |
| 1 | 10.5 | 1.7 | -- |
| 1 | 10.4 | 1.6 | -- |
| 1 | 10.8 | 1.7 | -- |
| 1 | 9.8 | 1.5 | -- |
| 1 | 10.6 | 1.6 | -- |
| mean ± SD | 10.42 ± 0.34 | 1.58 ± 0.12 | |
| 6 wk after perfusion (n = 6) | |||
| 1 | 10.6 | 1.6 | -- |
| 1 | 10.3 | 1.8 | -- |
| 1 | 10.2 | 1.5 | -- |
| 1 | 10.6 | 1.6 | -- |
| 1 | 10.1 | 1.7 | -- |
| 1 | 10.4 | 1.7 | -- |
| mean ± SD | 10.37 ± 0.21 | 1.65 ± 0.10 |
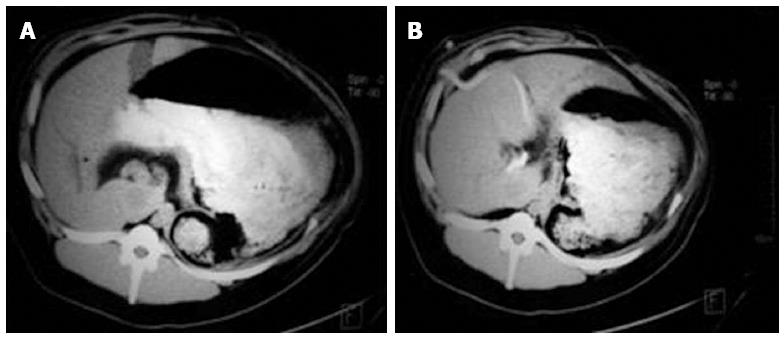
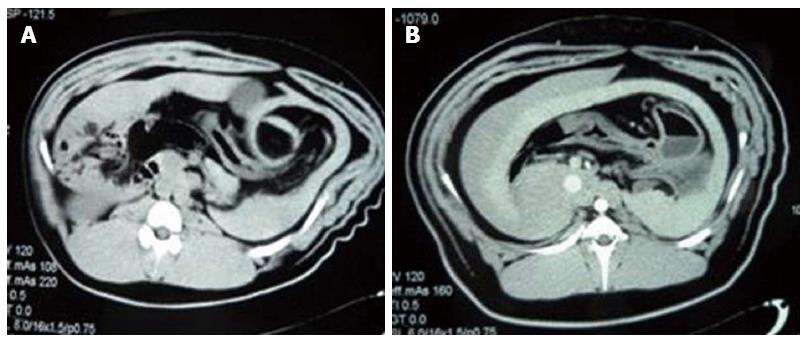
Changes in liver size and spleen size: A computed tomography scan revealed no significant changes in liver size and spleen size in experimental group 1 and the control groups (tliver = 0.740, P = 0.468; tspleen = 0.597, P = 0.557). At 6 wk after perfusion, both liver size and spleen size in all animals of experimental group 2 and the three surviving animals of experimental group 3 were greater than those before perfusion (tliver = 2.312, P = 0.036; tspleen = 2.209, P = 0.044), whilst maintaining a uniform density and regular edges (Figure 3A, B and Figure 4A, B) (Table 5).
| Liver size (cm3) | Spleen (cm3) | Avoirdupois (kg) | |
| Experimental groups 2 + 3 | |||
| Before perfusion | 508 ± 67 | 113 ± 38 | 32.9 ± 3.8 |
| 6 wk after perfusion | 589 ± 73 | 159 ± 46 | 40.7 ± 3.5 |
| Experimental group 1 + control groups | |||
| Before perfusion | 479 ± 85 | 102 ± 47 | 33.8 ± 2.9 |
| After perfusion | 504 ± 73 | 111 ± 39 | 39.5 ± 3.5 |
At 2 wk after perfusion, a slight increase in aminotransferase was observed in one animal from experimental group 1, all animals from experimental group 2 and the three surviving animals from experimental group 3, while other laboratory examination results were normal. Before perfusion and at 4 wk and 6 wk after perfusion, all laboratory examination results were within normal ranges in all animals from experimental group 2 and the control groups, as well as the three surviving animals from experimental group 3.
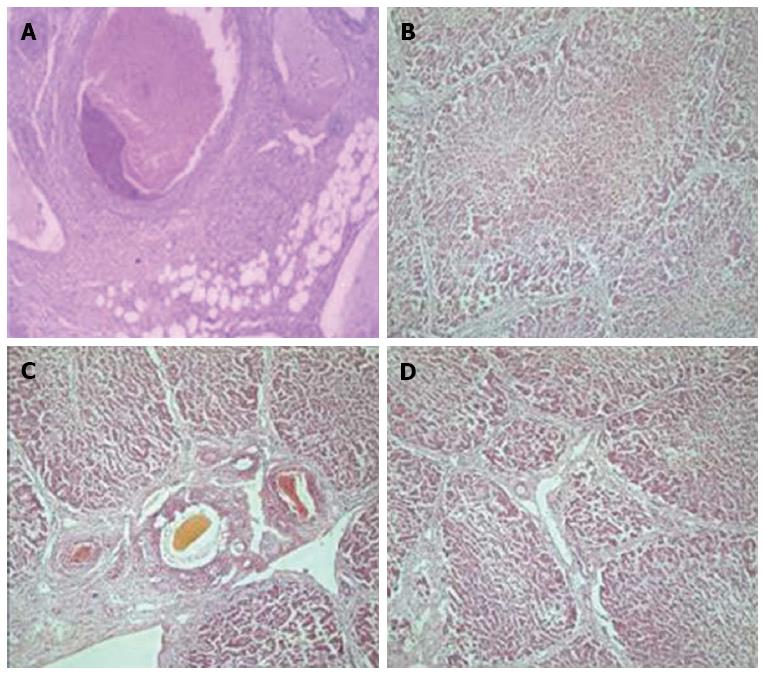
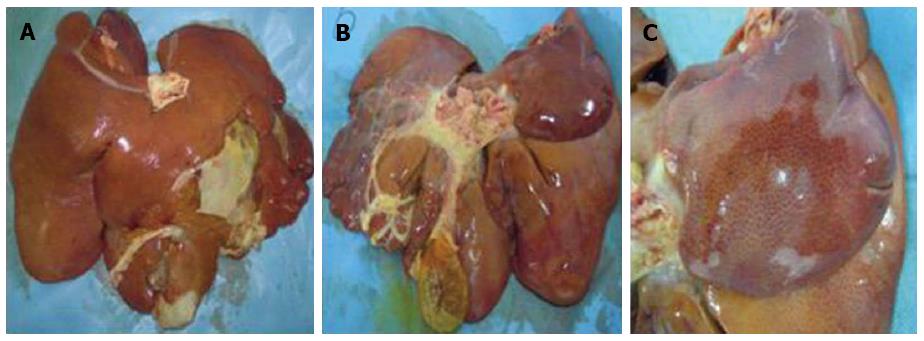
Pathological changes in the liver: After perfusion with 80% alcohol, thrombi formed in miniature and small hepatic blood vessels (Figure 5A), and early pathological changes such as endothelial injury, hepatocyte degeneration and necrosis (Figure 5B), and inflammatory cell infiltration were also observed. This was followed by the development of hepatic fibrosis as time increased. In experimental group 1, hepatic tissues had different degrees of fibrosis after surgery, up to level 4 (partial liver lobes), and one animal developed cirrhosis at 6 wk after perfusion, but did not die. In experimental group 2, all animals developed fibrosis postoperatively, with an increase in fibrosis level over time (Figure 5C). Fibrosis of the various liver lobes reached level 4, and developed into cirrhosis at different time points (Figure 5D), and the animals survived. In experimental group 3, one animal died at 1 wk and one died at 3 wk after surgery, and the remaining three animals developed different levels of fibrosis at different time points, which eventually reached level 4 and rapidly progressed to cirrhosis. A gross sample of cirrhotic liver was characterized by an increase in size, hardened tissues, decreased elasticity (Figure 6A, B), and small nodules uniformly distributed on the surface (Figure 6C). There was no change in fibrosis in any of the control animals (Table 6).
| Group | Venous hepatocyte thrombosis | Hepatocyte degeneration | Inflammatory cell necrosis | Endothelial cell infiltration injury |
| Experimental group 1 (n = 5) | 3 | 1 | 0 | 1 |
| Experimental group 2 (n = 5) | 5 | 4 | 2 | 3 |
| Experimental group 3 (n = 5) | 5 | 5 | 4 | 5 |
| Control group (n = 6) | 0 | 0 | 0 | 0 |
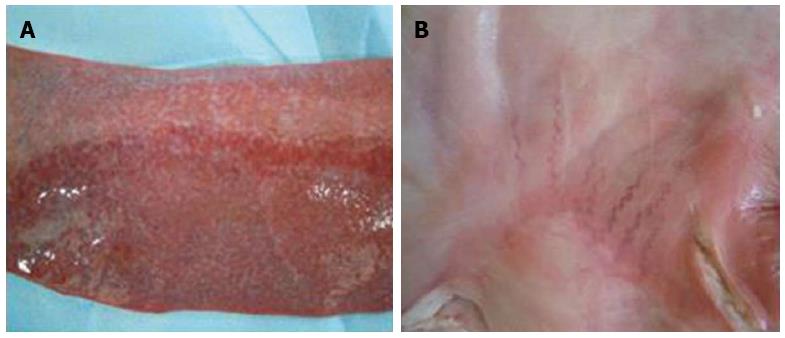
Pathological changes in other organs: The heart, lungs, kidneys and stomach of pigs in experimental group 1 and the control groups were all histologically normal. The spleen had different degrees of congestion in one animal from experimental group 1, all animals from experimental group 2 and the three surviving animals from experimental group 3 (Figure 7A). One animal from experimental group 2 and one animal from experimental group 3 had mild varicose veins on the stomach surface (Figure 7B).
Many methods have been used to establish a hepatic cirrhosis model, such as CCl4[5,6], thioacetamide[7], chemical carcinogen induction[8], alcohol[9], biliary obstruction[6,10,11], dystrophy induction[12], schistosome induction[13], and immunological mediation[14]. These modeling methods are mainly applicable to the following administration modes: oral administration, inhalation, subcutaneous injection, and intraperitoneal injection. They all require drug absorption followed by entry into various body systems, which tends to damage not only the liver, but also other tissues and organs, and more importantly, may even cause animal death. The dead animals may further result in environmental pollution. In addition, rats or mice are used as experimental animals in most cases, which have a small blood volume and therefore cannot undergo several serological tests and imaging examinations. Rats or mice have a small body size and thus relatively small blood vessels, and when used as experimental animals, it is difficult to determine the changes in the portal vein. In addition, surgical procedures are complicated on such small animals, along with intervention, mini-invasive surgery, and biopsy for collecting pathological tissues. It is also not possible to observe pathophysiological changes in the liver during the modeling process. More importantly, there is a large difference in the anatomy, normal physiological and biochemical values, and in the development process of disease between rat or mouse models and humans[15]. Some researchers have also used large animals such as dogs and baboons to establish specific hepatic cirrhosis or portal hypertension models[16,17], but these models are also significantly different from humans in terms of the developmental process of common posthepatitic or alcoholic cirrhosis and portal hypertension caused by hepatic cirrhosis. In this study, using a hepatic cirrhosis model established by perfusing porcine hepatic arteries with a high concentration of alcohol (80%), we were able to perform serological and imaging examinations, evaluate changes in the portal vein at different time points, and observe physiological changes in the pigs as well. In particular, we were able to investigate the pathological developmental process of hepatic cirrhosis by means of hepatic biopsy at different sites and at different time periods.
We used 80% alcohol for porcine hepatic arterial perfusion to establish a hepatic cirrhosis and portal hypertension model, and we observed and compared liver characteristics according to different perfusion doses. Our findings showed that hepatic fibrosis and cirrhosis occurred rapidly; hepatic fibrosis was observed as early as 1 wk after perfusion, and cirrhosis was found in some animals from experimental groups 2 and 3 as early as 2-3 wk. According to the literature, the occurrence of cirrhosis is usually reported 8 wk after perfusion[9,18]. In addition, our study demonstrated only a minor influence on liver function as a result of alcohol perfusion, and no injury to other important organs and tissues was observed during the development of hepatic cirrhosis, while previous reports have shown high hepatotoxicity[4]. The pathophysiological characteristics of hepatic cirrhosis and portal hypertension in our animal model were similar to those of early human posthepatitic and alcoholic cirrhosis, and were mainly demonstrated by the following results: (1) the serological examination was nearly normal; (2) the imaging examination showed an increase in liver size and spleen size, the formation of bypass circulation in the liver, and a widened main portal venous diameter; (3) some of the animals had increased portal venous pressure; and (4) hepatic biopsies at different sites and at different time periods confirmed the typical pathological development of hepatic cirrhosis. There was extensive hepatocyte generation and necrosis, as well as collapse of the liver lobule fibrous framework. The residual hepatocytes regenerated to form irregular, nodular hepatocyte masses (regenerative nodules). A large number of fibrous connective tissues proliferated to form fiber bundles and fibrous septa. The newly-formed fibrous septa connected with each other to enclose regenerative nodules or re-divide the residual liver lobules and remodel them into pseudo-lobules. The hepatic vascular bed was reduced, occluded, or distorted. The blood vessels were compressed by regenerative nodules. The normal relationship between intrahepatic portal veins, hepatic veins and small hepatic arterial branches was no longer present and communicating anastomotic branches were formed. Relatively uniform cirrhotic particles were observed on the liver surface, and the cirrhosis affected each liver lobe. Apart from the observation of splenic congestion caused by hepatic cirrhosis and mild varicose veins on the stomach surface of a few animals, other important organs and tissues were unaffected.
In experimental group 1, there was a long duration and a low success rate of modeling by perfusion with 80% alcohol, but the animals all survived. In experimental group 2, there was a moderate duration and a high success rate of modeling, and the animals all survived. In experimental group 3, there was a short duration and a high success rate of modeling, but the rate of animal death was significantly increased.
Establishing a large animal model of hepatic cirrhosis via a mini-invasive intervention is still in the exploratory phase. One study[19] has shown that when a porcine hepatic cirrhosis model is established by injecting an embolic agent containing 3:1 iodinated oil-alcohol into porcine hepatic arteries, the complex surgical procedure is challenging. Specifically, a metal spring loop is used to embolize non-target arteries, a micro-catheter is used to inject the embolic agent, and the portal venous pressure is measured indirectly by the hepatic venous pressure gradient (HVPG). As a result, total costs are markedly increased, the operation time is prolonged, tissue ischemia and necrosis within the embolization range of non-target blood vessels may occur, and large hepatic arteries may be embolized during injection of the embolic agent due to the properties of iodinated oil. In this experiment, 80% alcohol was slowly perfused into the left and right common hepatic arteries (away from the cystic and gastroduodenal arteries) via a 4F catheter, and then uniformly distributed into the liver by blood flow, based on the size and blood supply of the left and right hepatic arteries; and 1 mL 1% lidocaine was immediately injected after injection of 1 mL 80% alcohol until the dose of 80% alcohol was completely injected, to prevent spasm of large hepatic arteries. Only < level 3 hepatic arteries were embolized to preserve maximum blood and oxygen supply. After percutaneous hepatic portal vein puncture was successfully performed in all animals, a 6F multi-sidehole pigtail catheter was applied and lodged into the portal vein for phlebography and direct measurement of portal venous pressure and diameter. Therefore, this modeling method has many advantages, such as a simple surgical procedure, low costs, and the possibility of direct observation of changes in the portal vein and in portal venous pressure, as well as bypass branches and their distribution. Portal phlebography immediately after hepatic arterial perfusion with alcohol confirmed that alcohol passes through small arteries and enters into the hepatic sinus and subsequently small portal venous branches to produce combined hepatic arterial-portal venous embolization. Pavcinik et al[20] injected polyvinyl alcohol particles into porcine portal veins by percutaneous hepatic puncture to embolize portal venous branches to produce portal hypertension, however, 1 wk after the experiment they found that the portal venous pressure had decreased to the normal level, and hepatic cirrhosis did not develop. In a study of opposite hepatic decompensated hypertrophy after hepatic arterial embolization and portal venous embolization, Madoff et al[21] observed hepatocyte and endothelial injury, along with erythrocyte stagnation after injecting an embolic agent containing 3:1 iodinated oil-alcohol into porcine hepatic arteries, and 28 d after injecting polyvinyl alcohol particles into the portal veins and linearly embolizing the left and left-middle liver lobes, the histopathology showed atrophy of the portal vein region and interlobular septa in the embolized segments, without significant fibrosis. In the present study, hepatic biopsies were taken at different time points and pathological examination confirmed that hepatic arterial perfusion with different doses of 80% alcohol caused thrombosis in miniature and small hepatic arteries, portal venous branches and veins, as well as the hepatic sinus, and endothelial injury. This was followed by hepatocyte degeneration and necrosis, as well as inflammatory cell infiltration, which eventually developed into the typical pathophysiological process of hepatic cirrhosis. As reported in the literature, at 6-8 wk after surgery, hepatic histopathology showed fibrous septa and pseudo-lobules, but localized cirrhosis, which was not uniformly distributed, and fibrosis at different levels; and portal venous pressure increased in some animals, as measured indirectly by HVPG[18]. At 2 and 6 wk after perfusion, the local hepatic biopsy pathology and gross pathology in all animals in experimental group 2, and in the surviving animals in experimental group 3, confirmed that a hepatic cirrhosis model was successfully established, with the majority of fibrosis reaching level 4. Samples collected from each site were observed to have cirrhosis, and relatively uniform cirrhotic nodules were found on the surface of various liver lobes. These results suggest that the injuring effect of alcohol on the liver is uniform. In addition, the physiological changes in early hepatic cirrhosis and portal hypertension were also directly confirmed by portal phlebography and portal venous pressure measurement, such as the occlusion of portal venous branches, increased portal venous pressure, widening of portal venous diameters, and the formation of intrahepatic portal venous bypasses. A total of eight animals developed hepatic cirrhosis, including all animals in experimental group 2 and the surviving animals in experimental group 3, of which five animals had concomitant portal hypertension. Among the pathological samples collected at a total of 32 sites in the left and right lateral and medial liver lobes of each animal, only the samples at two sites were observed to have level 3 fibrosis and those at the remaining 30 sites had level 4 fibrosis. This also indicated that the injuring effect of alcohol on the liver was uniform. However, one study[19] using an embolic agent containing 3:1 iodinated oil-alcohol, reported that only 5 of 20 sites in the 16 mL group, and 4 of 20 sites in the 28 mL group had level 4 fibrosis, which suggests that the injuring effect on the liver is not uniform[19].
In our study, the deaths in experimental group 3 were mainly attributed to liver failure caused by extensive hepatic tissue necrosis and to postoperative infection.
In conclusion, at 2-6 wk after hepatic arterial perfusion with 80% alcohol, a porcine hepatic cirrhosis or cirrhotic portal hypertension model can be successfully established, with the typical pathophysiological development process of early hepatic cirrhosis, and with mild or no injury to other organs and tissues. The suitable dose of 80% alcohol for hepatic arterial perfusion in this experiment was the 12 mL dose used in experimental group 2, but the most suitable alcohol concentration or dose for establishing hepatic cirrhosis or cirrhotic portal hypertension models still needs further in-depth research and investigation.
In order to develop new strategies for the diagnosis and treatment of hepatic cirrhosis, it is essential to establish large animal models similar to humans, which are applicable for all-round research, especially models of hepatic cirrhosis for application in surgery, intervention and pharmaceutical research.
Establishing a large animal model of hepatic cirrhosis via a mini-invasive intervention is still in the exploratory phase and significant improvements have been made.
The authors developed a new method for establishing a porcine model of hepatic cirrhosis and portal hypertension by hepatic arterial perfusion with 80% alcohol, which accurately reproduced the pathophysiological development process similar to that occurring in humans.
The authors present a new method for establishing a porcine hepatic cirrhosis and portal hypertension model. The safety of this model depends on a suitable perfusion dose.
Portal hypertension is hypertension (high blood pressure) in the portal venous system, which is composed of the portal vein, and its branches and tributaries.
This is an interesting manuscript about a porcine hepatic cirrhosis and portal hypertension model. Tables and Figures are interesting.
P- Reviewer: Chang DZ, Okada H S- Editor: Yu J L- Editor: Wang TQ E- Editor: Zhang DN
| 1. | Starr SP, Raines D. Cirrhosis: diagnosis, management, and prevention. Am Fam Physician. 2011;84:1353-1359. [PubMed] [Cited in This Article: ] |
| 2. | Lok AS. Personalized treatment of hepatitis B. Clin Mol Hepatol. 2015;21:1-6. [PubMed] [DOI] [Cited in This Article: ] [Cited by in Crossref: 19] [Cited by in F6Publishing: 23] [Article Influence: 2.6] [Reference Citation Analysis (0)] |
| 3. | Louvet A, Mathurin P. Alcoholic liver disease: mechanisms of injury and targeted treatment. Nat Rev Gastroenterol Hepatol. 2015;12:231-242. [PubMed] [DOI] [Cited in This Article: ] [Cited by in Crossref: 476] [Cited by in F6Publishing: 558] [Article Influence: 62.0] [Reference Citation Analysis (0)] |
| 4. | Liu Y, Meyer C, Xu C, Weng H, Hellerbrand C, ten Dijke P, Dooley S. Animal models of chronic liver diseases. Am J Physiol Gastrointest Liver Physiol. 2013;304:G449-G468. [PubMed] [DOI] [Cited in This Article: ] [Cited by in Crossref: 146] [Cited by in F6Publishing: 139] [Article Influence: 12.6] [Reference Citation Analysis (0)] |
| 5. | Sakamoto M, Nakamura T, Torimura T, Iwamoto H, Masuda H, Koga H, Abe M, Hashimoto O, Ueno T, Sata M. Transplantation of endothelial progenitor cells ameliorates vascular dysfunction and portal hypertension in carbon tetrachloride-induced rat liver cirrhotic model. J Gastroenterol Hepatol. 2013;28:168-178. [PubMed] [Cited in This Article: ] |
| 6. | Marques TG, Chaib E, da Fonseca JH, Lourenço AC, Silva FD, Ribeiro MA, Galvão FH, D’Albuquerque LA. Review of experimental models for inducing hepatic cirrhosis by bile duct ligation and carbon tetrachloride injection. Acta Cir Bras. 2012;27:589-594. [PubMed] [Cited in This Article: ] |
| 7. | Albedaño Antoñanzas D, Alastuey Ederra M, Gaztelu Sanz FJ. [Nursing students learn in a primary care service]. Rev Enferm. 1990;13:32-37. [PubMed] [Cited in This Article: ] |
| 8. | Kim SK, Seo JM, Chae YR, Jung YS, Park JH, Kim YC. Alleviation of dimethylnitrosamine-induced liver injury and fibrosis by betaine supplementation in rats. Chem Biol Interact. 2009;177:204-211. [PubMed] [Cited in This Article: ] |
| 9. | Starkel P, Leclercq IA. Animal models for the study of hepatic fibrosis. Best Pract Res Clin Gastroenterol. 2011;25:319-333. [PubMed] [Cited in This Article: ] |
| 10. | Hsu SJ, Hsin IF, Lin YL, Chen YC, Huang HC, Lee FY, Lin HC, Chang CC, Lee SD. The influence of sorafenib on hepatic encephalopathy and the mechanistic survey in cirrhotic rats. Eur J Clin Invest. 2012;42:1309-1316. [PubMed] [Cited in This Article: ] |
| 11. | Chang CC, Chuang CL, Lee FY, Wang SS, Lin HC, Huang HC, Teng TH, Hsu SJ, Hsieh HG, Lee SD. Sorafenib treatment improves hepatopulmonary syndrome in rats with biliary cirrhosis. Clin Sci (Lond). 2013;124:457-466. [PubMed] [Cited in This Article: ] |
| 12. | Takeuchi-Yorimoto A, Noto T, Yamada A, Miyamae Y, Oishi Y, Matsumoto M. Persistent fibrosis in the liver of choline-deficient and iron-supplemented L-amino acid-defined diet-induced nonalcoholic steatohepatitis rat due to continuing oxidative stress after choline supplementation. Toxicol Appl Pharmacol. 2013;268:264-277. [PubMed] [DOI] [Cited in This Article: ] [Cited by in Crossref: 40] [Cited by in F6Publishing: 40] [Article Influence: 3.6] [Reference Citation Analysis (0)] |
| 13. | El-Lakkany NM, El-Maadawy W, Ain-Shoka A, Badawy A, Hammam O, Ebeid F. Potential antifibrotic effects of AT1 receptor antagonist, losartan, and/or praziquantel on acute and chronic experimental liver fibrosis induced by Schistosoma mansoni. Clin Exp Pharmacol Physiol. 2011;38:695-704. [PubMed] [DOI] [Cited in This Article: ] [Cited by in F6Publishing: 1] [Reference Citation Analysis (0)] |
| 14. | Zhang LX, Liang TJ, Tan YR, Ren WH, Han GQ, Zhang J, Wang LC, Qin CY. Protective effects of ursodeoxycholic acid against immune-mediated liver fibrosis in rats. Hepatogastroenterology. 2010;57:1196-1202. [PubMed] [Cited in This Article: ] |
| 15. | Weber SN, Wasmuth HE. Liver fibrosis: from animal models to mapping of human risk variants. Best Pract Res Clin Gastroenterol. 2010;24:635-646. [PubMed] [DOI] [Cited in This Article: ] [Cited by in Crossref: 16] [Cited by in F6Publishing: 15] [Article Influence: 1.1] [Reference Citation Analysis (0)] |
| 16. | Jin W, Deng L, Zhang Q, Lin D, Zhu J, Chen Y, Chen B, Li J. A canine portal hypertension model induced by intra-portal administration of Sephadex microsphere. J Gastroenterol Hepatol. 2010;25:778-785. [PubMed] [DOI] [Cited in This Article: ] [Cited by in Crossref: 10] [Cited by in F6Publishing: 10] [Article Influence: 0.7] [Reference Citation Analysis (0)] |
| 17. | Lieber CS, Leo MA, Cao Q, Ren C, DeCarli LM. Silymarin retards the progression of alcohol-induced hepatic fibrosis in baboons. J Clin Gastroenterol. 2003;37:336-339. [PubMed] [Cited in This Article: ] |
| 18. | Snowdon VK, Fallowfield JA. Models and mechanisms of fibrosis resolution. Alcohol Clin Exp Res. 2011;35:794-799. [PubMed] [DOI] [Cited in This Article: ] [Cited by in Crossref: 25] [Cited by in F6Publishing: 26] [Article Influence: 2.0] [Reference Citation Analysis (0)] |
| 19. | Avritscher R, Wright KC, Javadi S, Uthamanthil R, Gupta S, Gagea M, Bassett RL, Murthy R, Wallace MJ, Madoff DC. Development of a large animal model of cirrhosis and portal hypertension using hepatic transarterial embolization: a study in swine. J Vasc Interv Radiol. 2011;22:1329-1334. [PubMed] [Cited in This Article: ] |
| 20. | Pavcnik D, Saxon RR, Kubota Y, Tanihata H, Uchida BT, Corless C, Keller FS. Attempted induction of chronic portal venous hypertension with polyvinyl alcohol particles in swine. J Vasc Interv Radiol. 1997;8:123-128. [PubMed] [Cited in This Article: ] |
| 21. | Madoff DC, Gupta S, Pillsbury EP, Kan Z, Tinkey PT, Stephens LC, Ensor JE, Hicks ME, Wright KC. Transarterial versus transhepatic portal vein embolization to induce selective hepatic hypertrophy: a comparative study in swine. J Vasc Interv Radiol. 2007;18:79-93. [PubMed] [Cited in This Article: ] |


