

Abstract
The receptor for advanced glycation end products (RAGE) is a pattern recognition receptor that interacts with advanced glycation end products, but also with C3a, CpG DNA oligonucleotides, and alarmin molecules such as HMGB1 to initiate a proinflammatory reaction. Systemic lupus erythematosus is an autoimmune disorder associated with the accumulation of RAGE ligands. We generated mice invalidated for RAGE in the lupus-prone B6-MRL Fas lpr/j background to determine the role of RAGE in the pathogenesis of systemic lupus erythematosus. We compared the phenotype of these mice with that of their wild-type and B6-MRL Fas lpr/j littermates. Lymphoproliferative syndrome, production of anti-dsDNA Abs, lupus nephritis, and accumulation of CD3+B220+CD4−CD8− autoreactive T cells (in the peripheral blood and the spleen) were significantly increased in B6-MRL Fas lpr/j RAGE−/− mice compared with B6-MRL Fas lpr/j mice (respectively p < 0.005, p < 0.05, p < 0.001, and p < 0.001). A large proportion of autoreactive T cells from B6-MRL Fas lpr/j mice expressed RAGE at their surface. Time course studies of annexin V expression revealed that autoreactive T cells in the spleen of B6-MRL Fas lpr/j-RAGE−/− mice exhibited a delay in apoptosis and expressed significantly less activated caspase 3 (39.5 ± 4.3%) than T cells in B6-MRL Fas lpr/j mice (65.5 ± 5.2%) or wild-type mice (75.3 ± 2.64%) (p = 0.02). We conclude that the deletion of RAGE in B6-MRL Fas lpr/j mice promotes the accumulation of autoreactive CD3+B220+CD4−CD8− T cells, therefore exacerbating lymphoproliferative syndrome, autoimmunity, and organ injury. This suggests that RAGE rescues the apoptosis of T lymphocytes when the death receptor Fas/CD95 is dysfunctional.
Introduction
Receptor for advanced glycation end products (RAGE) is a cell surface receptor of the Ig superfamily and is involved in seminal processes such as cell migration, adhesion, and proliferation (1, 2). RAGE was first described as a binding partner for advanced glycation end products (AGEs) (3, 4); however, proteins from the S100 family, amyloid fibrils, high mobility group box 1 (HMGB1), C3a, and CpG DNA oligonucleotides are able to trigger a proinflammatory response via RAGE (5–7). Therefore, RAGE signaling is involved in the pathogenesis of several diseases, including vascular and neurodegenerative diseases, diabetes, cancer, and autoimmune disorders (8–11).
Systemic lupus erythematosus (SLE) is an autoimmune disease that affects several organs, such as the heart, skin, and kidneys (12, 13). Loss of self-tolerance to ubiquitous nuclear Ags is the underlying pathogenic mechanism leading to immunization (14, 15). Indeed, the defective removal of dead cells increases exposition to nuclear materials, whereas the presence of abnormally long-lived T and B cell clones accounts for the increased production of anti-nuclear Abs, immune complex disease, and T cell–dependent tissue damage (16–18). Thus, the aberrant survival of lymphocytes is a prominent feature of the disease.
This feature is recapitulated in animal models. One such model is the homozygous Murphy Roths large/lymphoproliferation mouse (B6-MRL/lpr or B6-MRL Fas lpr/j mice), which carries a loss of function mutation in the death receptor Fas/CD95 gene. Autoantibody concentration is high in B6-MRL Fas lpr/j mice that spontaneously develop massive lymphoproliferation and the visceral manifestations of SLE (19, 20).
We generated RAGE knockout mice in the B6-MRL Fas lpr/j background to investigate the role of RAGE in the physiopathology of SLE. In this study, we describe the phenotypic characteristics associated with RAGE deletion in this genetic background and suggest a possible underlying mechanism to account for this phenotype.
Materials and Methods
Animals
C57BL/6 and B6-MRL Fas lpr/j mice were purchased from Charles River Laboratories. RAGE−/− mice were backcrossed for >20 generations in the C57BL/6 background. All experiments were approved by the ethics committee for animal care and use of Reims Champagne Ardenne (CEEA-RCA-56). B6-MRL Fas lpr/j RAGE−/− mice were generated using a backcross-intercross scheme in the animal facility of New York University (A.M. Schmidt). Embryos from the F3 generation were then rederived, and mice obtained from the rederivation process were transferred to the animal facility of Reims. All animals were housed in a barrier, pathogen-free animal facility with a 12-h light-dark cycle and were fed a regular chow diet. MRL-Fas lpr/J and B6-MRL Fas lpr/j RAGE−/− littermates used in experiments were obtained after six generations of breeding. An average of 40 mice per group was analyzed. The number of mice per experiment is indicated in figure legends. Mice were genotyped for the Faslpr/lpr mutation and the RAGE deletion. Genomic DNA was extracted from mouse tails, and PCR was carried out with the following specific primers: MRL (P1, 5′-GTA AAT AAT TGT GCT TCG TCA G-3′; P2, 5′-TAG AAA GGT GCA CGG GTG TG-3′; and P3, 5′-CAA ATC TAG GCA TTA ACA GTG-3′) and RAGE (sense, 5′-CCT GGG TGC TGG TTC TTG-3′ and antisense, 5′-CTG AGG TCC GTG GCT AGG-3′) (Supplemental Fig. 1).
Microcomputed tomography imaging of mice
Animals were anesthetized by isoflurane (Forene; Abbott France, Rungis, France) inhalation (3% for induction and 1–1.5% for maintenance) and placed on a carbon fiber bed. Computed tomography images were acquired with a dedicated small animal μCT scanner (Skyscan 1076; Bruker, Kontich, Belgium). The camera was continuously rotated by 180°, and the following parameters were used for acquisition: 50 kV, 0.5 mm Al filter, 200 μA source current, 35 μm isotropic resolution, 180 ms exposure time, and 0.7° rotation step. The projections were reconstructed with a filtered backprojection algorithm in Skyscan software (NRecon; Skyscan). Reconstructed images were analyzed with Amira 5.4.3 software.
Histopathology
Kidneys were dissected, and one-half was fixed in formalin and embedded in paraffin for periodic acid Schiff staining. Lupus nephritis lesions were classified by a pathologist who was blind to genotype, according to the classification of the International Society of Nephrology/Renal Pathology Society (ISN/RPS 2003). The other half of the kidney was fixed in OCT and frozen at −80°C for immunostaining with FITC-conjugated anti-IgG Ab (Jackson ImmunoResearch Laboratories, West Grove, PA).
Preparation of splenocytes
Splenocytes were dissociated by crushing the spleen with a 2-ml syringe piston on a 70-μm filter (cell strainer; BD Biosciences, San Diego, CA) and were then rinsed prior to the lysis of erythrocytes by ACK buffer (144 mM NH4Cl, 17 mM Tris, and HCl to adjust pH to 7.2). Cells were then counted and cultured in complete medium.
Abs and flow cytometry analysis
Cells were stained with the following markers: V450-conjugated anti-CD45, PerCP-Cy 5.5–conjugated anti-CD3, allophycocyanin-Cy7–conjugated anti-CD8, PE CF594 anti-CD4, PE-Cy7–conjugated anti-CD19, and Alexa Fluor 700–conjugated anti-B220/CD45R. The following control isotypes were used: V450-conjugated IgG2b, allophycocyanin-Cy7–conjugated IgG2a, PE-CF594–conjugated IgG2a, PE-Cy7–conjugated IgG2a, and Alexa Fluor 700–conjugated IgG2a. We used an Ab to block the nonspecific Fc portion of Igs (purified rat anti-mouse CD16/CD32 [mouse BD Fc block]). All Abs were obtained from BD Pharmingen. Data were acquired with a LSRFortessa cell analyzer (BD Biosciences) and analyzed with FACSDiva software (BD Biosciences).
Peripheral blood hematology assessment
The absolute count of leukocytes in the peripheral blood of mice was determined by flow cytometry with special Trucount tubes (BD Biosciences), containing a known number of fluorescent beads. The absolute number (cells/μl) of positive cells in the sample was determined by comparing cellular events with bead events, according to the manufacturer’s instructions.
Measurement of lymphocyte activation and proliferation in vitro
Isolated splenocytes were cultured at a concentration of 2 × 10⁶ cells/ml in complete medium with or without CD3/CD28 beads (Dynabeads Mouse T-Activator CD3/CD28; Thermofischer Scientific, Waltham, MA). Cells were stained with PerCP-Cy 5.5–conjugated anti-CD3, allophycocyanin-conjugated CD69, and PE-conjugated CD25, and then analyzed by flow cytometry. Cell proliferation was assessed with Cell Proliferation eFluor Dye 670 (eBioscience, San Diego, CA), following the manufacturer’s instructions.
Measurement of RAGE expression on lymphocytes
Isolated spleen cells were cultured at a concentration of 2 × 10⁶ cells/ml in complete medium and activated with CD3/CD28 beads (Dynabeads Mouse T-Activator CD3/CD28; Thermofischer Scientific) for 24 h. At the indicated time points, cells were stained for CD45, CD3, CD45R/B220, CD4, CD8 (BD Biosciences), and RAGE using an IgG anti-mouse RAGE mAb, followed by an allophycocyanin-conjugated anti-rat IgG secondary Ab (R&D Systems).
Measurement of RAGE ligand concentrations
S100A12 and HMGB1 were measured with commercially available ELISA kits, according to the manufacturer’s instructions (My Biosource, San Diego, CA, catalog number MBS728991 for S100A12, and IBL International, Flughafenstraße, Hamburg, catalog number ST51011 for HMGB1). To assess the concentration of AGE in serum, carboxymethyllysine was measured in plasma samples by mass spectrometry coupled with liquid chromatography. Total AGE content (free adducts and protein linked) was measured.
Apoptosis
Splenocytes cultured in serum-free medium were collected at the indicated time points and stained for CD45, CD3, CD45R, annexin V, and propidium iodide (BD Biosciences). When indicated, cells were stained with PE active caspase-3 Ab (BD Biosciences).
Quantification of cytokines by cytometry bead array
We determined the serum concentration of cytokines (IL-1α, IL-2, IL-5, IL-6, IL-10, TNF-α, IFN-γ, IL-4, IL-17) by multiplex analysis (cytometric bead array) with a mouse Th1/Th2 kit (FlowCytomix; eBioscience), according to the protocol recommended by manufacturer. Data were acquired with the LSRFortessa cell analyzer (BD Biosciences) and FACSDiva software (BD Biosciences). Individual cytokine concentrations (pg/ml) were calculated from a standard reference curve produced with FlowCytomixPro 3.0 software.
Measurement of anti-dsDNA Ab titers and total IgG
Serum concentrations of IgG anti-dsDNA Abs were determined by ELISA with the mouse anti-dsDNA IgG-specific ELISA kit (Alpha Diagnostic International, San Antonio, TX). Total IgG was assessed with the Easy Titer kit, used according to the manufacturer’s instructions (Thermofischer Scientific).
Statistical analysis
Results were expressed as the mean ± SEM. Comparisons between two groups were carried out with the Mann–Whitney U test (for nonparametric data) or Kruskal–Wallis test when indicated, whereas comparisons between three or more groups were carried out with one-way ANOVA. A p value <0.05 was considered significant.
Results
RAGE deletion exacerbates lymphoproliferative syndrome, autoimmunity, and renal injury in B6-MRL Fas lpr/j mice
We analyzed the phenotype of mice deleted for RAGE in the B6-MRL-Fas lpr/j genetic background. Three groups of mice were compared, as follows: C57BL/6 wild-type (WT), B6-MRL-Fas lpr/j, and B6-MRL-Fas lpr/j RAGE−/− littermates.
WT animals did not exhibit any enlarged lymph nodes, whereas there were a few enlarged cervical and axillary nodes in B6-MRL-Fas lpr/j mice. Lymph nodes were extremely large in mice lacking RAGE, and both their number and the volume were significantly higher than in B6-MRL-Fas lpr/j mice (Fig. 1A, 1B). Microcomputed tomography analysis confirmed that lymph nodes in B6-MRL-Fas lpr/j RAGE−/− animals were significantly larger than those of their B6-MRL-Fas lpr/j littermates, with a mean volume of 255.48 ± 152.44 versus 31.45 ± 37.59 mm3, respectively (p = 0.01) (Fig. 1D, 1E). Invalidation of RAGE was also associated with an age-dependent enlargement of the spleen (Fig. 1B, 1C). These findings suggest that RAGE deletion in the B6-MRL-Fas lpr/j genetic background exacerbates lymphoproliferative disorder.
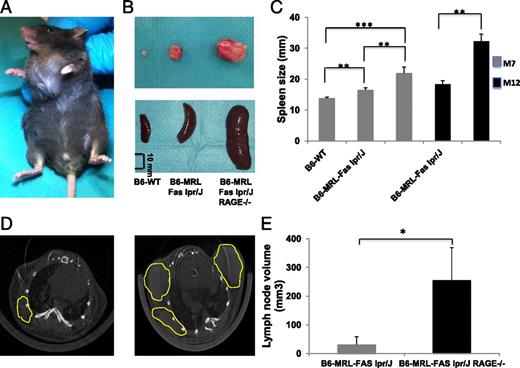
RAGE deficiency enhances lymphoproliferation in B6-MRL-Fas lpr/J mice. (A) Representative B6-MRL-Fas lpr/J RAGE−/− mouse aged 7 mo with massive cervical lymphadenopathy. (B) Representative lymph nodes and spleens from B6-WT, B6-MRL-Fas lpr/J, and B6-MRL-Fas lpr/J RAGE−/− mice (scale bar, 10 mm). (C) Spleen size of B6-WT (n = 11), B6-MRL-Fas lpr/J (n = 13), and B6-MRL-Fas lpr/J RAGE−/− (n = 14) mice (matched for age and sex). (D) Thoracic micro-computed tomography analysis of B6-MRL-Fas lpr/J (left) and B6-MRL-Fas lpr/J RAGE−/− mice (right) showing increased volume and number of nodes in RAGE-null animals. Axillary lymph nodes are circled in yellow. (E) Measurement and quantification of lymph nodes volume after three-dimensional reconstruction, using Amira software: B6-MRL-Fas lpr/J (n = 4) and B6-MRL-Fas lpr/J RAGE−/− (n = 5). Data shown are mean ± SEM. Statistical significance was assessed using the Mann–Whitney U test, *p < 0.05, ** p < 0.005, ***p < 0.0005.
RAGE deficiency enhances lymphoproliferation in B6-MRL-Fas lpr/J mice. (A) Representative B6-MRL-Fas lpr/J RAGE−/− mouse aged 7 mo with massive cervical lymphadenopathy. (B) Representative lymph nodes and spleens from B6-WT, B6-MRL-Fas lpr/J, and B6-MRL-Fas lpr/J RAGE−/− mice (scale bar, 10 mm). (C) Spleen size of B6-WT (n = 11), B6-MRL-Fas lpr/J (n = 13), and B6-MRL-Fas lpr/J RAGE−/− (n = 14) mice (matched for age and sex). (D) Thoracic micro-computed tomography analysis of B6-MRL-Fas lpr/J (left) and B6-MRL-Fas lpr/J RAGE−/− mice (right) showing increased volume and number of nodes in RAGE-null animals. Axillary lymph nodes are circled in yellow. (E) Measurement and quantification of lymph nodes volume after three-dimensional reconstruction, using Amira software: B6-MRL-Fas lpr/J (n = 4) and B6-MRL-Fas lpr/J RAGE−/− (n = 5). Data shown are mean ± SEM. Statistical significance was assessed using the Mann–Whitney U test, *p < 0.05, ** p < 0.005, ***p < 0.0005.
We measured serum concentrations of cytokines and autoantibodies to examine differences in autoimmunity between the three groups of mice. As expected, the B6-MRL-Fas lpr/j genetic background was associated with high concentrations of Th1 cytokines. Indeed, IL-6 and IFN-γ serum concentrations were significantly higher in B6-MRL-Fas lpr/j mice than in WT animals; however, serum cytokine concentrations were not statistically different between B6-MRL-Fas lpr/j animals and their B6-MRL-Fas lpr/j RAGE−/− littermates (Fig. 2A). Interestingly, serum concentrations of anti-dsDNA autoantibodies were significantly higher in B6-MRL-Fas lpr/j RAGE−/− mice (147.6 ± 20 UI/ml) than in B6-MRL-Fas lpr/j mice (83.3 ± 21 UI/ml, p = 0.05) and WT mice (12 ± 1.5 UI/ml, p < 0.001). This finding applied to both 7- and 12-mo-old mice (Fig. 2C).
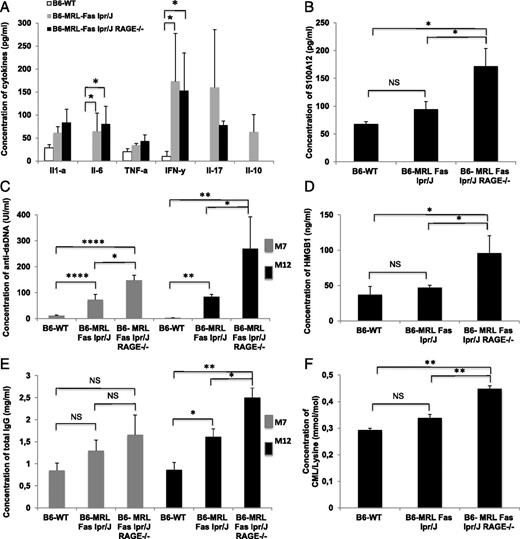
RAGE deletion exacerbates autoimmunity and inflammation in B6-MRL-Fas lpr/J mice. (A) Multiplex dosage analysis of cytokines by cytometric bead array (CBA) in sera collected from age- and sex-matched mice; B6-WT (n = 3), B6-MRL-Fas lpr/J (n = 10), and B6-MRL-Fas lpr/J RAGE−/− (n = 7). (B) Serum concentrations of S100A12 were assessed by ELISA. Sera were collected from age- and sex-matched mice; B6-WT (n = 4), B6-MRL-Fas lpr/J (n = 7), and B6-MRL-Fas lpr/J RAGE−/− (n = 5). (C) Serum concentrations of anti-dsDNA were assessed by ELISA. Sera were collected from sex- and age-matched mice. At 7 mo old, B6-WT (n = 13), B6-MRL-Fas lpr/J (n = 13), and B6-MRL-Fas lpr/J RAGE−/− (n = 12), and at 12 mo old, B6-WT (n = 4), B6-MRL-Fas lpr/J (n = 5), and B6-MRL-Fas lpr/J RAGE−/− (n = 5). (D) Serum concentrations of HMGB1 were assessed by ELISA. Sera were collected from sex- and age-matched mice; B6-WT (n = 3), B6-MRL-Fas lpr/J (n = 6), and B6-MRL-Fas lpr/J RAGE−/− (n = 5). (E) Serum concentrations of total IgG were assessed by ELISA. Sera were collected from sex- and age-matched mice. At 7 mo old, B6-WT (n = 5), B6-MRL-Fas lpr/J (n = 6), and B6-MRL-Fas lpr/J RAGE−/− (n = 5), and at 12 mo old, B6-WT (n = 5), B6-MRL-Fas lpr/J (n = 8), and B6-MRL-Fas lpr/J RAGE−/− (n = 7). (F) Data are shown as mean ± SEM. Statistical significance was assessed using the Mann–Whitney U test, *p < 0.05, **p < 0.005, ****p < 0.001.
RAGE deletion exacerbates autoimmunity and inflammation in B6-MRL-Fas lpr/J mice. (A) Multiplex dosage analysis of cytokines by cytometric bead array (CBA) in sera collected from age- and sex-matched mice; B6-WT (n = 3), B6-MRL-Fas lpr/J (n = 10), and B6-MRL-Fas lpr/J RAGE−/− (n = 7). (B) Serum concentrations of S100A12 were assessed by ELISA. Sera were collected from age- and sex-matched mice; B6-WT (n = 4), B6-MRL-Fas lpr/J (n = 7), and B6-MRL-Fas lpr/J RAGE−/− (n = 5). (C) Serum concentrations of anti-dsDNA were assessed by ELISA. Sera were collected from sex- and age-matched mice. At 7 mo old, B6-WT (n = 13), B6-MRL-Fas lpr/J (n = 13), and B6-MRL-Fas lpr/J RAGE−/− (n = 12), and at 12 mo old, B6-WT (n = 4), B6-MRL-Fas lpr/J (n = 5), and B6-MRL-Fas lpr/J RAGE−/− (n = 5). (D) Serum concentrations of HMGB1 were assessed by ELISA. Sera were collected from sex- and age-matched mice; B6-WT (n = 3), B6-MRL-Fas lpr/J (n = 6), and B6-MRL-Fas lpr/J RAGE−/− (n = 5). (E) Serum concentrations of total IgG were assessed by ELISA. Sera were collected from sex- and age-matched mice. At 7 mo old, B6-WT (n = 5), B6-MRL-Fas lpr/J (n = 6), and B6-MRL-Fas lpr/J RAGE−/− (n = 5), and at 12 mo old, B6-WT (n = 5), B6-MRL-Fas lpr/J (n = 8), and B6-MRL-Fas lpr/J RAGE−/− (n = 7). (F) Data are shown as mean ± SEM. Statistical significance was assessed using the Mann–Whitney U test, *p < 0.05, **p < 0.005, ****p < 0.001.
We also assessed total IgG levels for the three groups of mice at 7 and 12 mo of age. No significant differences were observed in 7-mo-old mice. However, at 12 mo of age, B6-MRL-Fas lpr/j mice had significantly higher IgG levels than WT animals (1.61 ± 0.5 mg/ml vs 0.86 ± 0.4 mg/ml; p < 0.05), and IgG levels were highest in animals deleted for RAGE (2.50 ± 0.6 mg/ml, p = 0.01 vs B6-MRL-Fas lpr/j mice and p < 0.005 vs WT) (Fig. 2E).
Inflammatory reactions stimulate the generation and release of RAGE ligands by inflammatory cells. We thus measured concentrations of RAGE ligands in the sera of the three groups of mice. B6-MRL-Fas lpr/j RAGE−/− animals had significantly higher serum levels of S100A12 than B6-MRL-Fas lpr/j and WT mice (172 ± 32 versus 94.64 pg/ml for B6-MRL-Fas lpr/j, p = 0.03 and 67.8 ± 4.31 pg/ml for WT, p = 0.01). The same was also true of HMGB1 levels, as follows: 96 ± 24.7 versus 47 ± 3.37 ng/ml for B6-MRL-Fas lpr/j, p = 0.02 and 37 ± 11.9 ng/ml for WT, p = 0.01. Similarly, serum levels of carboxymethyllysine were also higher in B6-MRL-Fas lpr/j RAGE−/− animals than in the other two groups (0.44 ± 0.02 versus 0.33 ± 0.03 for B6-MRL-Fas lpr/j mice, p = 0.03 and 0.44 ± 0.02 for WT animals) (Fig. 2B, 2D, 2F). These results suggest that the deletion of RAGE is associated with a highly proinflammatory environment.
We analyzed renal modifications associated with RAGE deletion in B6-MRL-Fas lpr/j mice to test whether the higher rate of lymphoproliferation and autoantibody production was associated with more severe organ injury in B6-MRL-Fas lpr/j RAGE−/− mice than in B6-MRL-Fas lpr/j mice. We characterized lupus nephritis according to endocapillary or extracapillary proliferation, subendothelial deposits, and inflammatory infiltrates (ISN/RPS 2003). Histological analysis based on these criteria showed significantly more focal or diffuse proliferation (class III and IV) and more active nephritis in B6-MRL-Fas lpr/j RAGE−/− mice than in B6-MRL-Fas lpr/j or WT animals. Furthermore, the accumulation of IgG immune complex deposits was more pronounced in kidneys from B6-MRL-Fas lpr/j RAGE−/− mice than in those from B6-MRL-Fas lpr/j mice (Fig. 3A–C). Spontaneous skin manifestations of alopecia and erythematosus lesions have been reported in the B6-MRL Fas lpr/j MRL lpr mice (21). They are usually located in the upper dorsal region of the mice and around the ears. Consistent with more severe renal injury in RAGE-invalidated animals, we also observed frequent cutaneous lesions in B6-MRL-Fas lpr/j RAGE−/− mice (Fig. 3D).
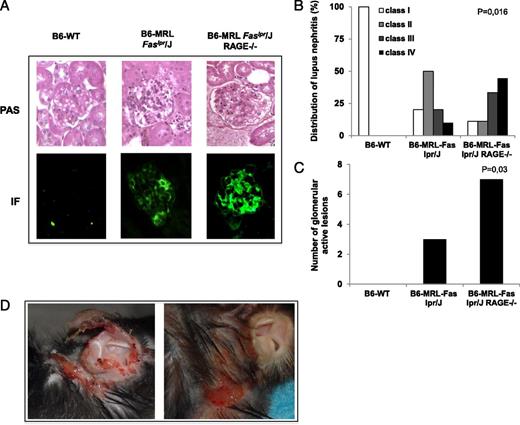
RAGE deletion promotes kidney and skin injury in B6-MRL-Fas lpr/J mice. (A) Representative picture of the kidneys showing exacerbated kidney damage in B6-MRL-Fas lpr/J RAGE−/− mice with diffuse mesangial proliferation and intense IgG deposition in the glomeruli. Kidneys were stained with periodic acid Schiff for histologic assessment and with anti-IgG for immunofluorescence (original magnification ×10). (B) Repartition of renal lesions according to the International Society of Nephrology/Renal Pathology Society (ISN/RPS) 2003 classification of lupus nephritis: B6-WT (n = 3), B6-MRL-Fas lpr/J (n = 10), and B6-MRL-Fas lpr/J RAGE−/− (n = 9) age-matched mice. Class I: minimal mesangial lupus nephritis. Class II: mesangial proliferative lupus nephritis. Class III: focal lupus nephritis. Class IV: diffuse lupus nephritis. Statistical significance was assessed using the Kruskall–Wallis test, p = 0.016. (C) Quantification of active lesions defined by presence of proliferating lupus nephritis. Statistical significance was assessed using the Kruskall–Wallis test, p = 0.03. (D) Representative picture of autoimmune skin and ear injury in old B6-MRL-Fas lpr/J RAGE−/− mice.
RAGE deletion promotes kidney and skin injury in B6-MRL-Fas lpr/J mice. (A) Representative picture of the kidneys showing exacerbated kidney damage in B6-MRL-Fas lpr/J RAGE−/− mice with diffuse mesangial proliferation and intense IgG deposition in the glomeruli. Kidneys were stained with periodic acid Schiff for histologic assessment and with anti-IgG for immunofluorescence (original magnification ×10). (B) Repartition of renal lesions according to the International Society of Nephrology/Renal Pathology Society (ISN/RPS) 2003 classification of lupus nephritis: B6-WT (n = 3), B6-MRL-Fas lpr/J (n = 10), and B6-MRL-Fas lpr/J RAGE−/− (n = 9) age-matched mice. Class I: minimal mesangial lupus nephritis. Class II: mesangial proliferative lupus nephritis. Class III: focal lupus nephritis. Class IV: diffuse lupus nephritis. Statistical significance was assessed using the Kruskall–Wallis test, p = 0.016. (C) Quantification of active lesions defined by presence of proliferating lupus nephritis. Statistical significance was assessed using the Kruskall–Wallis test, p = 0.03. (D) Representative picture of autoimmune skin and ear injury in old B6-MRL-Fas lpr/J RAGE−/− mice.
Overall, these results suggest that RAGE deletion in the B6-MRL-Fas lpr/j genetic background accelerates the development of lymphoproliferative syndrome, as well as that of the autoimmune, clinical, and biological manifestations of SLE.
RAGE deletion promotes the accumulation of autoreactive lymphocytes in peripheral blood and spleen
To characterize further lymphoproliferative syndrome in B6-MRL-Fas lpr/j RAGE−/− mice, we used flow cytometry to analyze the effect of RAGE deletion on the cellular composition of peripheral blood and the spleen. The number of CD45+CD3−CD19− cells in peripheral blood was significantly lower in B6-MRL-Fas lpr/j RAGE−/− mice (725 ± 49 cells/μl) than in B6-MRL-Fas lpr/j mice (2051 ± 391 cells/μl, p < 0.05) or WT mice (1162 ± 375, p < 0.05). Similarly, the number of circulating CD19+CD3− B lymphocytes was lower in RAGE-deficient animals (375 ± 37 cells/μl) than in B6-MRL-Fas lpr/j mice (1576 ± 242 cells/μl, p < 0.05) or WT mice (1117 ± 150 cells/μl, p < 0.05). However, there was a significantly higher number of circulating CD3+ cells in B6-MRL-Fas lpr/j RAGE−/− animals (6229 ± 892 cells/μl) than in B6-MRL-Fas lpr/j mice (2875 ± 191, p < 0.05) or WT mice (1506 ± 221, p < 0.05) (Fig. 4A, Supplemental Fig. 3). Characterization of the CD3+ population showed that the excess of T cells in mice lacking RAGE was largely due to the presence of a high number of double-negative autoreactive lymphocytes, B220+CD4−CD8−: 1924 ± 357 cells/μl in B6-MRL-Fas lpr/j RAGE−/− versus 145 ± 21 cells/μl for B6-MRL-Fas lpr/j RAGE−/− mice and 4 ± 2 cells/μl in WT mice (p < 0.05) (Fig. 4B).

RAGE deficiency increases accumulation of autoreactive CD3+B220+ double-negative CD4−CD8− T lymphocytes in the peripheral blood and spleen of B6-MRL-Fas lpr/J mice. WBC suspensions were prepared from the blood of age-matched B6-WT, B6-MRL-Fas lpr/J, and B6-MRL-Fas lpr/J RAGE−/− mice. Cells were stained with fluorochrome-labeled Abs against pan-leukocyte CD45, CD3, CD19, CD4, CD8, and B220. Hematologic analysis and quantification of CD45+, CD3+, CD19+, and CD3−CD19− cells (A) and CD3+ subsets from peripheral blood (B) are shown. B6-WT mice (n = 5), B6-MRL-Fas lpr/J mice (n = 6), B6-MRL-Fas lpr/J RAGE−/− mice (n = 6). (C) Graph shows the total number of cells in the spleen for each strain of age- and sex-matched mice (n = 6 /group). (D) Splenocytes were then stained with the same markers used for peripheral blood. The absolute number of the different cell populations is shown in the graph (CD45+, CD3+, CD19+, and CD3−CD19−). (E) Mean number of CD3+ spleen cell subsets in B6-WT mice (n = 7), B6-MRL-Fas lpr/J mice (n = 7), and B6-MRL-Fas lpr/J RAGE−/− mice (n = 7). Statistical significance was assessed using the Mann–Whitney U test, *p < 0.05, **p < 0.005, ***p < 0.0005.
RAGE deficiency increases accumulation of autoreactive CD3+B220+ double-negative CD4−CD8− T lymphocytes in the peripheral blood and spleen of B6-MRL-Fas lpr/J mice. WBC suspensions were prepared from the blood of age-matched B6-WT, B6-MRL-Fas lpr/J, and B6-MRL-Fas lpr/J RAGE−/− mice. Cells were stained with fluorochrome-labeled Abs against pan-leukocyte CD45, CD3, CD19, CD4, CD8, and B220. Hematologic analysis and quantification of CD45+, CD3+, CD19+, and CD3−CD19− cells (A) and CD3+ subsets from peripheral blood (B) are shown. B6-WT mice (n = 5), B6-MRL-Fas lpr/J mice (n = 6), B6-MRL-Fas lpr/J RAGE−/− mice (n = 6). (C) Graph shows the total number of cells in the spleen for each strain of age- and sex-matched mice (n = 6 /group). (D) Splenocytes were then stained with the same markers used for peripheral blood. The absolute number of the different cell populations is shown in the graph (CD45+, CD3+, CD19+, and CD3−CD19−). (E) Mean number of CD3+ spleen cell subsets in B6-WT mice (n = 7), B6-MRL-Fas lpr/J mice (n = 7), and B6-MRL-Fas lpr/J RAGE−/− mice (n = 7). Statistical significance was assessed using the Mann–Whitney U test, *p < 0.05, **p < 0.005, ***p < 0.0005.
In agreement with macroscopic examination showing an enlarged spleen, the number of lymphoid cells in the spleen was significantly higher in B6-MRL-Fas lpr/j RAGE−/− mice (538 × 106 ± 104 × 106) than in B6-MRL-Fas lpr/j mice (279 × 106 ± 36 × 106, p < 0.001) or WT mice (132 × 106 ± 10 × 106, p < 0.001) (Fig. 4C). Western blot analysis confirmed the lack of RAGE protein in RAGE-null spleen cells (Fig. 4D). The number of CD19+ cells in the spleen of RAGE-null mice (72.6 ± 10.4 × 10⁶) tended to be higher than in B6-MRL-Fas lpr/j mice (46.7 ± 18.46 × 10⁶, p = NS) and was significantly higher than in WT mice (51.8 ± 5.5 × 10⁶, p = 0.05) (Fig. 4E). However, the most notable observation was a massive accumulation of CD3+ cells in the spleen of B6-MRL-Fas lpr/j RAGE−/− animals: there were 414.8 ± 89.6 × 10⁶ CD3+ cells in the spleen of mice lacking RAGE versus 144.7 ± 21 × 106 in B6-MRL-Fas lpr/j mice, p < 0.001 and 46.1 ± 5.3 × 10⁶ in WT mice, p < 0.001 (Fig. 4E). The excess of CD3+ cells in the spleen of mice deficient in RAGE were mostly B220+CD4−CD8- autoreactive T lymphocytes, consistent with findings in peripheral blood (Fig. 4E).
We examined in more detail the markers expressed on the surface of the CD3+ T cells retrieved from the spleen (Fig. 5). The percentage of CD25+ cells was low and similar between the three genotypes. The proportion of CD69+ T cells in the spleen was similar between B6-MRL-Fas lpr/j and B6-MRL-Fas lpr/j RAGE−/− mice (40.3 ± 5.04% and 39.08 ± 5.25%, respectively) and was significantly higher than in the spleen of WT mice (7.94 ± 1.7%, p < 0.01 for both pairwise comparisons). The number of double-positive cells (CD25+CD69+) in the spleen was moderately higher in both B6-MRL-Fas lpr/j (12.65 ± 5.25%) and B6-MRL-Fas lpr/j RAGE−/− mice (8.67 ± 1.91%) than in WT mice (2.71 ± 0.71%) (p < 0.001 versus B6-MRL-Fas lpr/j, and p < 0.05 versus B6-MRL-Fas lpr/j RAGE−/−) (Fig. 5A, Supplemental Fig. 2). We also examined the response of T cells to stimulation. WT CD3+ lymphocytes incubated with CD3/CD28 beads for 72 h expressed almost 10 times more CD25 than unstimulated cells, whereas stimulated CD3+ T cells from B6-MRL-Fas lpr/j or B6-MRL-Fas lpr/j RAGE−/− mice expressed only two times more CD25 than unstimulated cells (p = 0.05 versus WT) (Fig. 5B, 5C, Supplemental Fig. 2). Thus, the B6-MRL-Fas lpr/j background is associated with the accumulation of preactivated autoreactive B and T cells.

Analysis of T cell activation markers. (A) Splenocyte suspensions from age-matched B6-WT, B6-MRL-Fas lpr/J, and B6-MRL-Fas lpr/J RAGE−/− mice were freshly prepared and stained with fluorochrome-labeled Abs against CD3, the IL-2R CD25, and the activation marker CD69. Graph shows the mean percentage of CD3+CD25+, CD3+CD69+, and CD3+CD25+CD69+ spleen cells in B6-WT (n = 9), B6-MRL-Fas lpr/J (n = 8), B6-MRL-Fas lpr/J RAGE−/− mice (n = 8). (B) Spleen cells were cultivated with or without CD3/CD28 beads for 3 d. Graph shows the FACS analysis plot of cells for each strain. (C) Proportion of CD25+ cells before and after stimulation in each group; B6-WT (n = 3), B6-MRL-Fas lpr/J (n = 4), B6-MRL-Fas lpr/J RAGE−/− mice (n = 5). Data are shown as mean ± SEM. Statistical significance was assessed using the Mann–Whitney U test, *p < 0.05, **p < 0.005, ***p < 0.0005.
Analysis of T cell activation markers. (A) Splenocyte suspensions from age-matched B6-WT, B6-MRL-Fas lpr/J, and B6-MRL-Fas lpr/J RAGE−/− mice were freshly prepared and stained with fluorochrome-labeled Abs against CD3, the IL-2R CD25, and the activation marker CD69. Graph shows the mean percentage of CD3+CD25+, CD3+CD69+, and CD3+CD25+CD69+ spleen cells in B6-WT (n = 9), B6-MRL-Fas lpr/J (n = 8), B6-MRL-Fas lpr/J RAGE−/− mice (n = 8). (B) Spleen cells were cultivated with or without CD3/CD28 beads for 3 d. Graph shows the FACS analysis plot of cells for each strain. (C) Proportion of CD25+ cells before and after stimulation in each group; B6-WT (n = 3), B6-MRL-Fas lpr/J (n = 4), B6-MRL-Fas lpr/J RAGE−/− mice (n = 5). Data are shown as mean ± SEM. Statistical significance was assessed using the Mann–Whitney U test, *p < 0.05, **p < 0.005, ***p < 0.0005.
We then analyzed RAGE expression on CD3+ T cells isolated from the spleen (Fig. 6). RAGE was detected on the surface of freshly isolated CD3+ spleen cells from WT and B6-MRL-Fas lpr/j mice (3.4 ± 0.57% and 12 ± 0.21% of cells, respectively). However, no significant staining was seen on CD3+ T cells isolated from B6-MRL-Fas lpr/j RAGE−/− mice (0.2 ± 0.1%). Stimulation with CD3/CD28 beads for 24 h further promoted the accumulation of RAGE-positive CD3+ spleen cells from WT (4.6 ± 0.5%) and B6-MRL-Fas lpr/j mice (20.93 ± 0.3%) (Fig. 6A, 6B). A large proportion of the subpopulation of CD3+B220+CD4−CD8− autoreactive T cells retrieved from the spleen of B6-MRL-Fas lpr/j mice stained positive for RAGE at their surface (28.3 ± 1.27%), and this number was increased by CD3/CD28 stimulation (41.4 ± 0.6%).

RAGE is expressed on splenocytes and autoreactive T cells in B6-MRL-Fas lpr/J mice. To assess RAGE expression, spleen cells were isolated and stained with fluorochrome-labeled Abs against pan-leukocyte CD3, CD19, and B220 and IgG anti-mouse RAGE mAb, followed by allophycocyanin-conjugated anti-rat IgG secondary Ab. Staining was done both on resting cells and after activation with CD3/CD28 beads for 24 h: B6-WT (n = 4), B6-MRL-Fas lpr/J (n = 4), and B6-MRL-Fas lpr/J RAGE−/− (n = 4). (A) Plot is a representative FACS analysis of at least three independent experiments analyzing RAGE expression on CD3+ cells from each strain. (B) Graph represents the percentage of RAGE expression on spleen CD3+ cells at H0 and after 24 h of activation. (C) Representative plot and (D) graph of RAGE expression on autoreactive CD3+B220+CD4−CD8− spleen cells from B6-MRL-Fas lpr/J mice. Data are shown as mean ± SEM. Statistical significance was assessed using the Mann–Whitney U test, *p < 0.05. (E) Western blot analysis of spleen cell lysates showing the lack of RAGE protein in B6-MRL-Fas lpr/J RAGE−/− spleen cells.
RAGE is expressed on splenocytes and autoreactive T cells in B6-MRL-Fas lpr/J mice. To assess RAGE expression, spleen cells were isolated and stained with fluorochrome-labeled Abs against pan-leukocyte CD3, CD19, and B220 and IgG anti-mouse RAGE mAb, followed by allophycocyanin-conjugated anti-rat IgG secondary Ab. Staining was done both on resting cells and after activation with CD3/CD28 beads for 24 h: B6-WT (n = 4), B6-MRL-Fas lpr/J (n = 4), and B6-MRL-Fas lpr/J RAGE−/− (n = 4). (A) Plot is a representative FACS analysis of at least three independent experiments analyzing RAGE expression on CD3+ cells from each strain. (B) Graph represents the percentage of RAGE expression on spleen CD3+ cells at H0 and after 24 h of activation. (C) Representative plot and (D) graph of RAGE expression on autoreactive CD3+B220+CD4−CD8− spleen cells from B6-MRL-Fas lpr/J mice. Data are shown as mean ± SEM. Statistical significance was assessed using the Mann–Whitney U test, *p < 0.05. (E) Western blot analysis of spleen cell lysates showing the lack of RAGE protein in B6-MRL-Fas lpr/J RAGE−/− spleen cells.
Taken together, these results suggest that CD3+B220+CD4−CD8− autoreactive T cells express RAGE at their surface, and that invalidation of RAGE promotes the accumulation of these autoreactive T lymphocytes, leading to severe lymphoproliferative syndrome and tissular lesions.
RAGE deletion delays the apoptosis of autoreactive T lymphocytes
We examined the proliferative response of spleen T lymphocytes to identify the mechanism underlying the accumulation of autoreactive T lymphocytes. Stimulation of WT CD3+ T lymphocytes with CD3/CD28 beads for 72 h resulted in the proliferation of 74 ± 9.2% of cells, whereas no significant proliferation was induced in B6-MRL-Fas lpr/j or B6-MRL-Fas lpr/j RAGE−/− CD3+ T lymphocytes (Fig. 7A, 7B). This result suggests that the accumulation of autoreactive T lymphocytes is not related to a higher rate of cell proliferation. We therefore analyzed apoptosis in CD3+ T lymphocytes. Cells were maintained in serum-free medium for 48 h, and the percentage of cells expressing active caspase 3 was analyzed. Interestingly, the expression of active caspase 3 was lowest among autoreactive CD3+B220+ double-negative (DN) T lymphocytes from B6-MRL-Fas-lpr/j RAGE−/− mice, as follows: 39.5 ± 4.3% of these cells expressed active caspase 3 compared with 65.5 ± 5.2% of B6-MRL-Fas lpr/j CD3+B220+ DN cells (p = 0.02) and 75.3 ± 2.64% of WT cells (p = 0.02) (Fig. 7C, 7D). We confirmed this defect of apoptosis with time course studies of annexin V expression. The proportion of CD3+B220+DN B6-MRL-Fas-lpr/j RAGE−/− cells positive for annexin V was low at 4 h and increased moderately over time (26.5 ± 4.15% at 4 h, and 46.1 ± 5.6% at 72 h). In comparison, the proportion of CD3+B220+DN B6-MRL-Fas-lpr/j cells positive for annexin V was significantly higher (42.6 ± 3.6% at 4 h, p < 0.05, and 83.6 ± 3.7% at 72 h, p < 0.05) (Fig. 7E, 7F). Consistent with these observations, the percentage of living CD3+B220+DN cells (negative staining for annexin V and propidium iodide) after 72 h of culture was higher for the B6-MRL-Fas-lpr/j RAGE−/− genotype (49.4 ± 2.1%) than for the B6-MRL-Fas lpr/j genotype (3.8 ± 1.31%, p < 0.001) or the WT genotype (0.9 ± 0.2%, p < 0.001) (Fig. 7G).

RAGE deletion impairs the apoptosis of autoreactive T cells in B6-MRL-Fas lpr/J mice. (A) Spleen cells were stained with a fluorescent probe (prolif eFluor) and then stimulated with CD3/CD28 beads for 3 d, B6-WT (n = 3), B6-MRL-Fas lpr/J (n = 4), and B6-MRL-Fas lpr/J RAGE−/− (n = 4). The proliferation of CD3+ cells was assessed by flow cytometry. Plot is a representative FACS analysis of at least three independent experiments analyzing cell proliferation for each strain. (B) Graph shows the percentage of proliferating CD3+ lymphocytes. Data are shown as mean ± SEM. (C) For the analysis of apoptosis, spleen cells were cultivated for 48 h in serum-free medium; B6-WT (n = 4), B6-MRL-Fas lpr/J (n = 4), B6-MRL-Fas lpr/J RAGE−/− (n = 4). Cells were then stained for CD3, B220, and apoptotic markers allophycocyanin-labeled annexin V and propidium iodide or intracellular active caspase 3. Cells were then analyzed by flow cytometry. (C) Representative plot of FACS analysis of caspase 3 expression in CD3+B220+ cells for each mouse strain. (D) Percentage of CD3+B220+ cells expressing active caspase 3. Data are shown as mean ± SEM. (E) Representative dot plots of annexin V-PI staining for CD3+B220+ cells. The percentage of annexin V+ cells (F) and the percentage of living cells (double negative, annexin V-PI−) (G) is shown. Data are shown as mean ± SEM. Statistical significance was assessed using the Mann–Whitney U test, *p < 0.05.
RAGE deletion impairs the apoptosis of autoreactive T cells in B6-MRL-Fas lpr/J mice. (A) Spleen cells were stained with a fluorescent probe (prolif eFluor) and then stimulated with CD3/CD28 beads for 3 d, B6-WT (n = 3), B6-MRL-Fas lpr/J (n = 4), and B6-MRL-Fas lpr/J RAGE−/− (n = 4). The proliferation of CD3+ cells was assessed by flow cytometry. Plot is a representative FACS analysis of at least three independent experiments analyzing cell proliferation for each strain. (B) Graph shows the percentage of proliferating CD3+ lymphocytes. Data are shown as mean ± SEM. (C) For the analysis of apoptosis, spleen cells were cultivated for 48 h in serum-free medium; B6-WT (n = 4), B6-MRL-Fas lpr/J (n = 4), B6-MRL-Fas lpr/J RAGE−/− (n = 4). Cells were then stained for CD3, B220, and apoptotic markers allophycocyanin-labeled annexin V and propidium iodide or intracellular active caspase 3. Cells were then analyzed by flow cytometry. (C) Representative plot of FACS analysis of caspase 3 expression in CD3+B220+ cells for each mouse strain. (D) Percentage of CD3+B220+ cells expressing active caspase 3. Data are shown as mean ± SEM. (E) Representative dot plots of annexin V-PI staining for CD3+B220+ cells. The percentage of annexin V+ cells (F) and the percentage of living cells (double negative, annexin V-PI−) (G) is shown. Data are shown as mean ± SEM. Statistical significance was assessed using the Mann–Whitney U test, *p < 0.05.
Taken together, these results suggest that RAGE deletion delays the apoptosis of CD3+B220+ autoreactive T lymphocytes, thus promoting the survival of these cells, their accumulation in lymphoid organs, and severe damage to organs.
Discussion
RAGE is a pattern recognition receptor involved in acute and chronic stress responses. A large variety of molecules has been reported to trigger RAGE signaling, including proteins involved in inflammatory processes. Among them, the alarmin HMGB1 is released from the nucleus of damaged cells and links RAGE to autoimmune disorders such as systemic lupus erythematosus through several mechanisms. First, the interaction of HMGB1 with RAGE is thought to participate in the progression of systemic disease by stimulating TLR9-mediated proliferation of autoreactive B cell clones (22). Second, RAGE expression is upregulated in the kidneys of SLE patients (23), and signaling through HMGB1-RAGE activates mesangial cells in vitro, therefore suggesting a role for the RAGE axis in the progression of lupus nephritis (24). Furthermore, other alarmin molecules such as C3a as well as CpG DNA oligos are able to bind to RAGE and stimulate IFN-α production by human PBMCs in a RAGE-dependent manner (25, 26).
Despite these findings, the exact role of RAGE in the course of SLE is not firmly established. We addressed this question by generating mice lacking RAGE in the B6-MRL Fas lpr/j background.
B6-MRL Fas lpr/j mice accumulate CD3+B220+CD4−CD8− T cells in an age-dependent manner, and these animals develop lupus nephritis and spontaneous lupus-like skin lesions. Nagata and colleagues (19) first discovered that the lymphoproliferation syndrome and the lupus manifestations displayed by these mice were related to a loss of function mutation of the Fas/CD95 cell surface receptor. Our present study shows that RAGE deletion in the B6-MRL Fas lpr/J genetic background exacerbates the phenotype of these mice and promotes the development of severe splenomegaly, lymphadenopathy, and lupus nephritis.
Similar phenotypic exacerbations were previously reported for the invalidation of TLR9 or the FcR common γ signaling chain (FcRγ) in the B6-MRL Fas lpr/J genetic background (27–30). These studies revealed critical functions for these receptors in the pathogenesis of SLE. Indeed, TLR9 is involved in the activation of autoreactive B cells and acts synergistically with BCR to promote autoantibody production in response to DNA fragments generated by apoptosis. Therefore, TLR9 deletion was predicted to be protective; however, an unexpected compensatory upregulation of INF-α production exacerbates disease in these mice. Likewise, the accumulation of autoreactive T cells is more severe in mice deficient for both FcRγ and Fas than in mice lacking Fas alone, suggesting a role for FcRγ in the regulation of autoreactive T cell death (27). Given these reports, we suggest that the accelerated disease phenotype of B6-MRL Fas lpr/J RAGE−/− animals is indicative of an unexpected function for RAGE in T cell homeostasis.
We show that the severe phenotype of B6-MRL Fas lpr/J RAGE−/− animals is related to the delayed apoptosis and enhanced survival of autoreactive CD3+B220+CD4−CD8− T lymphocytes. This is consistent with the current understanding of the physiopathology of SLE. Although previously considered as a B cell–driven disease, T cells are now firmly established as crucial actors in SLE development. T cells stimulate B cells to differentiate, proliferate, and mature (31, 32). Therefore, the strong accumulation of autoreactive T cells in RAGE-null mice may account for the high production of anti-dsDNA autoantibodies and severe end organ injury. In agreement with this hypothesis, we found that serum concentrations of Th1 cytokines (IFN-γ and IL6) were higher in both B6-MRL Fas lpr/J and B6-MRL Fas lpr/J RAGE−/− animals than in WT animals. Interestingly, we detected moderate serum levels of the Th2 cytokine IL-10 in B6-MRL Fas lpr/j mice, whereas IL-10 remained undetectable in B6-MRL Fas lpr/J RAGE−/− mice. Unlike TLR such as TLR4, RAGE has not been linked to IL-10 production (33). However, cooperation between TLR4 and RAGE has been reported (34). Therefore, our results suggest that RAGE may be necessary for the TLR-mediated production of IL-10 in B6-MRL Fas lpr/j mice. Further studies will be needed to confirm this hypothesis.
RAGE is found on cytoplasmic membrane of murine T lymphocytes and in the cytosol of human T cells and is upregulated after the stimulation of these cells (35). However, its functions have not been extensively studied. Interestingly, invalidation of RAGE in transgenic OT II TCR mice does not result in any major phenotype, but is associated with an inhibition of T lymphocyte proliferation and a defect in Th1 cytokine production (36, 37). Our results suggest that RAGE rescues T lymphocyte apoptosis in the absence of a functional Fas death receptor.
Our results are consistent with previous publications showing that RAGE signaling promotes apoptosis. Indeed, the interaction of RAGE with its partner molecules has been reported to induce apoptosis in neurons, podocytes, tubular cells, and vascular smooth muscle cells (38–40). In addition, in a mouse model of heterotopic heart transplantation, inhibition of the RAGE axis by the administration of soluble RAGE (which competitively inhibits binding to membrane-bound RAGE) significantly impaired apoptosis in the graft and delayed the occurrence of rejection (41). In agreement with these reports, a recent publication by Aleshin et al. (42) implicates RAGE signaling in the regulation of apoptosis secondary to ischemia reperfusion injury of the heart. In this study, apoptosis was significantly impaired in mice invalidated for RAGE and subjected to transient occlusion and reperfusion of the left anterior descending coronary artery. RAGE appeared to regulate JNK and the phosphorylation status of GSK3β in this model (43). In our study, we measured the serum concentrations of RAGE ligands, and found that HMGB1, S100A12, and carboxymethyllysine were present in the sera of B6-MRL-Fas lpr/j mice. Additionally, a large proportion of CD3+B220+CD4−CD8− autoreactive T cells expressed RAGE on their cell surface. These findings suggest that interactions between RAGE ligands and RAGE interaction modulate the function of autoreactive T cells and further support the idea that RAGE signaling rescues apoptosis in the absence of Fas. However, further investigation is needed to identify the exact signaling pathway(s) involved.
A recent publication from Lee et al. (44) reported that the administration of soluble RAGE to lupus-prone (New Zealand Black–New Zealand White)-F1 mice improved the course of lupus nephritis. In our study, we used a different strategy to inhibit RAGE signaling and found that this worsened the phenotype of lupus-prone mice. This discrepancy may be related to several factors. First, exogenous administration of soluble RAGE produces a large anti-inflammatory effect in animal models, even more profound than that with RAGE invalidation alone; therefore, soluble RAGE antagonism may have off-target effects on molecules that have not been identified as RAGE ligands. Second, differences in the animal model may also account for differences in outcome. Indeed, in the New Zealand Black–New Zealand White model, only the F1 hybrid progeny develops lethal accelerated glomerulonephritis; thus, invalidation of genes in this genetic background is difficult. On the contrary, MRL lpr mice display spontaneous lupus-like syndrome with clinical and serological abnormalities, and this phenotype is mostly related to the lymphoproliferation (lpr) gene (45). Third, SLE is a complex disorder involving key components of the immune system and is dependent on many ligand/receptor signaling cascades (46, 47). The phenotypic modifications we observed in RAGE-deficient animals may result from compensatory reactions, and increased inflammation through the interaction of alarmins with TLRs or the C3a receptor.
The present study reveals a critical role for RAGE in the regulation of lymphocyte apoptosis in the MRL lpr animal model of lupus. Although murine models of SLE allow the study and the manipulation of immunoregulatory molecules involved in the pathogenesis of the disease, they do not completely mimic human SLE. Furthermore, the deregulation of apoptosis found in MRL lpr mice is not the only mechanism involved in SLE development. Therefore, our results must be interpreted with caution. Indeed, the aggravated phenotype induced by RAGE deletion in the MRL lpr genetic background may result from specific features of this lupus model and may not reflect the effect of RAGE blockade in patients. Further studies are needed to clarify the role of RAGE signaling in the pathogenesis of SLE. New pharmacological inhibitors of RAGE will be available shortly and will certainly help to evaluate the contribution of the RAGE axis in rodent models of SLE and the potential benefit of anti-RAGE strategies in patients with SLE.
Footnotes
This work was supported by a grant from the University Hospital of Reims (to A.G.).
The online version of this article contains supplemental material.
References
Disclosures
The authors have no financial conflicts of interest.
