E-submission
Articles
- Page Path
- HOME > J Pathol Transl Med > Volume 48(4); 2014 > Article
-
Original Article
The Clinicopathological Significance of Epithelial Mesenchymal Transition Associated Protein Expression in Head and Neck Squamous Cell Carcinoma - Kyu Ho Kim, Lucia Kim, Suk Jin Choi, Jee Young Han, Joon Mee Kim, Young Chae Chu, Young-Mo Kim1, In Suh Park, Joo Han Lim2
-
Korean Journal of Pathology 2014;48(4):263-269.
DOI: https://doi.org/10.4132/KoreanJPathol.2014.48.4.263
Published online: August 26, 2014
Department of Pathology, Inha University Hospital, Inha University School of Medicine, Incheon, Korea.
1Department of Otorhinolaryngology-Head and Neck Surgery, Inha University Hospital, Inha University School of Medicine, Incheon, Korea.
2Department of Internal Medicine, Inha University Hospital, Inha University School of Medicine, Incheon, Korea.
-
Corresponding Author: In Suh Park, M.D. Department of Pathology, Inha University Hospital, Inha University School of Medicine, 27 Inhang-ro, Jung-gu, Incheon 400-711, Korea. Tel: +82-32-890-3973, Fax: +82-32-890-3464, 'ispap@inha.ac.kr'
Corresponding Author: Joo Han Lim, M.D. Department of Internal Medicine, Inha University Hospital, Inha University School of Medicine, 27 Inhang-ro, Jung-gu, Incheon 400-711, Korea. Tel: +82-32-890-2582, Fax: +82-32-890-2585, 'limjh@inha.ac.kr'
• Received: May 1, 2013 • Revised: May 7, 2014 • Accepted: July 11, 2014
© 2014 The Korean Society of Pathologists/The Korean Society for Cytopathology
This is an Open Access article distributed under the terms of the Creative Commons Attribution Non-Commercial License (http://creativecommons.org/licenses/by-nc/3.0/) which permits unrestricted non-commercial use, distribution, and reproduction in any medium, provided the original work is properly cited.
Abstract
-
Background
- Epithelial mesenchymal transition (EMT) has an important role in invasion and metastasis of tumor cells. The purpose of this study was to evaluate the roles of EMT-associated proteins on progression and metastasis as a prognostic/predictive factor in curatively-resected (R0) head and neck squamous cell carcinoma (HNSCC).
-
Methods
- A total of 118 patients who received curative surgery for HNSCC at Inha University Hospital between January 1996 and December 2011 were included. We used protein immunohistochemistry to evaluate the expression of E-cadherin, vimentin, and EZH2 on tissue microarrays. Also, we reviewed all medical records and analyzed the relationship between the expression of EMT-associated proteins and prognosis.
-
Results
- The E-cadherin-negative group showed more moderate/poor differentiation of cancer cell type than the higher E-cadherin-expressing group (p=.016) and high EZH2 expression was significantly correlated with nodal metastasis (p=.012). Our results demonstrate a significant association between high expression of EZH2 and vimentin and presence of distant progression (p=.026). However, expression of E-cadherin, vimentin, and EZH2 was not significantly associated with overall survival.
-
Conclusions
- These findings suggest that an EMT-associated protein expression profile is correlated with aggressiveness of disease and prognosis, and could be a useful marker for determination of additional treatment in curatively-resected HNSCC patients.
- Patient selection
- Patients who underwent curative surgery for HNSCC at Inha University Hospital between January 1996 and December 2011 were selected for this study. The primary sites of the tumors were the oral cavity, oropharynx, hypopharynx, and larynx. All patients received curative R0 resection. The patients' clinical and pathological characteristics regarding age, sex, smoking history, alcohol consumption, histologic types, pathologic TNM staging, relapse-free survival, and overall survival were obtained by a review of medical records. Thus, a total of 118 patients were eligible, according to the following criteria: histology of squamous cell carcinoma and the availability of hematoxylin and eosin-stained glass slides and paraffin blocks for construction of a tissue microarray (TMA). However, the smoking history of eight patients and the status of lymph node metastasis in one patient were not available. This study protocol was approved by the Ethics Committee (Institutional Review Board) of Inha University Hospital.
- TMA and immunohistochemistry
- We obtained formalin-fixed paraffin-embedded tissues of 118 patients for this study. The two representative areas of tumors were marked on glass slides. The criteria for defining the representative area were as follows: 1) invasive front of the tumor and 2) high percentage of tumor cells compared to surrounding stromal cells. To create TMAs, we punched two tissue columns (2.0 mm in diameter) from each original paraffin block and inserted them into the recipient paraffin blocks (each containing 30 to 69 holes). Six blocks of TMA were made for this immunohistochemical study.
- Paraffin blocks of the TMA were sectioned at a 4-µm thickness. The sections were processed in an automated machine (BenchMarkXT, Ventana Medical Systems, Tucson, AZ, USA) for deparaffinization and then re-hydrated through graded alcohol. Epitope retrieval was performed by heating for 30 minutes and then incubating the slides for 32 minutes (37℃) with monoclonal antibody, followed by an incubation with a visualization reagent. Anti-E-cadherin (1:200, Zymed Laboratories, Inc., San Francisco, CA, USA), anti-vimentin (1:300, DAKO, Carpinteria, CA, USA), and anti-EZH2 (1:400, Novocastra, Bannockburn, IL, USA) were stained by the same method. Additionally, anti-p16 (BD Transduction Laboratories, BD Biosciences, mtm laboratories AG, Heidelberg, Germany) antibody was used to stain only the group with oropharynx cancer.
- Analysis of immunohistochemical stains
- For the evaluation of the expression of E-cadherin and vimentin, the proportion of positive tumor cells was visually estimated in two total cores. E-Cadherin with membranous staining was classified into three categories6: 1) strong (S) pattern: almost all tumor cells showed diffuse patterns and strong positive staining in the membrane; 2) weak and homogeneous (W&H) pattern: tumor cells were uniformly, but more weakly stained; 3) heterogeneous (HEG) pattern: tumor cells showed focal staining with variable intensity. W&H and HEG patterns were considered to represent a loss of E-cadherin expression.
- Vimentin expression was interpreted as positive when cytoplasmic staining was observed, even in a small portion of the tumor cells (at least 5%) at the invasive front. However, the tumor cells in the basal layer were excluded in the interpretation, because they were frequently positive for vimentin in almost all cases. Diffuse expression of vimentin was also regarded as positive. The intensity of staining was not considered in the evaluation.
- The nuclear staining of EZH2 was evaluated semi-quantitatively on the basis of staining intensity and distribution using the immunoreactive score13,14,17: immunoreactive score=intensity score×proportion score. The intensity score was defined as follows-0, negative; 1, weak; 2, moderate; or 3, strong, and the proportion score was defined as 0, negative; 1, <10%; 2, 11-50%; 3, 51-80%; 4, >80% positive cells. The proportion of the immunoreactive tumor cells was estimated in one high-power field (×400) of the hot spot. The total score ranged from 0 to 12. Low expression of EZH2 was defined as a total score of 0 to 4, and high expression was defined as a total score >4. The p16-positive cases showed diffuse and strong nuclear expression in all cases, and the other cases were negative for p16 without any ambiguous cases.
- Statistical analysis
- A Pearson's chi-squared test and independent-sample t-test were used to determine the statistical significance of differences between the positive and negative immunoreactive groups for E-cadherin, vimentin, and EZH2 of HNSCC in terms of sex, age, smoking history, primary tumor site, histological differentiation, tumor stage, resection margin status, node metastasis, recurrence, and survival rate. The Kaplan-Meier method was used for survival analysis. The overall survival was determined by measuring the time interval from the beginning of the treatment to the date of death. We censored the patients who were alive or were lost during the follow-up in the data analysis. All statistical analyses were conducted using statistical software PASW Statistics ver. 18.0 (SPSS Inc., Chicago, IL, USA) and p-values less than .05 were considered statistically significant.
MATERIALS AND METHODS
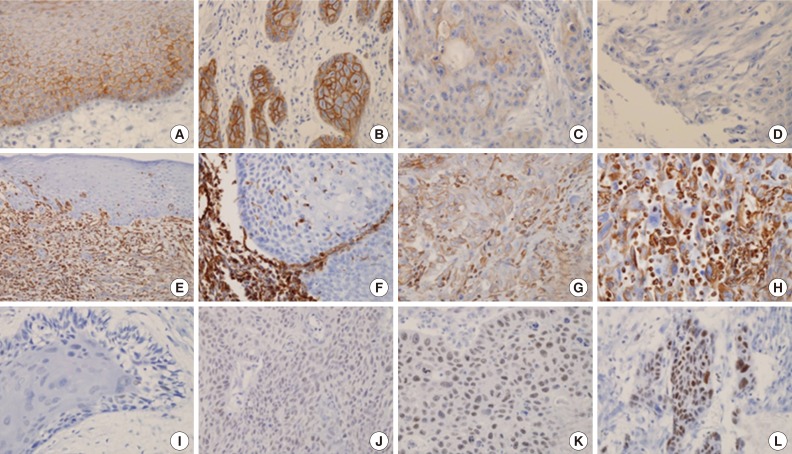
- We analyzed 118 patients (101 men [85.6%] and 17 women [14.4%]), with a median age of 58 years (range, 27 to 94 years). The tumors were located in the oral cavity (33.9%, 40 cases), oropharynx (18.6%, 22 cases), hypopharynx (19.5%, 23 cases), and larynx (28.0%, 33 cases). Eighty-six cases (72.9%) exhibited strong and homogenous membranous E-cadherin expression. The loss of E-cadherin was found in 32 cases (27.1%) (Fig. 1A-D). The expression of vimentin was frequently observed in tumor cells of the invasive front, especially abutting adjacent stroma. Twenty-nine cases (24.6%) exhibited focal or diffuse cytoplasmic immmunoreactivity for vimentin (Fig. 1E-H). According to the immunoreactive score, high expression of EZH2 was observed in 29 cases (24.6%) (Fig. 1I-L). Expression of p16 was observed in 14 of 22 cases (63.6%) of oropharyngeal cancer.
- Association of the clinicopathological parameters with the expression levels of E-cadherin, vimentin, and EZH2
- The results of immunohistochemical staining and its association with clinicopathological parameters are summarized in Table 1. The E-cadherin-negative group showed more moderately/poorly differentiated cell types than the higher E-cadherin-expressing group (62.8% vs 87.5%, p=.016). High EZH2 expression was significantly correlated with nodal metastasis (p=.012). In the subgroup composed of only oral cavity tumors, the expression of vimentin was associated with a higher tumor stage (T stage [vimentin negative/positive]; T1 (10/5), T2 (14/5), T3 (2/0), T4 (0/4), p=.027).
- Association of the overall survival with the expression levels of E-cadherin, vimentin, and EZH2
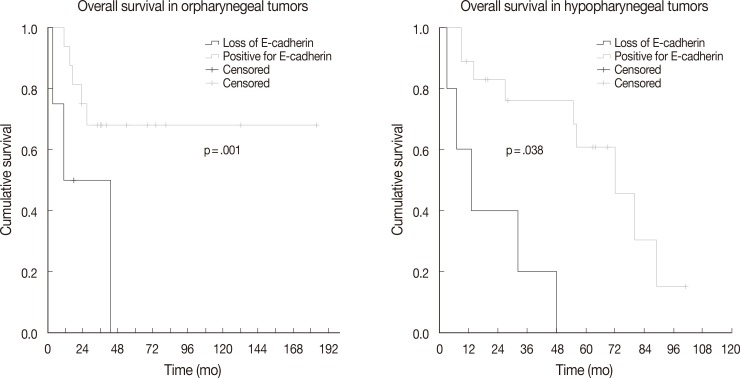
- The association between vimentin, E-cadherin, EZH2 expression and clinicohistologic parameters with survival rate was evaluated by Cox proportional hazard model. Comparing the clinicohistologic parameters, pathologic tumor stage (odds ratio, 2.541; p<.001), pathologic nodal stage (odds ratio, 2.043; p=.009), TMN stage (odds ratio, 2.233; p=.006), extracapsular extension (odds ratio, 1.982; p=.045), and margin status (odds ratio, 2.956; p<.001) were shown to be significantly associated with survival rate. No significant differences were found for sex, alcohol consumption, smoking history, and histologic differentiation of tumors. Furthermore, the expression of E-cadherin, vimentin, and EZH2 was not significantly associated with overall survival. However, in an analysis according to primary tumor site subgroups, the loss of E-cadherin was associated with lower overall survival in oropharyngeal and hypopharyngeal tumors (p=.001 and p=.038, respectively) (Fig. 2).
- The expression of p16 and EMT-associated protein in oropharyngeal cancer
- In the oropharynx tumor group, the recurrence rate was significantly higher than that in the E-cadherin-negative group (loss, 2/4 [50%]; E-cadherin-expressing group, 1/18 [5.6%]; p=.019). Twenty-nine cases of all 118 HNSCC showed overexpression of EZH2, especially in the oropharynx tumor group (41.4%, p=.002). HPV infection is a well-known biomarker in oropharyngeal squamous cell carcinoma. In our study, expression of p16, a well-known surrogate marker in oropharyngeal cancer, was found in 14 of 22 cases of oropharynx cancer. In these patients, the rate of EZH2 expression according to p16 status was not statistically different (p=.225). However there was no recurrence in any of the p16-positive cases. In contrast, three of eight cases (37.5%) showed recurrence in the p16-negative group. The difference in the recurrence ratio was statically significant (p=.014). Oropharyngeal squamous cell carcinoma patients who had a smoking history showed more frequent, but not statistically significant differences in, EZH2 expression compared patients who had never smoked (72.7% vs 36.3%, p=.094).
RESULTS
- In this study, we found that the EMT-associated protein expression profile was a strong prognostic marker for the entire HNSCC spectrum. Loss of E-cadherin expression is significantly associated with recurrence rate in oropharyngeal tumors, as well as overall survival in oropharyngeal and hypopharyngeal tumors. EZH2 and/or vimentin expression is significantly associated with more distant metastasis. Our study also suggests that this protein expression profile analysis may be helpful to identify patients at high risk of developing distant metastasis in early stage node-negative HNSCC patients.
- E-Cadherin is a key molecule involved in the maintenance of intracellular adhesion, and down-regulation of E-cadherin is associated with tumor progression in diverse human cancer types.18 There have been several reports regarding the inverse correlation between EZH2 and E-cadherin expression in cancer cells. However, the exact underlying mechanism by which EZH2 causes a poor prognosis is not known and further analyses are necessary to elucidate how EZH2 regulates E-cadherin expression. In our study, each of the factors was found to be associated with a pattern of metastasis and prognosis. However, we could not confirm a significant correlation between EZH2/vimentin expression and the recurrence rate or overall survival. There was a trend of a lower distant metastasis rate in patients with lower EZH2 expression compared to patients with high E-cadherin expression. However, this finding was not statistically significant (p=.192). The significance of E-cadherin expression as a predictive factor in metastatic spread is not clear.
- There is in vivo and in vitro data demonstrating that EZH2 plays a crucial role in several steps of the metastatic process and that it is activated in endothelial cells in response to pro-angiogenic signals.19 In our study, we found that there was a statistically significant difference in metastatic pattern according to mesenchymal markers expression. Given these hypotheses, our results suggest that mesenchymal markers could be very important biomarkers of distant metastasis in HNSCC.
- Thus far, there is no conclusive proof that the markers related to progression are directly correlated with prognosis in HNSCC. A recent TMA study of E-cadherin expression in oropharyngeal squamous cell carcinoma20 failed to show a significant correlation between the expression of E-cadherin and histologic type, nodal and distant metastasis, suggesting that E-cadherin expression may not be a predictor of nodal or distant metastasis in these tumors. The inconsistent results in several studies are limit the use of these markers to predict patient outcome. We think that the differences in methods for analyzing immunohistochemistry may be an important factor affecting the results.
- There are some limitations to our findings. Our analysis included all types of HNSCC and none of the subtypes had enough cases. Furthermore, our analysis was a single-center retrospective study. A large cohort study is necessary to confirm the significance of these markers.
- In conclusion, EMT-associated protein expression is related to aggressive pathological features, even in early stage HNSCC. Therefore, EMT-associated proteins could be useful markers for determination of additional treatment (e.g., adjuvant chemotherapy and/or radiotherapy) in curatively-resected HNSCC patients in the future.
DISCUSSION
Acknowledgments
Acknowledgments
- 1. Ferlay J, Shin HR, Bray F, Forman D, Mathers C, Parkin DM. Estimates of worldwide burden of cancer in 2008: GLOBOCAN 2008. Int J Cancer 2010; 127: 2893–2917. PMID: 21351269. ArticlePubMed
- 2. Thiery JP, Acloque H, Huang RY, Nieto MA. Epithelial-mesenchymal transitions in development and disease. Cell 2009; 139: 871–890. PMID: 19945376. ArticlePubMed
- 3. Thiery JP. Epithelial-mesenchymal transitions in tumour progression. Nat Rev Cancer 2002; 2: 442–454. PMID: 12189386. ArticlePubMed
- 4. Thiery JP, Sleeman JP. Complex networks orchestrate epithelial-mesenchymal transitions. Nat Rev Mol Cell Biol 2006; 7: 131–142. PMID: 16493418. ArticlePubMed
- 5. Wang C, Liu X, Chen Z, et al. Polycomb group protein EZH2-mediated E-cadherin repression promotes metastasis of oral tongue squamous cell carcinoma. Mol Carcinog 2013; 52: 229–236. PMID: 22161744. ArticlePubMed
- 6. Nijkamp MM, Span PN, Hoogsteen IJ, van der Kogel AJ, Kaanders JH, Bussink J. Expression of E-cadherin and vimentin correlates with metastasis formation in head and neck squamous cell carcinoma patients. Radiother Oncol 2011; 99: 344–348. PMID: 21684617. ArticlePubMed
- 7. Ueda G, Sunakawa H, Nakamori K, et al. Aberrant expression of beta- and gamma-catenin is an independent prognostic marker in oral squamous cell carcinoma. Int J Oral Maxillofac Surg 2006; 35: 356–361. PMID: 16288849. ArticlePubMed
- 8. Pyo SW, Hashimoto M, Kim YS, et al. Expression of E-cadherin, P-cadherin and N-cadherin in oral squamous cell carcinoma: correlation with the clinicopathologic features and patient outcome. J Craniomaxillofac Surg 2007; 35: 1–9. PMID: 17296306. ArticlePubMed
- 9. Myong NH. Loss of E-cadherin and acquisition of vimentin in epithelial-mesenchymal transition are noble indicators of uterine cervix cancer progression. Korean J Pathol 2012; 46: 341–348. PMID: 23110026. ArticlePubMedPMC
- 10. Hong R, Choi DY, Lim SC, Suh CH, Kee KH, Lee MJ. The differential expressions of the epithelial-mesenchymal transition regulator, slug and the cell adhesion molecule, E-cadherin in colorectal adenocarcinoma. Korean J Pathol 2008; 42: 351–357.
- 11. Kim H, Yoo SB, Sun P, et al. Alteration of the E-cadherin/beta-catenin complex is an independent poor prognostic factor in lung adenocarcinoma. Korean J Pathol 2013; 47: 44–51. PMID: 23483484. ArticlePubMedPMC
- 12. Tan J, Yang X, Zhuang L, et al. Pharmacologic disruption of Polycomb-repressive complex 2-mediated gene repression selectively induces apoptosis in cancer cells. Genes Dev 2007; 21: 1050–1063. PMID: 17437993. ArticlePubMedPMC
- 13. Breuer RH, Snijders PJ, Smit EF, et al. Increased expression of the EZH2 polycomb group gene in BMI-1-positive neoplastic cells during bronchial carcinogenesis. Neoplasia 2004; 6: 736–743. PMID: 15720799. ArticlePubMedPMC
- 14. Bachmann IM, Halvorsen OJ, Collett K, et al. EZH2 expression is associated with high proliferation rate and aggressive tumor subgroups in cutaneous melanoma and cancers of the endometrium, prostate, and breast. J Clin Oncol 2006; 24: 268–273. PMID: 16330673. ArticlePubMed
- 15. Weikert S, Christoph F, Köllermann J, et al. Expression levels of the EZH2 polycomb transcriptional repressor correlate with aggressiveness and invasive potential of bladder carcinomas. Int J Mol Med 2005; 16: 349–353. PMID: 16012774. ArticlePubMed
- 16. Holland D, Hoppe-Seyler K, Schuller B, et al. Activation of the enhancer of zeste homologue 2 gene by the human papillomavirus E7 oncoprotein. Cancer Res 2008; 68: 9964–9972. PMID: 19047178. ArticlePubMed
- 17. Liu LK, Jiang XY, Zhou XX, Wang DM, Song XL, Jiang HB. Upregulation of vimentin and aberrant expression of E-cadherin/beta-catenin complex in oral squamous cell carcinomas: correlation with the clinicopathological features and patient outcome. Mod Pathol 2010; 23: 213–224. PMID: 19915524. ArticlePubMed
- 18. Diniz-Freitas M, García-Caballero T, Antúnez-López J, Gándara-Rey JM, García-García A. Reduced E-cadherin expression is an indicator of unfavourable prognosis in oral squamous cell carcinoma. Oral Oncol 2006; 42: 190–200. PMID: 16249116. ArticlePubMed
- 19. Liu M, Scanlon CS, Banerjee R, et al. The histone methyltransferase EZH2 mediates tumor progression on the chick chorioallantoic membrane assay, a novel model of head and neck squamous cell carcinoma. Transl Oncol 2013; 6: 273–281. PMID: 23730406. ArticlePubMedPMC
- 20. Ukpo OC, Thorstad WL, Zhang Q, Lewis JS Jr. Lack of association of cadherin expression and histopathologic type, metastasis, or patient outcome in oropharyngeal squamous cell carcinoma: a tissue microarray study. Head Neck Pathol 2012; 6: 38–47. PMID: 22072429. ArticlePubMed
References
Fig. 1The expression of E-cadherin (A-D), vimentin (E-H), and EZH2 (I-L) in normal squamous epithelium and tumors. E-Cadherin is expressed in the membranes of normal cells (A) and tumor cells (B), but some tumors show heterogeneous (C), or loss (D) of expression. Normal squamous epithelium (E) and squamous cell carcinoma (F) are negative for vimentin, but a portion of tumors show intermediate (G) or strong (H) expression of vimentin in the cytoplasm of tumor cells. Weak and focal (I) or weak and diffuse (J) expression of EZH2 is grouped as low immunoreactivity. Moderate and diffuse (K) or strong and diffuse (L) expression of EZH2 is grouped as high immunoreactivity.

Fig. 2The effects of E-cadherin on prognosis. Kaplan-Meier plots of overall survival in oropharyngeal and hypopharyngeal groups defined by expression of E-cadherin. The loss of E-cadherin is significantly correlated with the lower overall survival (p=.001 and p=.038, respectively).

Table 1.Relationship between EMT-associated protein expression and clinicopathological parameters
Figure & Data
References
Citations
Citations to this article as recorded by 
- Polycomb repressive complex 2 and its core component EZH2: potential targeted therapeutic strategies for head and neck squamous cell carcinoma
Yuxi Cheng, Zhengzheng Song, Xiaodan Fang, Zhangui Tang
Clinical Epigenetics.2024;[Epub] CrossRef - Prognostic Value of TWIST1 and EZH2 Expression in Colon Cancer
Samar M. Abdel Raouf, Taiseer R. Ibrahim, Lobna A. Abdelaziz, Mohamed I. Farid, Salem Y Mohamed
Journal of Gastrointestinal Cancer.2021; 52(1): 90. CrossRef - HOXB5 acts as an oncogenic driver in head and neck squamous cell carcinoma via EGFR/Akt/Wnt/β-catenin signaling axis
Kyungmin Lee, Jae Won Chang, Chan Oh, Lihua Liu, Seung-Nam Jung, Ho-Ryun Won, Young Il Kim, Ki-Sang Rha, Bon Seok Koo
European Journal of Surgical Oncology.2020; 46(6): 1066. CrossRef - EZH2 overexpression in head and neck cancer is related to lymph node metastasis
Julie C. Nienstedt, Cornelia Schroeder, Till Clauditz, Ronald Simon, Guido Sauter, Adrian Muenscher, Marco Blessmann, Henning Hanken, Christina Pflug
Journal of Oral Pathology & Medicine.2018; 47(3): 240. CrossRef - MiR-876-5p modulates head and neck squamous cell carcinoma metastasis and invasion by targeting vimentin
Yibo Dong, Yang Zheng, Chundi Wang, Xu Ding, Yifei Du, Laikui Liu, Wei Zhang, Wei Zhang, Yi Zhong, Yunong Wu, Xiaomeng Song
Cancer Cell International.2018;[Epub] CrossRef - HMGA2 is associated with the aggressiveness of tongue squamous cell carcinoma
H Zhang, Z Tang, C Deng, Y He, F Wu, O Liu, C Hu
Oral Diseases.2017; 23(2): 255. CrossRef - miR-375 Regulates Invasion-Related Proteins Vimentin and L-Plastin
Lizandra Jimenez, Jihyeon Lim, Berta Burd, Thomas M. Harris, Thomas J. Ow, Nicole Kawachi, Thomas J. Belbin, Ruth Angeletti, Michael B. Prystowsky, Geoffrey Childs, Jeffrey E. Segall
The American Journal of Pathology.2017; 187(7): 1523. CrossRef - Functional and therapeutic significance of EZH2 in urological cancers
Xiaobing Liu, Qingjian Wu, Longkun Li
Oncotarget.2017; 8(23): 38044. CrossRef - EZH2, an on–off valve in signal network of tumor cells
Shanshan Sun, Feng Yu, Lun Zhang, Xuan Zhou
Cellular Signalling.2016; 28(5): 481. CrossRef - High EZH2 Protein Expression Is Associated with Poor Overall Survival in Patients with Luminal A Breast Cancer
Si-Hyong Jang, Jong Eun Lee, Mee-Hye Oh, Ji-Hye Lee, Hyun Deuk Cho, Kyung-Ju Kim, Sung Yong Kim, Sun Wook Han, Han Jo Kim, Sang Byung Bae, Hyun Ju Lee
Journal of Breast Cancer.2016; 19(1): 53. CrossRef - EZH2 promotes invasion and metastasis of laryngeal squamous cells carcinoma via epithelial-mesenchymal transition through H3K27me3
HuaNan Luo, Yuan Jiang, SiJing Ma, HuanHuan Chang, ChunXi Yi, Hui Cao, Ying Gao, HaiLi Guo, Jin Hou, Jing Yan, Ying Sheng, XiaoYong Ren
Biochemical and Biophysical Research Communications.2016; 479(2): 253. CrossRef
 PubReader
 ePub Link
-
 Cite this Article
- Cite this Article
-
- Close
- Download Citation
- Close
- Figure
-