Abstract
Aims: Our aim was to validate patient-specific software integrating baseline anatomy and biomechanical properties of both the aortic root and valve for the prediction of valve morphology and aortic leaflet calcium displacement after TAVI.
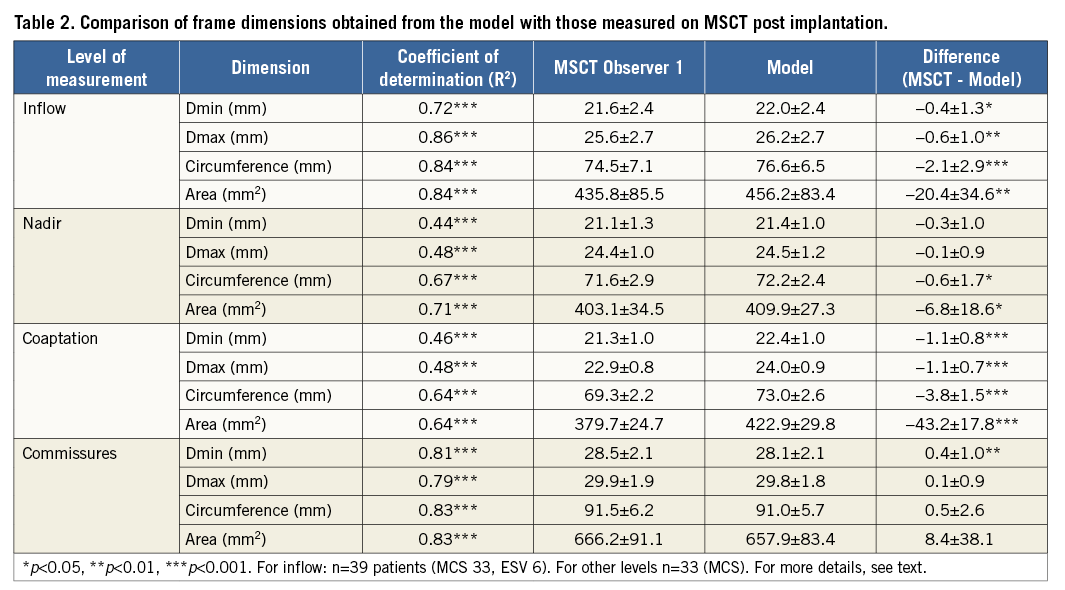
Methods and results: Finite element computer modelling was performed in 39 patients treated with a Medtronic CoreValve System (MCS; n=33) or an Edwards SAPIEN XT (ESV; n=6). Quantitative axial frame morphology at inflow (MCS, ESV) and nadir, coaptation and commissures (MCS) was compared between multislice computed tomography (MSCT) post TAVI and a computer model as well as displacement of the aortic leaflet calcifications, quantified by the distance between the coronary ostium and the closest calcium nodule. Bland-Altman analysis revealed a strong correlation between the observed (MSCT) and predicted frame dimensions, although small differences were detected for, e.g., Dmin at the inflow (mean±SD MSCT vs. model: 21.6±2.4 mm vs. 22.0±2.4 mm; difference±SD: –0.4±1.3 mm, p<0.05) and Dmax (25.6±2.7 mm vs. 26.2±2.7 mm; difference±SD: –0.6±1.0 mm, p<0.01). The observed and predicted calcium displacements were highly correlated for the left and right coronary ostia (R2=0.67 and R2=0.71, respectively p<0.001).
Conclusions: Dedicated software allows accurate prediction of frame morphology and calcium displacement after valve implantation, which may help to improve outcome.
Introduction
Transcatheter aortic valve implantation (TAVI) is increasingly used to treat selected patients with aortic stenosis and has been shown to improve survival and quality of life1-5. However, TAVI is associated with a number of complications that remain to be solved in order to improve safety and efficacy6.
Although some of the complications may stem from patient-, procedure- and/or operator-related factors, some arise from specific device-host interactions. With respect to the latter, one might cite as examples incomplete and/or non-circular frame expansion due to the presence of aortic root calcifications leading to paravalvular regurgitation, unexpected mobilisation of calcified leaflets leading to coronary obstruction, and dissection or rupture of the aortic root even in the presence of appropriate valve size selection7-13. Device-host interactions are clinically difficult to predict because of the large variations in the geometry and dimensions of the aortic root in addition to the variations in the amount and distribution of calcium between patients. The increasing number and spectrum of patients referred for TAVI as well as the increasing valve types available necessitate patient-specific tools predicting device-host interaction for both patient selection and procedure planning (i.e., selection of the valve that best fits the individual patient). Finite element computer simulation of a TAVI procedure based upon the integration of the patient-specific anatomy, the physical and mechanical properties of the valve and the biomechanical properties of the aortic root, may help to define in vivo device-host interactions, thereby enhancing the safety of TAVI14-22.
In this paper, such a patient-specific cardiovascular computer model for the prediction of the in vivo morphology of the Medtronic CoreValve® Revalving System (MCS) (Medtronic, Minneapolis, MN, USA) and the Edwards SAPIEN XT Transcatheter Heart Valve (ESV) (Edwards Lifesciences, Irvine, CA, USA) and the displacement of the calcified aortic leaflets immediately after implantation is reported and validated by comparing the findings derived from the model (predicted) with those from multislice computed tomography (MSCT) performed shortly after TAVI (observed).
Methods
STUDY POPULATION AND MSCT
Thirty-nine patients who received a 26/29 mm MCS or a 23/26 mm ESV and who underwent MSCT pre and post TAVI were studied. Sizing of the valves was guided by the manufacturer’s recommendations. All patients underwent MSCT pre TAVI and post TAVI. Details of the MSCT have been described previously7. Briefly, end-systolic data sets were reconstructed using a single-segmental reconstruction algorithm: slice thickness 1.5 mm; increment 0.4 mm; medium-to-smooth convolution kernel (B26f) resulting in a spatial resolution of 0.6-0.7 mm in-plane and 0.4-0.5 mm through-plane and a temporal resolution of 72 ms.
COMPUTER MODELLING
First, finite element computer models of the 26/29 mm MCS and 23/26 ESV frame were developed based on a detailed evaluation of: a) the frame morphology using microscopic measurements and micro-computed tomography (resolution 30 microns), and b) the mechanical characteristics of the nitinol and cobalt-chromium frame of both valves by performing in vitro radial compression tests at body temperature. During these tests, the frame diameter was reduced over the full frame length using a segmental compression mechanism, while the radial force was recorded (RX650; Machine Solutions, Flagstaff, AZ, USA).
Next, patient-specific three-dimensional (3D) computer models of the native aortic root, including the (calcified) native leaflets were constructed from clinical pre-TAVI MSCT images using image segmentation techniques (Mimics software v16.0; Materialise, Leuven, Belgium). A fixed leaflet thickness of 1.5 mm was used for the non-calcified portion of the native leaflets. Varying mechanical properties were then automatically assigned to different tissue regions. The model parameters related to the tissue behaviour were calibrated using the MSCT data sets of the first 14 patients and validated in 39 patients. The calibration started by performing valve implantation simulations in the first 14 patients using an initial set of biomechanical properties of the left ventricular outflow tract (LVOT)-aortic root complex. These properties were iteratively adjusted after analysis of the clinical MSCT post TAVI (back calculation), and the final resulting tissue properties were subsequently used in the validation analysis.
The computer-generated valve frames were then implanted virtually into the patient’s specific anatomy using finite element computer simulations. All simulations were performed using the Abaqus/Explicit v6.12 finite element solver (Dassault Systèmes, Paris, France). In each computer-simulated implantation, all steps of the clinical or in vivo implantation were respected and consisted of predilatation, valve size selection, depth of implantation and post-dilatation if applied. The depth of implantation was matched with the actual depth of implantation (i.e., depth of implantation during actual valve implantation) by overlaying the 3D aortic root model derived from the software after simulation of valve implantation with the one derived from MSCT post TAVI followed by evaluating the resulting alignment of the inflow of the valve frame of the 3D model with the one of the MSCT post TAVI that was used as reference. Simulations were repeated until correct alignment was obtained which was used for the validation analysis. For the pre- and (if applicable) post-dilatation, the same size of balloon that was used during the in vivo implantation was used during the computer simulation.
MEASUREMENTS OF THE MCS AND ESV FRAME DIMENSIONS
The observed (MSCT post) and predicted (computer model) axial frame morphology was quantified at four predefined levels of the MCS frame as described previously7: 1) ventricular end, 2) nadir, and 3) central coaptation of the MCS leaflets, and 4) commissures. Given the tubular shape of the ESV, only the inflow was investigated for this valve (Figure 1).
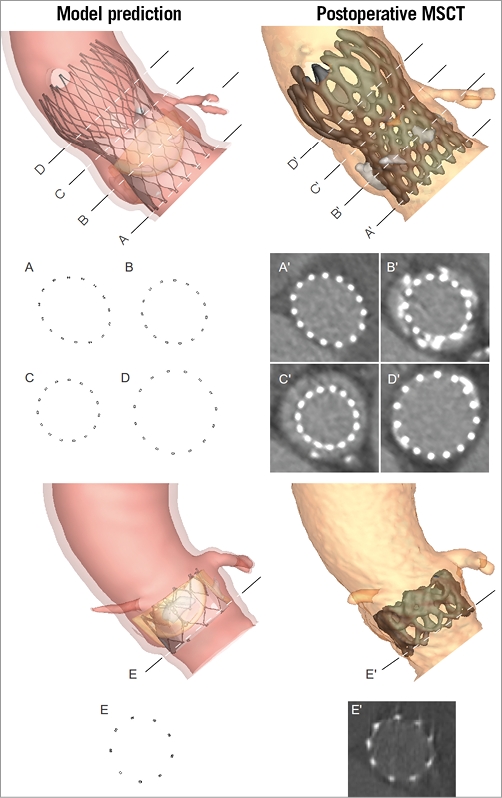
Figure 1. Levels of measurement on the MCS and ESV. The geometry of predicted (model - left) and observed (MSCT - right) MCS (top) frame was quantified at the ventricular end (A and A’), nadir (B and B’), central coaptation (C and C’) and commissures (D and D’). For the ESV (bottom), only the ventricular end (E and E’) was evaluated.
Measurements were performed on axial slices so that the connection points of a particular level appeared simultaneously. A curve through the centre of all struts was used to calculate the perimeter and cross-sectional area. The smallest and largest perpendicular frame diameters were automatically derived from this curve. These basic measures describing frame geometry (i.e., Dmin, Dmax, perimeter and cross-sectional area) were chosen to compare predicted and observed frame deformation. These are variables that are directly measured and, thus, not derived from other measures. At variance with derived measures such as ellipticity and underexpansion, the direct measures provide a better understanding of the modelling accuracy/errors.
For each level of the observed MCS and ESV (MSCT post TAVI), the centre of the struts was manually identified. Two blinded operators (R. Rodriguez-Olivares, P. Mortier) performed all measurements in order to quantify the operator variability of this manual process. The correlation coefficient varied between 0.92 and 1.00 without any statistical difference between the two operators for all measurements at all levels. For the predicted frames (computer model), the curves at the different levels were automatically generated, making the complete measurement process on the simulation results fully automated (no operator variability).
QUANTIFICATION OF LEAFLET CALCIUM DISPLACEMENT
Postoperative MSCT was also used to evaluate the accuracy of the predicted displacement of the native leaflet calcifications after MCS implantation. The position of the displaced calcium was quantified by measuring the smallest distance between a calcification nodule and the coronary ostium for both the MSCT post TAVI and the computer model. This measure was chosen as it may provide relevant insights regarding the risk of coronary occlusion. For this purpose, a 3D reconstruction of the MSCT post TAVI was generated and the calcifications were separated from the MCS frame. Such separation was not required for the 3D simulation where the calcifications were identified as separate regions prior to MCS deployment. The coronary ostium was identified by defining three points around the circumference of the ostium on the 3D model of the aortic root. The centre of the circle determined by these three points was used to define the coronary ostium. The distance from the coronary ostium to each point of the mesh representing the leaflet calcification was then calculated, and the minimal value was detected (Figure 2). A distance measurement was not done if the amount of calcium on the aortic leaflet corresponding to the coronary artery was too small to be reliably distinguished from the prosthesis frame after deployment.
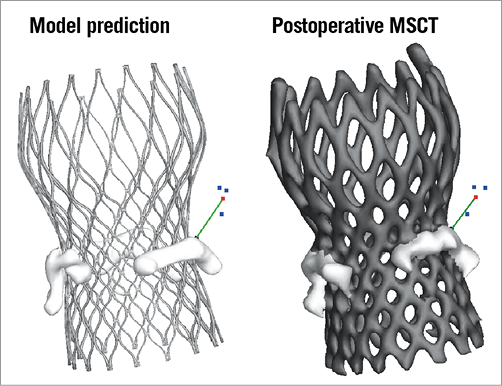
Figure 2. Quantification of leaflet calcium displacement. The displacement of leaflet calcifications was quantified by measuring the smallest distance between the coronary ostium and the closest calcium nodule (green line). Coronary ostium was identified by picking three points (blue) on the 3D surface representing the aortic root (not shown) around the circumference of the ostium. The centre of the circle going through these three points was used for the distance calculation (shown in red).
STATISTICAL METHODS
Data are presented as a median (25th to 75th quartile) or mean±standard deviation (SD) as appropriate. The coefficient of determination (R-squared) was determined. Paired comparisons between the measurements on the clinical MSCT post TAVI and those derived from the computer simulation were carried out using the paired Student’s t-test or the Wilcoxon signed-rank test as appropriate. Difference plots were constructed according to the Bland-Altman method. SPSS Version 21.0 (IBM Corp., Armonk, NY, USA) was used. Statistical significance was defined as a two-tailed p<0.05.
Results
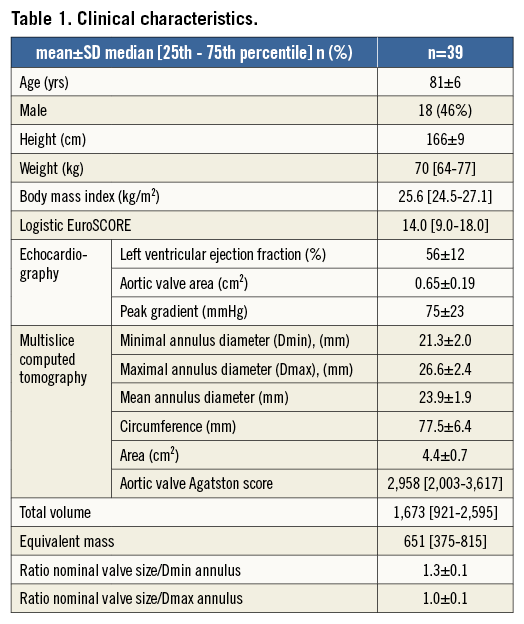
The clinical characteristics of the patients are shown in Table 1. All patients underwent transfemoral TAVI following balloon valvuloplasty of the aortic valve just before valve implantation (20 mm balloon in nine patients, 22 mm balloon in 12 patients, 23 mm balloon in 11 patients, and 25 mm balloon in one patient). A 26 mm MCS was implanted in 11 patients and a 29 mm in 22 patients, a 23 and 26 mm ESV was implanted in one and five patients, respectively. Four out of the 39 patients underwent balloon dilatation after TAVI: 23 mm balloon after 26 mm MCS in one patient, 25 mm balloon after 26 and 29 mm MCS in two patients, 26 mm balloon after 29 mm MCS in one patient.
COMPARISON OF PREDICTED AND OBSERVED FRAME DIMENSIONS
The mean (±SD) of the observed (MSCT) and predicted (model) dimensions at the various levels of the frame and their differences are shown in Table 2. There was a small degree of overestimation of the dimensions of the frame by the model at the inflow, nadirs and coaptation but not at the level of the commissures. Overall, there was a strong correlation (R-squared) between the observed and predicted measurements for all dimensions, except for the Dmin and Dmax at the nadirs and the coaptation levels of the MCS valve where the correlation was moderate.
The correlation between MSCT and model is illustrated by the scatter and difference plots with limits of agreement for all dimensions at the level of the inflow in Figure 3 and Figure 4, showing the small but insignificant overestimation of the frame dimensions by the model.
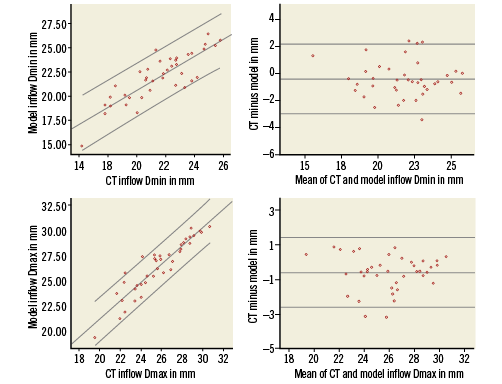
Figure 3. Scatter and difference plots of the minimum (Dmin, upper panels) and maximal diameters (Dmax, lower panels) measured at the inflow by MSCT and model. On the scatter plots (left) the linear line of best fit and 95% confidence intervals are shown. On the difference plots (right) the mean and 95% confidence intervals of the difference are shown.
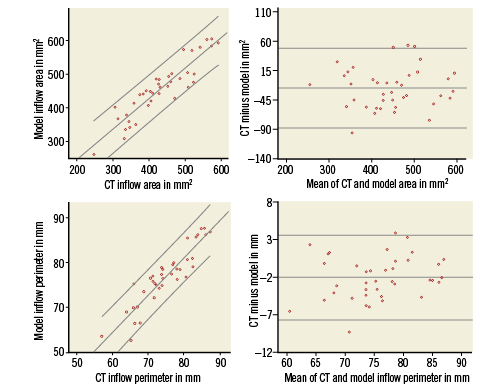
Figure 4. Scatter and difference plots of the cross-sectional area (upper panels) and perimeter (lower panels) measured at the inflow of the MCS and ESV by MSCT and model. On the scatter plots (left) the linear line of best fit and 95% confidence intervals are shown. On the difference plots (right) the mean and 95% confidence intervals of the difference are shown.
COMPARISON OF PREDICTED AND OBSERVED LEAFLET CALCIUM DISPLACEMENT
The distance between the coronary ostium and calcification on the nearest leaflet could be measured for 27 left coronaries and 24 right coronaries. The measurements were not possible on MSCT if there was no calcium on the corresponding native valve leaflet prior to TAVI or if the calcium spot was too small to differentiate it from the prosthesis frame post TAVI. The measured (MSCT) and predicted (model) distances from coronary ostium to calcium nodule were highly correlated for the left and right coronary ostia (respectively, R2=0.67 and R2=0.71, p<0.001 for both). There was a small overestimation by the model for the left coronary artery (MSCT vs. model respectively: mean distance±SD: 8.3±3.8 mm vs. 9.5±4.0 mm; difference±SD: –1.1±2.4 mm, p=0.02) and also for the right coronary artery (MSCT vs. model respectively: mean distance±SD: 8.1±2.5 mm vs. 9.0±2.7 mm; difference±SD: –0.9±1.5 mm, p=0.006).
A qualitative comparison of the predicted and observed positions of the calcified native leaflets after TAVI is shown for four representative cases in Figure 5. Scatter and difference plots with limits of agreement are shown for both the left and right coronary arteries (Figure 6), showing the small but insignificant overestimation of the predicted distance from coronary ostium to calcium nodule.
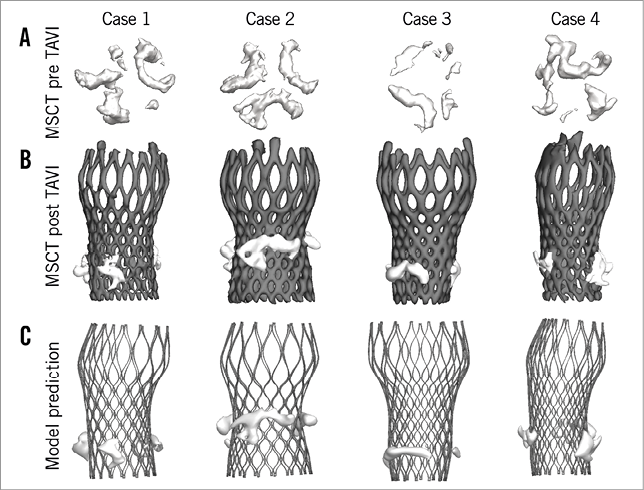
Figure 5. Displacement of leaflet calcifications after valve implantation. Qualitative comparison of the observed (MSCT post TAVI – B) and predicted (model – C) position of the calcified native leaflets after TAVI for four representative cases. The positions of the aortic leaflet calcifications before TAVI are shown in A.
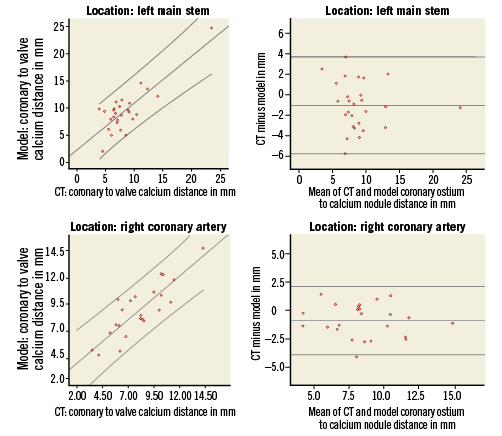
Figure 6. Scatter and difference plots of the measured distance from the left (upper panels) and right coronary ostium (lower panels) to the nearest calcium nodule by MSCT and model. On the scatter plots (left) the linear line of best fit and 95% confidence intervals are shown. On the difference plots (right) the mean and 95% confidence intervals of the difference are shown.
Discussion
The present study concerns the description and technical evaluation of a computer model that allows in vivo prediction of frame geometry and calcium displacement before actual valve implantation by integrating the pre-TAVI MSCT-derived anatomy and the physical characteristics of the valve chosen to be implanted.
Overall, there was a high agreement between the predicted and observed dimensions of the valve frame. The model, however, overestimated the dimensions at all levels except for the commissures (MCS frame). Despite the statistically significant differences, the absolute value of these differences is small. This also holds true for the predicted and observed displacement of the calcified aortic leaflets. The distance from the coronary ostium to the calcification on the nearest leaflet was slightly overestimated by the model.
The obvious question is what causes the overestimation and whether it has any eventual clinical consequences if the model were to be used in clinical practice for patient selection and TAVI planning (i.e., valve type and size). This is particularly the case for the inflow portion of the valve as this is the site where most of the complications occur, for example paravalvular regurgitation and bundle branch block and also the rare but dramatic event of coronary obstruction7-13. Most likely, the overestimation unveils limitations of the software. For example, the 3D aortic root models contain simplifications with respect to the real anatomy, and the assigned mechanical tissue properties may not fully reflect real tissue behaviour. Another source of error may have been undetected differences in the depth of implantation between the real and virtual valve implantation. The depth of implantation assessed by MSCT post TAVI was used during computer simulation. However, despite care in correctly aligning the depth of implantation, it is conceivable that subtle differences in the depth of implantation between the actual valve implantation and simulation have occurred, thereby introducing differences in frame geometry between MSCT post TAVI and the model. As mentioned above, the model slightly overestimated the dimensions of the frame. The potential clinical impact of the modelling errors is currently unknown and can only be evaluated by future studies assessing the predictive power of the model with respect to complications such as paravalvular regurgitation and conduction disturbances.
There is growing interest in the development of software which is able to construct detailed geometric anatomic models from patient-specific diagnostic images and software that allows computer simulation of TAVI in order to predict valve configuration in the patient-specific anatomy, thereby helping the physician to select the valve (type and size) that best fits the individual patient14-22. A number of studies have employed finite element computer modelling to deploy a transcatheter aortic valve virtually into a patient-specific aortic root model14-16,19,21,22. While all of these studies have definitely contributed to proving the feasibility of patient-specific TAVI simulations, the validation of the modelling results has been limited so far. In the present work, we describe for the first time a validation of the predictive power of patient-specific TAVI simulations by detailed comparison with postoperative imaging.
MSCT has been recommended to improve valve size selection so as to reduce complications, in particular paravalvular aortic regurgitation23-25. However, the reading and interpretation of diagnostic images remain subjective26. As has been shown previously, selecting a valve in which the nominal dimensions fit with the dimension of the aortic annulus is not a guarantee for perfect apposition despite optimal positioning7. Similarly, assessing the risk of coronary obstruction by using a certain threshold (e.g., 10 mm) for the distance from the aortic annulus to the coronary ostium is limited by a low sensitivity12. Sixty percent of the cases with coronary obstruction reviewed by Ribeiro et al had a coronary ostium height >10 mm, suggesting that other factors might be involved, such as the size and location of calcium nodules on the leaflets and the size of the sinuses of Valsalva. With respect to MSCT-based planning, computer simulation incorporating the calcium load of the base of the aortic root including leaflets such as reported in the current study and by Russ et al may help to predict coronary obstruction more precisely16. Similarly, preoperative assessment of the risk of paravalvular aortic regurgitation may be improved by the proposed computer model. The case study shown in Figure 7 illustrates the potential of the computer model to provide additional information during preoperative planning, for example to understand the impact of device size and position.
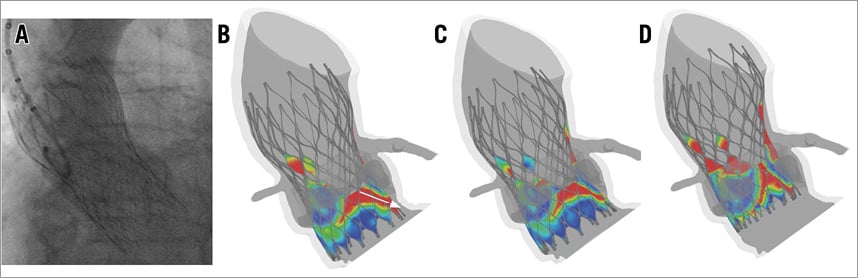
Figure 7. Case study. A patient who received a 26 mm MCS (perimeter-based annulus of 22.8 mm) had moderate aortic regurgitation as revealed by contrast aortography (A). The developed computer model can be used to assess the risk of paravalvular regurgitation by showing the distance between the skirt of the device and the surrounding tissue (red reflects a malapposition larger than 1 mm, while dark blue reflects a perfect sealing). A malapposition from aorta to ventricle indicates a paravalvular leakage path (white arrow in B). The computer model was used to investigate the impact of device sizing (26 mm MCS in B vs. 29 mm MCS in C) and positioning (29 mm MCS with a higher position in D).
The present study is a proof of concept and is indicative of the clinical utility of preprocedural computer simulation. Patient-specific preprocedural planning or personalised medicine is requested by many healthcare authorities confronted by increasing healthcare costs as a result of an ageing population and also increasing treatment modalities for older patients27,28. The methods proposed in this study may serve this goal since and – at variance with surgical valve replacement – there is no direct vision of the target zone and no excision of calcium that is intrinsically associated with a higher degree of unpredictability of valve geometry and function.
Study limitations
This study is limited by the fact that the validation of the model focuses on a limited sample of 26/29 mm MCS and 23/26 mm ESV. Therefore, it remains to be elucidated whether the accuracy of the model will be similar for all types and sizes of commercially available valves. In addition, the current study focuses on the acute frame deformation, and the potential long-term effects of device-host interaction (especially in the case of the self-expandable MCS) are not taken into account.
Conclusions
Dedicated software allows accurate prediction of frame morphology and calcium displacement after TAVI and is a first step towards patient-tailored medicine by selecting the type and size of valve that best fits the individual patient, thereby improving outcome.
| Impact on daily practice A patient-specific computer simulation of a TAVI procedure allows the operator to select the valve that best fits the individual patient and is projected to improve outcome by reducing complications. It is a first step in the development and promotion of personalised medicine as demanded by healthcare authorities and society. |
Conflict of interest statement
T. Lefèvre is a proctor for Edwards Lifesciences. G. De Santi and T. Dezutter are employees of FEops. B. Verhegghe and M. De Beule are co-founders of FEops. P. Mortier is a co-founder of FEops and has the patent “Pre-operative planning of trans-catheter valve implantation” pending. P. de Jaegere is a proctor for Medtronic. The other authors have no conflicts of interest to declare.