Abstract
Aims: To develop and validate a new methodology that allows accurate 3-dimensional (3-D) coronary artery reconstruction using standard, simple angiographic and intravascular ultrasound (IVUS) data acquired during routine catheterisation enabling reliable assessment of the endothelial shear stress (ESS) distribution.
Methods and results: Twenty-two patients (22 arteries: 7 LAD; 7 LCx; 8 RCA) who underwent angiography and IVUS examination were included. The acquired data were used for 3-D reconstruction using a conventional method and a new methodology that utilised the luminal 3-D centreline to place the detected IVUS borders and anatomical landmarks to estimate their orientation. The local ESS distribution was assessed by computational fluid dynamics. In corresponding consecutive 3 mm segments, lumen, plaque and ESS measurements in the 3-D models derived by the centreline approach were highly correlated to those derived from the conventional method (r>0.98 for all). The centreline methodology had a 99.5% diagnostic accuracy for identifying segments exposed to low ESS and provided similar estimations to the conventional method for the association between the change in plaque burden and ESS (centreline method: slope= −1.65%/Pa, p=0.078; conventional method: slope= −1.64%/Pa, p=0.084; p =0.69 for difference between the two methodologies).
Conclusions: The centreline methodology provides geometrically correct models and permits reliable ESS computation. The ability to utilise data acquired during routine coronary angiography and IVUS examination will facilitate clinical investigation of the role of local ESS patterns in the natural history of coronary atherosclerosis.
Introduction
The effect of local blood flow patterns on atherosclerosis initiation and progression has been recognised for more than 40 years and has been extensively studied in several ex vivo and in vitro experimental models1-3. Over the last decade, advances in signal and image processing have permitted the development of 3-dimensional (3-D) patient-specific arteries that allowed in vivo evaluation of endothelial shear stress (ESS) distribution and study of the implications of blood flow on coronary atherosclerosis4-7. Numerous imaging modalities are currently available for the reconstruction of coronary anatomy, including x-ray angiography, magnetic resonance imaging and coronary computed tomographic angiography (CCTA); however, the most prominent and widely accepted are complex methodologies that rely on the fusion of coronary angiography and intravascular ultrasound (IVUS) imaging8-14. The reconstructed models obtained using these approaches provide a unique and detailed representation of coronary pathology as x-ray angiography gives information about vessel geometry, while IVUS permits accurate assessment of luminal and vessel wall morphology, and evaluation of plaque progression.
Significant limitations of the proposed data fusion methodologies restricting their applications in research are the tedious protocols that should be followed in order to acquire the necessary data for coronary reconstruction and the increased computational time required to fuse IVUS and coronary angiography. Most of the available methods involve additional imaging of calibration objects and the acquisition of additional angiographic projections that provide simultaneous visualisation of the IVUS catheter and the luminal silhouette, and are necessary for the extraction of the 3-D geometry of the catheter path.
In this study, we introduce and validate a new methodology for the 3-D reconstruction of coronary anatomy from IVUS and x-ray angiography which aims to facilitate the investigation of the role of haemodynamic factors in the natural history of coronary artery disease. The proposed approach requires only an IVUS pullback sequence and two angiographic images obtained from two different views to reconstruct the vessel geometry, thus allowing retrospective analysis of data acquired during routine IVUS examination. To evaluate the accuracy of the proposed methodology we compare the geometries of the derived models and the computed ESS with the output of a conventional well-validated reconstruction approach.
Methods
PATIENT POPULATION
Twenty-two patients who underwent coronary angiography and IVUS examination were included in the current analysis. Twelve patients (four native and eight stented coronary arteries) had invasive assessment for clinical purposes at one time point, while the other 10 had been recruited in the Prediction of Progression of Coronary Artery Disease and Clinical Outcome Using Vascular Profiling of Shear Stress and Wall Morphology (PREDICTION) study and underwent IVUS and coronary angiographic evaluation at two time points (baseline and six to 10-month follow-up)15. Written informed consent was obtained from all patients for using the data for research purposes.
DATA ACQUISITION
IVUS imaging was performed by a Galaxy IVUS system (Atlantis 40 MHz SR Pro IVUS catheter; Boston Scientific, Natick, MA, USA) with the use of an automated pullback device which withdrew the IVUS catheter at a constant speed of 0.5 mm/sec. Biplane angiographic images were acquired in the setting of diluted contrast agent injection after inserting and positioning the IVUS catheter distally to a branch serving as a distal landmark. IVUS examination was completed when the transducer reached the guide catheter. The obtained data were stored in DICOM format and transferred to a workstation for off-line analysis.
IMAGE ANALYSIS AND 3-D RECONSTRUCTION
The IVUS sequences were reviewed by an expert observer who identified the presence of the most distal and proximal anatomical landmark (i.e., a side branch) that could be identified in both IVUS and x-ray angiography. The segment between the IVUS frames that portrayed the detected anatomical landmarks was further analysed by the observer who selected the end-diastolic IVUS images and identified the lumen and media-adventitia borders. These borders were then fused with the angiographic data to reconstruct the coronary anatomy.
Two end-diastolic images were selected by the biplane angiographic projections that portrayed the luminal borders, the IVUS catheter and the most distal and proximal anatomical landmark also seen in the IVUS sequence. The coronary segment defined from the distal and proximal landmark was reconstructed using two methodologies: a well-validated conventional method and the proposed centreline methodology.
CONVENTIONAL 3-D RECONSTRUCTION METHOD
The conventional methodology has previously been described and validated in detail and requires the acquisition of angiographic images during partial contrast injection that will allow identification of the IVUS catheter path and the luminal silhouette. In these images an expert observer sets control points to delineate the course of the IVUS catheter10,16. These points define a B-spline which is extruded normally to its plane forming a surface. The intersection of the two surfaces is a 3-D curve which corresponds to the 3-D catheter path (Figure 1)16. The extracted path is divided into equidistant segments that are equal to the number of the end-diastolic IVUS frames and then each IVUS border is placed perpendicularly onto the catheter path, in the corresponding segment. The axial twist of the IVUS catheter occurring during its pullback (i.e., induced by the tortuosity of the traversed pullback path) and as a consequence the relative twist (i.e., relative rotational orientation) of the IVUS frames (e.g., in Figure 2A the angle φ1 for the 2nd frame, the φ2 for the 3rd frame, etc.) is estimated with the use of the sequential triangulation algorithm which is a simplification of the Frenet–Serret formulas8,17. The absolute orientation of the first IVUS frame is determined using a methodology that relies on the comparison of the silhouette of the lumen in the angiographic projections with the back-projected model. The angle of the first frame at which the best matching is achieved corresponds to the correct absolute orientation9.
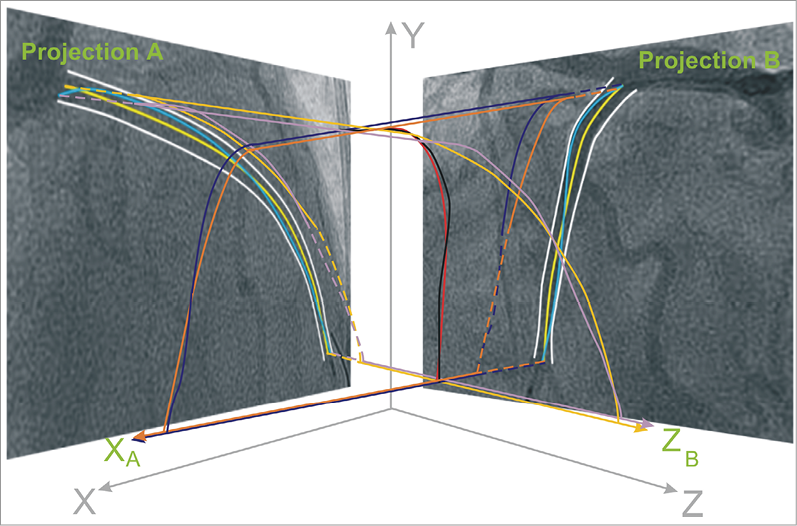
Figure 1. Schematic representation of the methodology implemented to extract the 3-dimensional (3-D) catheter path and the luminal centreline in the conventional and centreline methodology, respectively. In the biplane projections the operator approximates the trajectory of the catheter path (blue curves) by setting control points which are used to define 2 B-splines. These B-splines are then extruded perpendicularly to the angiographic planes at a normal vector (XA for projection B and ZB for projection A) forming two surfaces (illustrated with purple for projection A and dark blue for projection B). The intersection of the two surfaces is a 3-D B-spline (black curve) which corresponds to the catheter path. In the proposed centreline methodology, the extraction of the 3-D centreline requires the detection of the luminal borders (white curves) in each biplane projection and the identification of the 2-D luminal centreline (yellow curve). Then the same process is followed to form 2 B-spline surfaces (tan for projection A and orange for projection B) and define their intersection that represents the 3-D luminal centreline (red curve).
CENTRELINE 3-D RECONSTRUCTION METHOD
The proposed methodology constitutes a modification of the abovementioned method as it utilises the luminal centreline in each biplane projection to reconstruct the coronary artery and not the catheter path. In particular, the selected end-diastolic angiographic images were processed to identify the luminal borders, and then estimate the luminal centreline18. The two centrelines detected in the biplane views were used to extract the 3-D lumen centreline according to the abovementioned approach used for the extraction of the 3-D IVUS catheter path (Figure 1)16. The 3-D lumen centreline was then divided into equidistant segments corresponding to the number of the end-diastolic IVUS frames.
In each end-diastolic IVUS frame the luminal and media-adventitia borders were detected. In addition, in the frames portraying the origin of side branches, vectors were drawn to mark their direction (Figure 3). These vectors and the luminal borders detected in the remaining frames were placed perpendicularly onto the extracted luminal centreline in the corresponding segment in such a way so that the centre of the IVUS luminal border (but not the centre of the branches’ vectors) is positioned in the middle of the corresponding segment. The relative axial twist (i.e., relative rotational orientation) of the IVUS frames along the 3-D centreline was estimated using the sequential triangulation algorithm (e.g., in Figure 2A the angle φ1’ for the 2nd frame, the angle φ2’ for the 3rd frame, etc.) similarly to the abovementioned conventional method17; in the centreline approach, the sequential triangulation algorithm calculates the twist induced by the tortuosity of the traversed pullback path which is considered to be along the 3-D centreline. Then the first IVUS frame was rotated around the extracted 3-D centreline in order to determine its absolute orientation. For this purpose, the reconstructed artery was visually projected onto the angiographic images and the vectors indicating the direction of the branches in the IVUS images were compared with the silhouette of the corresponding branches in each angiographic projection. The rotation angle of the first frame at which the best match was achieved between the vectors and the silhouette of the corresponding side branches corresponded to the correct absolute orientation of the first frame (Figure 3). After establishing the absolute orientation, the vectors that indicate the direction of the side branches were replaced by the corresponding luminal borders to reconstruct the luminal anatomy. The same process was then followed to reconstruct the media-adventitia anatomy using the same absolute orientation of the first frame.
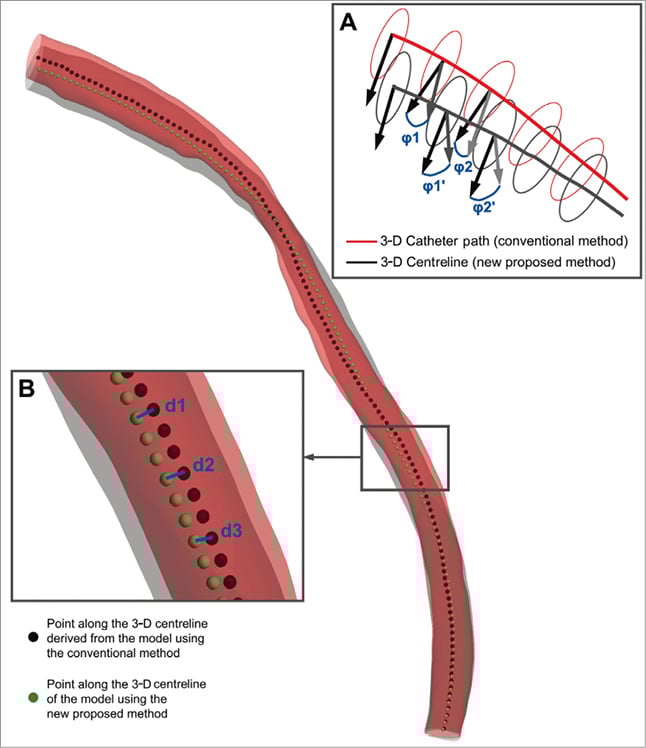
Figure 2. Methodologies implemented to compare the models provided by the centreline (grey model) and the conventional (red model) 3-dimensional (3-D) reconstruction method: the 3-D reconstructions of a left anterior descending coronary artery are presented as example; the dark red colour represents the overlapping areas of the two models. (A) The luminal borders detected in intravascular ultrasound (IVUS) frames are placed perpendicularly onto the extracted 3-D lumen centreline (grey curve) or the 3-D IVUS catheter path (red curve), and their relative axial twist is determined based on the geometry of the 3-D centreline (angle φ1’ for the 2nd frame, φ2’ for the 3rd frame, etc.) and 3-D catheter path (angle φ1 for the 2nd frame, φ2 for the 3rd frame, etc.), respectively. The angle difference (e.g., φ1-φ1′, φ2-φ2′, etc.) corresponds to the difference between the two methodologies for the estimation of the relative axial twist. (B) To compare the overall geometry of the models derived by the two approaches we extracted the 3-D lumen centreline of each model and defined points at 0.5 mm intervals. The Euclidean distance (blue lines; d1, d2, d3, etc.) between corresponding points identified on the centreline of the model derived by the proposed centreline (green points) and the conventional (black points) approach represents the difference in the overall geometry of the two reconstructions.
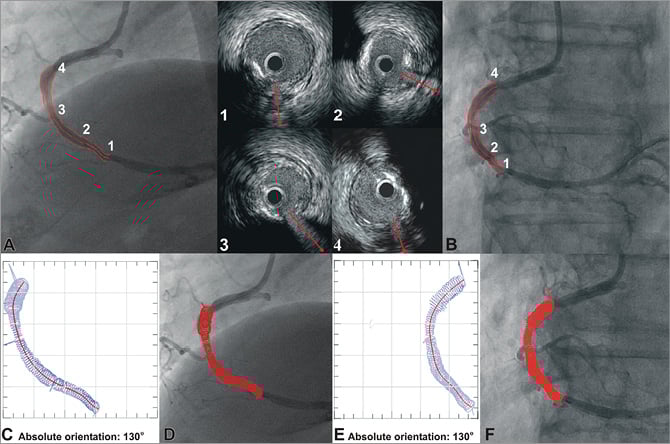
Figure 3. Methodology for determining the absolute orientation of the first IVUS frame. The side branches are identified in the angiographic (A, B) and end-diastolic IVUS images by an expert observer who draws vectors in IVUS to mark their direction (upper mid panel). These vectors and the luminal borders detected in the remaining frames are placed onto the extracted luminal centreline and their relative axial twist is estimated using the sequential triangulation algorithm. The first IVUS frame is then rotated around the luminal centreline, the reconstructed lumen is visually projected onto the angiographic images, and the direction of the vectors indicating the side branches in the IVUS images is compared with the location of the origin of the corresponding branches in each projection. The rotation angle of the first frame at which the best matching is achieved corresponds to the correct absolute orientation of the first frame (C-F).
The lumen and media-adventitia boundary points derived from the abovementioned methodologies for each artery were used to construct two non-uniform rational B-spline surfaces (NURBS)using routine computer-aided design software and thus rebuild the lumen and outer vessel wall geometry in 3-D space, respectively.
BLOOD FLOW SIMULATION AND ESS COMPUTATION
The obtained geometries were further processed with computational fluid dynamics techniques which allow the generation of a finite volume mesh in order to perform blood flow simulation by solving the 3-D transport equations governing the conservation of mass and momentum (ICEM CFD and CFX 11; Ansys, Canonsburg, PA, USA)19. Blood was treated as a homogeneous and Newtonian fluid with a dynamic viscosity of 0.0035 Pa·s and a density of 1,050 kg/m3. Blood flow was assumed to be laminar and incompressible, and a patient-specific steady flow with a uniform profile was specified at the inlet; developed flow was assumed to be established after an entrance length of 3 mm, and thus the proximal 3 mm were excluded from the analysis. Coronary blood flow for each patient was estimated by measuring the angiographic frames required for the contrast agent to pass from the inlet to the outlet of the reconstructed segment, the volume of the 3-D lumen and the cine frame rate. The arterial wall was considered to be rigid and no-slip conditions were applied at the vessel wall, while zero pressure conditions were imposed at the outlet. ESS at the lumen surface was calculated as the product of blood viscosity and the gradient of blood velocity at the wall.
VALIDATION METHODOLOGY
To assess the accuracy of the centreline reconstruction methodology we compared its output with the models obtained by the conventional reconstruction method, which was considered to be the reference gold standard. Several metrics were used for this purpose. The geometry of the models derived by the gold standard and the proposed centreline approach was compared by: 1) measuring the Euclidean and the Hausdorff distance between corresponding points identified on the centrelines of the two reconstructions at 0.5 mm intervals (Figure 2B)20; 2) computing the luminal, outer vessel wall and plaque volume in the models derived by the two approaches (the outer vessel wall and the plaque volume were assessed only in the 10 patients recruited in the PREDICTION study who had serial invasive evaluation); and 3) calculating the angle difference for the relative axial twist of the IVUS frames (i.e., in Figure 2A the difference φ1-φ1’ for the 2nd frame, the φ2-φ2’, for the 3rd frame, etc.) and the absolute orientation of the first IVUS frame in the reconstructions obtained by the two methods. The latter two metrics reflect the overall agreement of the two approaches in estimating the distribution of the plaque in 3-D space.
Each 3-D reconstructed coronary artery was divided in consecutive 3 mm segments. We chose 3 mm segments since this length has previously been shown to reflect accurately the local haemodynamic and vascular characteristics in experimental and human studies investigating the role of ESS in the pathophysiology and natural history of coronary artery disease15,21. Within each 3 mm segment we assessed the local ESS and lumen area. In addition, the serial angiographic and IVUS examinations performed on the 10 patients recruited in the PREDICTION study were used to reconstruct the coronary anatomy at two time points (baseline and six to 10-month follow-up), evaluate baseline plaque characteristics (i.e., local maximal plaque thickness and plaque burden [plaque area/outer vessel wall area]) measured within each 3 mm segment, assess plaque progression (defined as the change in plaque burden at follow-up), and investigate the association between plaque progression and baseline ESS. The abovementioned metrics were determined in the models derived by the centreline and the conventional approaches and compared. Segments located at the take-off of side branches were excluded from the analysis. A total of 285 3 mm segments were available at baseline for assessing average lumen area and local ESS and, of those, 98 were available from arteries with serial data reconstructed at two time points.
STATISTICS
Continuous data are presented as mean ± standard deviation. Linear regression analysis and the Pearson correlation coefficient (r) were used to compare various metrics in the models obtained by the two approaches. Bland-Altman analysis was also performed to assess the agreement of these metrics. Receiver operator characteristic curve analysis was performed to test the diagnostic efficiency of the proposed methodology for the identification of low ESS regions (<1 Pa), which have been associated with atherosclerosis progression, a high-risk plaque phenotype and the occurrence of future clinical events in humans15. The overall relationship between ESS and change in plaque burden was computed using a linear mixed model adjusting for the clustering of 3 mm segments within patients. A p<0.05 was considered statistically significant. All analyses were performed using the commercial software SPSS 17.0 (SPSS Inc., Chicago, IL, USA).
Results
PATIENT CHARACTERISTICS
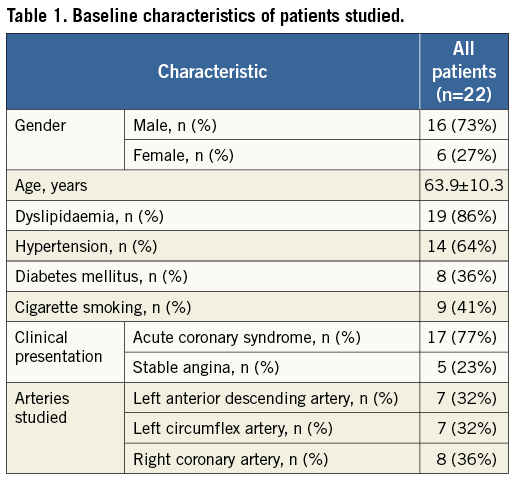
The baseline characteristics of the 22 patients studied are presented in Table 1. At baseline the arteries studied included seven left anterior descending, seven circumflex, and eight right coronary arteries, and repeat IVUS and x-ray angiography at follow-up was performed in three left anterior descending, four circumflex and three right coronary arteries.
GEOMETRICAL COMPARISON OF THE 3-D RECONSTRUCTED MODELS
Coronary reconstruction was performed successfully in all studied coronary arteries using both methodologies. The average length of the 22 reconstructions (12 arteries with one-time assessment and 10 baseline arteries with serial evaluation) was 52.1±14.1 mm (range: 32 to 94 mm). The Euclidean and Hausdorff distances between corresponding points identified in the centrelines of the models derived by the centreline and the conventional methods are given in Table 2. The relative axial twist in the models ranged from 0.7° to 76°. The mean difference in the estimation of the relative axial twist was only 1.9±1.9° and 1.4±1.6° for the baseline and follow-up reconstructions, respectively (mean difference for all 32 models: 1.8±1.8°). Subgroup analysis of arteries with an increased tortuosity (five arteries with an overall relative axial twist >20° estimated by the sequential triangulation algorithm) also showed a small mean difference of 4.9±1.7° regarding the relative axial twist. A good agreement was noted with regard to the absolute orientation of the first IVUS frames between the proposed and the conventional methodology (Table 2).
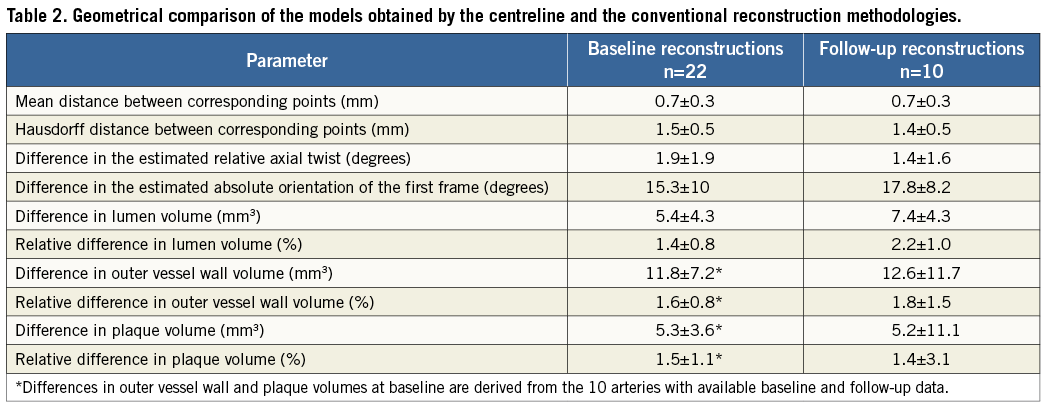
At baseline the relative difference between the centreline and the conventional approaches for the lumen, outer vessel wall and plaque volume was 1.4±0.8%, 1.6±0.8% and 1.5±1.1%, respectively. No major differences were found in the follow-up models (Table 2).
There was an excellent correlation for the average lumen area within the 3 mm segments (r=0.999; Figure 4A), while the average difference between the reconstructions obtained by the two methods was 0.098±0.15 mm2 (Figure 4A’). The correlation for the maximum plaque thickness (r=0.992; Figure 4B) and plaque burden (r=0.998; Figure 4C) measured at baseline was also high, and the average difference of corresponding 3 mm segments between the two reconstructions was −0.023±0.05 mm (Figure 4B’) and −0.69±0.94% (Figure 4C’), respectively.
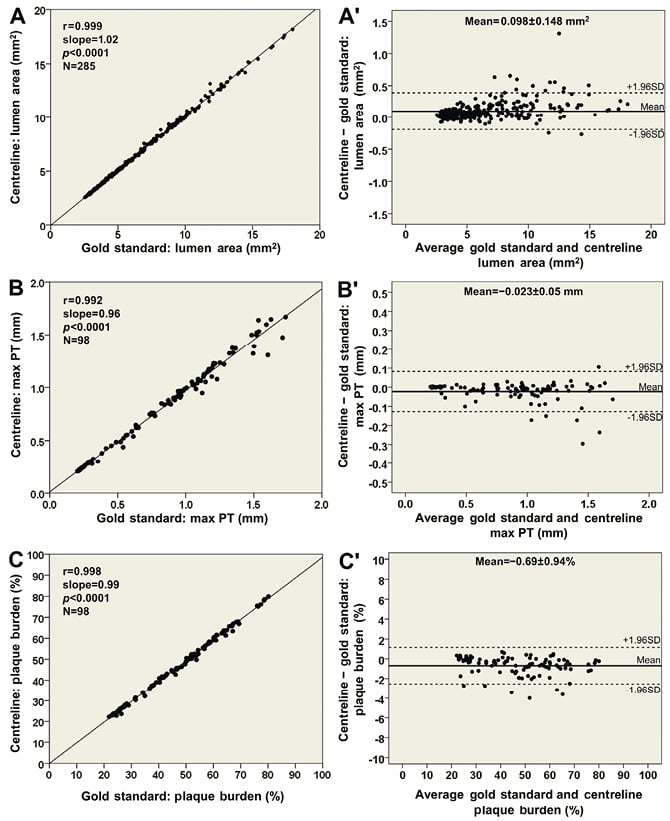
Figure 4. Comparisons based on 3-dimensional 3 mm segments between the new methodology using the lumen centreline and the conventional methodology, which was treated as the reference gold standard. Correlations in assessing (A) lumen area (22 arteries; 285 segments), (B) maximum plaque thickness (max PT; 10 arteries; 98 segments), and (C) plaque burden (plaque area/outer vessel wall area; 10 arteries; 98 segments). Bland-Altman plots show the differences in lumen area (A′), maximum plaque thickness (B′) and plaque burden (C′); the mean±standard deviation values are denoted on the plots.
ASSESSMENT OF ESS DISTRIBUTION AND PLAQUE PROGRESSION
The ESS measurements within the 3 mm segments correlated highly in the reconstructions derived by the two methodologies (r=0.993; Figure 5A) resulting in a mean difference of −0.04±0.24 Pa (Figure 5B). Furthermore, the new, simplified centreline methodology showed excellent diagnostic efficiency for identifying low ESS regions using the cut-off of 1 Pa (receiver operator characteristic area under the curve: 99.5%; Figure 5C) while the overall agreement for categorising 3 mm segments with low versus higher ESS was 98%. Figure 6 portrays examples of the 3-D models of a left anterior descending and a right coronary artery demonstrating the high similarity of ESS distribution between the reconstructed models using the two methodologies.
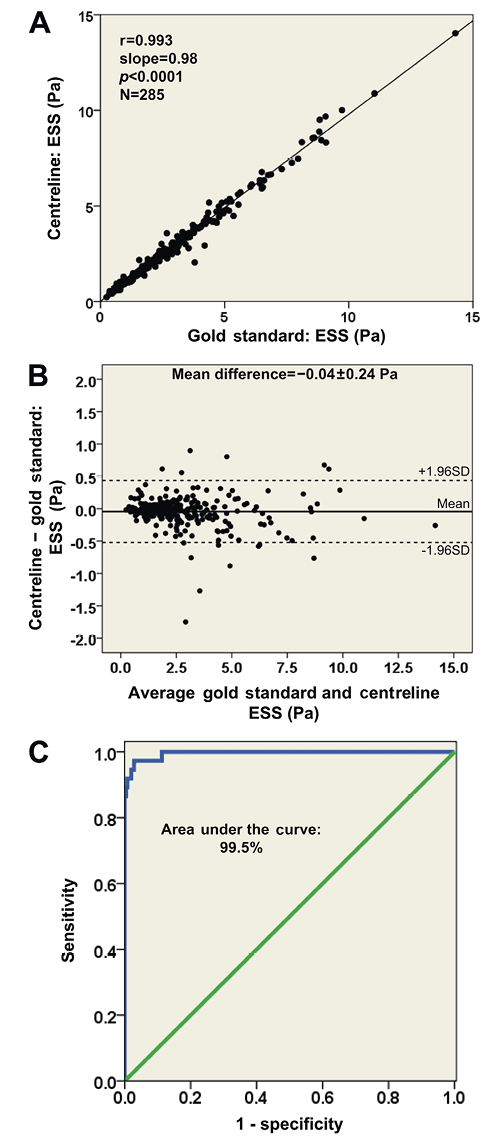
Figure 5. Comparison of the average endothelial shear stress (ESS) distribution in 3-dimensional (3-D) 3 mm segments (22 arteries; 285 segments) between the proposed methodology using the lumen centreline and the conventional methodology, which was treated as the reference gold standard: (A) correlation plot; and (B) Bland-Altman plot demonstrating a difference of −0.04±0.24 Pa in assessing average ESS. (C) Receiver operator characteristic curve plot demonstrating a high diagnostic efficiency (area under the curve: 99.5%) of the 3-D models derived from the centreline methodology to detect regions with low ESS (<1 Pa) identified on the 3-D models obtained by the conventional methodology.
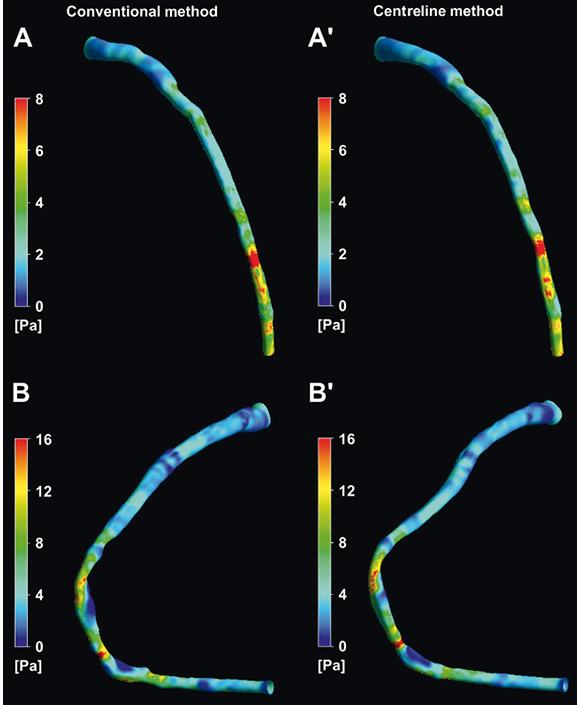
Figure 6. Three-dimensional reconstructed models of a left anterior descending and a right coronary artery using the conventional (A and B) and the centreline (A′ and B′) methodologies, and colour-coded mapping of endothelial shear stress (ESS) values. There is a high visual similarity in the ESS distribution.
A high correlation (r=0.982; Figure 7A) was noted for the change in plaque burden between the two approaches in the 10 arteries reconstructed at baseline and follow-up, while the mean difference in the change in plaque burden was 0.05±1.09% (Figure 7A’). Both methodologies demonstrated a negative correlation between ESS and change in plaque burden (beta= −1.65%/Pa [95% CI: −3.55 to 0.24%/Pa], p=0.078 for the centreline approach; and beta= −1.64%/Pa [95% CI: −3.57 to 0.29%/Pa], p=0.084 for the conventional methodology). There was no difference in the artery-specific slopes derived by the two methods (p=0.69).
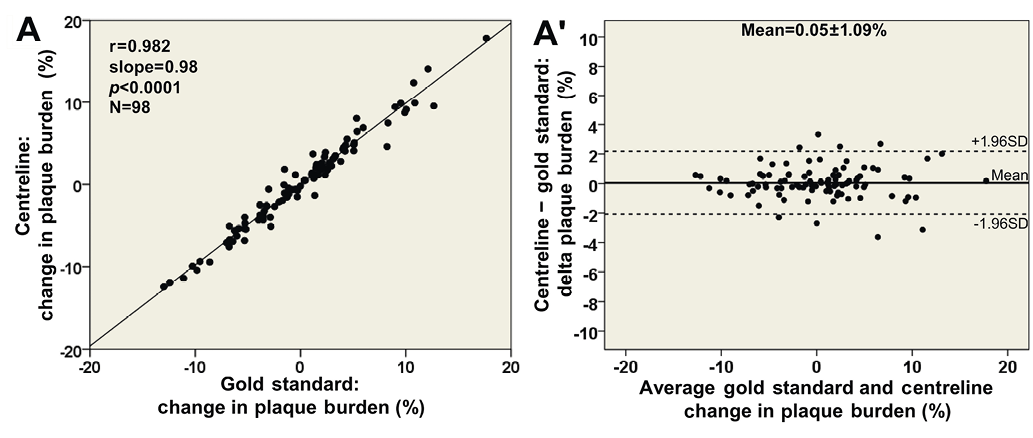
Figure 7. Comparison of the change in plaque burden during follow-up in 3 mm segments (10 arteries) between the centreline methodology using the lumen centreline and the conventional methodology, which was treated as the reference gold standard: (A) correlation plot; and (B) Bland-Altman plot demonstrating a difference of 0.05±1.09% in assessing plaque progression/regression.
Discussion
This study introduces a new, simplified centreline approach for the reconstruction of coronary anatomy from angiographic and IVUS data. The efficacy of the new method was validated against an established reconstruction methodology which was regarded as the gold standard. The reconstructed models obtained by the centreline approach: 1) allow reliable coronary representation and quantification of the luminal dimensions and atheroma burden; 2) permit accurate evaluation of the ESS distribution and identification of the segments that are exposed to an athero-promoting, low ESS environment; and 3) provide reliable estimations about the association between ESS and plaque progression.
Since the development of the first methodology for the fusion of IVUS and coronary angiography, several efficient techniques have been proposed which overcame initial limitations, permitted comprehensive representation of coronary anatomy, and provided 3-D models that enabled the application of computational fluid dynamics techniques and the investigation of the effect of ESS on coronary artery disease progression8-10,16,22. Nevertheless, the broad application and utilisation of these techniques was limited as coronary reconstruction required pre-planning and the implementation of time-consuming non-routine imaging protocols. To address these pitfalls, Tu et al introduced a simplified methodology for off-line integration of IVUS/optical coherence tomography (OCT) and angiographic data23,24. However, their approach focused mainly on the co-registration of this information rather than the actual fusion of IVUS and angiographic data and the reliable representation of coronary anatomy, as it is unable to estimate the relative twist of the IVUS frames and the correct absolute orientation of the first image onto the luminal centreline. The recently developed methodologies for the reconstruction of coronary anatomy from IVUS and CCTA may incorporate algorithms for the orientation of IVUS frames but they require both invasive and non-invasive imaging of the patients studied, and they have not been validated using an established approach as gold standard25,26.
In contrast to previous studies, we present a new method for reliable 3-D coronary artery reconstruction using data acquired during routine coronary angiography and IVUS examination, and provide direct comparison of the geometry and ESS distribution of the models derived by the new simplified method and an established well-validated 3-D reconstruction approach. We found that the error introduced by approximating the catheter path with the luminal centreline was minor and did not affect the morphology of the reconstructed vessel (mean distance between corresponding points in the centrelines of the 32 reconstructions: 0.71±0.28 mm). In addition, the relative axial twist of the luminal centreline was similar to the twist of the catheter path (difference of the relative axial twist for the 32 models: 1.8±1.8°), whereas the difference for the 32 reconstructions in the absolute orientation of the first frame was only 16.1±9.5°. These metrics and the volumetric measurements indicate that the centreline methodology allows geometrically correct coronary representation and provides accurate quantification of the luminal dimensions and atheroma burden14. Most importantly, the evaluation of ESS distribution showed that the proposed approach can detect coronary regions that are exposed to a pro-atherogenic low ESS environment with high accuracy, and permits reliable assessment of the effect of haemodynamic factors on plaque progression. These findings will facilitate widespread investigation of the role of local haemodynamic factors in the natural history of atherosclerosis.
The recently reported PREDICTION study demonstrated that ESS not only critically affects plaque localisation and evolution but also has significant prognostic implications. The presence of low ESS and an increased plaque burden predicted future revascularisations with a predictive value of 41%, whereas in the Providing Regional Observations to Study Predictors of Events in the Coronary Tree (PROSPECT) trial the ability of the IVUS radiofrequency backscatter analysis data (presence of a thin-cap fibroatheroma, plaque burden ≥70%, and minimum lumen area ≤4 mm2) to predict future events was 18%15,27. These findings not only highlight the significant role of local blood flow patterns on plaque growth but also underscore the need to obtain complete representation of both coronary anatomy and understand the dynamic pro-atherosclerotic and pro-inflammatory pathobiologic mechanisms responsible for the development and progression of future culprit lesions. The proposed approach is expected to facilitate the fusion of coronary angiographic data with the information provided by other available or upcoming intravascular techniques (e.g., IVUS-near infrared spectroscopy, OCT, OCT-IVUS hybrid imaging or OCT-near infrared fluorescence imaging) since the centreline approach does not require imaging of the catheter path but relies on the lumen centreline to extract vessel geometry. These combined imaging data will provide information about vessel geometry, the composition of the plaque and the biological activity of the vessel wall, and will expand the potential for investigating in vivo the impact of haemodynamic forces on local plaque inflammation and on the characteristics related to increased vulnerability28-30. Furthermore, the new centreline approach may be used to analyse available clinical data from various patient populations retrospectively, since it does not require any pre-planning for data acquisition, and to facilitate the conducting of large prospective studies on the natural history of coronary atherosclerosis that will explore the effect of ESS on plaque destabilisation and rupture, and identify predictors of future culprit lesions31.
Limitations
A limitation of the proposed methodology is that it requires a number of hours to reconstruct the coronary anatomy and perform blood flow simulation but, with increasing computational resources, this time can be substantially shortened. Furthermore, the use of the average ESS measurements in 3 mm segments is likely to mask very local differences between the ESS computed in the models derived from the two methodologies. However, as our study showed, potential very local differences in ESS did not affect the relationship between ESS and plaque progression assessed in 3 mm segments in models reconstructed by the conventional compared to the centreline approach. Thus, the centreline methodology can be used for extensive in vivo investigations into the role of local haemodynamic factors on plaque development and vessel wall characteristics.
Conclusions
The current report introduces a centreline methodology for the reconstruction of coronary anatomy from IVUS and x-ray angiography. The validation of the centreline approach using a conventional methodology as gold standard demonstrated that it is able to provide reliable coronary representation and assessment of the ESS distribution. The ability of the centreline approach to reconstruct the coronary anatomy from data acquired during a routine IVUS examination makes it particularly useful in clinical research as it is expected to broaden the application of the 3-D reconstruction methodologies in the study of the effect of ESS on the evolution of atherosclerosis.
Acknowledgements
C. V. Bourantas is funded by the Hellenic Heart Foundation and M. I. Papafaklis by the George D. Behrakis Fellowship.
Funding
This work was partly funded by the European Union (European Regional Development Fund- ERDF) and the Greek national funds through the Operational Program “THESSALY- MAINLAND GREECE AND EPIRUS-2007-2013” of the National Strategic Reference Framework (NSRF 2007-2013) (MIS 348133, “Development of a software based on image analysis and the calculation of shear stresses for the optimal assessment and interventional treatment of coronary artery stenosis”).
Conflict of interest statement
The authors have no conflicts of interest to declare.