Abstract
Aims: To evaluate the implications of an Absorb bioresorbable vascular scaffold (Absorb BVS) on the morphology of the superficial plaques.
Methods and results: Forty-six patients who underwent Absorb BVS implantation and 20 patients implanted with bare metal stents (BMS) who had serial optical coherence tomographic examination at baseline and follow-up were included in this analysis. The thin-capped fibroatheromas (TCFA) were identified in the device implantation regions and in the adjacent native coronary segments. Within all regions, circumferential locations of TCFA and calcific tissues were identified, and the neointimal thickness was measured at follow-up. At six to 12-month follow-up, only 8% of the TCFA detected at baseline were still present in the Absorb BVS and 27% in the BMS implantation segment (p=0.231). Sixty percent of the TCFA in native segments did not change their phenotype at follow-up. At short-term follow-up, significant reduction in the lumen area of the BMS was noted, which was higher compared to that reported in the Absorb BVS group (–2.11±1.97 mm2 vs. –1.34±0.99 mm2, p=0.026). In Absorb BVS, neointima tissue continued to develop at midterm follow-up (2.17±0.48 mm2 vs. 1.38±0.52 mm2, p<0.0001) and covered the underlying tissues without compromising the luminal dimensions (5.93±1.49 mm2 vs. 6.14±1.49 mm2, p=0.571) as it was accommodated by the expanded scaffold (8.28±1.74 mm2 vs. 7.67±1.28 mm2, p<0.0001).
Conclusions: Neointimal tissue develops following either Absorb BVS or BMS implantation and shields lipid tissues. The neointimal response in the BMS causes a higher reduction of luminal dimensions compared to the Absorb BVS. Thus, Absorb BVS may have a value in the invasive re-capping of high-risk plaques.
Introduction
Bioresorbable vascular scaffolds (BVS) are a novel technology that introduces a unique potential in the treatment of coronary atherosclerosis as they provide transient scaffolding which temporarily safeguards the patency of the vessel and, once resorbed, they allow the vessel to restore its physiological integrity1-3. The mechanisms involved in BVS degradation depend on the composition of the scaffold. In the case of the Absorb BVS, degradation implies hydrolysis of the two polymers (poly-L-lactide and poly-D,L-lactide) which, along with the end-stage phagocytosis of crystals, ultimately form lactic acid molecules that can be fully catabolised. In the first year after implantation, degradation progresses steadily without the appearance of mass loss. The protruded struts of the scaffold create a neointima-promoting haemodynamic environment that triggers neointimal proliferation4. The final outcome of these processes is the development of neointima, which consists of connective tissue and smooth muscle cells, that covers the underlying plaque5. The neointima that develops post Absorb BVS implantation has features that have been shown to be potentially associated with plaque stability, and has been hypothesised to be able to shield high-risk plaques6.
The aim of the current analysis was to examine the implications of the Absorb BVS on the phenotype of the plaque and compare the changes in plaque morphology with those occurring after bare metal stent (BMS) implantation. For this purpose, we analysed serial optical coherence tomographic (OCT) data obtained from patients implanted with an Absorb BVS or a BMS and we used spread-out vessel plots to portray the spatial distribution of the different plaque types and to measure the thickness of the neointima at follow-up.
Methods
INCLUDED PATIENTS AND STUDY DESIGN
This study is an observational post hoc analysis of the data acquired in the ABSORB cohort B trial (A Clinical Evaluation of the Everolimus Eluting Bioresorbable Vascular Scaffold System in the Treatment of Patients with de Novo Native Coronary Artery Lesions), the Svelte Coronary Stent Integrated Delivery System (IDS) first-in-man trial and the vShield Evaluated at Cardiac hospital in Rotterdam for Investigation and Treatment of thin-cap fibroatheromas (SECRITT) study. The design and results of each study have been described in detail elsewhere7-9. In brief, the ABSORB cohort B study was a prospective multicentre single-arm trial which examined for the first time the safety and efficacy of the second-generation Absorb BVS (Abbott Vascular, Santa Clara, CA, USA) (dimensions: 3.0×18 mm) in 101 patients with a single or two-vessel de novo lesions8. The Svelte Coronary Stent IDS first-in-man trial was a multicentre, prospective, single-arm study designed to assess the safety and short-term performance of the Svelte Coronary IDS stent (a balloon-expandable, cobalt-chromium, thin-strut fixed wire BMS) in 47 patients with de novo coronary lesions, whereas the SECRITT study was a pilot prospective single-centre randomised control trial that aimed to assess the feasibility and safety of shielding non-obstructive high-risk plaques with a self-expanding thin-strut vascular shield (vProtect™ system; Prescient Medical, Inc., Doylestown, PA, USA)7,9.
The patients recruited in the ABSORB cohort B study were divided into two groups (cohort B1 and cohort B2). Cohort B1 underwent coronary angiography, greyscale intravascular ultrasound (IVUS), IVUS virtual histology (IVUS-VH) and OCT evaluation at baseline (post-procedure), and at six-month and two-year follow-up. Cohort B2 underwent the same investigations at baseline, one-year and three-year follow-up. OCT examination was an optional study and thus some patients did not have this investigation. The patients recruited in the Svelte Coronary Stent IDS first-in-man trial and the SECRITT study had OCT examination at baseline and repeat invasive assessment and OCT re-evaluation at six-month follow-up. All the patients recruited in our analysis had serial OCT evaluation at baseline (post scaffold or BMS implantation), and any follow-up time point. The ABSORB cohort B study was sponsored and financially supported by Abbott Vascular. The protocol of the three studies was approved by the human research committee of the institutions that participated. Informed consent was obtained from all patients.
QUANTITATIVE CORONARY ANGIOGRAPHY
Quantitative coronary angiography (QCA) was performed in corresponding end-diastolic angiographic images acquired pre and post device deployment and at follow-up using dedicated software (CAAS II; Pie Medical Imaging BV, Maastricht, The Netherlands, or QCA-CMS; Medis, Leiden, The Netherlands). For each treated lesion the following metrics were obtained: reference vessel diameter (RVD), estimated using an interpolated approach, minimum lumen diameter (MLD), diameter stenosis (DS), and late lumen loss (LLL), defined as the difference between the MLD post-procedure and the MLD at follow-up.
OPTICAL COHERENCE TOMOGRAPHY
OCT images were acquired using either an M3 time-domain, or a C7-XR Fourier-domain system (LightLab Imaging Inc., Westford, MA, USA). Pullback in all systems was performed with the use of an automated pullback device at a speed of 3 mm/s for the M3, and 20 mm/s for the C7-XR system, while the frame rates were 20 frames/s and 100 frames/s, respectively. The OCT data acquired post scaffold implantation and at follow-up were analysed by two operators (Cardialysis BV, Rotterdam, The Netherlands) blinded to the examination time and patients’ procedural and clinical characteristics, using dedicated off-line software (St. Jude Medical Inc., St. Paul, MN, USA). In the segments implanted with an Absorb BVS or a BMS the two operators selected the frames portraying the scaffolded/stented segment (defined by the most distal and most proximal frames that showed at least one strut of the devices) and analysed one frame every three frames (0.43 mm interval) in the sequences acquired with the M3 system, and one frame every two frames (0.4 mm interval) in the sequences obtained by the C7-XR system10.
Lumen and scaffold border detection was performed using the methodology described by Serruys et al8. In brief, at baseline the lumen area was delineated by the endoluminal border of the vessel wall and the abluminal side of the scaffold struts if these were embedded or well apposed in the vessel wall. In case of malapposed struts, the lumen border was defined by the endoluminal contour of the vessel wall behind the malapposed struts. At follow-up, the lumen was delineated by the endoluminal border of the neointima tissue. At all time points, the scaffold borders were defined by the abluminal side of the scaffold’s struts. In the segments treated with a BMS, the lumen border was defined by the endoluminal border of the vessel wall and the stent border by a curve connecting the hyperintense signal of the metallic struts. The detected borders were used to calculate the lumen area, the scaffold/stent area and the neointima area (given as: scaffold/stent area - lumen area).
In the selected cross-sections, the operators identified vessel wall discontinuities post-procedure and assessed the composition of the plaque (Online Appendix, Online Figure 1-Online Figure 5). These data were then used to construct spread-out scaffold/stent plots which allowed comprehensive visualisation and quantification of the composition of the superficial plaque as well as estimation of the mean and minimum thickness of the neointima over different tissues (Online Appendix, Online Figure 1-Online Figure 5).
In addition, the two observers reviewed the OCT images, acquired post scaffold implantation, and identified thin-cap fibroatheromas (TCFA) in the native segments located proximal and distal to the scaffold (Online Appendix, Online Figure 1-Online Figure 5). Anatomical landmarks proximal and distal to the TCFA (i.e., the origin of a side branch or the proximal or distal end of the scaffold) were used to define the segment of interest and to identify correspondence between baseline and follow-up examinations. These segments were used as control segments to examine the natural evolution of the TCFA in patients implanted with an Absorb BVS.
STATISTICAL ANALYSIS
Continuous variables are reported as mean and standard deviation whereas categorical values are presented as absolute values and percentages. Comparison between continuous variables at different time points was performed using the Wilcoxon signed-rank test while the Mann-Whitney U test was used for independent two-sample comparisons of the continuous variables. Comparison between categorical variables was performed using the Fisher’s exact test. To control for patient effect, mixed models with random intercept were used to estimate the overall association between thickness, stent type, plaque type and follow-up time. A p-value <0.05 was considered statistically significant. Data analysis was performed using the Statistical Package for Social Sciences (SPSS) version 16.0 (SPSS Inc., Chicago, IL, USA) and SAS version 9.2 (SAS Institute Inc., Cary, NC, USA).
Results
PATIENT CHARACTERISTICS
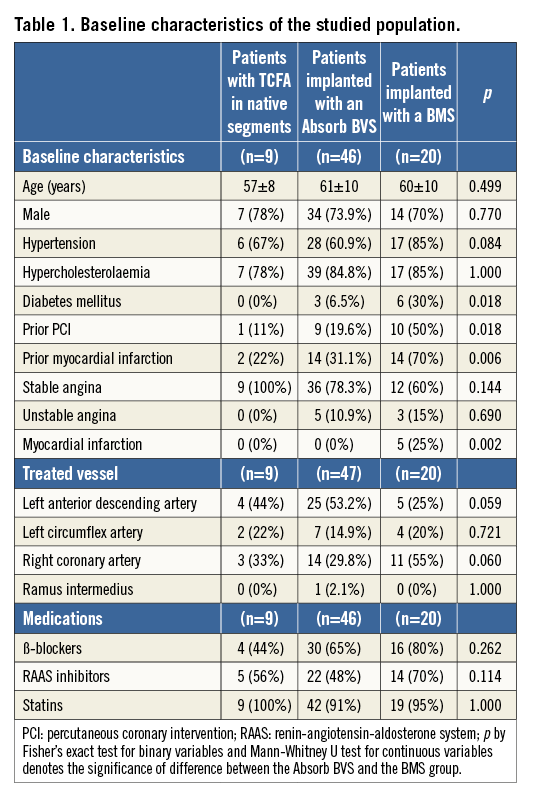
Data from 47 segments (46 patients) implanted with an Absorb BVS and 20 segments (20 patients) treated with a BMS (12 with a single Svelte Coronary IDS stent, seven with a single and one with two vProtect™ devices) were included in the current analysis. At baseline in the patients implanted with an Absorb BVS, 10 TCFAs were detected in nine native coronary segments (six located proximally to the scaffolded segment and three distally): three of these segments had follow-up imaging at short-term (six- to 12-month) follow-up and six at midterm (24- to 36-month) follow-up. There were no differences in age and sex between the Absorb BVS and the BMS group; however, the patients implanted with a BMS were more likely to be diabetics and to have a history of coronary artery disease (Table 1).
QUANTITATIVE CORONARY ANGIOGRAPHY ANALYSIS
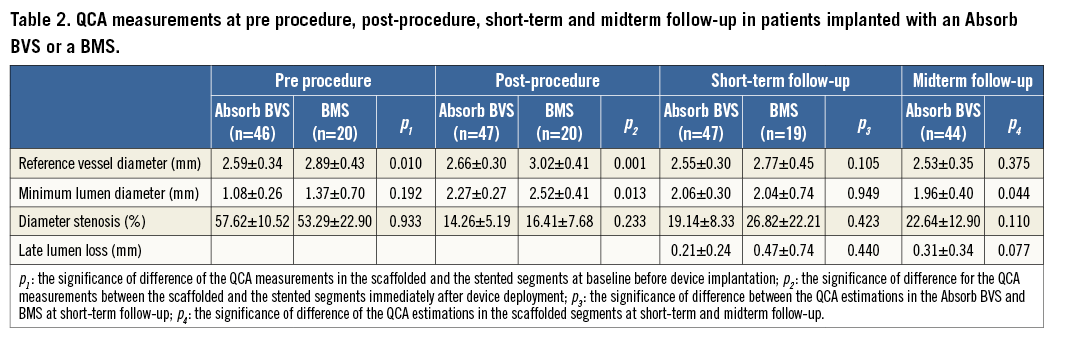
Segments treated with a BMS had a larger RVD compared to those implanted with an Absorb BVS (Table 2). At post-procedure, the MLD was smaller in the segments treated with an Absorb BVS but there were no differences in the DS between the two groups. There were no statistically significant differences in the QCA measurements between the two groups at short-term follow-up, although the LLL was numerically higher and had a broader standard deviation in the BMS arm. At midterm follow-up, there was a small but statistically significant reduction in the MLD in the Absorb BVS group.
OPTICAL COHERENCE TOMOGRAPHIC ANALYSIS
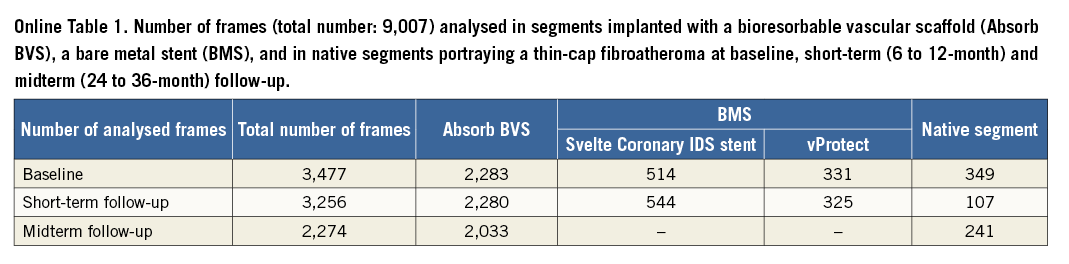
The total number of analysed frames was 9,007, of which 6,586 portrayed scaffolded segments, 1,714 stented segments and 697 native segments (Online Table 1). All the scaffolded segments had OCT imaging at short-term follow-up while at midterm follow-up 42 scaffolded segments underwent OCT examination.
The mean length of the scaffolded segments was 19.38±1.18 mm at baseline, 19.31±1.09 mm at short-term and 19.12±1.09 mm at midterm follow-up, (p=0.390); the length of the segments implanted with a Svelte Coronary IDS stent was 17.49±0.94 mm at baseline and 17.83±1.54 mm at short-term follow-up (p=0.594); the length of the segments treated with a vProtect stent was 16.80±4.16 mm and 16.43±3.25 mm, respectively (p=0.500); while the length of the studied native segments was 15.33±3.44 mm at baseline and 15.73±3.77 mm at follow-up (p=0.352).
The mean lumen area decreased in the scaffolded and stented segments between baseline and short-term follow-up, while the scaffold/stent area remained unchanged. The reduction of the lumen area in the scaffolded segments was considerably smaller than that observed in the stented segments (–1.34±0.99 mm2 vs. –2.11±1.97 mm2, p=0.026), a finding that was attributed to the increased neointima in the BMS group (Table 3). At midterm follow-up the scaffold expanded (7.67±1.28 mm2 vs. 8.28±1.74 mm2, p<0.001) and accommodated the increased neointima (1.38±0.52 mm2 vs. 2.17±0.48 mm2, p<0.001) so that the lumen area remained unchanged. No evidence of neoatherosclerosis was seen in the scaffolded and stented segments. In the native segments there were no differences in the luminal dimensions between baseline and follow-up.
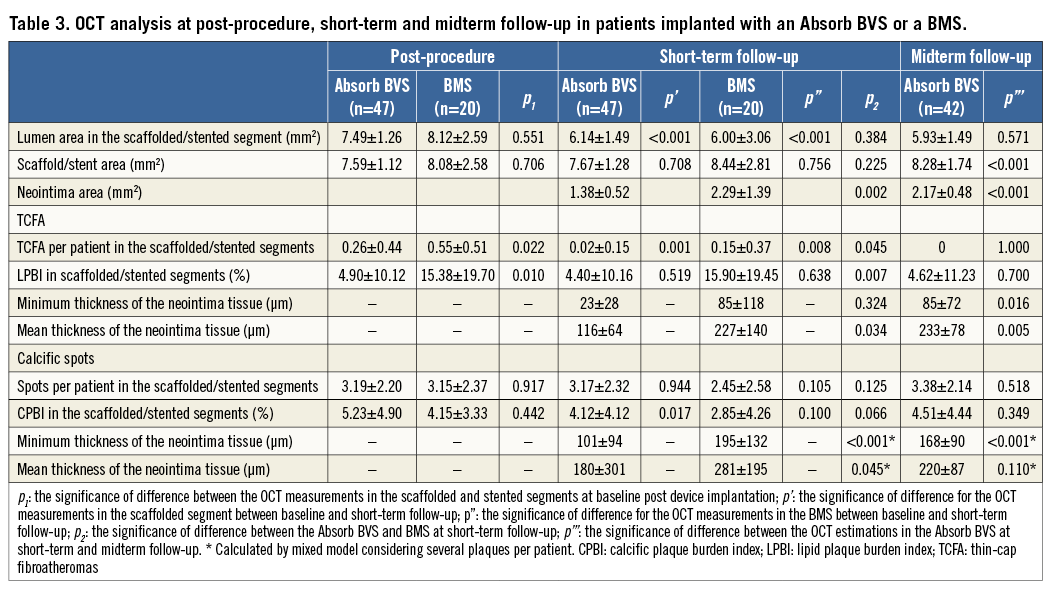
At baseline, 12 TCFA were detected in the scaffolded segments, 11 in the stented segments (three TCFA in patients implanted with a Svelte Coronary IDS stent and eight in patients implanted with a vProtect stent), and 10 TCFA in the nine native segments. There was no difference in the minimum cap thickness in TCFA identified at baseline in the scaffolded, stented and native segments (50±12 μm vs. 53±11 μm vs. 47±11 μm, p=0.595). At short-term follow-up, only one TCFA in the scaffolded and three TCFA in the stented segments were still present (p=0.231). At midterm follow-up, all TCFA detected at baseline in the scaffolded segment were fully covered. In native segments, six TCFA were still present after a follow-up period of 24±12 months. The minimum thickness of the tissue covering the TCFA in native segments increased compared to baseline but in all cases it was <150 μm (79±27 μm vs. 47±11 μm, p=0.013). The neointima thickness that developed over TCFA and calcific spots was higher in the segments implanted with a BMS at short-term follow-up compared to the neointima thickness measured in the Absorb BVS at the same time point. At midterm follow-up neointima continued to develop in the Absorb BVS. When we compared the mean neointima thickness over TCFA and calcific spots in the Absorb BVS at midterm follow-up, and in the BMS at six-month follow-up, there were no significant differences (p=0.948 and p=0.109, respectively). The lipid plaque burden index (LPBI) did not change at follow-up in the scaffolded, stented and native segments (Table 3, Table 4, Figure 1-Figure 3).
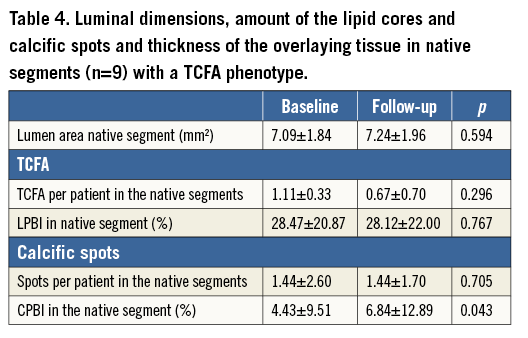
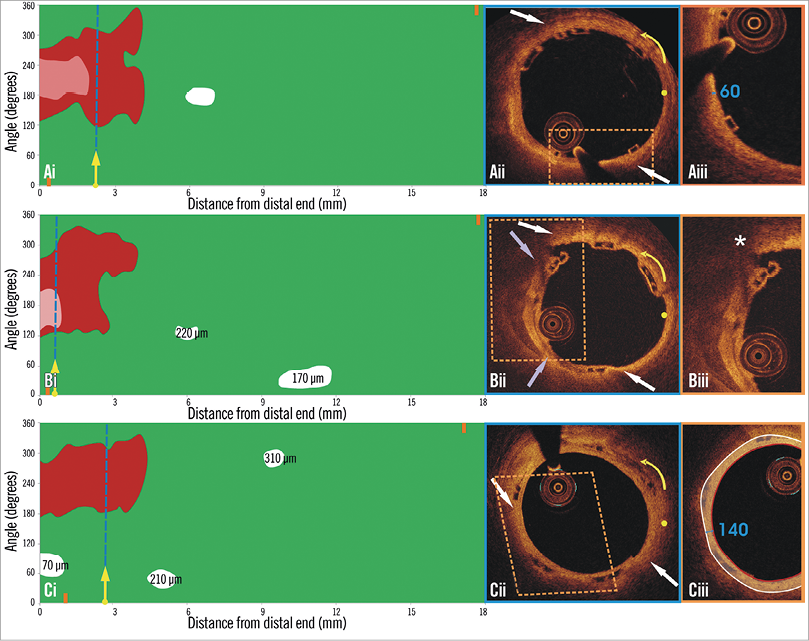
Figure 1. Spread-out plots of a scaffolded coronary segment at baseline and at 12 and 36-month follow-up. The X axis represents the distance from the distal end of the scaffold, while the Y axis represents the circumferential segment (angle) where the different plaque components are located. The axial position of the metallic, non-translucent to light markers seen at the borders of the scaffold is shown with orange markers. The red colour corresponds to TCFA, the white to calcific, and the green to fibrous tissue. A mixed lipid/calcific plaque is detected at baseline (Ai) and at 12-month follow-up (Bi) at the distal end of the scaffold, and the calcific tissue is portrayed in a semi-transparent fashion. The calcific spots are fully covered by neointima at 12-month follow-up but not the TCFA detected at baseline. At three-year follow-up (Ci) the neointima has covered both lipid and calcific tissue. The measured minimum thickness is provided. The blue dashed lines indicate the location of the frames portrayed in panels Aii, Bii and Cii. The yellow spot in panels Aii, Bii and Cii denotes the 0 degree location in the spread-out scaffold plot, while the yellow arrow denotes the anticlockwise direction followed to evaluate the circumferential location of the detected tissues. The white arrows correspond to the lateral extremities of the lipid tissue and the grey to the lateral extremities of the calcific tissue. Panels Bii and Cii illustrate the frame with the minimum thickness of the neointima developed over the TCFA. The segments defined by the parallelograms with the dashed orange contour are portrayed in panels Aiii, Biii and Ciii. The minimum thickness of the cap in panel Aiii was measured as 60 μm using Sheehy’s method. As is shown in panel Biii, there is vessel wall disruption and strut protrusion at 12 months and thus the TCFA detected at baseline is uncovered. At 36 months, the minimum neointimal thickness over the TCFA detected at baseline was estimated at 140 μm (panel Ciii).
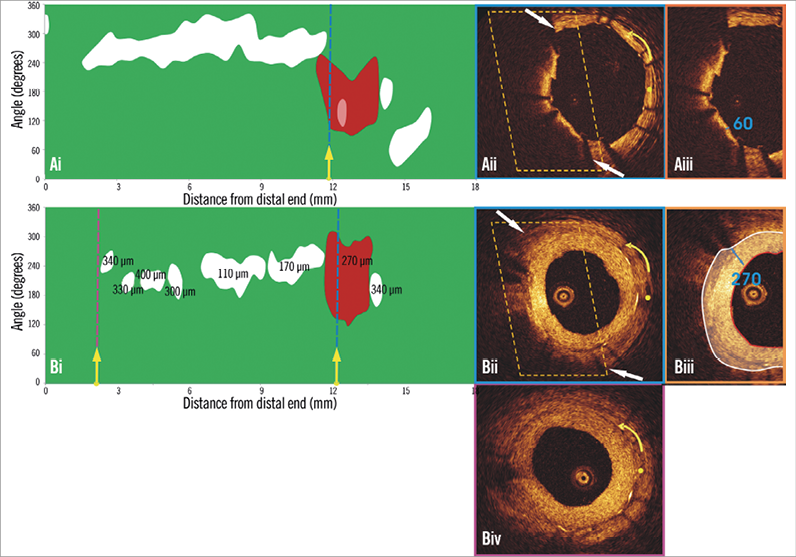
Figure 2. Spread-out plot of a stented segment at baseline and at six-month follow-up. The blue dashed lines indicate the location of the frames portrayed in panels Aii and Bii, while the purple dashed line indicates the frame portrayed in panel Biv. The yellow spot in panels Aii, Bii and Biv denotes the 0 degree location in the spread-out scaffold plot, while the yellow arrow denotes the anticlockwise direction followed to evaluate the circumferential location of the detected tissues. A TCFA is detected at baseline (Aii). Panel Bii illustrates the frame with the minimum thickness of the neointima developed over the TCFA. The segments defined by the parallelograms with the dashed orange contour are portrayed in panels Aiii and Biii. The minimum thickness of the cap in panel Aiii was measured at 60 μm. As is shown in panel Biii, the minimum thickness of the neointima that has covered the TCFA was estimated at 270 μm (panel Ciii). The excessive neointima resulted in a significant reduction of the lumen area and did not allow visualisation of the calcific tissue in some OCT frames at follow-up. The minimum lumen area at follow-up was measured 1.86 mm2 (Biv) while the CPBI was reduced from 12.00% to 5.35%.
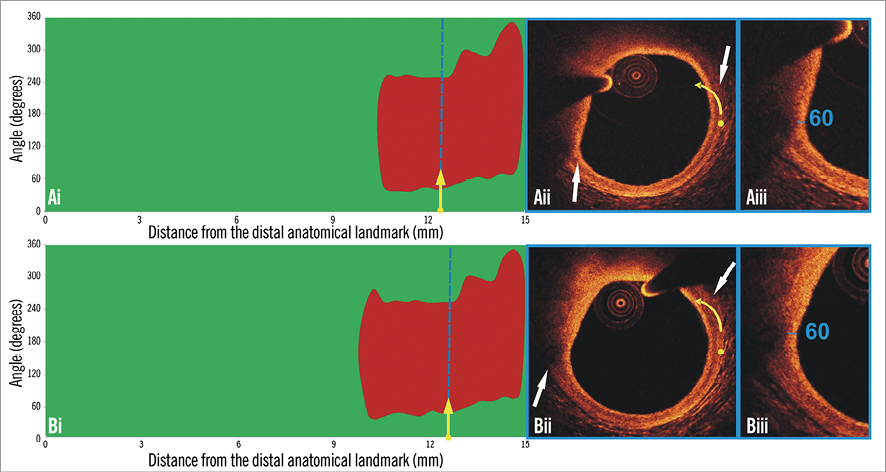
Figure 3. Spread-out plots of a native coronary segment at baseline and at 12-month follow-up. The X axis represents the distance from the distal end of the segment of interest, while the Y axis represents the circumferential segment (angle) where the different plaque components are located. At baseline (Ai) and follow-up examination (Bi) a TCFA is detected at the distal end of the segment of interest. The blue dashed lines indicate the location of the minimum thickness of the fibrous cap, and the corresponding frames are portrayed in panels Aii and Bii. The yellow spot in panels Aii and Bii denotes the 0 degree location in the spread-out scaffold plot, while the yellow arrow denotes the anticlockwise direction followed to evaluate the circumferential location of the detected tissues. The white arrows denote the lateral extremities of the lipid tissue. The minimum thickness of the cap in panel Aii was 60 μm (Aiii) and was unchanged at follow-up (Biii).
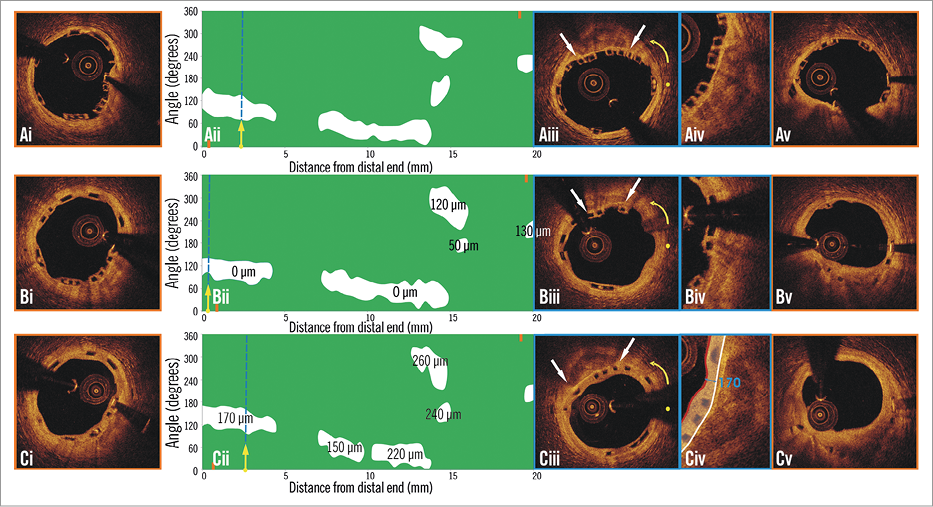
Figure 4. Spread-out plot of a scaffolded segment at baseline and at 12 and 36-month follow-up. The orange markers, shown on the spread-out plots at baseline (Aii) and follow-up (Bii, Cii), correspond to the axial position of the metallic non-translucent to light markers. The proximal markers are shown in panels Ai, Bi, Ci, and the distal markers in panels Av, Bv, and Cv. The blue dashed lines indicate the location of the frames portrayed in panels Aiii, Biii and Ciii. The yellow spot in panels Aiii, Biii, and Ciii denotes the 0 degree location in the spread-out scaffold plots, while the yellow arrow denotes the anticlockwise direction followed to evaluate the circumferential location of the detected tissues. The white arrows correspond to the lateral extremities of the detected calcific tissue. As is shown in panels Aiii, Aiv, Biii, Biv, Ciii and Civ, the neointima (minimum thickness: 110 μm at six-month and 210 μm at 24-month follow-up) developed after scaffold implantation sealed the calcific tissue at follow-up.
One hundred and fifty calcific spots were detected post-procedure in the Absorb BVS, 63 in the BMS group and 10 in the native segments. Although there were no differences in the calcific spots detected at baseline and follow-up, there was a significant reduction in the calcific plaque burden index (CPBI) in both devices at short-term follow-up (Figure 4), while in native segments the CPBI was significantly increased at follow-up (Table 3, Table 4).
The full mixed model, including the underlying tissue, follow-up time and stent type, for the mean neointima thickness showed a significant effect for follow-up time (lower at short-term, p=0.040) and stent type (lower in Absorb BVS, p=0.006) but not for the plaque type. A more restricted mixed model conducted using only the short-term data showed only a significant effect of the stent type for the mean thickness (p=0.023). When the mixed model was conducted using the short-term data from the BMS group and the midterm data from the Absorb BVS group, neither the stent type nor the tissue type had an effect on the mean thickness (p=0.090 and p=0.080, respectively).
LESION-RELATED CARDIOVASCULAR EVENTS
Within the studied follow-up period, three lesion-related events were reported in the Absorb BVS group (two non-Q-wave myocardial infarctions occurred at short-term follow-up, of which one was periprocedural, and one target lesion revascularisation occurred at midterm follow-up). In the BMS arm, two target lesion revascularisations were reported at short-term follow-up.
Discussion
In this analysis we introduced a novel approach, the spread-out vessel plots, to visualise and assess changes in the composition of the superficial plaque in native segments and in segments implanted with Absorb BVS or BMS. We found that: 1) in contrast to native coronary segments where the morphology of most of the plaques remained unchanged, the neointima that developed in treated segments altered the phenotype of the plaque by covering the calcific spots and TCFA with neointima, thus transforming the TCFA to thick-cap fibroatheromas; 2) the increased neointima reported in BMS caused a significantly higher reduction in the luminal dimensions; 3) in Absorb BVS neointima continued to develop after the short-term follow-up and sealed the underlying plaques without compromising the luminal dimensions, since the scaffold was shown to expand: and 4) the type of the underlying tissue did not appear to affect neointimal formation with either the BMS or the Absorb BVS.
SPREAD-OUT VESSEL PLOTS FOR THE QUANTIFICATION OF THE COMPOSITION OF THE PLAQUE
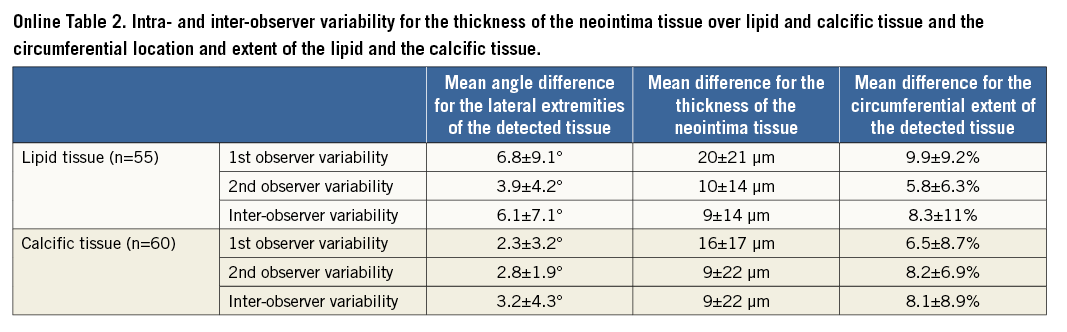
IVUS and IVUS-VH cannot be used to detect changes in the composition of the superficial plaque following an Absorb BVS implantation, since the polymeric struts appear as bright hyperechogenic shadows with acoustic fingerprints, similar to calcific tissue, leading to false estimations11,12. Since OCT has a substantially higher resolution compared to IVUS, it can overcome these limitations and permit a more accurate characterisation of the superficial plaque, and assessment of neointima thickness over different tissues. The low intra- and inter-observer variability for the characterisation of different tissues, the circumferential location and the extent of the detected lipid and calcific tissue indicates that the use of spread-out vessel plots allows not only for a comprehensive and reproducible visualisation of the superficial plaque, but also for an accurate quantification of each plaque component (Online Table 2)13,14.
STENT TYPE AND NEOINTIMAL PROLIFERATION
We found that, in both the Absorb BVS and BMS groups, at short-term follow-up the developed neointima covered most of the TCFA and calcific spots. The neointima was increased in the BMS arm (although this group included non-flow-limiting plaques that were treated with a self-expanding stent, something which is anticipated to cause less vessel wall trauma) compared to the Absorb BVS group, and it reduced considerably the luminal dimensions at follow-up. The difference in the neointima burden is likely to be attributed to the antiproliferative properties of everolimus in the Absorb BVS, which controlled the vessel wall healing process. Moreover, in contrast to BMS where it has been shown that the neointima formation is completed within the first six months post device implantation, in Absorb BVS the neointima continues to develop beyond 12 months15.
In contrast to the metallic stents in Absorb BVS, the delayed neointima proliferation did not compromise luminal dimensions, as the loss of the scaffold’s structural integrity allowed the device to expand and accommodate the developed tissue that re-capped the underlying high-risk plaques5,15,16. This unique ability of the Absorb BVS, in combination with the fact that it disappears at long-term follow-up and thus allows for the restoration of vessel wall physiologic function, renders the Absorb BVS a potentially useful tool for the invasive treatment of high-risk, i.e., prone to rupture, plaques2. Of note, there is no evidence to support the use of any endovascular device for this purpose, and it is too premature to advocate an invasive sealing of vulnerable plaques based on the findings of this analysis. Although intravascular imaging studies have allowed us to identify plaque characteristics associated with increased vulnerability, and provided unique insights into atherosclerotic evolution, robust evidence from randomised control trials and further research are required in order to identify more accurately future culprit lesions and the timing of the event before advocating the use of BVS to re-cap vulnerable plaques17.
COMPOSITION OF THE PLAQUE AND NEOINTIMAL PROLIFERATION
Plaque composition is likely to influence vessel wall response after scaffold or stent implantation, as neointima formation is based on pathophysiological mechanisms (e.g., local inflammation, migration and proliferation of smooth muscle cells, etc.) which involve the underlying vessel wall18-21. In a recent report, Kubo et al found no association between the amount of the lipid core component at baseline and the neointimal formation in BMS and drug-eluting stents at follow-up, while Shimada et al showed that calcific-rich plaques were associated with less neointimal proliferation in BMS but did not affect the healing process in drug-eluting stents22,23.
We found a similar distribution of the neointimal tissue over TCFA and calcific spots in both the Absorb BVS and the BMS groups. The discrepancy between our findings and the results reported by Shimada et al in BMS may be attributed to the different imaging modality used to measure neointimal thickness (Shimada et al used greyscale IVUS and not OCT), as well as to the fact that the BMS group included two different types of stent with a different mechanical behaviour (a balloon-expandable and a self-expandable stent which was implanted in non-obstructive lesions). The smaller minimum neointimal thickness reported over TCFA compared to the one measured in the calcific spots in both the Absorb BVS and the BMS groups may be attributed to the larger surface of the TCFA (in the Absorb BVS group each TCFA occupied 17.22±13.82% while each calcific spot occupied 1.33±0.95% of the spread-out at short-term follow-up, whereas in the BMS group each TCFA occupied 28.91±17.47% and each calcific spot occupied 1.25±1.07%, p<0.001).
In contrast to the native segments where the calcific plaque burden index (CPBI) appears to increase at follow-up, in the scaffolded/stented segments the CPBI decreased. The reduction of the CPBI in the treated segments (which is not in agreement with computed tomographic calcium screening studies that showed an increase in calcium burden over time) should be attributed to the developed neointima which masked deeply embedded calcific spots that were visible in the baseline OCT examination, resulting in the false impression that the calcific tissue is reduced at follow-up. On the other hand, there were no differences in the LPBI as this referred to lipid tissue which was located in the superficial plaque.
Limitations
A significant limitation of the current analysis is the fact that the characterisation of the superficial plaque was performed in the scaffolded and stented segments post device implantation. To minimise erroneous estimations, we identified vessel wall discontinuities and we did not measure the thickness of the cap in these segments. It is plausible that micro-disruptions which could not be identified by the naked eye may have led to erroneous assessments of plaque morphology.
Another limitation of this study is that the quantification of the composition of the superficial plaque depended on the expertise of the two observers. OCT may often fail to discriminate lipid from macrophages or calcific tissue, especially when the lipid/calcific tissue is deeply embedded in the vessel wall24. However, since the reproducibility and the agreement of the observers were high, we believe that these erroneous estimations did not affect our findings.
Moreover, although it is evident that the neointima develops in BMS within the first six months post device implantation and thus we did not expect to have different findings in the BMS arm at midterm follow-up, there was a lack of midterm follow-up data in the BMS group which would have allowed a direct comparison of the neointima and luminal dimensions between the Absorb BVS and the BMS at this time point25. The lack of a drug-eluting stent group can be considered as another limitation of this analysis. Neointima formation appears to be reduced in drug-eluting stents at short-term follow-up, and thus the changes in the luminal dimensions and the phenotype of the underlying plaque are anticipated to be small at this time point26. However, at midterm follow-up the tissue response in drug-eluting stents is similar to the BMS, as the neointima tissue continues to develop and compromises the luminal dimensions27.
Finally, the difference in the demographics and clinical presentation of the patients implanted with an Absorb BVS and those treated with a BMS is another limitation of this study.
Conclusions
The implementation of spread-out vessel plots allowed us to evaluate changes in the composition of the superficial plaque in segments implanted with an Absorb BVS or a BMS and to compare these changes with the alterations noted in native segments that were used as a control group. We found that, in contrast to the native segments, in the scaffolded and stented segments a thick layer of tissue developed over both lipid and calcific tissues that modifies the morphology of the plaque to more stable phenotypes. The neointima tissue in BMS considerably compromised the luminal dimensions, whereas in the Absorb BVS the neointima developed slowly and was accommodated by the expanded device. This unique ability of the Absorb BVS renders it more appropriate than a BMS for the re-capping of high-risk plaques.
| Impact on daily practice A novel methodology is presented for the processing of serial optical coherence tomographic data and the assessment of the changes in the morphology of the superficial plaque following bioresorbable scaffold or bare metal stent implantation. In both devices, the developed neointima re-caps the underlying plaque, covers tissues with high-risk characteristics, and modifies the plaque morphology to more stable phenotypes. In contrast to bare metal stents, in bioresorbable scaffolds the developed neointima does not compromise the luminal dimensions as it is accommodated by the expanded device. Therefore bioresorbable scaffolds may have a value in the future for the invasive sealing of high-risk, prone to rupture plaques. |
Guest Editor
This paper was guest edited by Giulio Guagliumi, MD; Department of Interventional Cardiology, Ospedale Papa Giovanni XXIII, Bergamo, Italy.
Acknowledgements
The first author would like to acknowledge the funding support of the Hellenic Heart Foundation (ELIKAR), Athens, Greece.
Conflict of interest statement
A. Sheehy, S. Veldhof and R. Rapoza are employees of Abbott Vascular. The other authors have no conflicts of interest to declare. The Guest Editor is a consultant for Boston Scientific and St. Jude Medical and has received institutional research grants from Abbott Vascular, Boston Scientific, St. Jude Medical.
Online appendix
VESSEL WALL DISCONTINUITIES
Discontinuities of the vessel wall in the scaffolded and stented segments were defined as disruption of the vessel wall and were classified into four categories: flaps, cavities, double lumen and fissures, according to the classification proposed by Radu et al (Online Figure 1)28.
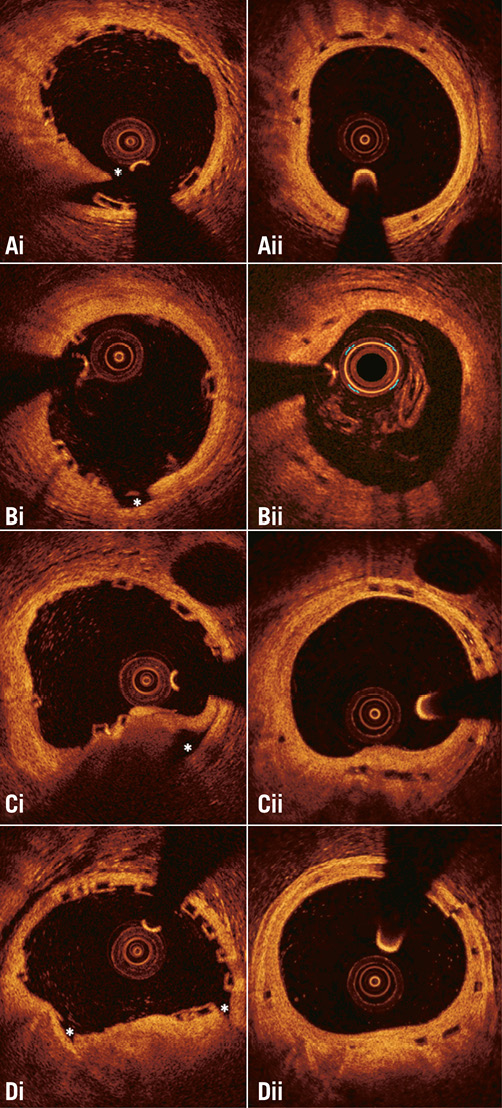
Online Figure 1. Different types of vessel wall discontinuities seen after Absorb bioresorbable scaffold implantation. (Ai) flap, (Bi) cavity, (Ci) false lumen, and (Di) fissure. The location of the discontinuity is indicated with an asterisk. As is shown in the corresponding frames (panels Aii, Bii, Cii, and Dii) acquired at midterm follow-up, the developed neointima has covered the vessel wall disruptions detected at baseline.
The two observers identified vessel wall discontinuities in 677 (30%) out of the 2,282 frames that portrayed scaffolded segments at baseline. Flaps were detected in 368 (16%) frames, cavities in 126 (6%), double lumen in 35 (2%), and fissures in 221 (10%) frames.
In the segments treated with a BMS, vessel wall discontinuities were detected in 236 (27%) out of the 864 frames. Flaps were detected in 135 (16%) frames, cavities in 37 (4%), double lumen in 12 (1%), and fissures in 87 (10%) frames. As would be expected, the incidence of vessel wall discontinuities was lower in the non-obstructive lesions that were implanted with the self-expanding device than in the stenotic lesions treated with a balloon-expandable metallic stent (13% vs. 36%, p<0.001). There were no differences in the incidence of vessel wall discontinuities in segments treated with a BMS compared with those implanted with an Absorb BVS (p=0.272).
CHARACTERISATION OF THE COMPOSITION OF THE SUPERFICIAL PLAQUE
In the analysed cross-sections, the operators identified the superficial lipid (shown as a signal-poor region with poorly delineated borders, a fast signal drop-off and little or no signal backscattering) and calcific tissue (appearing as a signal-poor heterogeneous region with sharp borders) and marked their location29,30. In particular, two markers were placed at the two lateral extremities of the lipid/calcific tissue. Then, their circumferential position was determined with respect to the gravitational centre of the lumen area, and expressed as an angle taking the position at 3 o’clock as the 0° reference (Online Figure 2). Any disagreement between observers was resolved by consensus.
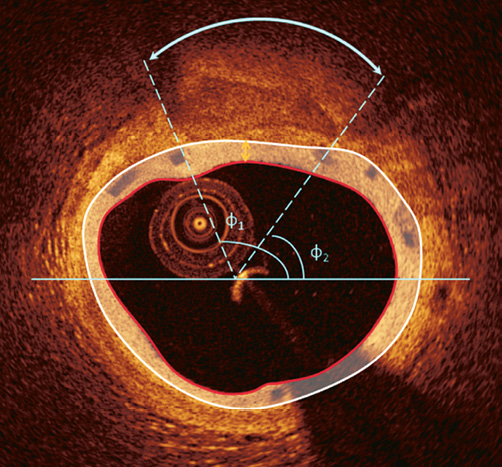
Online Figure 2. Determination of the circumferential distribution of a calcific tissue. After the detection of the luminal border, the two observers identified the lateral extremities of the calcific tissue. Following the anticlockwise direction the circumferential location of the closest and most remote extremities of the calcific tissue is expressed as the angle defined by each extremity, the gravitational centre of the lumen and a reference horizontal axis at 3 o’clock. The angle difference between the two extremities defines the circumferential extent of the calcific tissue. The yellow arrow indicates the minimum thickness of the neointimal tissue developed over the calcific tissue which was estimated as 200 μm.
In the segments where there was no disruption, the observers measured the thickness of the fibrous cap over lipid tissue. All the frames portraying lipid tissue that was covered by a thin cap (thickness ≤70 μm – as this was measured with the use of the St. Jude Medical Inc. software which allows calculation of the cap thickness with a resolution of 10 μm) were further processed using the methodology of Sheehy et al to identify more accurately thin-capped fibroatheromas (TCFA)31. This approach has been implemented for the in vivo evaluation of the thickness of the struts in the Absorb BVS. In brief, the location of the minimum thickness of the fibrous cap was identified by the two observers and then a line was drawn vertical to the lumen border (Online Figure 3). The intensities of the backscatter OCT signal, along that line, were plotted, and two Gaussian curves were drawn to approximate the plotted intensities at the two sides of the cap (luminal and lipid). The Gaussian fit was determined separately for each side through symmetry of a one-tailed Gaussian fit, with the first peak defining the peak of the Gaussian function. The boundary of the edge of the cap was identified as the half-max of the curve. The width of the cap was determined as the distance from the half-max of one curve to the half-max of the other curve. This approach was restricted to thin fibrous caps, as only in these cases were the optics of the area of interest represented by a Gaussian fit. Deeply embedded lipid tissues exhibited more heterogeneity of signal at the interface and a less clear optical pathway, while the calcium had a heterogeneous appearance and thus the distal interface of the overlaying tissue to the calcific tissue could not be approximated by a Gaussian curve (Online Figure 3). At follow-up examinations the observers estimated the minimum thickness of the neointimal tissue over calcific and lipid tissues that corresponded to the detected TCFA at baseline.
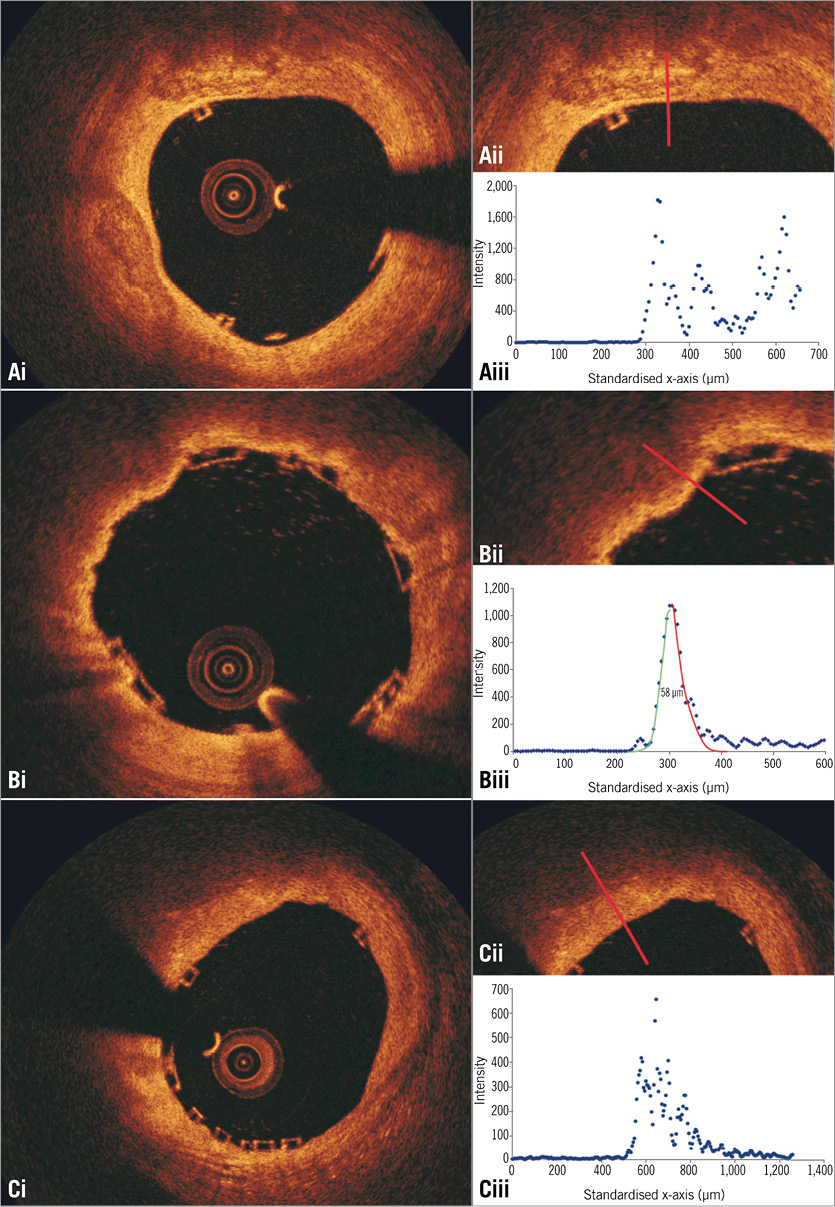
Online Figure 3. Plot of the intensities of the backscatter OCT signals in calcific tissue (Ai, Aii), in lipid tissue covered by a thin fibrous cap (Bi, Bii), and in lipid tissue covered by a thick cap (Ci, Cii). The calcific tissue has a heterogeneous appearance; therefore, there is an increased scatter at the distal interface of the overlaying tissue to the calcific tissue which cannot be approximated by a Gaussian curve (Aiii). On the other hand, the lipid tissue appears as a signal-poor region resulting in a fast signal drop-off after the signal-rich fibrous cap. Thus, in case of a thin fibrous cap, two Gaussian curves can be fitted over the plotted intensities of the OCT backscatter signal (Biii), the first at the luminal and the second at the lipid border of the cap. The distance between the half-max of the two curves defines the thickness of the fibrous cap, and in the portrayed case this is 58 μm. As is shown in panel Ciii, in thick caps there is signal heterogeneity at the border of the cap with the lipid tissue and a less clear optical pathway which does not allow computation of cap thickness.
In addition, the two observers reviewed the baseline OCT examinations of the patients implanted with an Absorb BVS and identified the TCFA that were located in native segments proximal and distal to the implanted device. Anatomical landmarks located distally and proximally to the TCFA (i.e., the origin of side branches or the proximal or distal end of the scaffold) were used to define the segment of interest and identify correspondence between baseline and follow-up examinations. The lumen borders were detected in these segments and the circumferential extent of the calcific and lipid tissue was marked as before.
SPREAD-OUT VESSEL PLOTS
The spatial distribution of the TFCA and calcific tissues along the scaffolded/stented and native segments of interest was depicted in spread-out vessel plots32-34. These graphs were created by plotting the lateral extremities of the tissue with respect to the angle, which defines their circumferential location, and the longitudinal distance of the analysed frame from the distal end of the studied segment. Extremities with similar circumferential location detected in consecutive frames that delineate the same plaque component (e.g., lipid or calcific tissue) were assumed to define the same plaque type and connected with a Bézier curve. A colour-coded map was used to differentiate plaque components with the red corresponding to TCFA, the white to calcific spots, and the green colour to fibrous tissue. In case of a mixed TCFA-calcific plaque, there was superimposition of the red and white colours. Therefore, to demonstrate mixed plaques, we portrayed the calcific tissue in a semi-transparent fashion (Figure 1). The dimensions of the spread-out plots depended on the length of the scaffolded or native segments (scale in the X axis: 1 mm=200 pixels and in the Y axis: 30°=100 pixels).
We estimated the minimum thickness of the neointimal tissue over TCFA or calcific spots, defined as the minimum thickness of the neointimal tissue amongst all the frames portraying the specific tissue, while the mean thickness over TCFA or calcific spots was defined as the mean value of the minimum thickness measured in all frames portraying the specific tissue. TCFA were defined as necrotic cores with a minimum cap thickness of <65 μm35,36. In order to have comparable mean and minimum thickness estimations in the Absorb BVS and BMS groups, the stent borders in the BMS group were extruded towards the outer vessel wall at a distance equal to the thickness of the stent struts (81 μm in the Svelte Coronary IDS stent and 56 μm in the vProtect system) and then the thickness of the neointima developed over the different tissues was estimated as the minimum distance between the extruded stent border and the luminal border (Online Figure 4).
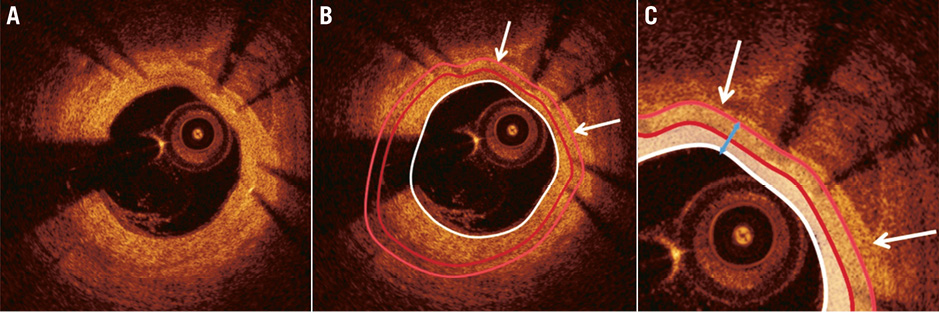
Online Figure 4. Implementation of methodology to measure the thickness of the neointima developed over the calcific tissue identified in a segment treated with a bare metal stent (A). After the delineation of the luminal (white curve) and the stent (dark red curve) border (B), the neointima is computed (indicated with a white semi-transparent colour in panel C). To calculate the thickness of the neointimal tissue developed over the calcific tissue we extrude the stent border towards the external elastic lamina border at a distance that is equal to the thickness of the stent struts (light red curve). Then we measure the minimum distance (blue arrow) between the lumen and the expanded stent border in the arc defined by the lateral extremities (white arrows) of the detected calcific plaque. This distance (which in this frame was 150 μm) indicates the minimum neointima thickness for the identified calcific tissue at this frame.
The TCFA burden in each segment was assessed using the lipid plaque burden index (LPBI), defined as the percentage of the number of pixels that corresponded to TFCA/covered TCFA vs. the number of pixels of each spread-out vessel plot. Similarly, the calcific plaque burden index (CPBI) was defined as the percentage of the number of pixels portraying calcific spots vs. the number of pixels of each spread-out vessel plot. Pixels corresponding to mixed plaques were taken into consideration during the computation of both the LPBI and the CPBI.
ASSESSMENT OF OBSERVER VARIABILITY
The reproducibility of the two observers in identifying and classifying the presence of vessel wall discontinuities in the scaffolded segment was examined in 153 frames (three OCT examinations) acquired at baseline. The two observers identified and classified separately vessel wall discontinuities twice within a one-month period. The κ test of concordance was used to assess observer agreement37.
The inter- and intra-observer variability of the two observers in characterising the type of plaque was evaluated in 147 frames portraying scaffolded segments (47 frames post scaffold implantation, 100 at follow-up). In these frames, each observer identified the presence of lipid and calcific tissue twice and measured in the follow-up frames the minimum thickness of the neointima overlaying the TCFA detected at baseline or the calcific spots. The κ test of concordance was used to assess observer agreement. To examine the inter- and intra-observer variability in the estimations of the circumferential distribution of the detected lipid/calcific tissue, we calculated the mean and the standard deviation of the differences between the angles that defined the lateral extremities of the tissue (Online Figure 5). In addition, we computed the mean and the standard deviation of the differences between the two estimations of each observer, and the first estimations of the two observers for the minimum thickness of the neointima tissue that covered the detected lipid and calcific tissue. Finally, we calculated the percentage error difference between the two estimations of each observer and the first estimations of the two observers for the circumferential extent (expressed in degrees) of the lipid/calcific tissue.
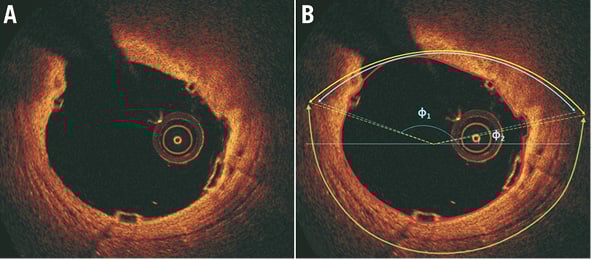
Online Figure 5. Assessment of observer agreement for the lipid tissue. The estimations of the first observer are denoted with blue and of the second with yellow colour. The green arc indicates the extent of the detected external elastic membrane. It is obvious that there is a good agreement between the two observers.
Results
INTER- AND INTRA-OBSERVER VARIABILITY
A good overall agreement was noted in the detection of the presence of vessel wall discontinuity (κ=0.81), whereas the reproducibility of the two observers in identifying the type of discontinuity was moderate (κ=0.71). The intra-observer variability for the lipid and calcific tissue was κ=0.84 and κ=0.80 for the first observer and κ=0.82 and κ=0.92 for the second observer, respectively, while the inter-observer variability was κ=0.75 and κ=0.71, respectively. The results with regard to the other metrics used to evaluate observer variability are shown in Online Table 2.