Published online Mar 28, 2016. doi: 10.4329/wjr.v8.i3.308
Peer-review started: October 2, 2015
First decision: November 4, 2015
Revised: November 26, 2015
Accepted: January 8, 2016
Article in press: January 11, 2016
Published online: March 28, 2016
AIM: To investigate the angiographic and volumetric effects of mammalian target of rapamycin (mTOR) inhibitors on angiomyolipomas (AMLs) in a case series of patients with tuberous sclerosis complex.
METHODS: All patients who underwent catheter angiography prior to and following mTOR inhibitor therapy (n = 3) were evaluated. All cross-sectional imaging studies were analyzed with three-dimensional volumetrics, and tumor volume curves for all three tissue compartments (soft tissue, vascular, and fat) were generated. Segmentation analysis tools were used to automatically create a region of interest (ROI) circumscribing the AML. On magnetic resonance images, the “fat only” map calculated from the in- and opposed-phase gradient recalled echo sequences was used to quantify fat volume within tumors. Tumor vascularity was measured by applying a thresholding tool within the ROI on post-contrast subtraction images. On computed tomography images, volume histogram analysis of Hounsfield unit was performed to quantify tumor tissue composition. The angiography procedures were also reviewed, and tumor vascularity based on pre-embolization angiography was characterized in a semi-quantitative manner.
RESULTS: Patient 1 presented at the age of 15 with a 6.8 cm right lower pole AML and a 4.0 cm right upper pole AML. Embolization was performed of both tumors, and after a few years of size control, the tumors began to grow, and the patient was initiated on mTOR inhibitor therapy. There was an immediate reduction in the size of both lesions. The patient then underwent repeat embolization and discontinuation of mTOR inhibition, after which point there was a substantial regrowth in both tumors across all tissue compartments. Patient 2 presented at the age of 18 with a right renal AML. Following a brief period of tumor reduction after embolization, she was initiated on mTOR inhibitor therapy, with successful reduction in tumor size across all tissue compartments. As with patient 1, however, there was immediate rebound growth following discontinuation of inhibitor therapy, without sustained control despite repeat embolization. patient 3 presented at the age of 5 with a left renal AML and underwent two embolization procedures without lasting effect prior to starting mTOR inhibition. As with patients 1 and 2, following discontinuation of therapy, there was immediate rebound growth of the tumor. Repeat embolization, however, was notable for a substantial reduction in intratumoral aneurysms and vascularity.
CONCLUSION: AML volume reduction as well as post-treatment rebound growth due to mTOR inhibitors involves all three tissue components of the tumor.
Core tip: Pharmacologic management of tuberous sclerosis complex-associated angiomyolipomas with mammalian target of rapamycin inhibitors can provide substantial tumor volume reduction for the duration of the therapeutic course. This volume reduction impacts all three tissue compartments of the tumor. Unfortunately rebound growth involving all tissue compartments follows shortly after discontinuation of mammalian target of rapamycin (mTOR) inhibitor therapy. The addition of transarterial embolization to mTOR inhibition did not curtail the occurrence of rebound growth.
- Citation: Sheth RA, Feldman AS, Paul E, Thiele EA, Walker TG. Angiographic and volumetric effects of mammalian target of rapamycin inhibitors on angiomyolipomas in tuberous sclerosis. World J Radiol 2016; 8(3): 308-315
- URL: https://www.wjgnet.com/1949-8470/full/v8/i3/308.htm
- DOI: https://dx.doi.org/10.4329/wjr.v8.i3.308
Tuberous sclerosis complex (TSC) is an autosomal dominant genetic disorder affecting approximately 2 million people globally. Mutations in the TSC1 and TSC2 genes, important regulators of the mammalian target of rapamycin (mTOR) signaling pathway, result in the development of tumors involving multiple organ systems. As many as 80% of patients with TSC develop renal angiomyolipomas (AMLs), which are soft tissue hamartomatous tumors containing multiple soft tissue components including fat, smooth muscle, and blood vessels. Although they are not malignant, AMLs can lead to a variety of complications, the most significant of which is spontaneous hemorrhage. While the risk of bleeding is actually relatively low, the morbidity and mortality rates for such events are high; as a result, AMLs represent the most common cause of death in adults with TSC[1].
Lesion size is the traditional biomarker for prognosticating the risk of spontaneous AML hemorrhage, with tumors greater than 4 cm considered to be at risk[2]. AMLs in patients with TSC tend to continuously increase in size[3,4]. As a result, methods to abrogate or at least control tumor growth are crucial for this patient population. Treatment options range from invasive, such as nephrectomy or partial nephrectomy, to minimally invasive, such as transcatheter arterial embolization. The latter technique is a nephron-sparing procedure that has been used to treat AMLs for both emergent and prophylactic indications[4-6].
Recently, new medical therapies for TSC-associated AMLs have been developed. Sirolimus and everolimus, a sirolimus derivative, are immunosuppressants that operate by inhibiting the mTOR signaling pathway, thus interrupting the molecular pathway that is dysregulated in TSC patients. In a Phase I/II study, sirolimus reduced AML volume to 53% of baseline over a 12 mo period[7]. Likewise, 42% of patients achieved at least 50% AML volume reduction with everolimus[8]. The effect, however, is not sustained, as following cessation of drug administration, only 5% of patients maintain the volume reduction[9].
mTOR inhibitors represent an intriguing new option for the management of TSC-associated AMLs, but questions remain regarding their appropriate use. Specifically, because of the rebound growth following discontinuation, should patients be prescribed a lifelong regimen, despite the lack of data regarding long term risks? Moreover, while mTOR inhibitors are known to reduce tumor volume, it is unknown how these medications impact tumoral composition, including tumor vascularity, and by extension, the risk for tumoral bleeding. Furthermore, possible synergies between mTOR inhibitors and minimally invasive interventions such as transarterial embolization have not been explored. In this case series, we present the angiographic and volumetric effects of mTOR inhibitors on AMLs in patients who underwent transcatheter arterial embolization prior to and following a course of mTOR inhibitor therapy. We characterize the impact of mTOR inhibition on tumoral tissue compartments through volumetric cross sectional imaging analysis and on tumor vascularity by angiography. We additionally report on the outcomes of mTOR inhibition and arterial embolization combination therapy.
Institutional review board (IRB) approval was obtained for this single institution, retrospective study. Thirty-nine TSC patients who underwent transcatheter arterial embolization procedures for renal AMLs between 2000 and 2014 were identified. Of these patients, 11 received mTOR inhibitors for management of their AMLs, and 3 patients underwent angiography and transcatheter embolization of their AMLs prior to and following a course of mTOR inhibitor therapy. These three patients comprise the study group for this case series.
All patients underwent routine cross-sectional imaging of their kidneys on at least an annual basis. All patients underwent MR imaging, and one patient additionally underwent CT imaging. MR imaging was performed on a Signa 1.5-T system (GE Healthcare, Waukesha, WI) or a Magnetom 3.0-T system (Siemens, Malvern, PA). All MR examinations were monitored by a pediatric radiologist, and imaging protocols were individually tailored. Commonly, protocols included a tri-phase localizer, coronal T2-weighted HASTE, axial T1-weighted in- and opposed-phase gradient recalled echo (GRE), pre-contrast coronal or axial T1-weighted 3D GRE, and contrast-enhanced coronal or axial T1-weighted 3D GRE obtained at 30, 70, and 180 s after contrast administration. In- and opposed-phase imaging data were used to calculate “fat only” image maps of the kidneys via the Dixon method[10]. The T1 pre-contrast mask images were subtracted from the post-contrast images to generate contrast maps; the arterial phase subtraction map (difference between post-contrast images obtained at 30 s following contrast administration and the pre-contrast mask) was used as the vascularity map for the AMLs. Intravenous gadopentetate dimeglumine was used as the contrast agent.
CT scanning was performed by a 64-detector row CT scanner (GE Discovery CT 750 HD; GE Healthcare, Waukesha, WI). Pre-contrast imaging of the abdomen was obtained, followed by contrast injection at 2-3 cc/s with a total volume of 2 cc/kg. Post-contrast imaging at 30 s (arterial phase) and at 100 s (nephrographic phase) were obtained.
Transcatheter arterial embolization was performed prophylactically in all 3 patients by attending interventional radiologists. Selective renal angiography was performed using a 4 or 5 Fr selective catheter (Cook, Bloomington, IN). Superselective catheterization of arterial pedicles supplying the targeted AML was performed using a coaxial microcatheter (Renegade; Boston Scientific, Natick, MA) over a microwire (Transcend; Boston Scientific, Natick, MA). Once satisfactory microcatheter positioning was confirmed with digital subtraction angiography (DSA), embolization was performed under continuous fluoroscopy using calibrated 300-500 micron microspheres (Embosphere; Merit Medical, South Jordan, UT). Achievement of stasis within the target artery and absence of inadvertent non-target embolization of adjacent normal renal parenchyma were monitored during the embolization portion of the procedure. Stasis within the target artery was considered the standardized embolization endpoint and was confirmed with post-embolization DSA imaging. This endpoint was achieved in all embolization procedures.
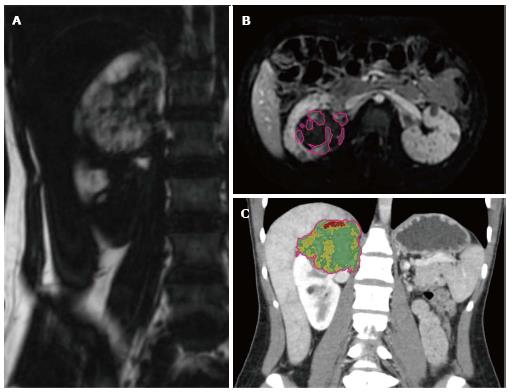
Volumetric analysis of MR and CT images was performed using a standard clinical three-dimensional image analysis software package (iNtuition; TeraRecon, Foster City, CA). Segmentation analysis tools were used to automatically create a region of interest (ROI) circumscribing the AML; minor adjustments were then made manually in three orthogonal planes. The ROI was then used to calculate tumor volumes. On MR images, the “fat only” map calculated from the in- and opposed-phase GRE sequences was used to quantify fat volume within tumors (Figure 1A). Tumor vascularity was measured by applying a thresholding tool within the ROI to semi-automatically segment areas of vascular enhancement on post-contrast subtraction images (Figure 1B). On CT images, volume histogram analysis of Hounsfield unit (HU) was performed to quantify tumor tissue composition (Figure 1C). Pixels with HU ranging from -100 to -20 HU were considered to represent macroscopic fat, and pixels with HU ranging from 100 to 200 were considered to represent blood vessels; selection of these thresholds represents an adaptation from a previously published technique[11].
Tumor vascularity that was based on angiographic imaging was analyzed in a semi-quantitative manner using a previously published grading scale[12]. The lesions were characterized based upon several parameters: Mean vessel density, size, the absence or presence of a parasitized arterial supply, and the number and size of any pseudoaneurysms. Based on these observations, lesions were then classified into 3 grades of vascularity. Grade 1 lesions demonstrated small caliber peripheral arteries without significant central vascularity. Lesions with microaneurysms less than 2 mm in size were also considered grade 1. Grade 2 lesions demonstrated medium-sized and/or abundant arteries with or without a parasitized arterial supply. Additionally lesions with pseudoaneurysms between 2 and 5 mm were considered grade 2. Grade 3 lesions contained large, tortuous vessels and/or pseudoaneurysms greater than 5 mm in size.
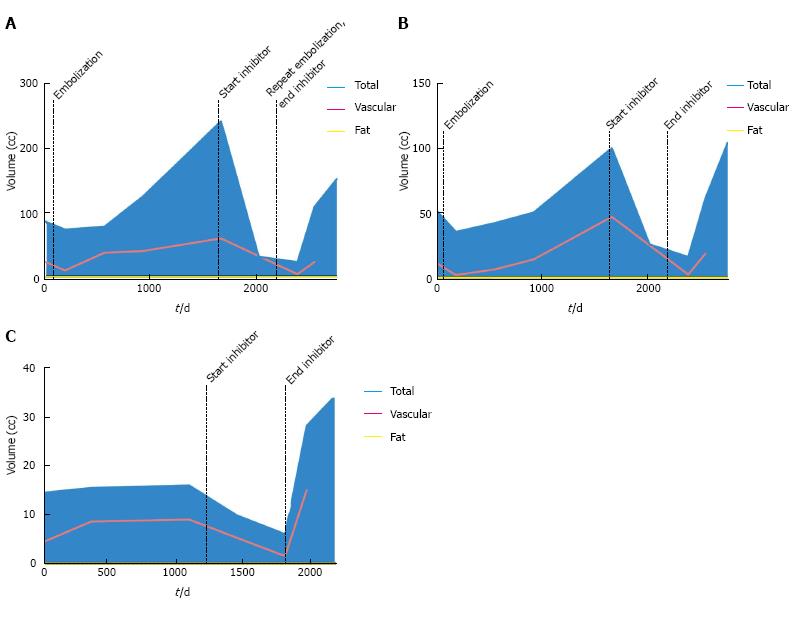
At the time of initial presentation, patient 1 was a 15-year-old female with a history of TSC-associated seizure disorder, developmental delay, autism and bilateral renal AMLs (Table 1). During several years of serial surveillance imaging she was noted to have a gradual increase in the size and number of her renal lesions. Specifically, there was a 6.8 cm right lower pole AML, a 4.0 cm right upper pole AML, and a 3.8 cm left upper pole AML, none of which had a substantial fatty component. There was no evidence of hydronephrosis, and there were no mass-related symptoms such as flank pain. Given the tumoral size, prophylactic embolization of the right upper and lower pole AMLs was performed in 2007 in order to reduce the risk of hemorrhage. Angiographically the right upper pole lesion demonstrated grade 3 vascularity, while the right lower pole lesion demonstrated grade 2 vascularity. Despite initial control of tumoral size, both lesions began enlarging approximately 2 years after embolization (right lower pole, Figure 2A; right upper pole, Figure 2B). As a result, mTOR therapy with everolimus 10 mg daily was initiated in 2011, which resulted in a dramatic decrease in tumor volume of both the soft tissue [-521% (upper pole) and -943% (lower pole)] and vascular compartments [-1791% (upper pole) and -1257% (lower pole)]. The left upper pole AML, which was not embolized, also demonstrated a significant decrease in size (-166.7%) (Figure 2C). The patient experienced mild side effects from mTOR inhibitor therapy such as oral ulcers. In 2013, mTOR inhibitor therapy was stopped, as diminishing returns were expected with regards to further decreases in tumor size. In an effort to consolidate the gains made by mTOR inhibition, repeat embolization of the right lower pole AML was performed; at this time, grade 2 vascularity was again seen in the lesion. Upon termination of mTOR inhibitor therapy, there was immediate rebound growth of the left upper pole AML (82.5%). The two right renal AMLs which had undergone embolization demonstrated a brief period of tumoral size control, but within a year both lesions demonstrated substantial rebound growth [84.5% (upper pole) and 84.7% (lower pole) from nadir].
| Time (d) | Event |
| 0 | MRI |
| 76 | Angiogram with embolization of right upper and lower pole AMLs |
| 189 | MRI |
| 560 | MRI |
| 924 | MRI |
| 1660 | MRI |
| 1793 | Initiation of mTOR inhibitor |
| 2017 | MRI |
| 2381 | MRI |
| 2382 | Angiogram with embolization of right lower pole AML |
| 2383 | Cessation of mTOR inhibitor |
| 2542 | MRI |
| 2752 | MRI |
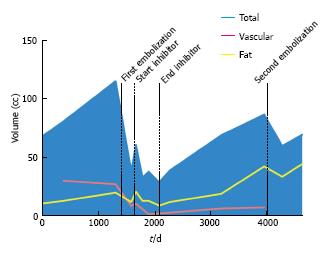
At the time of initial presentation, patient 2 was an 18-year-old female with a history of TSC-associated seizure disorder, facial angiofibromas, a right renal AML, and an atrophic left kidney (Table 2). She underwent serial cross sectional CT imaging of the right renal AML for several years, which demonstrated sizeable fat and vascular compartments within the tumor (Figure 3). In 2006 transcatheter embolization of the AML was performed because of lesion size, at which time the tumor vascularity was grade 2. Despite an initial volume response, the tumor began to grow, and as a result she was enrolled in an mTOR inhibitor phase II clinical trial with sirolimus 4 mg daily for one year. The patient did not experience any major side effects from this therapy. During the treatment course there was a significant decrease in tumoral volume (-52%) mirrored across the fat (-61.5%), soft tissue (-32%), and vascular (-496%) compartments. Upon discontinuation of mTOR inhibition there was rebound tumoral growth, once again across all three tissue compartments. The patient subsequently underwent repeat embolization of the AML, at which time the tumor vascularity was grade 1. This procedure, however, was not able to provide sustained control of tumor size, as continued growth of the AML occurred despite the repeat embolization.
| Time (d) | Event |
| 0 | CT |
| 399 | CT |
| 1322 | CT |
| 1411 | Angiogram with embolization of right upper pole AML |
| 1600 | CT |
| 1680 | MRI |
| 1658 | Initiation of mTOR inhibitor |
| 1799 | MRI |
| 1908 | MRI |
| 2093 | MRI |
| 2094 | Cessation of mTOR inhibitor |
| 2280 | MRI |
| 3192 | MRI |
| 3951 | MRI |
| 4039 | Angiogram with embolization of right upper pole AML |
| 4270 | MRI |
| 4624 | MRI |
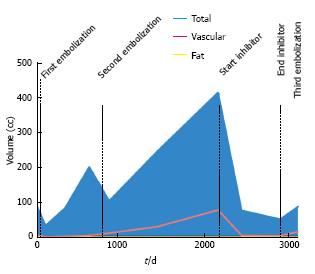
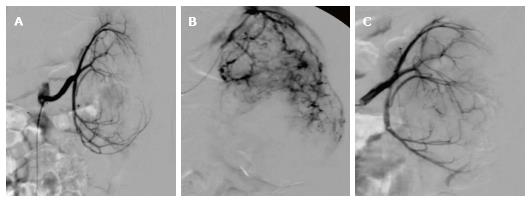
At the time of initial presentation, patient 3 was a 5-year-old male with a history of TSC-associated seizure disorder, developmental delay, and a left renal AML (Table 3). Cross sectional imaging demonstrated no significant fatty component to the renal lesion. He underwent prophylactic embolization of the tumor in 2004. The tumor demonstrated grade 1 vascularity on initial angiography. After embolization, initial tumor response was quickly followed by continued growth of the tumor (54.8%) (Figure 4), necessitating repeat embolization in 2006; angiography during this repeat embolization was notable for a significant increase in tumor vascularity since the initial embolization, with the development of multiple large pseudoaneurysms that were consistent with grade 3 vascularity (Figure 5). After the repeat embolization, a short period of tumor regression was again followed by steady tumor growth. mTOR inhibitor therapy was initiated in 2010 with sirolimus 2.5 mg twice daily, and for the subsequent 2 years, there was excellent control of tumor volume. The patient did not experience any major side effects from this therapy. In 2012, mTOR inhibitor therapy was stopped, as diminishing returns were expected with regards to further decreases in tumor size. In an effort to consolidate the gains made by mTOR inhibition, the patient underwent a third embolization. Tumor vascularity was notably decreased as compared to the second embolization procedure (Figure 5C). Following the third embolization, however, the tumor demonstrated immediate rebound growth (41%).
| Time (d) | Event |
| 0 | MRI |
| 30 | Angiogram with embolization of left renal AML |
| 105 | MRI |
| 338 | MRI |
| 625 | MRI |
| 750 | Angiogram with embolization of left renal AML |
| 861 | MRI |
| 1434 | MRI |
| 2157 | MRI |
| 2158 | Initiation of mTOR inhibitor |
| 2437 | MRI |
| 2897 | MRI |
| 2897 | Angiogram with embolization of left renal AML |
| 2898 | Cessation of mTOR inhibitor |
| 3108 | MRI |
AMLs are the most commonly encountered benign renal tumor[13], and while they most frequently arise sporadically in the general population, approximately 80% of patients with TSC develop these tumors. The most devastating complication of AMLs is hemorrhage. Tumor size is the most commonly used predictor for hemorrhagic risk, although such decision algorithms are based upon data gathered primarily from sporadic AMLs. TSC-associated AMLs, however, are likely biologically distinct from their sporadic counterparts, and while some studies have corroborated the use of 4 cm diameter as a threshold for intervention in the setting of TSC as at-risk for hemorrhage[14], other reports have found no size association until the AMLs are on the order of 10 cm[4].
Alternative biomarkers have therefore been sought to prognosticate risk of hemorrhage. Rimon et al[12] established a semiquantitative vascular grading system for AMLs and found that tumors with more extensive vascularity were more likely to bleed. Planché et al[11] performed composition analyses of AMLs prior to and following embolization using CT histograms and demonstrated that tumors with a dominant angiomyogenic composition were better responders to transarterial embolization than tumors that were predominantly lipid containing.
By applying the same vascular grading scale as Rimon et al[12] we demonstrate that mTOR inhibitor therapy may reduce tumor vascularity, though given the concomitant performance of intra-arterial embolization, segregating the effects of the two treatment methods based on these data is limited. The reduction in tumor volume is paralleled across the lipid and angiomyogenic components of the lesions. Moreover, rebound growth following discontinuation of mTOR inhibitor therapy is also paralleled across all tissue compartments, including tumor vascularity. This corroborates the hypothesis that any hemorrhage risk reduction achieved by mTOR inhibition is lost once therapy is stopped.
The impact of transcatheter arterial embolization on tumor volume in this case series is remarkable for its transience. All three patients demonstrated regrowth soon after embolization. Previously published reports have demonstrated a far better success rate with TSC-associated AML embolization. For example, Kothary et al[5] found a 43% treatment failure rate among 10 TSC patients treated for 21 AMLs. Others have reported even greater success rates: Ewalt et al[6] described essentially no regrowth in all 16 TSC patients following AML embolization, and Harabayashi et al[4] reported a decrease in tumor size in 10 of 11 TSC-associated AMLs following embolization. While the reasons for these discrepancies are unclear, patient selection and duration of follow up may contribute. For example, the majority of patients reported by Ewalt et al[6] were followed for only 3 mo, while embolization for prophylaxis was considered to be an exclusion criterion by Harabayashi et al[4] and thus patients with asymptomatic AMLs were not included.
We acknowledge several limitations to this study. Firstly, the small sample size limits the generalizability of the conclusions. However, AMLs with a variety of initial tissue compositions, including lipomatous and non-lipomatous as well as highly vascular and poorly vascular tumors, were included, and the findings of volume reduction in all three tissue compartments were seen in all lesions. Moreover, given the study design, the independent effect of mTOR inhibitors cannot be purely isolated, as all patients underwent embolization as well.
The addition of transcatheter arterial embolization to mTOR inhibitor therapy did not provide sustained abrogation of tumor growth. Although it would be highly desirable to consolidate the gains in tumor volume control from mTOR inhibition by embolizing the residual tumor and thereby prevent rebound growth, this synergy unfortunately did not occur in our series.
Pharmacologic management of TSC-associated AMLs with mTOR inhibitors can provide substantial tumor volume reduction for the duration of the therapeutic course. In this case series, we illustrate that this volume reduction impacts all three tissue compartments of the tumor. Tumor vascularity tended to be lower grade following mTOR inhibition, suggesting that mTOR inhibitors may reduce risk of tumoral rupture. Unfortunately rebound growth involving all tissue compartments follows shortly after discontinuation of mTOR inhibitor therapy, suggesting that the risk reductions are lost. The addition of transarterial embolization to mTOR inhibitors did not curtail the occurrence of rebound growth.
Tuberous sclerosis complex (TSC) is an autosomal dominant genetic disorder affecting approximately 2 million people globally. Mutations in the TSC1 and TSC2 genes, important regulators of the mammalian target of rapamycin signaling pathway, result in the development of tumors involving multiple organ systems. As many as 80% of patients with TSC develop renal angiomyolipomas, which are soft tissue hamartomatous tumors containing multiple soft tissue components including fat, smooth muscle, and blood vessels.
Segmentation analysis tools were used to automatically create a region of interest circumscribing the angiomyolipomas. On magnetic resonance images, the “fat only” map calculated from the in- and opposed-phase gradient recalled echo sequences was used to quantify fat volume within tumors. Tumor vascularity was measured by applying a thresholding tool within the region of interest on post-contrast subtraction images.
Transcatheter arterial embolization was performed prophylactically in all 3 patients by attending interventional radiologists.
Stasis within the target artery was considered the standardized embolization endpoint and was confirmed with post-embolization digital subtraction angiography imaging. This endpoint was achieved in all embolization procedures.
Transcatheter arterial embolization.
The authors have performed a good study, the manuscript is interesting.
P- Reviewer: Andersen PE, Kambadakone A, Tarazov PG S- Editor: Qiu S L- Editor: A E- Editor: Lu YJ
| 1. | Shepherd CW, Gomez MR, Lie JT, Crowson CS. Causes of death in patients with tuberous sclerosis. Mayo Clin Proc. 1991;66:792-796. [PubMed] [DOI] [Cited in This Article: ] [Cited by in Crossref: 349] [Cited by in F6Publishing: 321] [Article Influence: 9.7] [Reference Citation Analysis (0)] |
| 2. | Yamakado K, Tanaka N, Nakagawa T, Kobayashi S, Yanagawa M, Takeda K. Renal angiomyolipoma: relationships between tumor size, aneurysm formation, and rupture. Radiology. 2002;225:78-82. [PubMed] [DOI] [Cited in This Article: ] [Cited by in Crossref: 306] [Cited by in F6Publishing: 271] [Article Influence: 12.3] [Reference Citation Analysis (0)] |
| 3. | Steiner MS, Goldman SM, Fishman EK, Marshall FF. The natural history of renal angiomyolipoma. J Urol. 1993;150:1782-1786. [PubMed] [Cited in This Article: ] |
| 4. | Harabayashi T, Shinohara N, Katano H, Nonomura K, Shimizu T, Koyanagi T. Management of renal angiomyolipomas associated with tuberous sclerosis complex. J Urol. 2004;171:102-105. [PubMed] [DOI] [Cited in This Article: ] [Cited by in Crossref: 69] [Cited by in F6Publishing: 72] [Article Influence: 3.6] [Reference Citation Analysis (0)] |
| 5. | Kothary N, Soulen MC, Clark TW, Wein AJ, Shlansky-Goldberg RD, Crino PB, Stavropoulos SW. Renal angiomyolipoma: long-term results after arterial embolization. J Vasc Interv Radiol. 2005;16:45-50. [PubMed] [DOI] [Cited in This Article: ] [Cited by in Crossref: 150] [Cited by in F6Publishing: 150] [Article Influence: 7.9] [Reference Citation Analysis (0)] |
| 6. | Ewalt DH, Diamond N, Rees C, Sparagana SP, Delgado M, Batchelor L, Roach ES. Long-term outcome of transcatheter embolization of renal angiomyolipomas due to tuberous sclerosis complex. J Urol. 2005;174:1764-1766. [PubMed] [DOI] [Cited in This Article: ] [Cited by in Crossref: 80] [Cited by in F6Publishing: 89] [Article Influence: 4.7] [Reference Citation Analysis (0)] |
| 7. | Bissler JJ, McCormack FX, Young LR, Elwing JM, Chuck G, Leonard JM, Schmithorst VJ, Laor T, Brody AS, Bean J. Sirolimus for angiomyolipoma in tuberous sclerosis complex or lymphangioleiomyomatosis. N Engl J Med. 2008;358:140-151. [PubMed] [DOI] [Cited in This Article: ] [Cited by in Crossref: 925] [Cited by in F6Publishing: 868] [Article Influence: 54.3] [Reference Citation Analysis (0)] |
| 8. | Bissler JJ, Kingswood JC, Radzikowska E, Zonnenberg BA, Frost M, Belousova E, Sauter M, Nonomura N, Brakemeier S, de Vries PJ. Everolimus for angiomyolipoma associated with tuberous sclerosis complex or sporadic lymphangioleiomyomatosis (EXIST-2): a multicentre, randomised, double-blind, placebo-controlled trial. Lancet. 2013;381:817-824. [PubMed] [DOI] [Cited in This Article: ] [Cited by in Crossref: 580] [Cited by in F6Publishing: 574] [Article Influence: 52.2] [Reference Citation Analysis (0)] |
| 9. | Peng ZF, Yang L, Wang TT, Han P, Liu ZH, Wei Q. Efficacy and safety of sirolimus for renal angiomyolipoma in patients with tuberous sclerosis complex or sporadic lymphangioleiomyomatosis: a systematic review. J Urol. 2014;192:1424-1430. [PubMed] [DOI] [Cited in This Article: ] [Cited by in Crossref: 28] [Cited by in F6Publishing: 27] [Article Influence: 2.7] [Reference Citation Analysis (0)] |
| 10. | Glover GH. Multipoint Dixon technique for water and fat proton and susceptibility imaging. J Magn Reson Imaging. 1991;1:521-530. [PubMed] [DOI] [Cited in This Article: ] [Cited by in Crossref: 300] [Cited by in F6Publishing: 285] [Article Influence: 8.6] [Reference Citation Analysis (0)] |
| 11. | Planché O, Correas JM, Mader B, Joly D, Méjean A, Hélénon O. Prophylactic embolization of renal angiomyolipomas: evaluation of therapeutic response using CT 3D volume calculation and density histograms. J Vasc Interv Radiol. 2011;22:1388-1395. [PubMed] [DOI] [Cited in This Article: ] [Cited by in Crossref: 30] [Cited by in F6Publishing: 32] [Article Influence: 2.5] [Reference Citation Analysis (0)] |
| 12. | Rimon U, Duvdevani M, Garniek A, Golan G, Bensaid P, Ramon J, Morag B. Large renal angiomyolipomas: digital subtraction angiographic grading and presentation with bleeding. Clin Radiol. 2006;61:520-526. [PubMed] [DOI] [Cited in This Article: ] [Cited by in Crossref: 54] [Cited by in F6Publishing: 59] [Article Influence: 3.3] [Reference Citation Analysis (0)] |
| 13. | Chan CK, Yu S, Yip S, Lee P. The efficacy, safety and durability of selective renal arterial embolization in treating symptomatic and asymptomatic renal angiomyolipoma. Urology. 2011;77:642-648. [PubMed] [DOI] [Cited in This Article: ] [Cited by in Crossref: 41] [Cited by in F6Publishing: 48] [Article Influence: 3.4] [Reference Citation Analysis (0)] |


