Prenatal diagnosis involves methods used in early pregnancy as either screening tests or diagnostic methods. The aims of the study were to i) investigate guidelines on prenatal diagnosis in the counties of Sweden, ii) investigate uptake of prenatal diagnosis, and iii) background characteristics and pregnancy outcomes in relation to different prenatal diagnostic methods.
Methods
A retrospective cross-sectional study using data from the Swedish Pregnancy Register 2011 to 2013 (284,789 pregnancies) was performed. Additionally, guidelines on prenatal diagnosis were collected. Biostatistical and epidemiological analyses were performed including calculation of odds ratios (OR) and their 95% confidence intervals in univariate and multivariate logistic regression analyses.
Results
The national uptake of routine ultrasound examination, Combined Ultrasound and Biochemical test (CUB), Amniocentesis (AC) and Chorionic Villus Sampling (CVS) were 97.6, 33.0, 2.6 and 1.1%, respectively. From 2012, 6/21 counties offered CUB test to all pregnant women, nine counties at specific indications, and five counties did not offer CUB at all. Advanced maternal age demonstrated the highest impact on uptake of prenatal diagnosis. Further, university educational level in relation to lower educational level was associated with an increased likelihood of undergoing CUB (OR 2.30, 95% CI 2.26–2.35), AC (OR 1.54, 95% CI 1.46–1.63) and CVS (OR 2.68, 95% CI 2.44–2.93).
Conclusion
Offers of prenatal diagnosis varied considerably between counties resulting in unequal access to prenatal diagnosis for pregnant women. The intentions of the Swedish Health and Medical Services Act stating equal care for all, was thus not fulfilled.
Abkürzungen
AC
Amniocentesis
ACI
Adjusted confidence interval
ANC
Antenatal Care
AOR
Adjusted odds ratio
AUDIT
Alcohol Use Disorder Identification Test
BMI
Body mass index
CI
Confidence interval
CS
Caesarean section
CUB
Combined Ultrasound and Biochemical test
CVS
Chorionic Villus Sampling
IQR
Interquartile range
MHCA
Maternal Health Care Area
MHCR
The Swedish Maternal Health Care Register
NIPT
Non-Invasive Prenatal Testing
OR
Odds ratio
SD
Standard deviation
SPR
The Swedish Pregnancy Register
Background
Antenatal care (ANC) is free of charge which almost all pregnant women in Sweden attend [1]. Most pregnant women are managed by public ANC facilities but private ANC clinics are also available. Sweden is divided into 21 counties, including 43 maternal health care areas (MHCAs). The 43 MHCAs issue medical guidelines based on national recommendations, local health care organization, and local policy related to surveillance of pregnancy [1]. For each MHCA, an antenatal care obstetrician and an antenatal care coordinator (midwife) are responsible for the medical guidelines. ANC in Sweden is mainly organized within the primary health system, but exceptionally it is integrated within hospital systems. Midwives working in ANC units are responsible for the monitoring of pregnant women with regard to current medical guidelines, and are responsible of referral of patients to hospital clinics when indicated. Information on prenatal diagnosis is provided by midwives in ANC, whereas prenatal screening or diagnostic procedures are generally undertaken in hospital-based clinics. In addition, midwives in ANC have to manage different administrative systems related to provision of health care, such as keeping medical records, and entering data into the Swedish Pregnancy Register.
The Maternal Health Care Register and the Swedish Pregnancy Register
The Swedish Maternal Health Care Register (MHCR) is a national quality register where pregnant women participate on a voluntary basis by contributing with information on their pregnancy and delivery [2]. MHCR has collected data on outcomes of pregnancy, delivery, and the postpartum period since 1999. The quality of data recorded in the MHCR has previously been investigated, and show that most variables in the MHCR demonstrated good to a very good degree of coverage of data, and satisfying internal validity [3]. The MHCR was integrated in the Swedish Pregnancy Register (SPR) in January 1st 2013, in a merge of three registers involved in the different aspects of health care during pregnancy. The proportion of pregnancies registered in the MHCR was 81 and 85% during 2011 and 2012. The participation rate in the SPR during 2013 was further increased, reaching 89% of all women continuing pregnancy.
Anzeige
The National Board of Health and Welfare in Sweden has issued regulations concerning counselling on different methods of early prenatal screening and diagnostic procedures [4]. These regulations state that pregnant women and their partners must be offered this information at first visit in ANC. Early prenatal diagnosis is defined as prenatal screening and diagnostic procedures during the first 22 weeks of gestation [5]. Prenatal screening or diagnostic procedures during the first 22 weeks of gestation include the second trimester scan usually performed at a gestational age of 18 to 20 weeks, Combined Ultrasound and Biochemical test (CUB) and invasive tests such as either Chorionic Villus Sampling (CVS) or Amniocentesis (AC). CUB is a screening test, basically used to estimate the risks of trisomy 13, 18, and 21. The CUB test is performed during the first trimester when maternal serum samples are collected followed by a nuchal translucency scan during the gestational period of 11 to 13 + 6 days [6, 7]. The combined likelihood ratios are then calculated, and when the risk of Down’s syndrome is estimated to be higher than 1/200 above, the woman is offered an invasive procedure in order to obtain a certain diagnosis [8]. An invasive test may be a consequence of CUB, but may also be performed due to a known or suspected genetic condition that may be determined by DNA-PCR, CGH array or specific mutation analysis [5]. AC may be performed following 15 completed weeks, due to the increased risk of miscarriage or clubfoot, if the procedure is performed at an earlier gestational age [9].
The rationale of this study was to investigate the utilisation of prenatal diagnosis in Sweden during the study period 2011 to 2013 in relation to the different offers of prenatal screening and diagnostic procedures on a national level and comparing different counties.
Aims
The overall aim was to investigate background characteristics and pregnancy outcomes in relation to the use of prenatal screening methods and diagnostic procedures in Sweden.
The specific aims of the study were to i) investigate guidelines on prenatal diagnosis in the counties of Sweden, ii) investigate uptake of routine ultrasound examination, combined ultrasound and biochemical test (CUB), chorionic villus sampling (CVS) and amniocentesis (AC), and iii) background characteristics and pregnancy outcomes in relation to different prenatal screening and diagnostic procedures.
Anzeige
Methods
Study design and setting
This retrospective, cross-sectional, epidemiological study analysed data on pregnancies from the Swedish Maternal Health Care Register and the Swedish Pregnancy Register from 2011 to 2013. MHCR was an independent register until 2012. MHCR was integrated into the SPR, as one of three registers when the SPR was formed in 2013. Here, SPR refers to MHCR and SPR as one entity. Inclusion criteria, for participating in the study, were being a subject included in the SPR with a date of delivery of a live or stillborn child from January 1st 2011 to December 31st 2013, and with a gestational age of 22 weeks and 0 days to 43 weeks and 0 days. Data on all pregnancies 2011 to 2013 were obtained from the SPR, comprising 284,789 women and their offspring. The participation rate of pregnant women in SPR was during 2011, 2012, and 2013, 81, 85 and 89%, respectively. The coverage of variables in relation to county, varied from 74 to 99% during 2013. Additionally, medical guidelines regarding offers to pregnant women on prenatal screening and diagnostic procedures were collected from each Maternal Health Care Area (MHCA; N = 43) in Sweden for 2011, 2012 and 2013. The guidelines during this study period were almost consistent with the exception of changes in two counties where no pregnant women previously had been offered CUB until 2011. A new guideline was introduced during 2012 in these two counties, offering all pregnant women CUB. The proportion of births in these two counties corresponds to 4% of all births in Sweden. Sweden includes 21 different counties where the majority of counties host only one MHCA, whereas some larger cities host multiple MHCAs, as for example the area of the capital Stockholm. Results related to guidelines will be presented on county-level.
Definitions of variables
Some variables acted both as independent and dependent variables in analyses. See the descriptions below.
Independent variables
Maternal age was defined as age in years at delivery. Parity was defined as total number of children born (including the index pregnancy in the SPR). Primiparity was defined as having delivered one child, i.e. including the index pregnancy, and multiparity was defined as having delivered at least 2 children (in two pregnancies or more, including the index pregnancy). Body mass index (BMI) was calculated with the formula BMI = kg/m2. The different BMI groups were defined in accordance with the WHO’s definition of BMI: underweight: <18.50 kg/m2; normal weight: 18.50–24.99 kg/m2; overweight: 25.00–29.99 kg/m2, obesity class 1: 30.00–34.99 kg/m2, obesity class 2: 35.00–39.99 kg/m2, and obesity class 3: ≥40.00 kg/m2 [10]. Level of education was defined as elementary school, high school or university. Employment status was categorized into “employed”, “student”, “parental leave”, “unemployed”, “sick leave”, and “other status”. Country of origin was categorized into Sweden, other Nordic countries (Norway, Finland, Iceland, and Denmark) and Europe (excluding Sweden and other Nordic countries), Africa, Asia and other countries. The variable Alcohol screening (Alcohol Use Disorder Identification Test = AUDIT scores) was categorized in whether performed “yes” or “no”. AUDIT-score ranged from 0 to 40 scores, and was categorized into ≤5 scores and ≥6 scores, which indicates harmful alcohol use [11]. Self-rated health prior to pregnancy was categorized in “very good”, “good”, “neither good nor poor”, “poor”, and “very poor”. The following variables were categorized in “yes” or “no”: smoking at 3 months prior to pregnancy, smoking at first ANC visit, smoking at 32 weeks of gestation, use of snuff 3 months prior to pregnancy, use of snuff 3 months at first ANC, use of snuff at 32 weeks of gestation, counselling due to fear of childbirth where fear of childbirth was defined in the SPR as a subject being referred for counselling due to fear of childbirth, treatment of psychiatric disorder where psychiatric disorder was defined in the SPR as either medical or psychological treatment of psychiatric disorder, or both, combined ultrasound and biochemical test (CUB), chorionic villus sampling (CVS) and amniocentesis (AC).
Dependent variables
The following variables were categorized into “yes” or “no”: combined ultrasound and biochemical test (CUB), chorionic villus sampling (CVS), amniocentesis (AC), counselling due to fear of childbirth and treatment of psychiatric disorder. Gestational age was reported in days of gestation and presented as a continuous variable. Mode of delivery was categorized in “vaginal delivery”, “instrumental delivery” (including delivery with vacuum extraction or forceps), and “caesarean section”. Caesarean section (CS) was further categorized in “elective caesarean section” and “emergency caesarean section”. Birth weight in grams was presented as a continuous variable.
Statistics
Categorical variables were analysed with frequencies and percentages. Continuous variables were presented by their mean value and standard deviation (SD), and by their median value and interquartile range (IQR). Continuous variables were tested for the assumption of normal distribution. Test of trend was analysed by Linear-by-Linear Association for investigation of linear trends over the years. Test of difference between independent groups were analysed with One-Way Anova test and independent samples t-test for parametric data, corrected for homogeneity for variance if necessary. The Pearson’s Chi-Square test was used for test of difference between groups for categorical data. Level of significance was set at p < 0.05. Odds ratios (OR) and their 95% confidence intervals (CI) were calculated in univariate and multivariable logistic regression analyses. SPSS vs. 22 and vs. 23 were used for these calculations. A Venn diagram was created to present the uptake of CUB, CVS and AC in the study sample. A figure presenting a map of Sweden was created to illustrate geographical differences in uptake of CUB, where the 21 counties were categorized into 4 groups of CUB uptake rate: less than 10%, 10 to 29.99%, 30 to 69.99% or 70% or more.
Results
Offers on prenatal diagnosis in Sweden
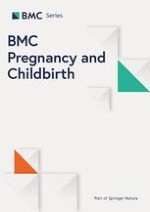
All counties in Sweden except one had issued written guidelines concerning offers of prenatal screening methods and diagnostic procedures during the first and second trimesters of pregnancy. These guidelines remained unchanged in all counties except for two counties, during the study period. Three Swedish counties offered a routine ultrasound examination at 12 weeks of gestation for the purpose of dating and all other counties offered a second trimester scan at the gestational age of 17–20 weeks, with the exception of one county that accepted dating from week 16. CUB was offered to all pregnant women in six counties, was offered on indication advanced maternal age in nine counties, and was not offered at all in five counties. The definition of advanced maternal age as indication for CUB demonstrated a substantial variation between counties. The different cut-off-values defining an indication for offering the CUB test were: age >33 years at last menstrual period, age ≥35 years at last menstrual period, age ≥35 years at conception, age ≥35 years at the time for the CUB-test, and age ≥35 years at the estimated date of delivery. In addition, one county included “anxiety related to pregnancy” as an indication for offering CUB. All counties offered either CVS or AC as prenatal diagnostic procedures on the indications: maternal age ≥35 years, increased risk for chromosomal aberration following CUB, or second trimester serum screening, or familial genetic condition. Three counties offered AC only if CUB had previously been performed and indicated an increased risk. During 2013, the uptake of CUB varied between the counties from 2.2% to 80.3%, (Table 1). Figure 1 shows a map of Sweden presenting the 21 counties and their uptake of CUB categorized into four levels. The lowest uptake rate, i.e. uptake less than 10%, corresponds to counties where no pregnant women were offered CUB. Pregnant women, living in any of the counties where no women were offered CUB, could still have undergone CUB but if so, privately and at their own expense.
Table 1
Uptake of Combined Ultrasound and Biochemical test (CUB) per County (N = 21) 2011 to 2013
County
CUB
Proportionsa
2011
2012b
2013
2013
%
%
%
%
1
41.0
47.4
53.2
26.1
2
18.4
19.5
21.4
17.0
3
26.4
27.8
30.1
13.8
4
81.4
78.9
80.3
4.4
5
23.7
25.0
24.9
3.5
6
64.9
66.6
66.9
3.4
7
6.7
7.9
7.0
2.9
8
59.5
61.6
63.4
2.9
9
2.4
3.0
2.7
2.7
10
5.1
5.1
3.9
2.5
11
10.4
11.7
11.0
2.5
12
6.4
9.3
9.7
2.4
13
48.9
56.3
60.9
2.4
14
1.1
1.7
2.2
2.2
15
5.3
6.7
8.8
2.1
16
13.1
13.7
12.6
2.1
17
2.9
28.8
66.7
2.1
18
4.2
18.9
75.1
1.9
19
2.0
3.9
5.3
1.3
20
13.3
16.2
15.1
1.1
21
12.5
14.6
14.2
0.5
Total
29.8
32.5
36.2
100
aProportions of births per county in relation to the total number of births in Sweden 2013 (N = 113,593)
bCounty no 17 and no 18 changed their guidelines of prenatal diagnosis during 2012
Fig. 1
Map of Sweden presenting the 21 counties and their uptake of CUB categorised into four levels
×
The study population
The study population included 284,789 pregnant women, and the distribution of participants per year was 30.9% (2011), 33.7% (2012) and 35.3% (2013). Background characteristics for the study population are presented in Table 2. Mean age and mean body mass index (BMI) were 30.24 years and 24.79 kg/m2, respectively. Mean age and body mass index of primiparous and multiparous women were 28.83 years and 31.72 years, and 24.34 kg/m2 and 25.14 kg/m2, respectively (Table 2). For multiparous women, the variable maternal age was normally distributed 2012 and 2013 (Table 2). For primiparous women who had undergone CUB-test the variable maternal age was normally distributed (Table 4). All other continuous variables demonstrated skewness to some degree. Almost all pregnant women were examined with a routine ultrasound scan during pregnancy (97.6%), and the overall proportions of women examined with CUB, CVS or AC were 33.0, 1.1 and 2.6% (Table 3). The percentage of women examined with CUB increased significantly during the study period from 29.8% in 2011 to 36.2% in 2013 (p < 0.001) (Table 3). The number of pregnant women, who were examined with CUB, CVS or AC, or any combinations of these procedures, was in total 98,697, which corresponds to 33.4% of all women and is presented in a Venn diagram (Fig. 2). Of all pregnant women who were examined with CUB, 1.1% (n = 1252) thereafter underwent CVS, and 2.7% (n = 2493) underwent AC after CUB. Of all women who were examined with CVS (n = 2970), 42.2% had undergone CUB prior to CVS. Of all women who were examined with AC (n = 7279), 34.2% had undergone CUB prior to AC.
Table 2
Background characteristics and pregnancy outcomes in the Swedish Pregnancy Register 2011 to 2013 (N = 284,789)
Variable
Total
2011
2012
2013
Test of differencea
N = 284,789
n = 88,140
n = 96,043
n = 100,606
n
%
n
%
n
%
n
%
Maternal ageb, primiparous women (years)
Mean (SD)c
28.83 (5.12)
28.78 (5.17)
28.82 (5.14)
28.87 (5.07)
0.053
Min-max
13.49–56.30
13.52–52.64
13.78–56.30
13.49–52.89
Median (IQR)d
28.64 (7.07)
28.66 (7.08)
28.59 (7.05)
28.67 (7.04)
Maternal ageb, multiparous women (years)
Mean (SD)c
31.72 (4.90)
32.29 (4.89)
32.21 (4.90)
32.16 (4.89)
<0.001
Min-max
15.00–57.00
17.07–53.25
16.41–54.47
15.67–57.34
Median (IQR)d
32.30 (6.88)
32.41 (6.91)
32.28 (6.84)
32.23 (6.89)
Maternal ageb in age-groups (years)
< 20
3976
1.4
1369
1.6
1319
1.4
1288
1.3
20–24
38,832
13.6
11,990
13.6
13,222
13.8
13,611
13.5
25–29
84,129
29.5
25,578
29.0
28,393
29.6
30,158
30.0
30–34
95,772
33.6
29,463
33.4
32,243
33.6
34,066
33.9
35–39
50,717
17.8
16,215
18.4
17,010
17.7
17,492
17.4
40–44
10,705
3.8
3323
3.8
3625
3.8
3757
3.7
> 44
583
0.2
167
0.2
213
0.2
203
0.2
Body mass index (kg/m2)
Mean (SD)c
24.79 (4.65)
24.75 (4.62)
24.82 (4.67)
24.81 (4.66)
0.002
Min-max
13.03–71.63
13.82–62.06
13.63–67.22
13.03–71.63
Median (IQR)d
23.80 (5.00)
23.74 (5.41)
23.81 (5.45)
23.81 (5.52)
< 18.5
6838
2.5
2044
2.4
2328
2.5
2466
2.5
18.5–24.99
163,856
59.2
50,787
59.7
55,203
58.9
57,866
58.9
25–29.99
70,440
25.4
21,478
25.3
23,870
25.5
25,092
25.5
30–34.99
25,166
9.1
7526
8.8
8573
9.2
9067
9.2
35.39.99
7899
2.9
2374
2.8
2734
2.9
2791
2.8
≥ 40
2759
1.0
836
1.0
969
1.0
954
1.0
Educational level
Elementary school
20,860
8.7
6662
9.4
6870
8.5
7328
8.4
<0.001
High school
95,564
40.0
27,821
39.4
32,660
40.3
35,083
40.1
University
122,623
51.3
36,155
51.2
41,432
51.2
45,036
51.5
Main occupation
Employed
195,880
70.3
59,890
70.3
66,622
70.5
69,368
70.1
<0.001
Student
31,021
11.1
9697
11.4
10,364
11.0
10,960
11.1
Parental leave
20,469
7.3
6082
7.1
6911
7.3
7475
7.5
Unemployed
15,163
5.4
4955
5.8
4996
5.3
5212
5.3
Sick leave
4421
1.6
1241
1.5
1557
1.6
1623
1.6
Other
11,686
4.2
3300
3.9
4013
4.2
4373
4.4
Country of birth
Sweden
221,398
79.4
70,376
81.8
74,187
78.9
76,835
77.8
<0.001
Other Nordic countriese
2374
0.8
613
0.8
832
0.8
929
0.8
Europef
12,861
4.6
3486
4.0
4481
4.8
4900
5.0
Africa
10,782
3.9
2780
3.2
3658
3.9
4344
4.4
Asia
25,597
9.2
6886
8.0
8976
9.5
9735
9.9
Other
5902
2.1
1917
2.2
1940
2.1
2045
2.1
Smoking 3 months prior to pregnancy
38,854
13.8
12,134
13.9
13,285
14.0
13,435
13.5
0.004
Smoking at first ANCg visit
15,874
5.6
5062
5.8
5475
5.7
5337
5.4
<0.001
Smoking at 32 weeks of gestation
11,990
4.2
3923
4.5
4133
4.3
3934
3.9
<0.001
Use of snuff 3 months prior to pregnancy
9954
3.5
2530
2.9
3506
3.7
3918
3.9
<0.001
Use of snuff at first ANCg visit
2858
1.0
793
0.9
945
1.0
1120
1.1
<0.001
Use of snuff at 32 weeks of gestation
1721
0.6
548
0.6
561
0.6
612
0.6
0.572
Alcohol screening (AUDIT)h
245,544
88.1
74,712
86.7
81,408
86.7
89,424
90.6
<0.001
AUDIT-scorej
Mean (SD)c
2.19 (2.19)
2.28 (2.22)
2.20 (2.22)
2.09 (2.15)
Min-max
0–40
0–39
0–40
0–40
Median (IQR)d
2.00 (2)
2.00 (2)
2.00 (2)
2.00 (3)
≤ 5p
229,854
94.0
69,110
93.6
76,327
93.8
84,417
94.4
<0.001
≥ 6p
14,751
6.0
4704
6.4
5044
6.2
5003
5.6
Self-rated health prior to pregnancy
241,854
84.9
70,633
80.1
82,594
86.0
88,627
88.1
Very good
72,321
29.9
19,838
28.1
24,472
29.6
28,011
31.6
<0.001
Good
141,251
58.4
41,299
58.5
48,441
58.6
51,511
58.1
Neither good nor poor
20,425
8.4
6793
9.6
6962
8.4
6670
7.5
Poor
6325
2.6
2174
3.1
2197
2.7
1954
2.2
Very poor
1532
0.6
529
0.7
522
0.6
481
0.5
Counselling due to fear of childbirth
21,595
7.6
6518
7.5
7186
7.5
7891
7.9
0.001
Treatment of psychiatric disorder
17,724
6.3
5122
5.9
6061
6.4
6541
6.5
<0.001
Gestational age (days)
Mean (SD)c
278.0 (13.8)
278.0 (13.9)
277.8 (13.9)
278.1 (13.7)
<0.001
Min-max
154–301
155–301
154–301
154–301
Median (IQR)d
280.00 (13.00)
280.00 (13.00)
280.00 (13.00)
280.00 (13.00)
Mode of delivery
283,660
99.6
87,915
99.7
95,594
99.5
100,151
99.5
Vaginal
217,898
76.8
67,277
76.5
73,333
76.7
77,288
77.2
<0.001
Instrumental
19,177
6.8
6208
7.1
6616
6.9
6353
6.3
Caesarean section
46,585
16.4
14,430
16.4
15,645
16.4
16,510
16.5
Caesarean section (CS)
Elective CSj
20,272
43.6
6321
43.9
6718
43.0
7233
43.9
0.193
Emergency CSj
26,214
56.4
8085
56.1
8897
57.0
9232
56.1
Birth weight (grams)k
Mean (SD)c
3542 (556)
3540 (557)
3543 (556)
3543 (556)
0.352
Min-max
300–6640
300–6050
305–6270
300–6640
Median (IQR)d
3550 (670)
3550 (675)
3550 (674)
3550 (670)
aTest of difference between years using One-Way Anova test on numeric variables, and Pearsons’s Chi-Square test for categorical variables
bMaternal age at delivery
cSD = Standard Deviation
dIQR = Interquartile Range
eOther Nordic countries includes Norway, Finland, Iceland and Denmark
fThe Nordic countries are excluded
gAntenatal care
hAssessment of use of alcohol prior to pregnancy with screening instrument Alcohol Use Disorder Identification Test (AUDIT)
i AUDIT score ranging from 0 to 40
jCaesarean section
kSingletons exclusively included in analysis
Table 3
Uptake of routine ultrasound examination, Combined Ultrasound and Biochemical test (CUB), Chorionic Villus Sampling (CVS) and Amniocentesis (AC) during 2011 to 2013, and test of trenda
Variable
Total
2011
2012
2013
Trenda
N = 284,789
n = 88,140
n = 96,043
n = 100,606
n
%
n
%
n
%
n
%
Ultrasound
281,562
98.9
85,561
97.1
97,500
99.6
100,310
99.7
Yes
274,899
97.6
83,549
97.6
93,386
97.6
97,964
97.7
0.716
No
6663
2.4
2.012
2.4
2314
2.4
2337
2.3
CUB
278,230
98.0
84,827
96.2
94,900
98.8
99,503
98.9
Yes
92,207
33.0
25,316
29.8
30,826
32.5
36,065
36.2
<0.001
No
187,023
67.0
59,511
70.2
64,074
67.5
63,438
63.8
CVS
280,898
98.6
85,308
96.8
95,465
99.4
100,125
99.5
Yes
2983
1.1
868
1.0
927
1.0
1188
1.2
<0.001
No
277,915
98.9
84,440
99.0
94,538
98.8
98,937
98.8
AC
280,667
98.6
85,213
99.3
95,395
99.3
100,059
99.5
Yes
7318
2.6
2500
2.9
2473
2.6
2345
2.3
<0.001
No
273,349
97.4
82,713
97.1
92,922
97.4
97,714
97.7
aTest of trend by Linear-by-Linear Association
Fig. 2
Pregnant women that were examined with CUB, AC and CVS
×
Mean age for primiparous women who underwent CUB, CVS or AC was 31.34, 33.79 and 33.65 years, respectively (Table 4). Overall mean age for pregnant women who had not been examined with CUB, CVS or AC was 28.84 (defined as “all others” in Table 4), where the mean age for primiparous and multiparous women in this category was 27.09 and 30.29 years, respectively. BMI for pregnant women who had undergone CUB, CVS or AC was 24.40, 24.10 and 24.94, respectively, whereas BMI for pregnant women who had not undergone CUB, CVS or AC (“all others”) was 24.99. There was a statistically significant difference in BMI between those who underwent CUB and “all others” (p-value <0.001) (Table 4).
Table 4
Background characteristics and pregnancy outcomes in relation to prenatal screening or diagnostic procedures in the Swedish Pregnancy Register 2011 to 2013 (N = 284,789)
Variable
CUBa
CVSb
ACc
All othersd
Test of differencee
n = 92,207
n = 2983
n = 7318
n = 186,092
n
%
n
%
n
%
n
%
Maternal agef, primiparous women (years)
Mean (SD)g
31.34 (5.17)
33.79 (5.74)
33.65 (6.11)
27.09 (4.58)
<0.001
Min-max
15.09–56.30
17.29–49.03
16.74–49.83
13–54
Median (IQR)h
31.34 (7.32)
34.41 (8.38)
34.92 (9.15)
27.51 (6.41)
Maternal agef, multiparous women (years)
Mean (SD)g
34.45 (4.45)
36.87 (4.65)
37.13 (4.66)
30.29 (4.52)
<0.001
Min-max
16.41–55.34
19.10–51.76
16.41–48.68
15–57
Median (IQR)h
34.97 (5.72)
37.58 (5.66)
37.82 (5.45)
30.87 (6.07)
Maternal agef in age-groups (years)
< 20
388
0.4
8
0.3
23
0.3
3566
1.9
20–24
5863
6.4
99
3.3
313
4.3
32,702
17.6
25–29
17,617
19.1
300
10.1
733
10.0
65,926
35.4
30–34
31,792
34.5
649
21.8
1314
18.0
62,944
33.8
35–39
30,179
32.7
1262
42.3
3148
43.0
17,676
9.5
40–44
6093
6.6
628
21.1
1675
22.9
2991
1.6
> 44
270
0.3
36
1.2
109
1.5
211
0.1
Body mass index (kg/m2)
Mean (SD)g
24.40 (4.34)
24.10 (4.10)
24.94 (4.52)
24.99 (4.80)
<0.001
Min-max
13.82–56.65
15.24–51.31
15.24–50.69
13.03–71.63
Median (IQR)h
23.45 (5.0)
23.18 (5.0)
24.01 (5.0)
23.95 (6.0)
< 18.5
1965
2.2
52
1.8
121
1.7
4766
2.6
18.5–24.99
56,723
63.2
1918
66.3
4140
58.2
103,359
57.2
25–29.99
21,639
24.1
663
22.9
1926
27.1
47,160
26.1
30–34.99
6863
7.6
195
6.7
652
9.2
17,741
9.8
35.39.99
1992
2.2
48
1.7
203
2.9
5744
3.2
≥ 40
629
0.7
18
0.6
68
1.0
2071
1.1
Educational level
Elementary school
3242
4.1
69
2.7
334
5.3
17,353
11.2
<0.001
High school
24,324
31.1
608
23.7
2078
33.1
69,523
44.8
University
50,763
64.8
1887
73.6
3869
61.6
68,302
44.0
Main occupation
Employed
72,519
80.3
2439
83.7
5582
77.8
118,371
65.0
<0.001
Student
6467
7.2
146
5.0
524
7.3
24,121
13.3
Parental leave
5059
5.6
149
5.1
459
6.4
15,002
8.2
Unemployed
3320
3.7
78
2.7
294
4.1
11,601
6.4
Sick leave
1306
1.4
36
1.2
119
1.7
3009
1.7
Other
1610
1.8
66
2.3
194
2.7
9897
5.4
Country of birth
Sweden
76,276
84.5
2482
85.4
5876
81.8
139,881
76.7
<0.001
Other Nordic countriesi
904
1.0
31
1.1
74
1.0
1406
0.8
Europej
3971
4.4
102
3.5
332
4.6
8617
4.7
Africa
1243
1.4
37
1.3
127
1.8
9438
5.2
Asia
6132
6.8
196
6.7
590
8.2
18,955
10.4
Other
1727
1.9
57
2.0
180
2.5
4007
2.2
Smoking 3 months prior to pregnancy
9583
10.5
229
7.7
751
10.3
28,659
15.6
<0.001
Smoking at first ANCk visit
3445
3.8
76
2.6
347
4.8
12,144
6.6
<0.001
Smoking at 32 weeks of gestation
2527
2.8
48
1.6
289
4.0
9238
5.0
<0.001
Use of snuff 3 month prior to pregnancy
2493
2.7
64
2.2
213
2.9
7268
3.9
<0.001
Use of snuff at first ANC visit
646
0.7
22
0.7
85
1.2
2134
1.2
<0.001
Use of snuff at 32 weeks of gestation
385
0.4
13
0.4
41
0.6
1303
0.7
<0.001
Alcohol screening (AUDIT)l
81,686
90.3
2568
88.4
6313
86.3
158,335
87.0
<0.001
AUDIT-scorem
Mean (SD)
2.34 (1.96
2.26 (1.74)
2.12 (1.90
2.11 (2.32)
Min-max
0–38
0–18
0–29
0–40
Median (IQR)h
2.00 (2)
2.00 (2)
2.00 (2)
2.00 (3)
≤ 5p
76,786
94.5
2462
96.3
6012
95.7
82,067
94.6
<0.001
≥ 6p
4485
5.5
95
3.7
270
4.3
4703
5.4
Self-rated health prior to pregnancy
Very good
25,990
33.0
834
32.5
1887
30.5
44,643
28.3
<0.001
Good
44,563
56.6
1433
55.9
3489
56.5
93,611
59.4
Neither good nor poor
5877
7.5
217
8.5
583
9.4
14,047
8.9
Poor
1817
2.3
64
2.5
187
3.0
4334
2.7
Very poor
440
0.6
15
0.6
34
0.6
1056
0.7
Counselling due to fear of childbirth
8900
9.7
324
10.9
745
10.2
12,023
6.5
<0.001
Treatment of psychiatric disorder
6002
6.5
185
6.3
533
7.3
11,275
6.1
<0.001
Gestational age (days)
Mean (SD)g
278.0 (13.7)
276.6 (15.0)
276.5 (15.4)
278.0 (13.8)
0.326
Min-max
154–301
158–300
157–301
154–301
Median (IQR)h
280.0 (13.0)
279.0 (13.0)
279 (15.0)
280 (13.00)
Mode of delivery
Vaginal
6885
73.9
2079
70.2
5133
70.3
145,486
78.5
<0.001
Instrumental
6376
6.9
163
5.5
392
5.4
12,468
6.7
Caesarean section
17,574
19.1
721
24.3
1772
24.3
27,405
14.8
Caesarean section (CS) n
Elective CSn
8650
49.3
297
58.7
916
51.7
10,700
39.1
<0.001
Emergency CSn
8893
50.7
422
41.3
855
48.3
16,639
60.9
Birth weight (grams)o
Mean (SD)g
3549 (552)
3531 (585)
3510 (620)
3539 (557)
0.001
Min-max
310–6270
400–5710
370–5776
300–6640
Median (IQR)h
3560 (665)
3555 (686)
3548 (706)
3545 (680)
aCUB = Combined Ultrasound and Biochemical test
bCVS = Chorionic Villus Sampling
cAC = Amniocentesis
dAll others = Pregnant women who did not undergo any of the prenatal diagnostic procedures CUB, CVS or AC
eTest of difference between the two groups; pregnant women who underwent CUB and “all others” using t-test for continuous variables and Pearson’s Chi-Square test for categorical variables
fMaternal age at delivery
gSD = Standard Deviation
hIQR = Interquartile Range
i Other Nordic countries includes Norway, Finland, Iceland and Denmark
j The Nordic countries excluded
kAntenatal care
l Assessment of use of alcohol prior to pregnancy with screening instrument Alcohol Use Disorder Identification Test (AUDIT)
mAUDIT score range from 0 to 40
nCaesarean section
oSingletons exclusively included in analysis
Pregnant women who underwent CUB, CVS or AC reported being employed in significantly higher proportions (80.3, 87.0 and 77.8%, respectively), vs. 65% for women who had not undergone CUB, CVS or AC (p-value <0.001).
Information on country of birth was available for almost all participants (Table 2). Sweden as country of birth was reported by 79.4% of all pregnant women (Table 2). Pregnant women who had undergone CUB, CVS and AC, reported Sweden as country of birth in 84.5, 85.4 and 81.8% of the cases, respectively. The corresponding figure for pregnant women who had not been exposed to CUB, CVS or AC was 76.7%. That means that a significantly lower proportion of women who were born outside of Sweden was examined by CUB, CVS and AC (p-value <0.001) (Table 4).
Anzeige
A proportion of 35.2% of women with a Nordic origin were exposed to CUB. The corresponding figures for women born in Europe, Africa, and Asia were 31.5, 11.8 and 24.5% respectively. Smoking was reported to a significantly lower degree (p-value <0.001) at all three check points, i.e. 3 months prior to pregnancy, at first antenatal visit and at gestational age of 32 weeks, by women who had undergone CUB compared to those who had not been examined by CUB, CVS or AC, i.e. “all others” (Table 4).
Women who had been examined by CUB, CVS or AC reported having received counselling due to fear of childbirth in 9.7, 10.9 and 10.2% of cases, respectively. Women who had not been examined with CUB, CVS or AC reported having received counselling due to fear of childbirth in a significantly lower proportion (6.5%; p-value <0.001) (Table 4). There was no significantly difference between the group of women who had undergone CUB and women included in the group “all others” regarding gestational age at delivery (Table 4).
The overall proportion of CS in the study group was 16.4% (Table 2). For pregnant women who had undergone CUB, CVS and AC, the prevalence of CS were 19.1, 24.3 and 24.3%, respectively, and the corresponding figure for “all others” was significantly lower 14.8% (p-value <0.001) (Table 4).
If caesarean section had been performed, the proportions of those who underwent elective CS or emergency CS were as follows; women who had undergone CUB, 49.3% and 50.7%, women who had undergone AC, 51.7% and 48.3% and women who had undergone CVS, 58.7% and 41.3% respectively. The corresponding figures for women included in the group “all others” were 39.1% (elective CS) and 60.9% (emergency CS), (Table 4).
Anzeige
The odds ratio for undergoing CUB at a maternal age of 35 years or older, was highly increased (4.36; 95% CI 4.28–4.45). When the OR was adjusted for educational level the OR still remained increased (4.00; 95% CI 3.91–4.08). Table 5 presents univariate and multivariable logistic regression analyses for the uptake of CUB in relation to specific background characteristics. Educational level demonstrated a strong impact on the likelihood of being examined with a CUB test. Women under the age of 35 years, having attended university, had an Adjusted Odds Ratio (AOR) of 1.79 (95% Adjusted Confidence Interval (ACI) 1.75–1.83) for undergoing CUB (Table 5). The corresponding figure for women 35 years or older who had attended university was AOR 1.53 (95% ACI 1.47–1.61) (Table 5). Pregnant women with a BMI of 25 or more, women who were unemployed, women who were born outside of Sweden and women who reported ongoing smoking at their first visit at ANC demonstrated a decreased AOR for undergoing CUB (Table 5). Women under the age of 35 years who had received counselling due to fear of childbirth had an increased AOR of 1.38 (95% ACI 1.32–1.45) for undergoing CUB, whereas the corresponding figure for women 35 years or older was somewhat lower (1.27; 95% ACI 1.18–1.28). Women in both age groups, having received treatment for psychiatric disorder, demonstrated a small but statistically significant increased AOR for undergoing CUB (Table 5).
Table 5
Univariate and multivariable logistic regression analysis for undergoing Combined Ultrasound and Biochemical test (CUB) in relation to maternal age divided into two age groups and to specified background characteristics
Maternal age <35 years
Maternal age ≥35 years
Variable
Crude OR
CI 95%
Adjusted OR a
Adjusted CI 95%
Crude OR
CI 95%
Adjusted ORa
Adjusted CI 95%
Educational level
Elementary school, high school
1
1
1
1
University level
2.03
1.98–2.07
1.79
1.75–1.83
1.86
1.79–1.93
1.53
1.47–1.61
Body mass index (kg/m2)
< 25
1
1
1
1
≥ 25
0.75
0.73–0.76
0.84
0.82–0.86
0.65
0.63–0.68
0.76
0.73–0.80
Main occupation
Employed, student, parental leave
1
1
1
1
Unemployed, sick leave, other
0.51
0.49–0.53
0.70
0.67–0.74
0.46
0.44–0.49
0.64
0.59–0.70
Country of birth
Sweden
1
1
1
1
Other
0.60
0.58–0.61
0.76
0.74–0.79
0.55
0.53–0.57
0.74
0.70–0.78
Smoking at first visit at antenatal care
No
1
1
1
1
Yes
0.62
0.59–0.65
0.87
0.82–0.92
0.59
0.54–0.64
0.74
0.66–0.84
Self-rated health prior to pregnancy
Very good and good
1
1
1
1
Poor and very poor
0.85
0.74–0.98
0.96
0.82–1.13
0.62
0.50–0.76
0.80
0.63–1.02
Counseling due to fear of childbirth
No
1
1
1
1
Yes
1.41
1.36–1.46
1.38
1.32–1.45
1.40
1.32–1.48
1.27
1.18–1.28
Treatment of psychiatric disorder
No
1
1
1
1
Yes
1.03
0.99–1.08
1.15
1.09–1.22
1.04
0.98–1.11
1.16
1.05–1.28
aAdjusted for all other variables included in the analysis
Maternal age demonstrated the highest impact on the likelihood of undergoing invasive prenatal diagnosis (AC: COR 7.97; 95% CI 7.58–8.38, and CVS: COR 6.72; 95% CI 6.23–7.24). Further, women who had achieved an educational level corresponding to university had an increased likelihood of undergoing AC (COR 1.54; 95% CI 1.46–1.62) and CVS (2.68; 95% CI 2.45–2.92), in relation to women with a lower educational level. Their increased odds ratios for AC and CVS remained unchanged after adjusting for maternal age (AC: AOR 1.54; 95% ACI 1.46–1.62, and CVS: AOR 2.68; 95% ACI 2.45–2.92). Additionally, pregnant women who had received counselling due to fear of childbirth demonstrated a higher likelihood of undergoing AC or CVS (AC: COR 1.39; 95% CI 1.29–1.50, and CVS: COR 1.49; 95% CI 1.32–1.67), in comparison to those who had not been counselled for fear of childbirth. When adjusted for age and educational level the likelihood remained significantly increased for AC (AOR 1.14; 95% ACI 1.04–1.24) and CVS (AOR 1.15; 95% ACI 1.01–1.31).
A decreased likelihood of undergoing AC or CVS was demonstrated for pregnant women who reported country of birth outside of Sweden, compared to those who were born in Sweden (AC: COR 0.85; 95% CI 0.80–0.91, and CVS: COR 0.66; 95% CI 0.59–0.73). When adjusted for age and educational level the odds ratios remained significantly decreased (AC: AOR 0.88; 95% ACI 0.82–0.95, and CVS: AOR 0.81; 95% ACI 0.72–0.91).
Discussion
The aim of this study was to make a national survey on guidelines concerning offers on prenatal diagnosis in Sweden. Further, we aimed to investigate background characteristics and pregnancy outcomes in relation to the uptake of different prenatal diagnostic methods. During the study period of 2011 to 2013 in Sweden there was an absence of a national consensus regarding guidelines on offers of prenatal diagnosis. The Swedish law states that all pregnant women should be offered information on prenatal diagnosis [4]. However, the opportunities of undergoing different prenatal screening or diagnostic procedures were not equally distributed during the time period under study among Swedish counties. On a national level, the uptake of the second trimester scan, CVS and AC was relatively stable during the study period whereas the uptake of CUB increased from 29.8%, 2011 to 36.2% in 2013. A Danish study performed 2008, shows a sharp decline in the uptake of invasive prenatal diagnosis when implementing screening programs offering CUB [12]. A study exploring determinants of participating in the first trimester combined test shows that advanced maternal age is the primary indication and has the highest impact for uptake of CUB [13]. As expected, our study displayed increased maternal age as the factor with the highest impact on whether pregnant women were examined with a CUB test. Further, educational level and country of birth were also significant background factors for women’s utilization of CUB. A study investigating effects of knowledge, education and experience of first trimester screening shows that women with a university education have a higher degree of knowledge of first trimester screening [14]. A Swedish study from 2012, exploring the effects of a public video aiming for an informed choice in relation to exposure to second trimester ultrasound, shows that women with college or university educational level were more likely to make an informed choice [15]. In our study women who had achieved a university education were more likely to undergo the CUB test, and the effect of educational level was more pronounced for women younger than 35 years of age in comparison to women 35 years or older. It is likely that higher education implicates a higher ability to gain, interpret and use information on different health offers, health promotion or risk factors. Ethnicity in relation to uptake of prenatal diagnosis has been investigated in several previous studies [16‐18]. A register-based study in the Netherlands shows that women with a North-African ethnic origin have the lowest participation rate in prenatal screening for Down’s syndrome, only 8% participation rate compared to the higher rate for women with a Dutch (28%) or other Western origin (33%) [16]. Also, an Australian study demonstrates that ethnicity is strongly associated with the uptake of prenatal diagnosis [17]. Women with Caucasian ethnicity were more likely to utilize prenatal diagnosis than other women. The proportion of screening was significantly lower for women of aboriginal origin [17]. It has been reported that Asian women living in the United Kingdom are less likely than white women to be offered and undergo screening for Down’s syndrome [18]. Our study showed that women, 35 years or older and with a country of birth outside of Sweden presented a 45% decreased likelihood of undergoing CUB. The lowest uptake was demonstrated by women born in Africa. Lower uptake of prenatal diagnosis in minority ethnic groups and among socioeconomically disadvantaged women, has been shown to reflect lower rates of informed choice rather than more negative attitudes towards screening [19]. Our study was not able to investigate possible effects of language barriers for pregnant women with no or little skills in Swedish to make an informed choice. In our study, country of birth had a somewhat higher impact on utilization of CUB than on utilization of CVS or AC. This might be explained by the difficulty to inform about risk evaluation and by providing pregnant women with correct information thus facilitating for making an informed choice. Pregnant women who had received counselling due to fear of childbirth utilized prenatal diagnosis to a higher degree than other women. To our knowledge, association between fear of childbirth and utilization of prenatal diagnosis has not previously been investigated. It seems likely that a higher level of anxiety could be manifested both as fear of childbirth as well as an increased concern related to the pregnancy resulting in increased number of medical procedures.
Anzeige
During the study period, the SPR did not include data on Non-Invasive Prenatal testing (NIPT). This method is based on analysis of cell-free fetal DNA in maternal blood [20]. In Sweden, NIPT is currently offered only in a few counties and strictly on specific indications. However, this method is accessible on the pregnant woman’s own expense.
Methodological considerations
During the study period, the Swedish Pregnancy Register demonstrated a satisfactory coverage of pregnancies and moreover, all counties of Sweden are represented in the SPR. Data in the Swedish Medical Birth Register for 2012, demonstrate a mean maternal age, for primiparous women, of 28.4 years, and a mean BMI (all pregnant women) of 24.8 [21], and the corresponding figures in the SPR 2012, were 28.8 (years) and 24.8 (BMI), respectively. These results indicate that data in SPR are very similar to data in the Swedish Medical Register that is a compulsory health register demonstrating an almost complete coverage of pregnant women in Sweden. The validity of data in the SPR has previously been investigated and most variables demonstrate good internal validity and coverage [3]. However, the validity check also revealed that the absolute numbers of invasive prenatal diagnosis such as CVS and AC are underestimated [3]. The SPR does not include information on pregnancies with a gestational age of less than 23 weeks of gestation. Therefore, an additional limitation of this study was that different frequencies of prenatal diagnosis could not be established for this category of pregnant women that may have terminated their pregnancies.
Conclusions
Offers of prenatal diagnostic procedures varied considerably between counties in Sweden. Maternal age, as expected, demonstrated the strongest association with the uptake of CUB, AC and CVS. Further, educational level was a strong predictor of uptake of prenatal diagnosis. These circumstances result in an unequal access of prenatal diagnostic tests for pregnant women. The intentions of the Swedish Health and Medical Services Act stating that equal care should be provided for all, was thus not fulfilled. Expecting couples should be offered the same opportunities on prenatal diagnosis nationally.
Acknowledgements
We would like to thank all pregnant women for sharing their information to the Swedish Pregnancy Register and midwives in antenatal care for their contribution to the data collection. We also thank the Swedish Pregnancy Register for providing data access.
Funding
This study was supported by grants from Umeå University, Sweden, and the County Council of Västerbotten, Sweden.
Availability of data and materials
Restrictions apply to the availability of these data, which we used under licence for the current study and so are not publicly available. Data are however available from the authors upon reasonable request and with permission from the Swedish Pregnancy Register.
Authors’ contributions
KP, IM, ML, and MP designed the study. KP, IM and ML performed the analyses. The interpretation of results, comments on the manuscript draft were done by all authors. All authors read and approved the final version of the paper.
Competing interests
The authors declare that they have no competing interests.
Consent for publication
Not applicable.
Ethics approval and consent to participate
The Regional Ethical Board at Umeå University (Umeå, Sweden) approved the study (Dno 2012-407-31 M and 2014-152-32 M).
At registration in antenatal care, patients are to be informed about the Swedish Pregnancy Register and that register data may be used for research purposes. By approving to participate in the register patients subsequently give their consent to participate in research studies and no individual consent is required.
Open AccessThis article is distributed under the terms of the Creative Commons Attribution 4.0 International License (http://creativecommons.org/licenses/by/4.0/), which permits unrestricted use, distribution, and reproduction in any medium, provided you give appropriate credit to the original author(s) and the source, provide a link to the Creative Commons license, and indicate if changes were made. The Creative Commons Public Domain Dedication waiver (http://creativecommons.org/publicdomain/zero/1.0/) applies to the data made available in this article, unless otherwise stated.