The birth weight and gestational age at birth are two important variables that define neonatal morbidity and mortality. In developed countries, chronic maternal diseases like hypertension, diabetes mellitus, renal disease or collagen vascular disease is the most common cause of intrauterine growth restriction (IUGR). Maternal nutrition, pregnancy induced hypertension, chronic maternal infections, and other infections such as cytomegalovirus, parvovirus, rubella and malaria are the other causes of IUGR. The present study examines the secular trend of Small for Gestational Age (SGA) over 15 years and risk factors for SGA from a referral hospital in India.
Methods
Data from 1996 to 2010 was obtained from the labour room register. A rotational sampling scheme was used i.e. 12 months of the year were divided into 4 quarters. Taking into consideration all deliveries that met the inclusion criteria, babies whose birth weights were less than 10th percentile of the cut off values specific for gestational ages, were categorized as SGA. Only deliveries of live births that occurred between 22 and 42 weeks of pregnancy were considered in this study. Besides bivariate analyses, multivariable logistic regression analysis was done. Nagelkerke R2 statistics and Hosmer and Lemeshow chi-square statistics were used as goodness of fit statistics.
Results
Based on the data from 36,674 deliveries, the incidence of SGA was 11.4% in 1996 and 8.4% in 2010. Women who had multiple pregnancies had the higher odds of having SGA babies, 2.8 (2.3-3.3) times. The women with hypertensive disease had 1.8 (1.5-1.9) times higher odds of having SGA. Underweight women had 1.7 (1.3 - 2.1) times and anaemic mothers had 1.29 (1.01 - 1.6) times higher odds. The mothers who had cardiac disease were 1.4 (1.01 - 2.0) times at higher odds for SGA. In teenage pregnancies, the odds of SGA was 1.3 (1.1 - 1.5) times higher than mothers in the age group 20 to 35 years.
Conclusions
There is a significant reduction in the incidence of SGA by 26% over 15 years. The women with the above modifiable risk factors need to be identified early and provided with health education on optimal birth weight.
Hinweise
Competing interests
The authors declare that they have no competing interests.
Authors’ contributions
TS: Involved in data abstraction supervision, quality control assurance. She was also involved in data analyses and interpretation. She also involved in literature review and drafting background section. BY: Involved in developing data entry system in EPIINFO and involved data validation part. He also involved in data analyses and verified the analytical codes. L.J: Involved in phrasing the research questions. He involved in the verification of analytical results, which were done by TS and BY. He involved in drafting the methods section. He also participated in the interpretation of results section along with RJ. RV: Involved in drafting the background section alone with TS. She was involved in the literature review and guiding the Biostatisticians in analyses. She was also involved in writing the discussion section. RJ: Provided leadership in phrasing the research question. Involved in designing the methods of data abstraction and verified the results. Drafted the Discussion section, reviewed and approved the overall manuscript. All authors read and approved the final manuscript.
Background
The birth weight and the gestational age at birth are two important variables which define neonatal morbidity and mortality [1]. In developing countries, the majority of low birth weight children have intra- uterine growth restriction rather than being born preterm [2].
Of 135 million children born in low income and middle income countries (LMIC) in 2010, an estimated 29.7 million were born full term but small for gestational age (SGA). A little over ten million were born preterm and appropriate for gestational age, and 2.8 million were born preterm and SGA [3]. The prevalence of SGA was 8.3% [4]. Chronic maternal vascular disease due to hypertension, diabetes mellitus, renal disease, or collagen vascular disease was the most common cause of IUGR in developed countries. Less frequently, IUGR may be due to first or second trimester foetal infection, including cytomegalovirus, malaria, parvovirus, and rubella. The majority of foetal aetiologies lead to early gestation symmetric IUGR. Hypercoagulable maternal conditions such as thrombophilia and antiphospholipid antibody syndrome also inhibit growth either by placental thrombosis formation or by secondary effects of maternal disease. Persistent maternal hypoxia due to high altitude, severe pulmonary or cardiac disease, and/or severe chronic anaemia limits oxygen delivery to the foetus and attenuates foetal growth [5-7].
Anzeige
In addition to short term medical morbidities that affect infants with Preterm births (PTB) and SGA, long term consequences involving neurological, cardiovascular and metabolic conditions have been found to persist into adolescence and adulthood [8,9]. These health consequences result in rising societal costs incurred through increased health care requirements and special educational needs [10].
It is known that infants born to Asian Indian mothers weigh less on average than American or European mothers. Though the Asian Indian mothers had lowest percentage of risk factors for SGA such as teenage deliveries and high parity for age, still the rate of SGA was higher amongst Asian Indian mothers. The different patterns of growth observed among Asian-Indian infants may be attributable to a different body habits and may be due genetic [11,12]. The present study examines the temporal trend of SGA over 15 years and risk factors for SGA from a referral hospital in India.
Methods
Ethical approval
The study was approved by the Institutional Review Board of Christian Medical College, Vellore [IRB Min. No. 7109 dated 10.03.2010].
Study site and population
The Christian Medical College and Hospital (CMCH), Vellore in the state of Tamil Nadu, India caters to 47,110 outpatients and 15,662 inpatients per year. The Department of Obstetrics and Gynaecology on an average delivered 20 babies per day in 1996 and 40 babies per day in 2010. There were an estimated 164,250 deliveries from 1996 to 2010. Women of different socioeconomic status attend this institution for delivery including private patients of high socioeconomic status and low and middle income women who constitute the bulk of the clientele. In general women do not smoke although passive smoking from exposure to husband’s smoking or from cooking on open fire is common. Data on smoking or on method of cooking was not routinely collected. Pregnant women with HIV and STI get free treatment in the Government Hospitals around Vellore, and hence they very infrequently attend CMCH and this data has also not been included in this analysis.
Anzeige
Sampling
To study the trends, distribution of different outcomes and the risk factors over the 15 year period and with limited capacity for data extraction and entry we opted for rotational sampling [13]. Briefly this method of sampling involves sequential months from the four quarters of a one year period. In 1996 data from each quarter from the months of January, April, July and October were retrieved and entered. In 1997 the respective months were February, May, August and November. This rotation of months in each quarter was continued for the 15 year period.
There was no computerization of the antenatal data prior to 2000 and the original records have been destroyed. The Labour Room Register data has been preserved and this is from where the present paper has been compiled. The antenatal assignment of GA by LMP or by US was not available from the Labour Room Register. Hence it was impossible to use LMP or US as a factor in the analysis.
Antenatal assessment of gestational age
If menstrual cycles were regular and abdominal examination findings correlated then the last menstrual period (LMP) was taken as the best estimate of gestational age. If menstrual cycles were irregular or the LMP was unknown a dating scan at the first antenatal visit for women in first and second trimester was performed. Hadlocks formula was used for estimation of gestational age. CRL measurement was used up to 13 weeks of gestation. From 14 weeks gestation onwards, the average of the BPD, HC, FL and AC measurements were used [14]. Some patients included in the cohort were treated with in vitro fertilization and their gestation was calculated by the days since oocyte retrieval or co-incubation and adding 14 days [15].
Dubowitz assessment of gestational age at birth
Post natal assessment of gestational by the Dubowitz assessment since 1996 the Dubowitz gestational age assessment was done on every new born admitted to the neonatal nursery for SGA or prematurity within 24 hours of birth by trained Paediatrician or Paediatric Resident. Over the period the same cadre of staff have been responsible for conducting the Dubowitz assessment. Irrespective of the method of dating antenatally the assignment of preterm or SGA was reassigned based on the Dubowitz gestational age assessment. All neonates admitted into the Nursery were directly overseen by a Professor of Neonatology at least twice a day to maintain good standard of care [16].
Ultrasound (US)
Ultrasound for estimating foetal weight was done only when there was a suspicion of SGA clinically by symphysiofundal height measurement, or if the woman had risk factors for SGA such as previous SGA, heart disease, hypertensive disease, renal disease, collagen vascular disease. When performing ultrasound scan for suspected SGA the amniotic fluid index and the Doppler wave form of the umbilical artery were assessed. Once SGA was suspected, all these women had intensive foetal surveillance by modified Biophysical profile [17] and doppler analysis of the umbilical artery twice a week or more frequently if required. If there was foetal compromise at any time or if the gestational age was 37 weeks a planned induction or imminent delivery by caesarean section was planned.
Inclusion and exclusion criterion
Deliveries of live births with a gestational age between 22 and 42 weeks were included irrespective of whether the women conceived spontaneously, by ovulation induction or IVF [18].
Antenatal care procedures
All women had Haemoglobin (Hb) estimation by automated cell counter using a Coulter machine, at booking (usually in the first or early second trimester). This was repeated in the third trimester around 32 weeks. Unbooked women had Hb estimation at admission into labour room at the time of delivery. All women booked for their pregnancy had iron and calcium supplements commencing after the first trimester.
During the period 1996 to 2010, risk based screening with 100 grams; 3 hour oral Glucose tolerance test was followed. Risk factors included Asian ethnicity, increased maternal age, family history of Diabetes mellitus, obesity, multiple pregnancies, persistent glucosuria during pregnancy, repeated UTI in pregnancy [19].
Anzeige
Definitions
Literacy
Standard of education was grouped separately for the woman and for her husband into: illiterate including those who were unable to read or write; higher secondary included those who had a school education of 12 years; and college and above for those with higher education.
Gestational hypertension
Gestational hypertension was grouped into hypertensive disease of pregnancy which included women who had blood pressure (B.P.) greater or equal to 140/90 mmHg on 2 occasions, 6 hours apart after 20 weeks gestation. Chronic hypertension if the diagnosis of hypertension predated the pregnancy, or had hypertension diagnosed prior to 20 weeks of gestation.
Cardiac disease
Cardiac Disease included all pregnant women with rheumatic or congenital heart disease diagnosed by the Cardiologist, based on echocardiogram and/or other relevant tests.
Body mass index (BMI)
Body mass index (BMI) was calculated from weigh at delivery using the standard formula: [weight (kg)/ height (m) 2] formula. Women with a BMI below18.5 kg/m2 were classified as underweight, normal weight for BMI of 18.5 – 24.9 kg/m2, overweight 25–29.9 kg/m2 and obese for BMI > = 30 kg/m2 [20].
Anaemia
Anaemic women were those with a Haemoglobin (Hb) <11 g/dL based on World health Organization (WHO) definition of anaemia [21].
Diabetes
Diabetes included women with diabetes predating their pregnancy and those with a positive 100 gm 3 hour oral glucose tolerance test with cut-offs at baseline, one, two and three hours following glucose ingestion.
Oligohydramnios
Oligohydramnios was an amniotic fluid index of <5 cms.
Birth weight
All babies were weighed within an hour of delivery using 111 Braun electronic weighing scale. The scale is calibrated regularly by the Engineering department, so as to maintain accuracy of the scale. The accuracy of the scale is ± 0.5 g.
Pre and post term
Delivery at a gestational age of less than 37 weeks was classified as preterm and after 42 weeks as post term by the gestational age established from the Dubowitz assessment [16].
Small for gestational age (SGA)
SGA was assigned when a new born had a birth weight lower than the 10th centile for gestational age week.
Appropriate for gestational age (AGA)
AGA was assigned when a new born had a birth weight between 10th and 90th centile for gestational age week.
Statistical methods
The association between risk variables and SGA were tested using Chi-square test with Yates correction. The variables which were significant at P < 0.25, at Bivariate analysis were considered for stepwise logistic regression analysis. Nagelkerke R2 statistics and Hosmer and Lemeshow chi- square statistics were used as goodness of fit statistics. P value < = 0.05 was considered for statistically significance. The results were presented with OR and 95% CI. SPSS 16.0 was used to analyze data.
Results
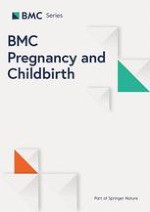
In total, there were 41,055 live births. Of these, 36,674 deliveries were registered through the outpatient clinics and 3867 SGA babies were observed during this 15 year period in this group. The mean (sd, min and max) of the mothers was 25.2 (4.2, 14 and 49) years. Of these mothers 5.9% were teenage mothers. The mean (sd, min and max) height, weight and BMI was 155.4 cm (6.1, 120 and 189); 62.9 kg (11.4, 30, 140) and 26 (4.3, 9.0, 57.4) respectively. While women with anaemia constituted 2%, the proportion of women with severe anaemia was very low. The prevalence of hypertension and diabetes was 7.8% and 6.6% respectively. Of these deliveries 13.1% was preterm deliveries. The mean (SD), median (IQR) of birth weight and gestational weeks were 2.9 kg (0.59), 2.9 (2.6, 3.2) kg and 38 (2.4), 39 (38, 40) respectively. The incidence of SGA was about 11.5% (11% - 12%) from 1996 until 2003 and reduced to 9.8% (9.4% - 10.2%) from 2004. A declining trend in the prevalence of SGA from 2004 was thus observed. There were 18,795 (51%) male babies and 17,810 (49%) female babies in the sample. For 70 babies information about their gender was missing. The incidence of SGA in each year for male and female babies with different risk variables is presented in Table 1. The results show no significant difference in the incidence of SGA between male and female babies. Of the deliveries, 13.1%, 86.2% and 0.7% were pre term, full-term and post term deliveries respectively. The diagrammatic displays of the incidence of SGA based on the presence of risk factors are presented in Figures 1 and 2.
Table 1
Incidence of Small for Gestational Age from year 1996 – 2010 according to gender and risk factors
Birth year
Small for gestational age
Total delivery studied
Overall
Male
Female
Teenage (<=19)
Cardiac disease
Anaemia in pregnancy
Obesity
Diabetes
N
%
n
%
n
%
n
%
n
%
n
%
n
%
n
%
1996
1661
189
11.4
91
10.9
98
11.8
16
14.3
1
8.3
10
12.8
8
6.2
4
5.3
1997
1745
209
12.0
102
11.4
107
12.7
21
16.3
2
14.3
6
16.2
8
4.7
9
9.9
1998
1835
215
11.7
106
11.0
109
12.5
14
12.3
2
9.5
6
10.5
17
10.0
9
5.7
1999
2036
271
13.3
154
14.8
117
11.8
22
16.2
0
0.0
10
14.7
15
9.0
14
8.2
2000
1934
177
9.2
99
9.6
78
8.7
16
10.3
1
6.7
1
6.7
14
6.3
11
5.6
2001
1868
195
10.4
85
9.1
110
11.8
19
15.3
3
27.3
8
15.1
15
5.3
13
8.6
2002
2408
277
11.5
146
11.7
131
11.4
31
19.1
4
16.0
4
10.8
22
6.5
14
6.8
2003
2673
325
12.2
177
12.6
148
11.7
30
14.1
2
14.3
10
17.9
27
8.3
5
4.5
2004
2745
268
9.8
130
9.2
138
10.4
27
14.1
3
11.5
5
14.7
27
6.5
7
5.8
2005
2366
249
10.5
136
11.5
113
9.6
22
14.0
2
9.1
4
11.4
21
5.7
4
2.8
2006
2521
273
10.8
141
11.1
132
9.6
18
14.4
5
18.5
3
15.8
34
6.7
4
3.6
2007
2909
288
9.9
143
9.8
145
10.1
15
11.0
8
20.5
2
6.9
32
5.8
14
8.9
2008
2830
292
10.3
155
11.1
137
9.6
24
19.2
1
5.3
4
12.9
49
8.6
9
4.4
2009
3260
311
9.5
155
9.1
156
10.1
23
15.4
8
17.4
11
19.3
36
5.5
13
5.5
2010
3883
328
8.4
166
8.3
162
8.6
12
8.8
3
15.8
15
12.6
48
6.0
13
4.4
Total
36674
3867
1986
1881
310
45
99
373
143
Figure 1
Incidence of Small for Gestational Age (SGA) by infant’s gender, maternal age and maternal anaemia from 1996 to 2010. a: Incidence of Small for Gestational Age (SGA) by overall and by gender of infant. b: Incidence of Small for Gestational Age (SGA) based on maternal age groups. c: Incidence of Small for Gestational Age (SGA) by maternal anaemia status.
Figure 2
Incidence of Small for Gestational Age (SGA) by diabetes, cardiac disease and BMI at delivery from 1996 to 2010. a: Incidence of Small for Gestational Age (SGA) in mothers by diabetes status. b: Incidence of Small for Gestational Age (SGA) in mothers by cardiac disease status. c: Incidence of Small for Gestational Age (SGA) in mothers by BMI categories.
×
×
Demographic risk factors
The distribution of risk variables for SGA and the results of multivariable analysis are presented in Table 2. Teenaged mothers (< =19 years) were 1.31 (1.12 -1.54) times at higher odds for having SGA babies as compared to mothers who were between 25–29 years of age (p < 0.001). Women whose husbands worked as unskilled labourers were 1.10 (1.01-1.22) times at higher odds for SGA as compared to those whose husbands were professionals (p < 0.04). Women whose husbands were involved in agricultural work or were businessmen had 0.85 (0.75 - 0.95) times significantly lower odds for SGA compared to those whose husbands were professional (p < 0.005). Further, women whose husbands were illiterate (OR = 1.39, 1.11 – 1.73) and those whose husbands had only completed 12 years of schooling were (OR = 1.13, 1.01 – 1.26) also at higher odds for having SGA babies as compared to those women whose husbands had completed graduation and above. In addition, women who were illiterate or who had only completed 12 years of schooling were 1.41 (1.12 - 1.77) and 1.25 (1.11 – 1.40) times at higher odds for having SGA babies respectively as compared to women who had completed graduation and above (p < 0.001).
Table 2
Risk factors for small for gestational age based on bivariate (unadjusted) and multivariate (adjusted) analyses
Risk factor variables
Unadjusted analysis (N = 36674)
Adjusted analysis
SGA
p value
No
Yes
OR
95% CI
p value
n
%
n
%
Gender:
Male
16809
89.4
1986
10.6
1.00
Female
15928
89.4
1882
10.6
Age in years:
25–29
12427
90.8
1252
9.2
<0.001
1.00
<=19
1855
85.7
310
14.3
1.31
1.12 – 1.54
0.001
20–24
13187
88.4
1733
11.6
1.09
0.99 – 1.19
0.07
30–34
4232
90.4
447
9.6
1.12
0.99 – 1.28
0.08
> = 35
990
89.9
111
10.1
1.11
0.86– 1.42
0.43
Husband Occupation:
Professional
15786
90.7
1622
9.3
<0.001
1.00
Agriculture/Business
5681
91.3
541
8.7
0.85
0.75 – 0.95
0.005
Unskilled/Others
10419
86.8
1583
13.2
1.11
1.01 – 1.22
0.04
Husband Education:
Degree and Above
12550
92.2
1069
7.8
<0.001
1.00
Higher Secondary
16314
88.2
2189
11.8
1.13
1.01 – 1.26
0.03
Illiterate
1224
83.9
235
16.1
1.39
1.11 – 1.73
0.004
Mother Occupation:
Professional
2765
92.9
211
7.1
<0.001
Housewife
29352
89.1
3578
10.9
Unskilled/Others
272
90.4
29
9.6
Mother Education:
Degree and Above
10849
92.5
882
7.5
<0.001
1.00
Higher Secondary
18249
88.2
2432
11.8
1.25
1.11 – 1.40
<0.001
Illiterate
1200
84.6
218
15.4
1.41
1.12 – 1.77
0.003
Hypertension:
No
29376
90.0
3265
10.0
<0.001
1.00
Yes
3431
85.1
603
14.9
1.77
1.58 – 1.98
<0.001
Multiple Pregnancy:
No
31868
89.9
3593
10.1
<0.001
1.00
Yes
939
77.3
275
22.7
2.77
2.35 – 3.28
<0.001
Cardiac disease:
No
32521
89.5
3823
10.5
0.07
1.00
Yes
286
86.4
45
13.6
1.42
1.01 – 1.99
0.04
Oligohydramnios:
No
32695
89.5
3822
10.5
<0.001
1.00
Yes
112
70.9
46
29.1
3.67
2.49– 5.40
<0.001
Anaemia in pregnancy:
No
32181
89.5
3769
10.5
0.006
1.00
Yes
626
86.3
99
13.7
1.29
1.01 – 1.65
0.04
Miscarriage:
No
26972
89.1
3296
10.9
<0.001
1.00
Yes
5835
91.1
572
8.9
0.83
0.74 – 0.92
0.001
BMI:
Normal weight
11835
86.7
1808
13.3
<0.001
1.00
Underweight
506
79.1
134
20.9
1.71
1.38 – 2.13
<0.001
Overweight
11192
91.3
1063
8.7
0.64
0.58 – 0.70
<0.001
Obesity
5301
93.4
373
6.6
0.46
0.40 – 0.52
<0.001
Obstetric rick factors
The odds of SGA in babies was 1.77 (1.58 – 1.98) times higher for women whose pregnancies were complicated by hypertensive disorders as compared with those who did not have hypertension (p < 0.001). The finding of Oligohydramnios was higher when the neonate was SGA by 3.67 (2.49-5.4) times as compared with women whose babies were appropriate for gestational age (p <0.001).
Anzeige
In women who had multiple pregnancies the odds of having an SGA neonate was 2.77 (2.35 – 3.28) times higher than women who had only a single pregnancy (p < 0.001). Similarly, women who had cardiac disease were 1.42 (1.01 – 1.99) times at higher odds for SGA babies as compared to women who did not have cardiac disease (p = 0.04). The odds of having an SGA neonate was 1.29 (1.01 – 1.65) times higher for women who were anaemic during their pregnancy compared to those who were not anaemic (p = 0.04). Underweight women were 1.71 (1.38 – 2.13) times at higher odds for having SGA babies as compared to those women who were of normal weight (p < 0.001). Lastly, overweight 0.64 (0.58 - 0.70) and obese women had 0.46 (0.74 - 0.92) times lower odds for SGA as compared to women with normal weight (p < 0.001). Women with a previous history of miscarriage had 0.83 (0.74 - 0.92) times significantly lower odds for having SGA babies (p < 0.01).
Discussion
Birth weight has been used as a strong predictor of neonatal, infant and child mortality. In the absence of ultrasound estimation of foetal weight, birth weight at each gestational age is used as a proxy for actual foetal growth [22]. This study attempted to find the incidence of the trend for SGA in this population and the risk factors associated with having SGA babies.
This is a large scale study from a referral hospital in India, which caters predominantly to obstetric care of the local population besides referrals. The women do not smoke (though passive smoking from exposure to husband’s smoking or from cooking on open fire is common). There is a mixture in the socioeconomic status of women who come for delivery at this institution. There is a mix of private patients, (who belong to the high socioeconomic status) and low and middle income women who constitute the bulk of the clientele. Results from our study showed that the rate of SGA babies had declined significantly from 11.4% in 1996 to 8.4% in 2010, that is, 26.3% reduction in 15 years (p < 0.001). We defined SGA as less than the 10th percentile birth weight value from the same cohort of children delivered at this hospital, and specific to both male and female gender rather than base it on the Canadian foetal growth standard or the old Indian standard [17]. Kumar et al. [13] have provided birth weight standards for various gestational ages from the same cohort of children from the same department. The incidence of SGA in our study was 11.5% or 115 per 1000 births and the trend of SGA has been declining over these years. The overall stillbirth rate during the last fifteen years was 26 per 1000 births. As in the SGA rate, the trend of stillbirth rate has been declining over these years. However, of the SGA, the contribution due to stillbirth is 22.6%. Therefore, stillbirths might have small impact in the SGA rate. Lee et al. [23] have reported that the incidence of SGA for Asian Indian infants was 14.5% while this was 2.7% for Caucasian, where the SGA classification was based on birth weight less than the 10th percentile for gestational age. Ananth et al. [24] have reported that the incidence rates of SGA in the white population was 9.8% in 1989 and 9% in 1998 and this was 19.4% and 17.4% in the black population in 1989 and 1998 respectively. Madan et al. [25] have reported that foreign born Indians in the United States had a 6.3% SGA. No Indian standard has been established in the recent past [17].
George et al. [26] have reported high rates of SGA when the foetal growth was considered against the Canadian foetal growth standard. We are skeptical in using Indian standards which were reported in 1996 [17] in view of the socio demographic transition that has happened over the last 40 years in terms of improved access to care, good nutrition etc. [27]. A publication from the same department in 1996 did not provide actual percentiles and dealt with restricted gestational age from 29 to 42 weeks [17]. However, the current study had a range of gestational age from 22 to 42 weeks. However, all the above studies have used the US based reference standard to classify SGA [28]. Our data has shown a similar rate as compared to the above study. They have also reported that rates of chronic hypertension, pregnancy induced hypertension that are risk factors for SGA have increased more in blacks than in the Whites in United States.
Anzeige
When taking into consideration the demographic risk factors for SGA, this study found that women, who were illiterate, were at higher risk for having SGA babies. Husbands of these women also reflected the same literacy and unskilled work characteristics. This could be explained by the fact that awareness of good nutrition and rest was absent or not available to this group of women and husbands. Their economic condition would not have been conducive to good nutrition as well. Their financial status, we surmise, precluded adequate antenatal care, nutrition and support from family as well.
Teenage pregnancies showed a higher risk for SGA, according to this present study. This could reflect the lack of awareness of antenatal care, physiologic inability to have an appropriate for gestational age neonate or even the increased prevalence of hypertensive disorders which was found more often in this sub group.
Women with obstetric risk factors such as teenage pregnancy, hypertensive disorders, multiple pregnancy, cardiac disease, anaemia in pregnancy and underweight, were significantly at higher risk for having SGA babies. Mavalankar et al. [29] reported that anaemia, primiparity, poor obstetric history, lack of antenatal care and hypertension were significant risk factors for SGA. Oligohydramnios was found to be significantly associated with SGA.
Our study has shown a 26% reduction in SGA over the last 15 years, probably due to reductions of some of the risk factors in the community. The percentage of teenage pregnancies decreased from 7.1% prior to 2004 to 4.7% after 2004 and the reduction was statistically significant (Table 3). The percentage of overweight and obese women have significantly increased after 2004, suggesting that there has been an improvement in the nutritional status of women (from underweight) and therefore a decline in SGA. Similarly the education level of women has increased (degree and above: 29% vs 40%), which probably contributed to a reduction in SGA as well. There are very few treated/ untreated malarial pregnant women among the women delivering in CMCH. This area is not endemic for malaria. Pregnant women with HIV and STI get free treatment in the Government Hospitals around Vellore, and hence very infrequent in this Hospital.
Table 3
Distributions of risk variables before and after 2004
Risk variables
<=2004
>2004
p value
N
%
n
%
Age:
<=19
1337
7.1
828
4.7
0.03
>19
17507
92.9
16871
95.3
Hypertension:
No
16967
89.75
15673
88.20
0.12
Yes
1938
10.25
2096
11.80
Multiple Pregnancy:
No
18273
96.66
17187
96.72
0.95
Yes
632
3.34
582
3.28
Cardiac disease:
No
18746
99.16
17597
99.00
0.88
Yes
159
0.84
172
1.00
Anaemia in pregnancy:
No
18470
97.70
17479
98.37
0.53
Yes
435
2.30
290
1.63
Miscarriage:
No
15609
82.56
14659
82.50
0.95
Yes
3296
17.44
3110
17.50
BMI:
Underweight
425
2.51
215
1.41
0.33
Normal weight
8153
48.04
5489
36.02
<0.001
Overweight
6175
36.38
6080
39.90
0.001
Obesity
2219
13.07
3455
22.67
<0.001
Mother Occupation:
Professional
1293
6.89
1683
9.65
0.01
Housewife
17377
92.55
15552
89.22
<0.001
Mother Education:
Degree and Above
4788
28.96
6943
40.14
<0.001
Higher Secondary
10927
66.09
9753
56.40
<0.001
Not all women had a dating scan in the first trimester. When menstrual cycles were regular, and findings at examination were corresponding, LMP was used for gestational age. If menstrual cycles were irregular, dating by scan was used, at the first visit (first or second trimester. In case of in vitro fertilisation, calculating days since oocyte retrieval or co-incubation and adding 14 days [15]. The being a retrospective study, the exact numbers of pregnant women who had a dating scan, could not be ascertained.
Some of the risk factors for SGA are modifiable, and care should be taken to correct these, so that SGA can be further decreased. Among the demographic risk factors, teenaged pregnancies can be avoided with education and awareness of the parents and school going female students. Literacy levels are related to prevalence of SGA; the higher the literacy levels, the lower the SGA prevalence. One of the modifiable obstetric risk factors are underweight mothers, and this can be brought down with education and awareness of nutrition among couples. A major modifiable obstetric risk factor is the presence of anaemia in pregnant women. This constitutes one of the causes for increased maternal mortality and morbidity, in addition to SGA babies as well. Mothers with multiple pregnancies and hypertensive disorders of pregnancy should have special antenatal care to avert mortality and morbidity in their SGA babies and themselves as well.
This study has several limitations including that it is impossible to get the proportion of SGA calculated by ultrasound measurement and by dates (LMP) separately, since there was no computerisation of the antenatal data prior to 2000. The Labour Room Register data was preserved, from where the present paper has been compiled. Though this is a large scale study representing 15 years of deliveries from a private referral teaching hospital, this may not represent the deliveries which are taking place at the Primary Health Centres in the rural area. Some of the changes in the secular trend could be attributed to the policy changes in the hospital such as an increase in staff-patient ratio, increase in the number of units in the department, dedicated women and children blocks and the availability of consultants at any time point. Overall decrease in the incidence of SGA could also be attributed to the availability of high technology instruments which have been made available over time and thus helped in diagnosing and treating the SGA earlier. Moreover, gold standard ultrasound was not available to all women in this cohort which is a situation repeatedly observed in many low income countries. In addition the records for the women for whom it was available could not be retrieved. Nevertheless the large population of women evaluated here with consistent dating using the same method of Dubowitz gestational age assessment still permitted an evaluation of the SGA trends across time. However, we do not have such data to correlate these changes with the incidence of SGA.
Conclusion
The rates of SGA were 11.4% and 8.4% in 1996 and 2010 respectively. There is a significant reduction in the incidence of SGA by 26%. The number of teenaged childbirths had decreased significantly. The literacy levels were significantly higher probably resulting in better awareness and lesser SGA babies. The number of women with low Body Mass Index decreased and so SGA had come down as well. Pregnancy with SGA neonate was significantly associated with oligohydramnios. Teenage pregnancy, hypertensive disorders, multiple pregnancies, cardiac disease, anaemia in pregnancy and being underweight during pregnancy were significant risk factors for having SGA babies. Therefore the women who seek antenatal care with the above risk factors need to be identified early and health education regarding safe delivery and optimal birth weight has to be imparted periodically.
Consent
The Institutional Review Board of Christian Medical College Vellore provided consent for this research paper as recorded in the following minutes (IRB Min. No. 7109 dated 10.03.2010).
Acknowledgements
I acknowledge the graciousness of the Heads of Obstetrics and Gynaecology Department Units 3 and 5 for sharing their data for research. I sincerely thank and acknowledge the help rendered by Dr Shuba Kumar (Social Scientist, SAMARTH, NGO, Chennai, India) as language editor of the main manuscript. All the contributions by the authors to the research work were voluntary and not funded by any organisation. The data was collected by the Clinical Data Management Centre, Department of Biostatistics, Christian Medical College Vellore.
Publishing datasets
The dataset will not be available for publishing online since further research has been planned.
Open Access This article is licensed under a Creative Commons Attribution 4.0 International License, which permits use, sharing, adaptation, distribution and reproduction in any medium or format, as long as you give appropriate credit to the original author(s) and the source, provide a link to the Creative Commons licence, and indicate if changes were made.
The images or other third party material in this article are included in the article’s Creative Commons licence, unless indicated otherwise in a credit line to the material. If material is not included in the article’s Creative Commons licence and your intended use is not permitted by statutory regulation or exceeds the permitted use, you will need to obtain permission directly from the copyright holder.
The authors declare that they have no competing interests.
Authors’ contributions
TS: Involved in data abstraction supervision, quality control assurance. She was also involved in data analyses and interpretation. She also involved in literature review and drafting background section. BY: Involved in developing data entry system in EPIINFO and involved data validation part. He also involved in data analyses and verified the analytical codes. L.J: Involved in phrasing the research questions. He involved in the verification of analytical results, which were done by TS and BY. He involved in drafting the methods section. He also participated in the interpretation of results section along with RJ. RV: Involved in drafting the background section alone with TS. She was involved in the literature review and guiding the Biostatisticians in analyses. She was also involved in writing the discussion section. RJ: Provided leadership in phrasing the research question. Involved in designing the methods of data abstraction and verified the results. Drafted the Discussion section, reviewed and approved the overall manuscript. All authors read and approved the final manuscript.