

Abstract
Small animal positron emission tomography (PET) is a noninvasive imaging modality that enables in vivo imaging and quantification of the biological processes of small experimental animals. We have developed a small animal PET that utilizes a high-resolution multiplexed readout and charge signal transmission (CST) method. The small animal PET was composed of six detector blocks consisting of SiPMs and LYSO arrays. Six detector blocks were mounted on a PET gantry having an inner diameter of 76 mm, outer diameter of 112 mm, and axial length of 40.8 mm. The charge signals of SiPM output were transmitted to the input of multiplexed readout using 4 m flexible flat cables. The multiplexed readout was composed of six main boards, each of which included 36 detector boards, to reduce the number of readout channels by a factor of 36, with a multiplexing ratio of 144:4. The performance of the small animal PET was evaluated using NEMA NU 4-2008 standards, and its imaging capability was demonstrated by in vivo mouse imaging studies. The average energy and time resolutions were 13.2% ± 0.3% and 3.8 ns, respectively. The spatial resolution at the center of the transaxial FOV was 1.1 mm, and the peak sensitivity at the center of the axial FOV was 1.5%. The peak noise equivalent count (NEC) rate and scatter fraction were 21.1 kcps at 18.2 MBq and 21%, respectively. The acquired images demonstrated high quality tracer uptake patterns of small experimental animals. The results of performance evaluation and animal imaging indicate that the small animal PET developed in this study can provide high-quality small animal imaging with cost-effectiveness and compactness.
Export citation and abstract BibTeX RIS
1. Introduction
Positron emission tomography (PET) is a noninvasive imaging modality that enables in vivo imaging and quantification of biological processes (Phelps 2000, Chatziioannou 2002, Myers 2001), and has been widely used to study small animal models of various human diseases (Bloomfield et al 1995, Cherry et al 1997). The small animal PET has been developed to improve spatial resolution, in order to investigate in vivo biological processes in small animals having microstructures that are smaller than those of humans (Cherry et al 1937, Pichler et al 1998, Chatziioannou et al 2001, Vandenbroucke et al 2010). High spatial resolution is not only required to resolve the small structure, but also to obtain accurate quantitative information on the biological processes of small animals. A PET detector consisting of small crystal pixels has been used to achieve high spatial resolution in the development of PET, which, however, causes increment of complexity and cost in system development. Therefore, the multiplexing circuit has been employed to reduce the digital readout channel, such as the Anger circuit originally used in the gamma camera, and the 'winner-take-all' method applied in PET (Anger 1958, Moses et al 1996, Jung et al 2010).
We developed a multiplexing method that combines the Anger positioning algorithm and position decoder circuit (PDC), and previously reported its performance and applicability to PET (Lee et al 2017). In this study, we have extended the multiplexed readout from 96-to-4 multiplexing ratio in the previous study, to 144-to-4 for the development of the small animal PET. A cost-effective PET electronics could be developed using this multiplexing circuit, which could reduce the number of readout channels. Additionally, the modification of multiplexing ratio was simple, due to easy scaling by adding or subtracting the electronics board, which is useful to construct the PET having a different number of detector modules for different bore size of the animal PET.
The usefulness of the charge signal transmission (CST) method connecting with detector and electronics via a relatively long cable has been reported (Kang et al 2010). The CST method was capable of transmitting the SiPM charge signals to the PET electronics located remotely using a long flexible flat cable with no considerable change in the PET performance, allowing the detector gantry size to be minimized for compact and flexible design. The timing performance is expected to be degraded by using multiplexed electronics and long cable. However, it may not be crucial for small animal imaging because of small field-of-view.
The purpose of this study was to evaluate a small animal PET utilizing a high-resolution multiplexed readout for a high-resolution system and CST method for a compact and lightweight PET gantry. The performance of the small animal PET was evaluated using the National Electrical Manufacturers Association (NEMA) NU 4-2008 standards. The imaging capability of the small animal PET was also demonstrated through in vivo animal studies using normal mice.
2. Materials and methods
2.1. Description of the small animal PET
The small animal PET was composed of six detector blocks, which consisted of 864 channels of 54 SiPMs (S11828-3344M, Hamamatsu, Japan), and 3456 pixels of 54 arrays of Lutetium Yttrium Oxyorthosilicate (LYSO, Crystal Photonics, Inc., USA). The PET detector block was comprised of 3 × 3 detector modules, each of which consisted of an 8 × 8 array of 1.5 mm × 1.5 mm × 6 mm LYSO, a 4 × 4 array of 3 mm × 3 mm SiPM, and a 13.4 mm × 13.4 mm × 0.7 mm light guide. Figure 1(a) shows that three detector modules were axially aligned in a sensor interface board. Figure 1(b) shows the eighteen sensor interface boards of 6 detector blocks that were mounted on the PET gantry having an inner diameter of 76 mm and outer diameter of 112 mm. The transaxial field of view (FOV) was 60 mm, and the axial FOV was 40.8 mm, respectively.
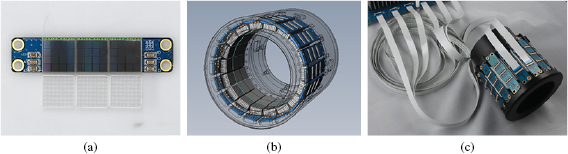
Figure 1. (a) Three SiPMs and LYSO arrays were mounted onto the custom-made printed circuit board (PCB) of a sensor interface board that included three flexible flat cable connectors to transmit 48 analog signals of 3 SiPMs, and to supply operating voltage. (b) 3D CAD drawing of small animal PET gantry having an inner diameter of 76 mm and outer diameter of 112 mm. (c) A photograph of small animal PET gantry mounting the sensor interface board with long flexible flat cables.
Download figure:
Standard image High-resolution image2.2. High-resolution multiplexed readout for PET
The principles and performance of the high-resolution multiplexed readout were described in detail in a previous study (Lee et al 2017). Briefly, the multiplexed readout was developed by combining the Anger positioning algorithm (Anger) and PDC to achieve a high multiplexing ratio and high spatial resolution. The multiplexed readout used in this study was composed of six main boards, each of which was mounted with 36 detector boards, to reduce the number of readout channels by a factor of 36, with a multiplexing ratio of 144:4.
Figure 2 shows that the 144 channels of 9 SiPMs in a detector block were grouped into 36 groups of the detector boards as G1, G2, ..., G36. The four signals of each group were summed, and subsequently transmitted to the comparator generating the trigger signal, to estimate the time information and coarse position. Field programmable gate array (FPGA) was used to distinguish coarse position, using the identification of the fastest signal among the 36 groups of detector block, and to generate the timing signal by summing the 36 comparator outputs using OR gates. Then, the FPGA generated the address for the coarse location, and transmitted the signal to turn on the analog switch of the identified detector board. The coarse position where the gamma-ray interacted with the group was stored with the address ranging from 1 to 36. Finally, a data acquisition module (DAQ) digitized four analog pulses from the selected detector board, to estimate the energy, and the fine positioning information.
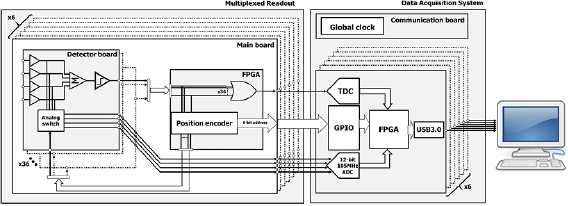
Figure 2. Block diagram of the multiplexed readout and data acquisition system.
Download figure:
Standard image High-resolution image2.3. Data acquisition system
A custom-made DAQ system composed of 6 DAQ modules was fabricated to acquire the time, energy, and position information, and was synchronized to a global clock using a communication board. The timing signal and 4-channel analog signals and 6-bit address generated by the multiplexed readout were transferred to a DAQ module having a TDC, 4-channel ADCs, 2 GB SDRAM, and USB3.0. The intrinsic timing resolution of TDC was 50 ps, and the sampling rate and resolution of the 4-channel ADC were 105 MHz and 12-bit, respectively.
The time mark generated by TDC, digitized 4-channel ADC peak values, and 6-bit address were combined to list mode event packet, and then stored to a host PC. The energy was estimated by summing all of the digitized ADC peak values, and the fine position of gamma event was determined by the 4-channel ADC peak values.
2.4. Performance evaluation of the small animal PET
2.4.1. Energy resolution and time resolution
The energy spectra and time spectrum of a pair of detector blocks were acquired for 300 s to estimate the average energy resolution, distribution of 511 keV photopeak positions, and coincidence resolving time (CRT), using a 256 kBq of a 22Na point source placed at the center of the transverse and axial FOV. The energy resolution and CRT were estimated by fitting each of the spectra with a Gaussian function, and by calculating the full-width at half-maximum (FWHM) of the fitted curve (Gu et al 2013).
2.4.2. Spatial resolution
The measurement of spatial resolution was performed according to the NEMA NU4-2008 protocol, using the point source described in section 2.4.1 (National Electrical Manufacturers Association 2008). The source was moved in 5 mm increments from the center to the edge of the transverse FOV for two axial locations, the center and one fourth of the axial FOV. The data was acquired for 300 s at each position using the energy window of 450–650 keV, and a time window of 20 ns. The point images were reconstructed using 3D filtered back projection (FBP), with a Colsher filter cut-off at the Nyquist frequency.
2.4.3. Absolute sensitivity.
The sensitivity measurement was performed with the same point source described in section 2.4.1 placed at the center of the transverse FOV. The source was stepped in 0.8 mm across the axial FOV, and each dataset was acquired for 100 s. Absolute sensitivity was measured with the energy windows of 450–650 and 100–700 keV and a coincidence time window of 20 ns. The background count rate was acquired, to exclude the influence of natural activity of the LYSO. The absolute sensitivity profile as a function of axial position was plotted, and the total axial length sensitivity ( ) and absolute sensitivity (
 ) were calculated as follows:


where, Ri and RB,i are the source count rate and background count rate, respectively. Acal is the point source activity (Bq), and 0.906 is the branching ratio of 22Na.
2.4.4. Scatter fraction and noise equivalent count (NEC) rate
The count rate performance was evaluated using a mouse-sized phantom, a 70 mm long and 25 mm diameter solid cylinder made of high density polyethylene (0.96 g cm−3), with a 3.2 mm diameter hole drilled parallel to the central axis at a radial distance of 10 mm, described in NEMA NU4-2008. A flexible tube filled with 18F solution was inserted into the hole of the phantom. The initial activity was 30.2 MBq, and data was acquired for 16 h to decrease the ratio of the random rate to the true event rate down to less than 1%. The phantom data was acquired every 20 min for 30 s with an energy window of 250–650 keV. The data processing was performed with a sinogram sorted by the single slice rebinning, as described in NEMA NU4-2008.
The system scatter fraction (SF) was measured using the data with scatter and random event rate below 1% of the true event rate, and calculated as follows:
where,  is the random plus scattered counts, and
  is the sum of the total counts for each slice i and frame j .
The random count rate (Rr) was acquired using the delayed coincidence timing window, and the background count rate (Rint) was obtained without the mouse-sized phantom. The true (Rt), scattered (Rs), and noise equivalent (RNEC) count rates were computed as follows:


where,  and
and  are prompt and random plus scattered counts, respectively, and
  is the acquisition time.
2.4.5. Image quality assessments using phantom images
PET image acquisition and quality assessment were performed using the cylindrical phantom, having three different regions, of five hot-rods, uniform, and two cold-rods, with a diameter of 33.5 mm and height of 63 mm. The recovery coefficients as a function of rod diameter were measured by calculating the ratio of the measured activity concentration of the region-of-interest (ROI) in the rods and the mean concentration of ROI in uniform region. Two cold chambers filled with water and air were used to quantify the spill-over ratio, which was measured by activity concentration in the cold chamber relative to the mean activity concentration in the hot background. The recovery coefficients (RC) and spillover ratio (SOR) were measured as described in NEMA NU4-2008.
The imaging capability using the small animal PET developed in this study was evaluated by acquiring the images of a Micro Hot Spot phantom filled with 7.3 MBq of 18F. The phantom was composed of six fillable hot rods of different sizes (1.2, 1.6, 2.4, 3.2, 4.0, and 4.8 mm), and the PET image was acquired for 30 min. The phantom images were reconstructed using 3D maximum-likelihood expectation maximization (MLEM) algorithm with 13 iterations. The number of iteration was chosen to compromise noise and image quality. Reconstruction time with 13 iterations was approximately 13 min. No scatter, attenuation and random corrections were applied for the phantom image.
2.4.6. In vivo animal study
Mice imaging was performed to assess the image quality of the small animal PET developed in this study. The animal experiments were conducted in accordance with the institutional animal care and use committee guidelines and approved by the the Yonsei Laboratory Animal Research Center Institutional Animal Care and Use Committee. The whole-body images of two mice, weighing 21 g and 23 g, injected with 7–8 MBq 18F-FDG or 18F were obtained. The mice intravenously injected with 7.2 MBq of 18F-FDG and 7.4 MBq of 18F were scanned for 30 min in three bed positions, after a 45 min uptake period. The mice were anesthetized by isoflurane inhalation. Mice images were reconstructed using MLEM with 13 iterations and were not corrected for the attenuated, scattered and random events.
3. Results
3.1. Energy resolution and timing resolution
Figure 3 shows that the average energy resolution was measured as 13.2% ± 0.3% for the entire crystal pixels. The photopeak positions varied from 1500 to 3800, and the average value was 2280 ± 740 (n = 3456). The average timing resolution measured using a pair of detector blocks was 3.8 ns.
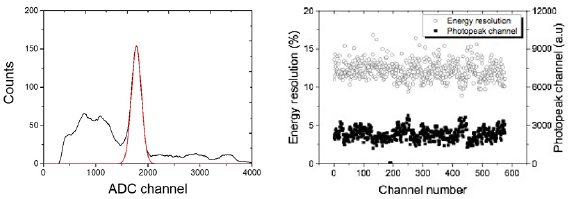
Figure 3. Energy spectrum acquired using a representative detector pixel (left), and the energy resolutions and photopeak positions of energy spectra (right).
Download figure:
Standard image High-resolution image3.2. Spatial resolution
Figure 4 shows the radial, tangential, and axial spatial resolutions of the small animal PET as a function of radial offset from the center to 20 mm. The radial resolutions obtained from the center of the FOV to 20 mm radial offset varied from 1.2 to 2.3 mm FWHM. The tangential resolutions were measured from 1.1 to 1.6 mm FWHM. The axial resolutions had small variation ranging from 1.6 to 1.7 mm.
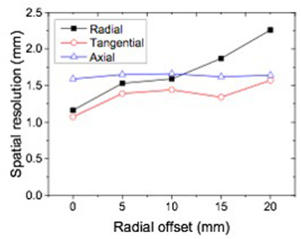
Figure 4. Spatial resolution as a function of radial offset from the center of FOV.
Download figure:
Standard image High-resolution image3.3. Sensitivity
The absolute sensitivities were measured using 300–700, 350–650, and 400–600 keV energy windows, and 20 ns time window. Figure 5 shows that the peak absolute sensitivities were 1.5, 1.1, and 0.7% at the center of the axial FOV with the three different energy windows. The activity profile as a function of axial position showed a triangular shape, having linear response to the axial offset.
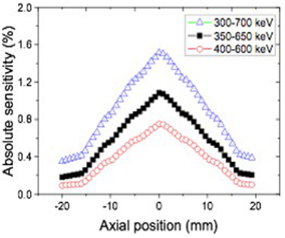
Figure 5. Absolute sensitivity profile as a function of axial position with 300–700, 350–650 and 400–600 keV energy windows.
Download figure:
Standard image High-resolution image3.4. Scatter fraction and NEC rate
Figure 6 shows the count rate performance of the small animal PET measured using the mouse-sized scatter phantom. The prompt, true, random, scatter, and NEC rates were plotted against the activity of the 18F line source. The peak NEC rate was 21.1 kcps at 18.2 MBq, whereas the peak true count rate was 33.1 kcps at 20.7 MBq, with a scatter fraction of 21%.
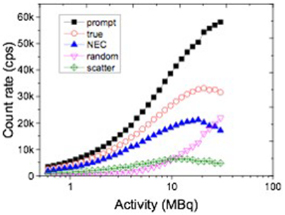
Figure 6. NEC rate as a function of activity in the mouse-sized scatter phantom with the energy window of 250–650 keV.
Download figure:
Standard image High-resolution image3.5. Image quality phantom
Figure 7 shows the images of a transverse plane of the hot-rod, uniform, and cold-rod regions of the NEMA NU-4 image-quality phantom. The %STD in the uniform region was 12.9% with the MLEM reconstruction. The RC for the smallest 1 mm rod was 0.10, and for the largest 5 mm rod was 0.87. The SOR measured in the water- and air-filled cold chambers was calculated to be 14.7 and 13.3%, respectively.
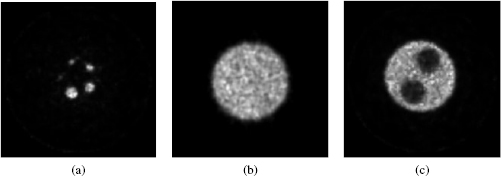
Figure 7. The reconstructed images of the NEMA image quality phantom; (a) transverse view of five hot-rods, (b) uniform region, and (c) cold-rod region filled with air and water.
Download figure:
Standard image High-resolution imageFigure 8 shows a transverse image of the Micro Hot Spot phantom obtained with the developed small animal PET. The 1.6 mm spots were clearly resolved in the reconstructed image of the hot rod phantom.
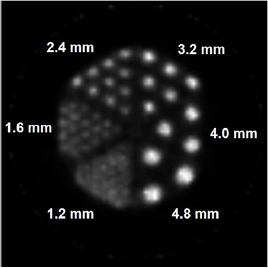
Figure 8. Transverse view of the micro hot spot phantom reconstructed using EM algorithm.
Download figure:
Standard image High-resolution image3.6. In vivo animal study
Figure 9 shows transverse, coronal, and sagittal views of a mouse (21 g) injected with 7.2 MBq of 18F-FDG acquired energy window of 450–650 keV and timing window of 20 ns, acquired using the small animal PET developed in this study to assess the imaging capability of small experimental animals.
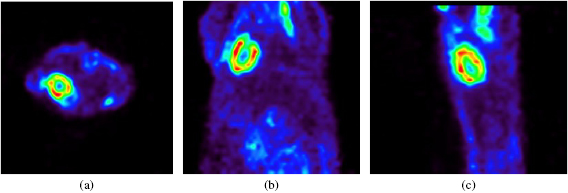
Figure 9. (a) Transverse, (b) coronal, and (c) sagittal images of mouse injected with 18F-FDG, acquired using the small animal PET developed in this study.
Download figure:
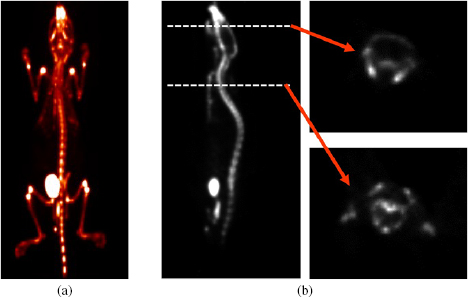
Standard image High-resolution imageFigure 10 shows the maximum intensity projection images of mouse (23 g) injected with 18F that were obtained with the same window setting of the acquired FDG mouse image. The mouse was scanned at 3-bed positions, to cover the total body of mouse. In vivo study of normal mice injected with 18F-FDG of 18F showed that the left ventricular myocardium was clearly visualized in the FDG image, and the details of bony structures, such as the ribcage, skull, and pelvic girdle, could be resolved in the 18F images.
Figure 10. (a) Maximum intensity projection images of mouse injected with 18F, and (b) sagittal slice and transverse images of the skull and the ribcage.
Download figure:
Standard image High-resolution image
4. Discussion
We have developed a small animal PET that utilizes high-resolution multiplexed readout to reduce a large number of readout signals, and CST method to minimize the size of the detector gantry, separating the detector and the readout electronics using 4 m of FFC. A cost-effective electronics can be achieved, since the multiplexed readout reduced the digital conversion channel by a factor of 36, 144-to-4. The lightweight PET gantry having only detector modules could be developed by using the CST method. The design of small animal PET proposed in this study is favorable to configure PET-MRI dual modality imaging system for simultaneous acquisition of PET-MRI since the PET gantry size was minimized by using the CST method allowing to be inserted into MR bore having narrow and limited internal space. The performance of the PET, including the spatial resolution, sensitivity, scatter fraction, and count rate was evaluated according to NEMA NU4-2008 protocol. The imaging capability of small animal was also demonstrated, by acquiring the images of resolution phantom and normal mice.
The average energy resolution measured with a 22Na point source was 13.2% ± 0.3%, which is comparable to the results achieved with the PET system using the same SiPM (Vinke et al 2014, Ko et al 2016). The average value of the photopeak distribution was 2280 ± 740. The pixels at the corners in the group of LYSO array had slightly lower photopeak position than those at the center, because of the light loss that occurred at the two corners that contacted the other groups. Since the multiplexed readout used the light sharing method to calculate the energy and fine position using four channels of SiPM in a group, 0.7 mm thickness of thin light guide was used in the PET detector to minimize light spread over the other group, and to achieve better crystal identification,
Spatial resolutions were degraded along the radial direction from the center to edge of the FOV, caused by the small diameter of the PET ring inducing parallax error. It has been reported that the parallax error could be improved by using point spread function (PSF) modeling incorporated into image reconstruction with the system matrix during image reconstruction, using maximum likelihood expectation maximization (MLEM) algorithm. No meaningful variation of the axial resolution according to the location was observed, because the axial resolution was strongly dependent on the slice thickness of the reconstructed image.
The peak absolute sensitivity was measured as 1.5% for the 250–650 keV energy window and 20 ns timing window. This value is comparable to the PET system having a similar axial length to our developed PET. The absolute sensitivities of LabPET4 and VrPET having an axial length of 37.5 and 46.5 mm were 1.4 and 1.6%, respectively, for an energy window of 250–650 keV (Lage et al 2009, Bergeron et al 2014). The sensitivity could be improved by extending the axial FOV. In addition, the profile of axial sensitivity showed a linear response as a function of the axial distance from center to the edge of the FOV, due to the gapless design between detector modules according to the axial direction. The acquired peak NEC count rate of 21.1 kcps at 18 MBq for the mouse-sized phantom with 250–650 keV energy window is relatively low, compared to the other systems, such as VrPET (31.5 kcps at 10.5 MBq) and LabPET4 (129 kcps at 4.1 MBq ml−1). The small animal PET developed in this study has high multiplexing ratio by a factor of 36 providing cost-effective electronics (Lee et al 2017).
The micro phantom image reconstructed using 3D MLEM algorithm with 13 iterations clearly visualized the rods down to a diameter of 1.6 mm. The performance acquired using the image quality phantom described in NEMA NU4-2008 protocol showed good results of uniformity, recovery coefficient, and spill-over ratio, even though the current reconstruction algorithm does not implement scatter, attenuation and random corrections.
Recently, PET has evolved into multimodality imaging systems to complement anatomical information by combining a high-resolution morphologic imaging system, such as computed tomography (CT) or magnetic resonance imaging (MRI) (Shao et al 1997, Judenhofer et al 2008, Jung et al 2015). A CST method has been previously reported that could facilitate the construction of a PET-based dual-modality imaging system (Kang et al 2010, Hong et al 2013, Kim et al 2015). It would be particularly useful for hybrid PET-MRI, because it allows separation of detectors and readout electronics, which would minimize the mutual interference between PET and MRI. Furthermore, it would allow the construction of a compact PET gantry, with is important in designing PET-based hybrid imaging systems.
5. Conclusion
We have developed a small animal PET that utilizes a high-resolution multiplexed readout and CST method. The multiplexed readout allows a cost-effective electronics, due to the high-density multiplexing ratio of 144-to-4 and high-resolution smaller than the sensor pixel size. The CST can achieve compact design, because it allows separation between the PET detector and the readout electronics. The results of performance evaluation and animal imaging indicate that the small animal PET developed in this study can provide high-quality small animal imaging with cost-effectiveness and compactness.
Acknowledgments
This research was supported by the International Cooperative R&D Program (No. P0000621) of the Ministry of Trade, Industry and Energy (MOTIE) and Korea Institute for Advancement of Technology (KIAT) and by the Basic Science Research Program (No. 2017R1E1A1A01073826) and the Radiation Technology R&D program (No. 2017M2A2A4A01071286) through the National Research Foundation of Korea (NRF) of the MSIT (Ministry of Science and ICT), Republic of Korea.