

Abstract
Fire is a global phenomenon and tightly interacts with the biosphere and climate. This study provides the first quantitative assessment and understanding of fire's influence on the global annual land surface air temperature and energy budget through its impact on terrestrial ecosystems. Fire impacts are quantified by comparing fire-on and fire-off simulations with the Community Earth System Model (CESM). Results show that, for the 20th century average, fire-induced changes in terrestrial ecosystems significantly increase global land annual mean surface air temperature by 0.18 °C, decrease surface net radiation and latent heat flux by 1.08 W m−2 and 0.99 W m−2, respectively, and have limited influence on sensible heat flux (−0.11 W m−2) and ground heat flux (+0.02 W m−2). Fire impacts are most clearly seen in the tropical savannas. Our analyses suggest that fire increases surface air temperature predominantly by reducing latent heat flux, mainly due to fire-induced damage to the vegetation canopy, and decreases net radiation primarily because fire-induced surface warming significantly increases upward surface longwave radiation. This study provides an integrated estimate of fire and induced changes in ecosystems, climate, and energy budget at a global scale, and emphasizes the importance of a consistent and integrated understanding of fire effects.
Export citation and abstract BibTeX RIS
1. Introduction
Fire is an integral Earth system process and the primary form of terrestrial ecosystem disturbance on a global scale (Bowman et al 2009), burning ∼400 Mha of land area each year (Randerson et al 2012, Giglio et al 2013), and damaging an average of over half of tree stems, almost all the leaves, and 10%−15% of roots when fires pass through a region (Arora and Boer 2005, van der Werf et al 2010). Post-fire re-growth and recovery may last for decades and even more than 100 years, so both current and historical fires exert impacts on land ecosystems (Amiro et al 2006, Bond-Lamberty et al 2007). Fire occurrence and spread are regulated by climate and weather, ecosystems, and human activities, and can feed back to them in multiple ways (Bowman et al 2009, Le Page et al 2010). Quantifying and understanding the effect of historical fire on climate and energy budget is critical in investigating fire's role in the Earth system as well as the potential broader impact of fire management, and largely determines whether and how fire should be modeled in Earth system models (ESMs) for global change research (Hantson et al 2016).
Fire affects the climate and energy budget in two main ways: (1) through emissions of trace gases and aerosols, and (2) through alterations to terrestrial ecosystem states and functioning (Bowman et al 2009). Earlier global-scale quantitative studies focused on the first way, generally finding that fire emissions generated a negative radiative forcing and a reduction in the global surface air temperature (Ward et al 2012, Tosca et al 2013, Landry et al 2015, Jiang et al 2016). Except in our recent study of fire's influence on the global land water budget (Li and Lawrence 2017), the impact of fire through the second way or both has only been quantified at particular sites (Neary et al 2005, Liu et al 2005, Amiro et al 2006, Sun et al 2010), in a region (Bond-Lamberty et al 2009, Rogers et al 2013, Gatebe et al 2014), or for a specific fire (Randerson et al 2006).
The present study provides the first estimate and understanding of fire's impact on annual mean surface air temperature (Tas) and energy budget over global land for the 20th century through fire-induced changes within terrestrial ecosystems. Given that the interactions among climate, fire, and terrestrial ecosystems occur on a wide range of temporal and spatial scales (Bowman et al 2009, Randerson et al 2006), an Earth system model that includes global fire scheme, the Community Earth System Model version 1.2 (CESM1.2), is employed in this study. Fire impacts are quantified as the difference between CESM1.2 control (FIRE-ON) and FIRE-OFF simulations.
2. Simulations
2.1. Model platform
CESM is a global coupled model simulating the Earth's atmosphere, ocean, land, and sea ice (Hurrell et al 2013). The present study adopts the latest CESM-supported release version, CESM1.2 (www.cesm.ucar.edu/models/cesm1.2/), which is comprised of the Community Atmosphere Model, version 5 (CAM5, atmosphere component); Community Land Model version 4.5 with its carbon-nitrogen biogeochemical module (CLM4.5BGC, land component) (Oleson et al 2013, Lawrence et al 2011) with post-release updates to the fire module (Li and Lawrence 2017); and the Community Ice CodE, version 4 (CICE4, sea ice component).
In the real world and CESM, the land surface energy balance equation is:

where surface net radiation SNR is the sum of surface net shortwave radiation absorbed by the land surface (NSW) and downward atmospheric longwave radiation (DLW) minus longwave radiation emitted from the land surface (ULW); SH is the sensible heat flux; the latent heat flux LH (i.e. λET, where λ is a global constant and ET is evapotranspiration) is the sum of heat flux due to vegetation transpiration (Lt), evaporation of precipitation intercepted by the canopy (Lc), and soil evaporation(Ls); and G is the ground heat flux. A positive SH and LH transfers energy from land surface to the atmosphere, and a positive G transfers energy from land surface into the deeper soil. Based on the surface energy balance equation (equation (1)) and the Stefan-Boltzmann Law, the upward surface longwave radiation ULW can be written as:
where σ is the Stefan-Boltzmann constant, Ts is the surface temperature. Based on equation (2), we can attribute fire-induced change in surface air temperature by calculating the changes in the energy fluxes on the right hand side of the equation between FIRE-ON and FIRE-OFF simulations, as in Xu et al (2015) for the impact of land cover change.
The fire module in CESM1.2 (figure S1 available at stacks.iop.org/ERL/12/044014/mmedia) includes four components: agricultural fires in cropland, deforestation and degradation fires in the tropical closed forests, non-peat fires outside cropland and tropical closed forests, and peat fires (Li et al 2012, 2013, Li and Lawrence 2017). The burned area fraction is determined by climate and weather conditions, vegetation composition and structure, and human activities (including human deforestation rate for deforestation and degradation fires; anthropogenic ignitions and fire suppression and agricultural waste management for other non-peat fires, which are estimated by functions of population density and gross domestic product per capita). After the estimation of the burned area fraction, the fire module calculates losses and transfers of carbon and nitrogen (C/N) due to biomass and peat burning and fire-induced vegetation mortality. These changes are used to adjust C/N pools in land ecosystems. Estimates of biomass burning and plant-tissue mortality are based on PFT (plant functional type)-dependent combustion completeness factors and fire mortality factors (table S1). The fire module is the default fire model of the CESM (Oleson et al 2013), the Chinese Academy Sciences' Earth system model (CAS-ESM, Zeng et al 2014, Wang et al 2014), and the next version of Beijing Climate Center Climate System Model (BCC-CSM, W. P. Li personal communication 2015). It has also been partially introduced into the Dynamic Land Ecosystem Model (DLEM, Yang et al 2014), the GFDL's Earth System Model (LM, Rabin 2016), and the Canadian Earth System Model (CanESM, Melton and Arora 2016).
2.2. Experimental design
A transient run of CAM5 CLM4.5BGC-CICE4 from 1850 to 2004 is forced using time-varying 1850–2004 observed CO2 concentration, land-use and land cover change (Lawrence et al 2012), population density data (HYDEv3.1 and CIESIN 2005, Li et al 2013), sea surface temperature (HadISST, Rayner et al 2003), and nitrogen deposition (Lamarque et al 2010). This transient run starts from an 1850 equilibrium (spin-up) state of CLM4.5BGC. The period 1850–1899 is taken as spin-up of the coupled atmosphere-land system. The simulation from 1900 onwards is used as the control simulation (FIRE-ON). The transient simulation is available from our earlier study (Li and Lawrence 2017). The FIRE-OFF simulation is the same as the FIRE-ON except that fire is deactivated for both spin-up and 20th century transient simulations.
All simulations are conducted using a finite volume 1.9° (latitude) × 2.5° (longitude) grid for the atmosphere and land components combined with a gx1v6 displaced pole grid for the sea ice component, and a temporal resolution of 30 minutes. The data mentioned in the last paragraph and other input data (e.g. soil color and texture, nitrogen deposition, non-CO2 greenhouse gas and ozone concentration, surface emissions, present-day multi-year average lightning frequency and GDP) are provided with the CESM1.2.
In the present model setup, the pathways through which fire can affect land surface air temperature and energy budget are summarized as follows (also see figure 4, excluding the '↑' and '↓' after variables which are the results of the present study). Biomass burning transfers C/N from terrestrial ecosystems to the air and fire-induced vegetation-tissue mortality transfers C/N from live vegetation tissues to litter. Vegetation re-grows after fire. Fire-induced change in soil N availability affects the down-regulation of gross primary production (GPP, the C input flux of land ecosystems). Changes in the C cycle interact with vegetation structure (e.g. leaf area index (LAI), vegetation height). The changes in vegetation structure may lead to modifications in land states (e.g. albedo, roughness) and energy, water, and carbon fluxes, which interact with atmospheric circulation, climate, and clouds. The changes in C pools and surface climate further feed back onto the fire regime. In CESM, surface albedo affects the surface reflected shortwave radiation, and is affected by soil color, vegetation structure, snow coverage, and black carbon deposition (section 3 in Oleson et al 2013).
Similar to earlier studies which quantified fire's global effect (Ward et al 2012, Li et al 2014, Yue et al 2015, and references therein), the dynamic vegetation component in CLM4.5 B GC is inactive, and the land use and land cover change is prescribed (Lawrence et al 2012) and is the same for both the FIRE-ON and FIRE-OFF, so fire's impact through changing vegetation distribution is not assessed here. Moreover, the post-fire ash deposition is not modeled in CESM (the same with other ESMs), thus the impact of ash on terrestrial ecosystem N cycle is not included.
In addition, the impact of fire trace gas and aerosol emissions (also including the influence of deposition of fire black carbon emissions on surface albedo and the influence of fire-induced N deposition on terrestrial ecosystem N cycle) is not within the scope of the present study. Therefore, we use the prescribed fire trace gas and aerosol emissions for both the FIRE-ON and FIRE-OFF, rather than emissions modeled by the fire emissions module in CESM.
2.3. Evaluation
Overall, CESM1.2 reasonably models fire, Tas, and the energy fluxes over land (table 1). The simulated 1997–2004 global annual burned area (452 Mha yr−1) is between values from MODIS-based global fire product GFED4 (Giglio et al 2013) and GFED4s (small fires included) (Randerson et al 2012, van der Werf et al 2016) (table 1). CESM1.2 generally replicates the spatial pattern of burned area fraction (figure S2), but underestimates burned area over boreal forests in North America, shrub land in eastern Russia and Alaska, and tropical savannas in North Australia, partly due to wet biases in these regions in CESM1.2 (Li and Lawrence 2017).
Table 1. Comparison between CESM1.2 simulations and benchmarks over land.
| Variable |
Period | Statistics |
CESM | Benchmarks | Sources for Benchmarks | |
|---|---|---|---|---|---|---|
| Burned area | 1997–2004 | Avg | 452 | 357(GFED4) | GFED4 (Giglio et al 2013) | |
| (Mha yr−1) | 511 (GFED4s) | GFED4s (Randerson et al 2012, van der Werf et al 2016) | ||||
| Fraction (% yr−1) | S-Cor | 0.56 |
||||
| Tas (no Antarctic,°C) | 1901–2004 | Avg | 12.3 | 12.6 | CRU TS3.21 (Harris et al 2014) | |
| S-Cor | 0.99 |
|||||
| T-Cor | 0.83 |
|||||
| NSW | 2001–2004 | Avg | 129 | 0.98 |
139 | CERES_EBAF-Surface_Ed2.8 (Kato et al 2013) |
| (W m−2) | ||||||
| DLW | S-Cor | 310 | 312 | |||
| (W m−2) | Avg | 0.99 |
||||
| ULW | S-Cor | 371 | 374 | |||
| (W m−2) | Avg | 0.99 |
||||
| SNR | S-Cor | 69 | 78 | |||
| (Wm−2) | Avg | 0.97 |
Trenberth et al (2009), Wild et al (2015) | |||
| SH(W m−2) | 2000–2004 | S-Cor | 27 | 27∼32 | LandFluxEval ET-all | |
| LH (W m−2) | Avg | 39 | 38∼44 | (Mueller et al 2013) | ||
| LH (no Antarctic) | 1989–2004 | Avg S-Cor | 0.93 |
|||
a2 m surface air temperature (Tas), surface net shortwave radiation (NSW), and downward atmospheric longwave radiation (DLW), upward surface longwave radiation (ULW), surface net radiation (SNR), sensible heat flux (SH), and latent heat flux (LH) over land b20th century average (Avg), spatial correlation (S-Cor), and temporal correlation (T-Cor) between simulations and benchmarks cpearson correlation passed the Student's t-test at the 0.05 significance level
The simulated average, spatial pattern, and temporal variability of land Tas during the 20th century are close to the gauge-based CRU TS3.21 (Harris et al 2014, table 1, figure S3). Compared with the satellite-based radiation product CERES (Kato et al 2013), CESM1.2 skillfully simulates the 2001–2004 downward atmospheric longwave radiation and upward surface longwave radiation (table 1, figure S4), but underestimates the surface net shrotwave radiation by 7% and net radiation by 13% mainly due to an underestimation of simulated incident shortwave radiation in the tropics (figure S4). The simulated global total of sensible and latent heat fluxes are in the range of previous estimates (Trenberth et al 2009, Wild et al 2015, table 1). The spatial pattern of simulated present-day latent heat flux is similar to LandFluxEVAL (Mueller et al 2013, table 1, figure S5).
3. Results
3.1. 20th century fires and induced changes within terrestrial ecosystems
The simulated global burned area averaged over the 20th century is 489 Mha yr−1, close to the estimate of 500 Mha yr−1 by Mouillot and Field (2005) which is based on published fire data, data on land-use practices, qualitative reports, as well as local studies that include tree ring analyses. CESM simulates a high burned area fraction in tropical savannas (location: http://questgarden.com/112/58/8/101029173956/index.htm) and southern Asia, a moderate fraction in northern Eurasia and the Rocky Mountains, and a low fraction in arid regions due to low fuel availability and in humid forests due to low fuel combustibility (figure 1(a)), which are generally the same as that presented in Mouillot and Field (2005).
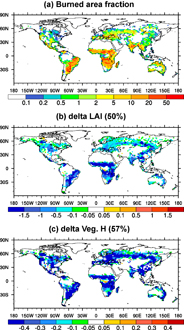
Figure 1 Spatial distribution of annual (a) burned area fraction (% yr−1), and fire's impact (FIRE-ON minus FIRE-OFF) on annual average (b) leaf area index (LAI, m2 m−2) and (c) vegetation height (Veg. H, m) averaged over the 20th century. In (b) and (c), only regions with changes significant at the 0.05 level using the Student's t-test are shown, whose percent in global land area (%) is given in the bracket.
Download figure:
Standard image High-resolution imageIn CESM, LAI and vegetation height are decreased in almost all post-fire regions (figures 1(b) and (c)). In total, 50% and 57% of global land area shows a statistically significant change for the two variables. Averaged over the 20th century, fire decreases global average LAI by 0.56 m2 m−2 and vegetation height by 0.87 m, significant at a 0.05 level (table 2). Fire-induced reductions in LAI and vegetation height can be supported by earlier site-level field observations across various biomes (Shackleton and Scholes 2000, Wang et al 2001, Furley et al 2008, Bond-Lamberty and Gower 2008).
Table 2. 20th century average of annual difference (FIRE-ON minus FIRE-OFF) between FIRE-ON and FIRE-OFF simulations over global land.
| Variable |
Diff | Variable | Diff |
|---|---|---|---|
| Tas (°ºC) | +0.18 |
NLW (W m−2) | −1.31 |
| NSW (W m−2) | +0.23 | DSW (W m−2) | +0.39 |
| DLW (W m−2) | +0.39 | USW (W m−2) | +0.16 |
| SH (W m−2) | −0.11 | Lt (W m−2) | −2.69 |
| LH (W m−2) | −0.99 |
Lc (W m−2) | −1.05 |
| G (W m−2) | +0.02 | Ls (W m−2) | +2.75 |
| ULW (W m−2) | +1.70 |
LAI (m2 m−2) | −0.56 |
| SNR (W m−2) | −1.08 |
Veg. H (m) | −0.87 |
aground heat flux (G), downward incident shortwave radiation (DSW), upward surface reflected shortwave radiation (USW), surface net longwave radiation (NLW), LH's three components (vegetation transpiration (Lt), canopy evaporation (Lc), and soil evaporation (Ls)), leaf area index (LAI), vegetation height (Veg. H), and gross primary productivity (GPP); NSW = DSW − USW; NLW = DLW−ULW; LH = Lt + Lc + Ls; SNR = NSW + NLW bdifference passed the Student's t-test at the 0.05 significance level
Fire-induced damage in vegetation canopy significantly lowers the carbon input to the land ecosystems and allocated to vegetation tissues (figures S7(a) and (b)), and can further suppress vegetation growth and post-fire recovery of C/N pools and vegetation structure. Our estimated fire-induced changes in carbon cycle are in agreement with earlier global quantification studies (Li et al 2014, Yang et al 2015) and field observations (Wang et al 2001, Irvine et al 2007). Fire-induced changes in the N cycle can affect vegetation structure by changing the C cycle. Without considering fire's impact on N deposition and modeling the ash deposition (see section 2.2), even though fire-induced mortality tends to increase soil N pool, soil N availability is lower in FIRE-ON due to biomass and litter burning, lower N fixation (which is proportional to NPP in CLM4.5), and higher N leaching associated with fire-induced increases in runoff (Li and Lawrence 2017). The lower soil N availability leads to higher N limitation of photosynthesis (figure S7(c)) and slows the post-fire vegetation re-growth.
3.2. Impact on annual land surface air temperature and energy budget
The fire-induced changes within terrestrial ecosystems significantly warm the global land surface air by 0.18 °C over the 20th century (table 2). The quantified fire impact is higher than the impacts of irrigation (+0.015 °C, Sacks et al 2009) and land use and land cover change (–0.1 °C from Lawrence et al 2012, +0.008 from Findell et al 2007, current versus potential vegetation). With respect to the energy budget (equation (1)), fire decreases global average surface net radiation (–1.08 W m−2), sensible heat flux (–0.11 W m−2), and latent heat flux (–0.99 W m−2), and little increases ground heat (table 2). Among them, fire-induced changes in surface net radiation and latent heat are significant at the level of 0.05 based on the Student's t-test, and higher than the impact of land use and land cover change (–0.19 and –0.11 W m−2 from Lawrence et al 2012, and –0.14 and –0.24 W m−2 from Findell et al 2007). The estimated impact of fire on these energy fluxes is sign-consistent with earlier site-level field observations (Liu et al 2005).
Fire impacts are most clearly seen in the tropical savannas (figure 2). Some fields are also affected significantly over regions in southern Asia, central Asia, the mid-high latitude forests in the Northern Hemisphere, and tropical closed forests. Fire generally warms the surface air, and increases the upward surface longwave radiation and downward atmospheric longwave radiation, except for regions in central Asia. Their spatial patterns are similar. Fire generally decreases latent heat (figure 2(f)) and surface net radiation (figure 2(i)), and increases ground heat (figure 2(g)). In total, 27%, 32%, 22%, 31%, and 8% of land areas undergo a statistically significant fire-induced change in surface air temperature, surface net radiation, sensible heat flux, latent heat flux, and ground heat flux, respectively. The result that fire reduces latent heat over most post-fire regions (figure 2(f)) is supported by site-based observations (Amiro et al 1999, Neary et al 2005, Sun et al 2010).
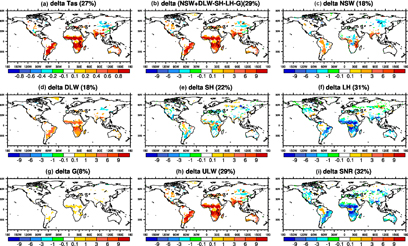
Figure 2 Same as figure 1, but for annual average surface air temperature (Tas, °C) and energy components (W m−2).
Download figure:
Standard image High-resolution imageAs shown in figure 3, fire-induced warming exhibits an upward trend for 1910–1940 and downward trend since ∼1940 (figure 3(a)). Fire-induced reduction in latent heat is enhanced before ∼1950, and waned thereafter (figure 3(b)). All of these trends are significant at the level of 0.05 based on the Mann–Kendall trend test. CESM simulates two periods of strong global land warming during the 20th century: 1910−1940 and since the 1970s (figure 3(a)), in agreement with the observations (Stocker et al 2013, figure S3). By changing global terrestrial ecosystems, fire intensifies the global land warming trend in the 1910−1940 period by 38% (trend: +0.019 °C yr−1 in FIRE-ON; +0.014 °C yr−1 in FIRE-OFF) (figure 3(a)). Fire also weakens both the significant upward trend in global land latent heat before ∼1950 and the downward trend from 1955 to ∼1985 by around one third (figure 3(b)), and strengthens the significant upward trend in downward atmospheric longwave radiation by 26% (figure 3(c)) and in upward surface longwave radiation by 39% (not shown) for the period of 1910−1940. For other time periods or other energy fluxes, fire's impact on the historical trend is small or sensitive to the selected start/end points of time series, or historical trend of the target variable is insignificant. The fire-induced weaker upward trend in latent heat and stronger upward trend in atmospheric downward longwave radiation together explain the fire-induced intensification in the early 20th century global land warming trend (figure 3).
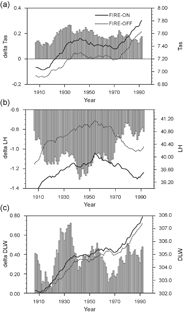
Figure 3 Temporal variability of FIRE-ON and FIRE-OFF simulations (lines) of (a) Tas (°C), (b) LH (W m−2), and (c) DLW (W m−2), and their difference (bars, FIRE-ON minus FIRE-OFF) over global land. A 15 year running mean is used.
Download figure:
Standard image High-resolution image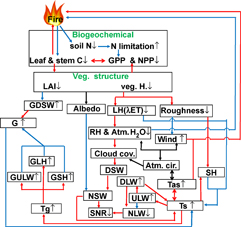
Figure 4 Schematic of fire's influence on land surface air temperature and energy budget for most regions. '↑' ('↓') after a variable indicates increase (decrease) in the variable due to fire; red (blue) arrow connecting two variables indicates a positive (negative) response; black arrow connecting two variables (without '↑'and '↓' after a variable) means that the sign of response (the sign of fire-induced change in the variable) is varied with region and environmental conditions; RH is relative humidity; Tg, GDSW, GLH, GULW and GSH are ground temperature, ground downward incident shortwave radiation, ground latent heat flux, ground upward longwave radiation, and ground sensible heat, respectively.
Download figure:
Standard image High-resolution image
The present study also investigates the reasons for the above fire impacts. Among the surface fluxes which contribute to the change of surface air temperature (equation (2)), fire-induced change in latent heat flux is much stronger than others for the global total (table 2) and in most locations (figures 2(b)−(g)). This indicates that fire-induced change in surface air temperature is mainly caused by fire-induced reduction in latent heat. However, the cooling in central Asia mostly results from fire-induced decreases in surface net shortwave radiation and downward atmospheric longwave radiation (figure S6, figures 2(c) and (d)). The warming over some grids in equatorial African rainforests is mainly attributed to fire-induced increase in net shortwave radiation (figure 2(c)).
Among the energy fluxes in equation (1), fire exerts the most obvious impacts on latent heat and surface net radiation (table 2 and figures 2(e), (f), (g) and (i)). In a companion study, Li and Lawrence (2017) investigated various pathways through which fire-induced changes within land ecosystems could modify evapotranspiration (i.e. latent heat), and concluded that the reduction in latent heat could mainly be attributed to fire-induced damage in vegetation canopy (LAI). The canopy damage decreases vegetation transpiration and canopy evaporation due to lower leaf area, fewer stomata, and less canopy interception and water storage, and increases soil evaporation by exposing more of the soil to the air and sunlight (consistent with fire-induced changes in LH's three components, figures S7(d)−(f)). The less rough surface due to fire-induced reduction in vegetation height increases aerodynamic resistance and leaf boundary resistance and thus would tend to decrease latent heat flux, but at the same time lower roughness can lead to higher leaf temperature (mainly due to a reduction in sensible heat with less turbulence) and wind speed which could act to decrease stomatal resistance and increase latent heat. The net impact of fire-induced change in vegetation height is small.
Fire-induced change in surface net radiation primarily responds to fire-induced change in upward surface longwave radiation (table 2, figures 2(c), (d), (h) and (i)). There is a positive feedback loop among changes in surface temperature, upward surface longwave radiation, and downward atmospheric longwave radiation due to fire. That is, fire-induced surface warming (figure S7(h)) enhances upward surface longwave radiation (figure 2(h)) and then downward atmospheric longwave radiation (figure 2(d)), which further provides more energy to warm land surface.
In addition, fire-induced change in annual surface net shortwave radiation (figure 2(c)) is mainly caused by fire-induced change in incident shortwave radiation (figure S7(i)) that responds to the fire-induced change in the coverage of low-level and mid-level clouds (figure S7(j)). Lower cloud coverage reflects less solar radiation and thus intensifies the incident solar radiation, and vice versa. The change in surface albedo due to fire can also affect the surface net shortwave radiation. Fire increases the surface albedo, except for regions in tropical savannas and southern Asia due to the dark soil color (Lawrence and Chase 2007) (figure S7(k)). The reduced surface net shortwave radiation in central Asia (figure 2(c)) is co-caused by fire-induced higher surface albedo and higher coverage of low-level and mid-level clouds (figures S7(j) and (k)).
4. Discussion
Using CESM1.2, we investigated the mechanisms related to fire's impact on global land surface air temperature and energy budget. As summarized in figure 4, from a global perspective, leaf and stem carbon pools are decreased due to biomass burning and fire-induced vegetation mortality, which leads to a significant reduction in vegetation canopy (LAI) and vegetation height. Fire-induced changes in vegetation structure decrease carbon input of land ecosystems that, in turn, suppresses recovery of vegetation structure in post-fire regions. Fire generally decreases latent heat flux mainly due to fire-induced damage in vegetation canopy, which is the primary reason for fire-induced increase in surface air temperature. Surface warming increases upward surface longwave radiation and further reduces the surface net radiation. Global fire impacts could be enhanced by three positive feedback loops: (1) fire-induced changes in vegetation structure and carbon cycle within terrestrial ecosystems, (2) fire-induced changes in surface temperature, upward surface longwave radiation, and downward atmospheric longwave radiation, and (3) fire and fire-induced hotter and drier surface air and higher wind speed. With respect to (3), lower surface air relative humidity and higher wind speed due to fire were identified in our companion paper (Li and Lawrence 2017).
Prior studies evaluated the impact of fire emissions, the other main pathway through which fire can affect climate and energy budget. Fire impacts through emitting trace gases and aerosols and through perturbing the terrestrial ecosystem states are very different. From a global perspective, the former leads to cooling over land, mainly by reducing net shortwave radiation (Ward et al 2012, Tosca et al 2013, Jiang et al 2016), while the latter leads to warming, mainly by significantly reducing latent heat flux (explored in this study). Many earlier studies have highlighted the global and regional impact of the latter on regional and global carbon cycle (Bond-Lamberty et al 2007, Li et al 2014, Yang et al 2015, and references therein). This study shows that, even in a non-carbon view, the latter should be considered when one estimates the global fire impact, and its modeling should be included in Earth system models.
Two main sources of uncertainty in our estimates are worth noting. First, model biases in CESM will affect our estimates of fire impacts. For example, the wet bias in North American boreal forests leads to a big underestimation of burned area and therefore fire impacts. Second, the vegetation distribution in our CESM simulations is prescribed, although other ecosystem characteristics (e.g. LAI, biomass, vegetation height, and carbon fluxes) are dynamically simulated. Therefore, the effect of fire on climate and surface energy budget through changing vegetation distribution is not accounted for in our present estimates, as did most prior global quantitative studies of fire impact. Prior studies (San José et al 1998, Murphy and Bowman 2012) reported that fire could limit tree cover in tropical savannas. Not considering fire's impact on vegetation distribution likely results in an underestimation of fire-induced warming and decrease in latent heat in this region given that higher tree coverage in the tropics in FIRE-OFF tends to cool the land and increase latent heat based on earlier studies of vegetation-climate interaction (Bonan 2008, Levis 2010). On the other hand, in the North American boreal forests, Rogers and Randerson (2011) reported that ignoring competition between different vegetation types would lead to faster vegetation re-growth and underestimate the increase in albedo due to non-peat fires (so fire-induced surface cooling).
The two factors (the wet bias in CESM and ignoring the impact of fire-induced changes in vegetation distribution) may explain why the present study does not reproduce the fire-induced significant cooling in the North American boreal forests shown in the regional study of Rogers et al (2013). Rogers et al (2013) used the observed present-day burned area, and the estimated fire-induced change in vegetation distribution that was derived by attributing all changes in land cover to fire. For a global study, a Dynamic Global Vegetation Models (DGVM) is the most suitable tool for investigations into it because climate, CO2, and land use may also result in land cover change. However, existing DGVMs exhibited a big difference in their estimates of fire effects on regional and global vegetation distribution (Bond et al 2005, Scheiter and Higgins 2009, Poulter et al 2015). More observations and understanding of the related processes are required to lower the uncertainties before DGVMs can be reliably used to quantify fire impact on climate.
Earlier researches presented an obvious albedo change over burnt sites in the North American boreal forest (Randerson et al 2006, Amiro et al 2006), which is not reproduced in the present study. In addition to the large underestimation of burned area in this region in CESM and lack of representing fire's impacts on vegetation distribution (see Para. 3 in this section), this discrepancy may also result from the different spatial scales of CESM and field experiments. In CESM, fire's impacts on ecosystems occur on PFT or column (all vegetation PFTs share a column) level, while in the real world they are often over some sub-grid patches. If the total area of the burnt patches is small, when the PFT/column-average are calculated as in CESM, fire's impacts on ecosystems and induced changes in energy fluxes and climate will be weakened and may become statistically insignificant, and even have the opposite-sign if fire's indirect impacts outside the patches are sign-opposite and strong. This is an ongoing problem for comparison of ESM results with field studies (e.g. Shao et al 2013).
Acknowledgments
This study is co-supported by the National Natural Science Foundation of China (41475099), the State Key Project for Basic Research Program of China (2010CB951801), and the China Scholarship Council. DML is supported by the U.S. Department of Energy (DE-FC03-97ER62402/A0101). BBL was supported as part of the Accelerated Climate Modeling for Energy (ACME) project, funded by the U.S. Department of Energy, Office of Science, Office of Biological and Environmental Research. We are grateful to Z-D Lin and F Zhang from the Institute of Atmospheric Physics, Chinese Academy of Sciences, R E Dickinson from the University of Texas at Austin, and E. Kluzek, S Levis (Now in the Climate Corporation), and P Lawrence from NCAR, and Y-Q Jiang from the Nanjing University for helpful discussions. We also thank two anonymous reviewers for their valuable comments and suggestions, editors for handling this paper, and GFED group for making GFED4 and GFED4s global fire products available. Computing resources were provided by the NCAR, which is sponsored by the National Science Foundation.