
Abstract
The thermomechanical tests were carried out on the composite materials under different laying methods (thickness and angle) based on cone calorimetry, high temperature oxygen index method, vertical/horizontal combustion method and high temperature mechanics test method. The results show that the peak values of ignition time and heat release rate of carbon fiber/epoxy composite increase with the increase of the thickness of the layer. Time to peak is advanced. The mass loss rate increases. The high temperature oxygen index of the material increases. The vertical/horizontal combustion rate decreases. Time to reach peak production rate of CO/CO2 is shortened. The peak value of smoke production rate decrease. The time needed to reach the peak of smoke production rate is longer. Total smoke emission increased. The flue gas release process lasts longer. The function model of mass loss rate and heat radiation intensity is obtained. The vaporization heat of carbon fiber/epoxy composite with different thickness was calculated. The effects of laying angle on oxygen index, smoke production rate and CO/CO2 parameters are not obvious. When the laying angle [0°/90°] is the same as the fire spreading direction, the vertical/horizontal burning speed is higher. The difference between the laying angle [±45°] and the flame spreading direction is beneficial to the smoke emission from the bottom layer. Total smoke emission increased. The mechanical properties of materials at high temperature are related to the laying angle. When the temperature is 150 °C, the mechanical properties of the material are lower than that of 25 °C. The fitting functions of high temperature mechanics in the range of 25 °C−150 °C were obtained. It can predict the mechanical properties of materials at different temperature points in this temperature range.
Export citation and abstract BibTeX RIS

Original content from this work may be used under the terms of the Creative Commons Attribution 4.0 licence. Any further distribution of this work must maintain attribution to the author(s) and the title of the work, journal citation and DOI.
1. Introdution
Carbon fiber/epoxy composite has the advantages of light weight and high strength [1]. It has excellent thermal stability and good fatigue resistance. It has strong designability [2, 3]. Carbon fiber/epoxy composite is the main structural material in the field of aviation [4, 5]. It is more and more applied to the main components, load-bearing structures, secondary structural materials and structural components of aerospace vehicles [6, 7]. Especially in the field of general aviation, the amount of composite materials used in many small airplanes is even more than 90% of the structural weight [8]. However, when the epoxy matrix in the carbon fiber/epoxy composite is heated, it will decompose the combustible gas [9–11]. It will cause fire to the aircraft. Laying design is an important part of the structural design of carbon fiber/epoxy composite. The strength, rigidity and stability of the material are closely related to the laying method [12]. The important content of laying design is to define the thickness and angle of laying [13]. The change of the laying method has an impact on the performance of carbon fiber/epoxy composite in high temperature environment. Therefore, it is necessary to study the influence of different laying methods on the comprehensive fire performance of carbon fiber/epoxy composite.
A series of researches on the properties of carbon fiber/epoxy composites have been carried out by scholars all over the world. Ding takes carbon fiber/epoxy composite automobile front floor as the research object. The mechanical properties of resin matrix and carbon fiber were studied. The best curing process of tensile strength, bending strength, impact strength and glass transition temperature was obtained. The optimal laying method was found [14]. Fan Wei et al studied the thermal oxygen aging properties of 3D braided carbon fiber/epoxy composite [15]. It was found that the degradation of the mechanical properties of the composite is due to the oxidation chain break and the degradation of the interface adhesion caused by the thermal oxygen aging of the matrix resin. Yang studied the hygroscopic swelling behavior of carbon fiber/epoxy composite. It was found that the moisture absorption of carbon fiber/epoxy composite at high temperature was significantly higher than that at room temperature [16]. T Shimokawa tested the change rule of tensile and compressive properties of carbon fiber composite laminates with and without holes at different temperatures [17]. B Fiedler established the finite element model. The failure process of carbon fiber composite matrix was analyzed. The prediction results of the finite element model are compared with the experimental results. The feasibility of the finite element model is verified [18]. Maria wladyka przybyla et al studied the flame retardancy of epoxy resin containing different halogen-free flame retardants. It is found that CNTs can effectively reduce the total heat release rate of the composite [19].
To sum up, the research of carbon fiber/epoxy composite by scholars in various countries mainly focuses on the hot and Humid Aging and the mechanical property test at room temperature. The research on the flame retardancy of epoxy resin mainly focuses on the addition of different flame retardants to epoxy resin. There are few studies on the influence of different laying methods on the fire performance of carbon fiber/epoxy composite.
In this paper, Fire tetardant test and tensile test of carbon fiber/epoxy composites with different laying methods (thickness and angle) were carried our by using various experimental methods. The fire behavior of carbon fiber/epoxy composites were evaluated comprehensively. It provides theoretical basis for the design of carbon fiber/epoxy composite laying and the determination of airworthiness criterion of aircraft.
2. Materials and methods
2.1. Materials
The raw material of the sample used in this paper is a typical carbon fiber/epoxy composite used in an electric light sport aircraft. Carbon fiber is reinforcement. It is polyacrylonitrile based carbon fiber, and its model is T300–3000 [18]. The performance parameters of carbon fiber as reinforcement are shown in table 1. Epoxy matrix is the matrix material. It is made of the epoxy resin (liquid) araldity1637-sp and hardener yb3492 according to the mass ratio of 100:34. The carbon fiber and epoxy resin of the carbon fiber/epoxy composite are made by the wet forming process.
Table 1. Performance parameters of carbon fiber.
| Model | Tow | Tensile strength(kgf mm−2) | Tensile modulus(Mpa) | Stretching rate(%) |
|---|---|---|---|---|
| T300–3 K | 3000 | 360 | 230 | 1.5 |
2.2. Preparation of tests samples
The carbon fiber/epoxy composites with different laying methods (thickness and angle) were prepared by changing the laying process.
Table 2 shows the laying method (thickness and angle) of experimental materials used in cone calorimeter experiment, vertical/horizontal combustion experiment and high temperature oxygen index experiment.
Table 2. Specifications of test samples with different laying methods.
| Test samples | Laying angle | Thickness/mm |
|---|---|---|
| A1 | [(0°/90°)]8 | 1.82 |
| A2 | [(0°/90°)]6 | 1.32 |
| A3 | [(0°/90°)]4 | 0.97 |
| A4 | [(0°/90°)]2 | 0.60 |
| B1 | [(0°/90°)/(±45°)]4 | 1.82 |
| B2 | [(0°/90°)4/(±45°)4] | 1.82 |
| B3 | [(0°/90°)6/(±45°)2] | 1.82 |
| B4 | [(0°/90°)2/(±45°)6] | 1.82 |
A1–A4, B1–B4 used in the experiment are carbon fiber/epoxy bidirectional woven fabrics. A1–A4 are experimental samples with the same laying angle and different laying thickness. B1–B4 are are experimental samples with the same laying thickness and different laying angle. The proportion of epoxy resin and carbon fiber used in all samples are the same.
2.3. Thermomechanical tests
2.3.1. Fire retardant test
2.3.1.1. Cone calorimeter
The experiment was carried out with the FTT-cone-228 cone calorimeter. The ignition time, heat release rate and mass loss rate of the test samples under the five heat radiation intensities of 25 kW·m−2, 30 kW·m−2, 35 kW·m−2, 45 kW·m−2 and 50 kW·m−2 were measured based on the principle of oxygen consumption [20]. The effects of different laying methods on the combustion performance parameters of the test samples were analyzed. The test samples in table 2 are selected for the experiment. The test samples size are 100 mm × 100 mm. Each experiment was conducted three times, and the test results were averaged.
2.3.1.2. High temperature oxygen index method
FTT-OL-1402072 oxygen index tester was used to measure the high temperature oxygen index and limit oxygen index of the test samples [21]. The influence of different laying methods on the fire spread characteristics of carbon fiber/epoxy composite was analyzed. Use the test samples in table 2 was selected for the experiment. The size and specification of the test sample shall be made according to the standard. It is made into 150 mm × 10 mm. The critical oxygen index value was found for each sample, and the oxygen index value was used for three consecutive experiments. After the results are consistent, the final experimental results are determined. Ensure the accuracy of the experimental results.
2.3.1.3. Vertical/horizontal combustion test
CZF-5 vertical/horizontal combustion tester was used to test the vertical/horizontal combustion rate of the test samples [22]. The effects of different laying methods on the propagation characteristics of carbon fiber/epoxy composites in different directions were analyzed. The experiment was carried out with the test samples in table 2. The size and specification of the test samples shall be made according to the standard. It is made into 150 mm × 10 mm. Each group was tested three times.
Figure 1 shows the sample geometry for the high temperature oxygen index experiment and the vertical/horizontal combustion experiment.
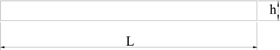
Figure 1. Sample geometry of high temperature oxygen index test and vertical/horizontal combustion test.
Download figure:
Standard image High-resolution image2.3.2. Tensile test
The high temperature mechanical testing machine developed independently was used. Table 3 shows the performance parameters of the high temperature mechanical testing machine. The carbon fiber/epoxy bidirectional woven fabric (B1 and B3 in table 2), the fuselage frame of electric light aircraft (carbon fiber/epoxy bidirectional woven fabric) and the material of instrument panel (carbon fiber/epoxy prepreg) were tested by microcomputer control. The mechanical properties of carbon fiber/epoxy composites with different laying angles were tested at high temperature.
Table 3. Specific parameters of microcomputer controlled high temperature testing machine.
| Experimental equipment | Parameter | Parameter value |
|---|---|---|
| Microcomputer controlled high temperature testing machine | Measuring range | 0.5–50kN |
| Stretching space | 600 mm | |
| Maximum load | 50kN | |
| Speed range | 0.01–500 mm min−1 |
The experiment was carried out at 25 °C, 50 °C, 100 °C and 150 °C. Three experiments were carried out at each temperature point. The experimental results were averaged. Compared with the mechanical properties at room temperature [23]. The effect of temperature on the mechanical properties of carbon fiber/epoxy composite with the same thickness and different laying angle was analyzed. At the same time, the high temperature mechanical properties of fuselage frame materials and instrument panel materials used in electric light aircraft were compared. Figure 2 shows the equipment appearance.
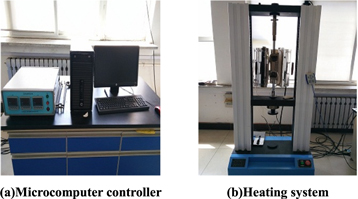
Figure 2. Temperature control system.
Download figure:
Standard image High-resolution imageThe fuselage frame material and instrument panel material (carbon fiber/epoxy prepreg) are numbered T1 and D1 for study and analysis. Table 4 shows the specific corresponding numbers. Figure 3 shows the geometry of the sample.
Table 4. High temperature mechanical test samples.
| Sample number | Nature | Model | Laying method | Layer number |
|---|---|---|---|---|
| B1 | Custom carbon cloth | T300-3K fabric/epoxy | [(0 °/90 °)/(±45°)]4 | 8 |
| B3 | Custom carbon cloth | T300-3K fabric/epoxy | [(0 °/90 °)6/(±45°)2] | 8 |
| T1 | Fuselage frame | T300-3K fabric/epoxy | [(0 °/90 °)/±45°]2[±45 °/(0 °/90 °)]2 | 8 |
| D1 | Instrument panel | T300-3K fabric/epoxy,UIN46200 | [(±45°)/0 °/45 °/0 °/−45 °/0 °] | 6 |
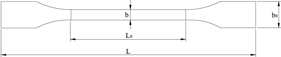
Figure 3. Geometry of high temperature mechanical test sample.
Download figure:
Standard image High-resolution image3. Results and discussion
3.1. High temperature oxygen index
The high temperature oxygen index is the main parameter for analyzing the fire propagation characteristics of combustible materials. Due to the inherently high flammability of epoxy resin matrices in carbon fiber/epoxy composites, the rapid spread of flame can cause serious safety problems.This can cause serious accidents. The flame will spread rapidly because of the inherent high flammability. This may cause serious accidents.
The oxygen index is the minimum oxygen volume fraction required for a material to maintain flaming combustion [24]. The research on the oxygen index of materials mainly focuses on the normal temperature oxygen index. It is impossible to truly characterize the true fire behavior of materials in high temperature fires.Therefore, in addition to the normal temperature oxygen index measurement of different experimental samples, the high temperature oxygen index of the experimental samples was measured at an ambient temperature of 220 °C.
As can be seen from tables 5 and 6. In the high temperature oxygen index experiment, with the increase of temperature, the value of oxygen index of each sample decreased. This is mainly due to the fact that the material itself is preheated by temperature in a high temperature environment. The ignition point is reduced. This makes the material more likely to ignite. For the same sample, the high temperature oxygen index is lower than the normal temperature oxygen index.
Table 5. Normal temperature oxygen index and high temperature oxygen index of test samples with different thicknesses.
| Temperature | Laying method | Thickness | Room temperature | 50 °C | 90 °C | 150 °C | 220 °C |
|---|---|---|---|---|---|---|---|
| A1 | [(0°/90°0°]8 | 1.82 | 23.1 | 20.1 | 18.7 | 17.5 | 15.7 |
| A2 | [(0°/90°]6 | 1.32 | 22.8 | 19.7 | 18.3 | 17.1 | 15.3 |
| A3 | [(0°/90°]4 | 0.97 | 22.5 | 19.3 | 18.1 | 16.7 | 15.0 |
| A4 | [(0°/90°]2 | 0.6 | 22.3 | 19.1 | 17.8 | 16.3 | 14.6 |
Table 6. Normal temperature oxygen index and high temperature oxygen index of test samples with different laying angles.
| Temperature | laying method | Thickness | Room temperature | 50 °C | 90 °C | 150 °C | 220 °C |
|---|---|---|---|---|---|---|---|
| B1 | [(0°/90°)/(±45°)]4 | 1.82 | 23.3 | 20.1 | 18.7 | 17.5 | 15.7 |
| B2 | [(0°/90°)4/(±45°)4] | 1.82 | 23.2 | 20.1 | 18.8 | 17.5 | 15.7 |
| B3 | [(0°/90°)6/(±45°)2] | 1.82 | 23.3 | 19.9 | 18.6 | 17.4 | 15.5 |
| B4 | [(0°/90°)2/(±45°)6] | 1.82 | 23.2 | 20.0 | 18.6 | 17.4 | 15.6 |
The value of oxygen index of the test samples decreased in the high temperarure oxygen index experiment with the increase of temperature. This is mainly due to the material itself is preheated by high temperature. As a result, the ignition point of the experimental sample is reduced and it is easier to be ignited. The high temperature oxygen index is lower than the normal temperature oxygen index for the same sample.The specific data are given in tables 5 and 6.
Figure 4 shows the normal temperature oxygen index and high temperature oxygen index of four test samples (A1–A4) with different thicknesses. Figure 5 shows the normal temperature oxygen index and high temperature oxygen index of four test samples (B1–B4) with different laying angles
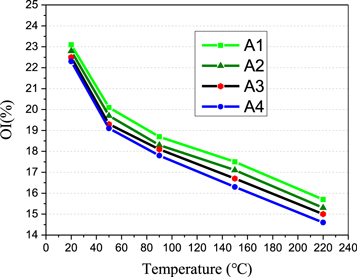
Figure 4. Relationship between laying thickness and high temperature oxygen index.
Download figure:
Standard image High-resolution image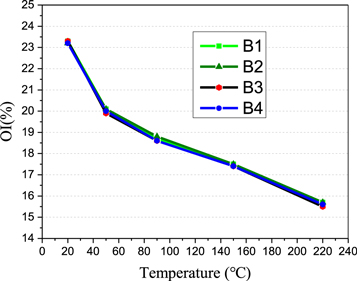
Figure 5. Relationship between laying angle and high temperature oxygen index.
Download figure:
Standard image High-resolution imageThe normal temperature oxygen index and high temperature oxygen index of the test samples increased with the increase of the thickness of the laminate. The fire damage of the residues of carbon fiber/epoxy composites with different thicknesses was further studied by using electronic scanning electron microscopy after the oxygen index test to explain this interesting phenomenon.
Figure 6 shows the morphology of two experimental samples (A1 and A4) with large differences in thickness were observed after high temperature oxygen index (220 °C) using scanning electron microscopy (SEM). This image is a 500 times magnified micrograph. The enlarged topographic image was analyzed. The larger thickness of A1 produced more dense and distinct carbon layer after combustion due to the greater heat capacity of the material [25]. A remarkable porous structure was formed. This structure is due to the fact that the epoxy resin matrix absorbs heat and conducts to the inside after being heated. The heat is constantly accumulating. The chemical bond on the main chain of the epoxy resin matrix is broken. The aromatic ring on the epoxy resin reacts with some volatiles [26]. It is retained in the form of carbon.A carbon layer is formed [27, 28]. The porous carbon structure prevents pyrolysis of potentially combustible materials. At the same time, the presence of the carbon layer can also reduce the heat and mass transfer of volatiles into the combustion zone [29]. This will inhibit combustion intensity. The epoxy resin matrix participates in the char formation process during the combustion process. A large number of completely enclosed honeycomb structures are formed. It can effectively prevent oxygen from diffusing to the surface of the epoxy resin substrate. The thermal conductivity of the solid carbon formed is only 0.17 W·m−1·K−1 [28]. The combustible gas and liquid vapor that hinder pyrolysis are diffused into the combustion zone due to the exist of the solid carbon. At the same time, the conduction of heat from the combustion zone to the epoxy matrix is limited by the solid carbon. The carbon layer mainly affects the self extinguishing behavior of carbon fiber/epoxy composites. Therefore, the thicker A1 can not continue to burn and has a higher oxygen index.
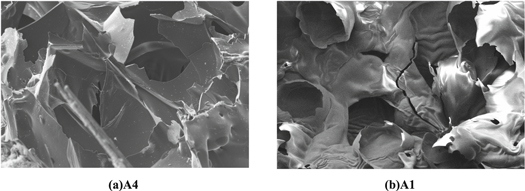
Figure 6. Microstructure of material after high temperature oxygen index test (220 °C).
Download figure:
Standard image High-resolution imageThe formation of the carbon layer is consistent with previous studies. Previous studies have shown that if polymer and polymer composites have a stronger ability to form carbon layers in fires, their oxygen index values increase [29]. The material is less susceptible to ignition. The oxygen index of the material increases. The oxygen index increases as the thickness of the material increases.
Table 6 shows that .the oxygen index (high temperature oxygen index and normal temperature oxygen index) of each test sample has the same thickness and different laying angles is not much different.This indicates that the effect of the laying angle on the oxygen index of the material is not significant.
3.2. Vertical/horizontal burning rate
The vertical/horizontal burning rate is the main parameter for analyzing the fire propagation characteristics of combustible materials.The rate at which a flame propagates over the surface of a combustible material is a key factor in flame growth and spread [30].
Table 7 shows that the vertical burning rate of all the test samples is greater than the horizontal burning rate. This is due to the fact that the ignition source for the vertical combustion experiment is located at the lower end of the material. This will cause the upper material to be fully preheated during combustion. It makes the material more easily ignited and the flame spread faster. Thus, the vertical flame spread is enhanced.
Table 7. Vertical/horizontal burning rate of test samples.
| Temperature | laying method | Thickness | Horizontal burning rate/mm/min | Vertical burning rate/mm/min |
|---|---|---|---|---|
| A1 | [(0°/90°]8 | 1.82 | 20.59 | 125.01 |
| A2 | [(0°/90°]6 | 1.32 | 21.09 | 127.23 |
| A3 | [(0°/90°]4 | 0.97 | 23.58 | 129.73 |
| A4 | [(0°/90°]2 | 0.6 | 25.36 | 131.38 |
| B1 | [(0°/90°)/(±45°)]4 | 1.82 | 18 | 120 |
| B2 | [(0°/90°)4/(±45°)4] | 1.82 | 18.62 | 115.07 |
| B3 | [(0°/90°)6/(±45°)2] | 1.82 | 19.5 | 129.23 |
| B4 | [(0°/90°)2/(±45°)6] | 1.82 | 16.23 | 98.82 |
The vertical/horizontal combustion rate decreases with the increase of thickness. This is because the heat capacity of the material increases with the increase of the thickness of the material. The increase of thermal capacity prolongs the time tothe pyrolysis temperature of epoxy resin matrix [23]. The vertical/horizontal combustion rate is reduced.
The vertical/horizontal burning rate of B3 is the largest in the test samples with different laying angles. The vertical/horizontal burning rate of B4 is the smallest. Comparing the four materials, we can know that B3 has the most layers with the angle of [0°/90°]. B4 has the least number of layers with a lay angle of [0°/90°]. When the spread angle [0°/90°] is the same as the vertical/horizontal spread direction of flame, it is more conducive to flame spread. The vertical/horizontal burning rate of the material is higher when the number of layers of the laying angle [0°/90°] is more. When (±45°) is more, the direction of vertical/horizontal flame spread of carbon fiber bundles is 45°. A certain angle is formed between carbon fiber tow and flame spreading direction. This will hinder combustion. The samples of B3 and B4 after vertical/horizontal combustion experiments were selected and observed after being magnified 500 times by electron microscope. It can be seen that the carbon fiber tow after combustion can well block the spread of combustion. Figure 7 shows the morphology of the tow. The combustion rate will be restrained and influenced by the angle of carbon fiber tow.
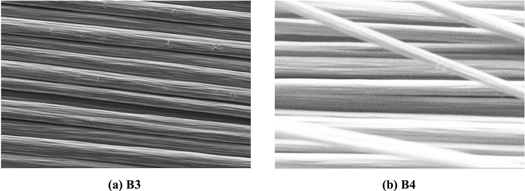
Figure 7. Microscopic morphology of carbon fiber tow after combustion.
Download figure:
Standard image High-resolution image3.3. Smoke production rate and total smoke production
The evaluation indexes of smoke hazards in fire are mainly smoke temperature, visibility and smoke toxicity. Visibility affects people's escape and firefighters' rescue directly. However, the emission of smoke reduces the visibility greatly [31].
Figure 8 shows the smoke production rate and total smoke production curve of carbon fiber/epoxy composites with different laying thickness of 35 kW·m−2.
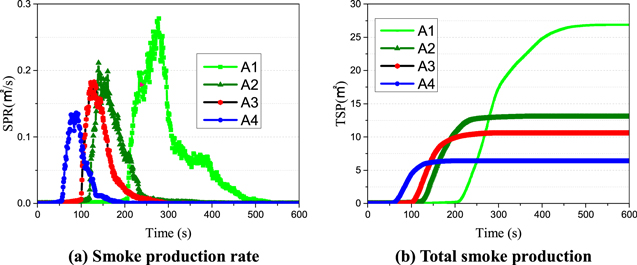
Figure 8. Smoke production rate and total smoke production curve of test samples (A1–A4) with different laying thickness.
Download figure:
Standard image High-resolution imageFigure 8 shows that the smoke production rate curves of A1, A2, A3 and A4 samples with different laying thickness all show an obvious peak value under the same thermal radiation intensity. This is because the epoxy resin matrix in the material is heated to decompose combustible volatile gases. It is ignited and produces smoke when the gas concentration reaches a certain value. The peak of smoke production rate is reached after a period of time.
The time to peak is longer with the increase of laying thickness. This is because the increase of the thickness of the experimental sample hinders the pyrolysis of the underlying material. As the thickness increases, the number of carbon fiber layers increases, and the carbon fiber tow has an effect on the heat and mass transfer of material combustion. The time of smoking was prolonged. The dense structure of carbon fiber bundles has an obvious inhibitory effect on the generation of flue gas.
The highest total smoke emission was found in the thicker sample A1. This is mainly due to the maximum mass of combustibles in the material, resulting in the maximum total smoke emission.
Figure 9 shows the smoke production rate and total smoke production curve of carbon fiber/epoxy composite with different laying angles when the heat radiation flux is 35 kW·m−2. The smoke production rate curves of the test samples B1, B2, B3 and B4 all show an obvious peak under the same thermal radiation condition. The time to peak is almost the same. Different laying angles have no significant effect on the smoke production rate of carbon fiber/epoxy composites. The total smoke production of B4 is the largest, and the total smoke production of B3 is the smallest. The total smoke production of the test samples B1 and B2 is almost the same. The test samples with different laying angles are all composed of the laying modes [0°/90°] and [±45°]. The carbon fiber/epoxy composite with two kinds of laying methods showed obvious delamination after combustion. The epoxy resin was exhausted. The combustion reaction of carbon fiber did not take place. Compared with the test samples of [0°/90°] laying angle, [±45°] laying materials scatter carbon fiber bundles after combustion reaction. The structural integrity and mechanical properties of the samples were lost. We can see that the mass of the test samples B1, B2, B3 and B4 are almost the same by comparing the laying methods of the four materials. The number of laying with an angle of [±45°] of the test sample B3 is the least. The number of laying with an angle of [±45°] of the test sample B4 is the largest. The results show that the dispersion of carbon fiber bundles after combustion is more conducive to the emission of smoke from the bottom layer, which is the reason why the total smoke emission of the test samples is more.
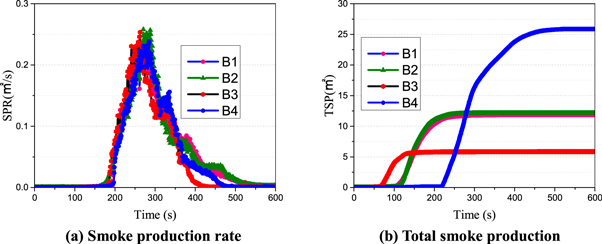
Figure 9. Smoke production rate and total smoke production curve of experimental samples (B1–B4) with different laying angle.
Download figure:
Standard image High-resolution imageThe combustion products of polymer materials contain a lot of toxic gases. CO and CO2 are the main gases that cause death in fire [32, 33]. CO is the most toxic and concentrated gas in fire. CO2 plays a major role in aggravating toxicity. Table 8 shows the CO and CO2 production data of carbon fiber/epoxy composite with different laying methods when the thermal radiation intensity is 35 kW·m−2.
Table 8. CO and CO2 production of carbon fiber/epoxy composites with different laying methods.
| Experimental sample | CO | CO2 | ||
|---|---|---|---|---|
| Peak/g/s | Peak time/s | Peak/g/s | Peak time/s | |
| A1 | 0.009024 | 80 | 0.253196 | 80 |
| A2 | 0.010943 | 43 | 0.241372 | 45 |
| A3 | 0.009430 | 21 | 0.195026 | 22 |
| A4 | 0.010695 | 17 | 0.156893 | 18 |
| B1 | 0.008543 | 93 | 0.257616 | 93 |
| B2 | 0.008241 | 93 | 0.247994 | 95 |
| B3 | 0.008070 | 81 | 0.238518 | 82 |
| B4 | 0.008396 | 85 | 0.244924 | 86 |
Table 8 shows the CO2 production rate of the same material is greater than that of CO. The time CO2 production rate to peak time is not earlier than CO. This is because CO is an important intermediate product in the combustion process of hydrocarbon fuel. All the carbon initially present in the fuel will form CO. CO2 or H2O will eventually be generated with the continuous combustion reaction. The CO production rate does not change much, and the CO2 production rate decreases with the decrease of laying thickness under the same thermal radiation intensity. The time to peak production rate of CO and CO2 is shortened. This is because of the fact that the smaller the thickness of the material is, the easier it is for the bottom material to carry out the complete combustion reaction in a shorter time. The parameters of CO and CO2 of different laying angle do not change much. Therefore, the influence of laying angle on CO and CO2 is not obvious.
3.4. Combustion characteristics
3.4.1. Ignition time of composite materials with different laying methods
Table 9 shows the average ignition time (TTI) of the test samples at different thermal radiation intensities.
Table 9. Average ignition time of test samples.
| Test samples | Thermal radiation intensity/kW·m−2 | ||||
|---|---|---|---|---|---|
| 25 | 30 | 35 | 40 | 50 | |
| A1 | 140 | 125 | 111 | 98 | 83 |
| A2 | 123 | 111 | 100 | 89 | 70 |
| A3 | 101 | 90 | 80 | 71 | 58 |
| A4 | 71 | 62 | 50 | 42 | 35 |
| B1 | 139 | 123 | 111 | 97 | 83 |
| B2 | 138 | 122 | 109 | 96 | 80 |
| B3 | 139 | 125 | 110 | 97 | 85 |
| B4 | 137 | 122 | 108 | 95 | 82 |
Table 9 shows that the ignition time of the test samples is shortened with the increase of thermal radiation intensity under different thermal radiation. This is because the epoxy resin matrix in the carbon fiber/epoxy composite is thermally decomposed into a flammable volatile gas. It is ignited when the concentration of flammable gas reaches a certain value. The time for the pyrolysis reaction of the material is advanced as the heat radiation intensity increases. And the generation of the flammable volatile gas is accelerated. The ignition time of the material is shortened.
Figure 10 shows the relationship between the carbon fiber/epoxy composite laying and ignition time. Figure 10(a) shows that the thickness of the layer has a certain influence on the ignition time of the carbon fiber/epoxy composite. Under the same heat radiation intensity, the ignition time of A1 is the longest and A4 has the shortest ignition time under the same heat radiation. The ignition time of the materials increases with the increase of the laying thickness due to the increase of heat capacity. The time for the epoxy resin matrix to reach pyrolysis temperature is prolonged [25]. So the ignition time is delayed.
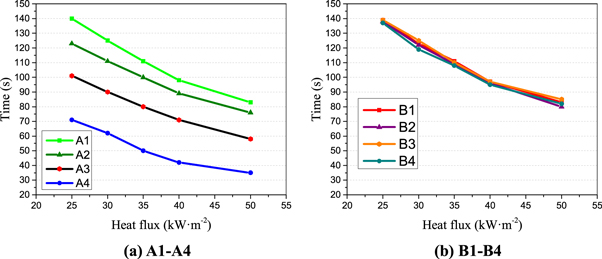
Figure 10. Relationship between ignition time and thermal radiation intensity of different test samples.
Download figure:
Standard image High-resolution imageFigure 10(b) and table 9 shows the ignition time of the test samples with different laying angles does not show regularity under the same thermal radiation intensity. The effect of different laying angle on the ignition time of carbon fiber/epoxy composite is not obvious.
3.4.2. Heat release rate of composite materials with different laying methods
Figure 11 shows the heat release rate curve of carbon fiber/epoxy composite with different laying methods under the heat radiation intensity of 35 kW·m−2.
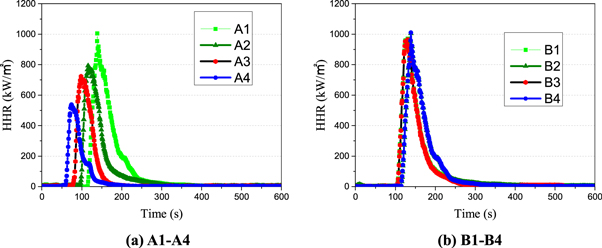
Figure 11. Heat release rate curves of composite materials with different laying methods.
Download figure:
Standard image High-resolution imageFigure 11 shows the heat release rate curves of the experimental samples all show an obvious peak under the same heat radiation intensity, This is because the epoxy matrix in the material is heated to decompose combustible gas. It is ignited to release heat when the gas concentration reaches a certain value. The peak of heat release rate is reached after a period of time.
Table 10 shows the peak HRR of carbon fiber/epoxy composite with different laying methods and the time to reach the peak.
Table 10. Peak heat release rate and the time to peak value of the test samples.
| Test sample | Thermal radiation intensity/kW·m−2 | |||||||||
|---|---|---|---|---|---|---|---|---|---|---|
| 25 | 30 | 35 | 40 | 50 | ||||||
| P-HRR | Time | P-HRR | Time | P-HRR | Time | P-HRR | Time | P-HRR | Time | |
| A1 | 791.19 | 174 | 899.22 | 163 | 1021.67 | 150 | 1137.25 | 130 | 1259.52 | 112 |
| A2 | 568.66 | 155 | 692.35 | 138 | 801.89 | 125 | 930.73 | 112 | 1074.17 | 100 |
| A3 | 497.55 | 132 | 630.25 | 118 | 750.64 | 102 | 810.99 | 90 | 885.34 | 83 |
| A4 | 330.63 | 100 | 436.28 | 95 | 550.61 | 85 | 600.13 | 73 | 635.66 | 58 |
| B1 | 790.81 | 174 | 890.36 | 162 | 1023.21 | 151 | 1136.32 | 130 | 1250.77 | 111 |
| B2 | 796.24 | 170 | 888.15 | 160 | 1001.02 | 152 | 1142.69 | 132 | 1246.42 | 110 |
| B3 | 792.22 | 175 | 901.36 | 165 | 998.19 | 156 | 1132.39 | 133 | 1226.45 | 113 |
| B4 | 805.79 | 176 | 896.20 | 163 | 999.32 | 153 | 1143.56 | 132 | 1219.76 | 115 |
The peak HRR of the test samples increases with the increase of the thermal radiation intensity under different thermal radiation intensities. The time required to reach the peak is advanced. This is because higher thermal radiation intensity can provide energy for the pyrolysis of epoxy resin matrix faster. This makes the time of material pyrolysis earlier [25].
The peak HRR of material A1 is the largest and the time to reach the peak HHR is the longest at the same radiation intensity. The peak HRR of material A4 is the smallest and the time to reach the peak HHR is the shortest. The results show that the heat release rate of carbon fiber/epoxy composite is affected by the thickness of different layers. The peak HRR of carbon fiber/epoxy composite increases, and the time to reach the peak value increases with the increase of layer thickness.
The heat release rate of the test samples with same thickness and different laying angles did not show regularity. The results show that the effect of different laying angle on the heat release rate of carbon fiber/epoxy composite is not obvious.
3.4.3. Mass loss rate of composite materials with different laying methods
Mass loss is an important parameter of fire behavior. The content and decomposition rate of the organic components of the composite can be determined in the process of fire by measuring the weight change of the samples [34].
Figure 12 shows the mass loss rate (MLR) of carbon fiber/epoxy composite with different laying methods at the thermal radiation intensity of 35 kW·m−2. It can be seen that the mass loss of the experimental samples has gone through three obvious stages. Less volatile is released due to the radiation time of material is shorter and the temperature is low in stage I. The concentration of pyrolysis gas can not reach the combustion condition. The quality has not changed significantly. In stage II, the test sample enters the combustion stage. The epoxy matrix is pyrolyzed. The material will burn with flame due to the combustible volatile gas is ignited. The mass loss rate is accelerated obviously. In stage III, combustible materials are exhausted. The mass loss rate reaches the minimum value and remains stable all the time. Most of the combustible materials are consumed after combustion and pyrolysis at this time. The mass loss of the samples is mainly due to the pyrolysis of the epoxy matrix. This can be reflected in the peak value of mass loss rate.
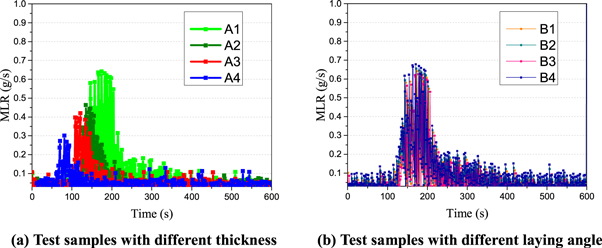
Figure 12. Mass loss rate curve of test samples with different laying method under the same thermal radiation intensity (35 kW·m−2).
Download figure:
Standard image High-resolution imageThe combustible gases and volatiles of the test samples are more in unit time. The mass loss rate increases with the increase of radiation intensity. The greater the fire risk is greater in the actual fire field [35]. The time of Peak-MLR appears earlier with the increase of heat radiation flux. It corresponds to the peak time of heat release rate shown in table 10.
Figure 12 shows the effect of different laying angle on the mass loss rate of carbon fiber/epoxy composite is not obvious. In the experiment, the heat radiation flux is set to 35 kW·m−2, corresponding to the exposure temperature of 716 °C. Figure 13 shows the photo image of fire damage of four test samples (B1–B4) with the same thickness and different laying angle after the cone calorimeter test. The four samples have the same residue after combustion. It can be seen that the four testl samples have obvious stratification. It shows that the epoxy matrix has been exhausted. Only reinforced carbon fiber is left. The oxidation reaction of carbon fiber will be limited when the temperature is lower than about 1000 °C [12]. The oxidation reaction of carbon fiber is limited and the mass loss of carbon fiber is small under this radiation intensity.
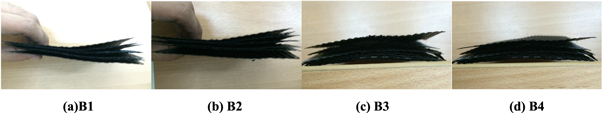
Figure 13. The morphology of the samples (B1–B4) with the same thickness and different laying angle after combustion.
Download figure:
Standard image High-resolution imageThere is a certain regularity between the laying thickness and the mass loss rate of carbon fiber/epoxy composite. Figures 12 and 14 show that the peak MLR and average mass loss rate of the samples with different laying thickness increase with the increase of laying thickness under the same thermal radiation intensity. This is mainly due to the greater mass and thermal capacity of the thick test samples
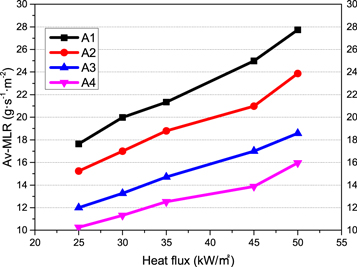
Figure 14. The relationship between the thermal radiation intensity and the average mass loss rate of the samples (A1–A4) with different laying thicknesses.
Download figure:
Standard image High-resolution imageThe thermal radiation intensity is linearly related to Peak-MLR and Av-MLR in steady state (or quasi steady state) combustion. As shown in Formula (1) [36].

Where m' represents the mass loss rate including Peak-MLR and average mass loss rate Av-MLR. L is the heat of vaporization. q is the thermal radiation intensity. C is a constant.
The L of the material is the reciprocal of the slope of the fitting line as shown in formula (1). Figure 15 shows the fitting function of mass loss rate and thermal radiation intensity of the test samples with different laying thickness. The influence of heat radiation flux on the Peak-MLR and Av-MLR of carbon fiber/epoxy composite with different laying thickness was analyzed.

Figure 15. Fitting curve of Peak-MLR and Av-MLR of different thickness test samples (A1–A4) under different heat radiation intensity.
Download figure:
Standard image High-resolution imageA1:


A2:


A3:


A4


where  and
and  represent the peak MLR and the average MLR, respectively.
The fitting function of each test sample adopts the formula with higher R2. The formula can be used not only to predict the mass loss rate of experimental samples under different heat radiation fluxes, but also to determine the vaporization heat of materials. The vaporization heat of A1, A2, A3 and A4 were calculated as 2.588 MJ·kg−1, 3.089 MJ·kg−1, 3.866 MJ·kg−1, and 4.713 MJ·kg−1, respectively. Vaporization heat L is a solid property in engineering calculation [37]. It can be used to characterize the combustion rate under a specific heat flow. It can be seen that the higher the thickness of carbon fiber/epoxy composite, the smaller the vaporization heat through calculation. This shows that the smaller the thickness of carbon fiber/epoxy composite with the same laying angle, the faster the burning rate. This is consistent with the results of vertical/horizontal combustion rate experiments.
3.5. The influence of laying method on high temperature mechanical properties
The high-temperature mechanical properties of carbon fiber/epoxy composites studied by scholars all over the world mainly focus on their fracture position or bending properties [38, 39]. The experimental samples B1 and B3 are carbon fiber/epoxy bidirectional woven fabrics with self-defined laying method, mainly for the purpose of comparative study on the influence of different laying methods on the mechanical properties of composite materials. T1 is the fuselage frame material of electric light aircraft, and D1 is the instrument panel material of electric light aircraft (carbon fiber/epoxy prepreg). Table 3 shows the specific laying method of the test samples.
3.5.1. Stress-strain curve
Figures 16(a) to (d) show the stress-strain curves of four samples at 25 °C, 50 °C, 100 °C and 150 °C. The trend of the stress-strain curves of the four samples is similar under the four temperature environments. In the initial stage, the stress and strain also increase with the increase of tensile displacement and decrease rapidly when it reach the peak value.
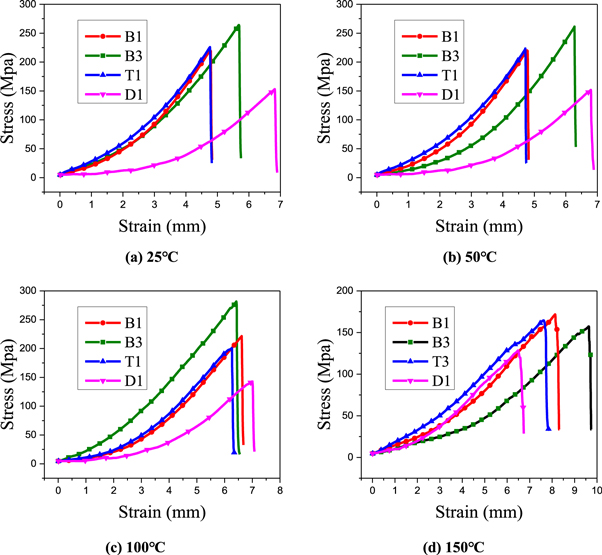
Figure 16. Stress-strain curve of experimental samples at different temperatures.
Download figure:
Standard image High-resolution imageFigures 16(a) to (d) show the maximum stress values of B1, B3, T1 and D1 at 25 °C are basically the same as those at 50 °C. This is because the epoxy resin as the matrix has not started to decompose at 50 °C. The temperature has little effect on its mechanical properties. The maximum stress values of the four samples at 100 °C is slightly lower than that at 25 °C. This is because the epoxy begins to decompose at 100 °C [40]. However, the whole mechanical properties of the experimental samples have not been greatly affected. The maximum stress of the sample at 150 °C is lower than that at 25 °C. This is due to the poor heat resistance of epoxy [41]. The epoxy resin in each layer of the sample has been decomposed at 150 °C. The trend of the stress-strain curves of the four samples is similar under the four temperature environments. At the beginning, the stress and strain increase with the increase of tensile displacement. It drops rapidly when the peak value is reached.
3.5.2. Tensile failure strength
The tensile failure strength is the maximum stress of the test sample from the beginning of tensile test to the time of fracture failure [42]. It is usually used to characterize the strength and toughness of materials. The tensile modulus of elasticity refers to the stress required to produce unit elastic deformation under the action of external force [43]. It is used to measure the difficulty of elastic deformation of materials. Figures 17 and 18 show the relationship between the tensile failure strength and the tensile modulus of the test samples with the change of temperature.
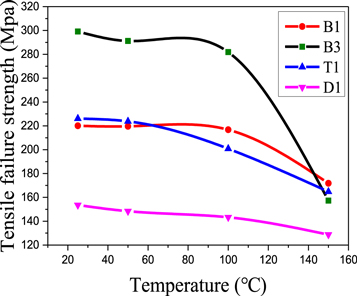
Figure 17. Tensile failure strength-temperature curve.
Download figure:
Standard image High-resolution image
Figure 18. Tensile elastic modulus-temperature curve.
Download figure:
Standard image High-resolution imageThe tensile failure strength and modulus of elasticity of B1 are 220.04 Mpa and 4187.21 Mpa at 25 °C, respectively. At 100 °C, the tensile failure strength and elastic modulus are 216.76 Mpa and 3853.1 Mpa at 100 °C, respectively. Compared with 25 °C, the tensile failure strength and elastic modulus decreased by 1.49% and 7.98% respectively. The tensile failure strength and elastic modulus of B3 decreased by 5.79% and 11.40%, respectively. The tensile failure strength and elastic modulus of T1 decreased by 11.18% and 13.72%, respectively. The tensile failure strength and elastic modulus of D1 decreased by 6.71% and 9.76%, respectively. It can be seen that the decrease is not large. This is because the epoxy resin just began to decompose at 100 °C. The mechanical properties of the four samples are basically stable within the temperature range of 25 °C–100 °C. The mechanical properties are not affected by temperature.
The tensile strength and elastic modulus of the test samples decreased sharply due to the gradual decomposition of the matrix epoxy resin from 100 °C to 150 °C. The tensile failure strength and elastic modulus of B1 at 150 °C are 171.82Mpa and 1936.67Mpa. Compared with 25 °C, it decreased by 21.91% and 53.75%, respectively. The tensile failure strength and elastic modulus of B3 decreased by 47.42% and 67.90%, respectively. The tensile failure strength and elastic modulus of T1 decreased by 27.12% and 50.80%, respectively. The tensile failure strength and elastic modulus of D1 decreased by 16.15% and 24.30%, respectively. The mechanical properties of the samples at 150 °C are greatly affected by the temperature.
Figures 17 and 18 show that the tensile failure strength and tensile modulus of the experimental samples decrease with the increase of temperature. The mechanical properties of carbon fiber/epoxy bi-directional woven fabric (B1, B3, T1) are better than that of carbon fiber unidirectional prepreg (D1) at 25 °C, 50 °C, 100 °C and 150 °C. The tensile mechanical properties of B3 are better than those of B1 and T1 among three kinds of carbon fiber/epoxy bi-directional woven fabrics. This is because B3 is laid in [(0°/90°)6/(±45°)2]. There are 8 layers in total. There are 6 layers of fiber along the direction of stress. The laying method of B1 is [(0°/90°)/(±45°)]4. There are 8 layers in total. There are four layers of fiber along the direction of stress. The laying method of T1 is [(0°/90°)/±45°]2 [±45 °/(0°/90°)]2. There are 8 layers in total. There are four layers of fiber along the direction of stress. The laying mode of D1 is [(±45°)/0°/45°/0°/–45°/0°]. There are six floors in total. There are three layers of fiber along the direction of stress. The fiber can bear more load along the direction of stress. The number of layers of B3 fiber along the stress direction is more than that of the other three test samples. B3 can bear large load. The load-bearing performance of B1, T1 and D1 decreased in turn.
3.5.3. Relationship between tensile strength and temperature
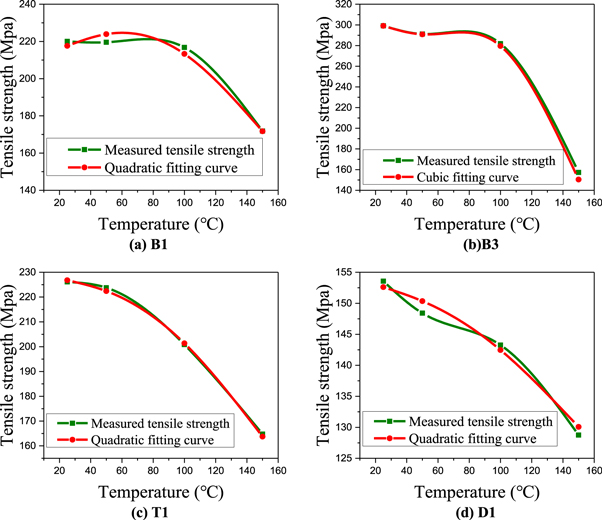
The mechanical properties of carbon fiber/epoxy composites were studied at high temperature. Regression analysis of the relationship between tensile strength and temperature was carried out. The formula of the relationship between the tensile failure strength and temperature of four test samples is obtained. As shown in table 11.
Table 11. The relationship between tensile strength and temperature of four test samples.
| Test sample | Linear function | Quadratic function | Cubic function |
|---|---|---|---|
| B3 | σt = −1.0662t + 344.0024 | σt = −0.0159t2 + 1.7362t + 258.2414 | σt = −0.0002t3 + 0.0364t2 − 2.1846t+334.092 |
| B1 | σt = −0.3647t + 236.6781 | σt = −0.0062t2 + 0.7177t + 203.5540 | σt = −0.0001t3 + 0.0106t2 − 0.5363t + 227.814 |
| T1 | σt = −0.5009t + 244.5775 | σt = −0.0033t2 + 0.0734t + 227.0035 | σt = 0.00001t3 − 0.008t2 + 0.4289t + 220.126 |
| D1 | σt = −0.1885t + 158.8119 | σt = −0.0009t2 − 0.0228t + 153.7403 | σt = −0.00001t3 + 0.0059t2 − 0.5362t + 163.672 |
Goodness of fit:
For nonlinear equations:
- (1)Calculate the sum of squared residuals Q = ∑(yy*)2 and ∑y2, where y represents the measured value and y* represents the predicted value;
- (2)Find the goodness of fit R2 = 1 − (Q/∑y2)1/2;
For the linear equation: R2 = ∑(y* − yaverage)2/∑(y − yaverage)2;
The goodness of fit of four regression equations was calculated. Select the equation with the best goodness of fit as the fitting function. Table 12 shows the goodness of fit and the selected fit function for each sample.
Table 12. Goodness of fit of the experimental sample and the selected fitting function.
| Test sample | The best goodness of fit | Fitting function |
|---|---|---|
| B3 | 0.9863 | σt = −0.0002t3 + 0.0364t2 − 2.1846t + 334.092 |
| B1 | 0.9854 | σt = −0.0062t2 + 0.7177t + 203.5540 |
| T1 | 0.9954 | σt = −0.0033t2 + 0.0734t + 227.0035 |
| D1 | 0.9908 | σt = −0.0009t2 − 0.0228t + 153.7403 |
Figures 19(a) to (d) show the curve of fitting function and test data.
Figure 19. Tensile strength and fitting function of the test samples.
Download figure:
Standard image High-resolution image
Figure 19 shows the fitting function has a good agreement with the measured data of carbon fiber/epoxy composite in the range of 25 °C to 150 °C. It can reflect the change rule of high temperature mechanical properties of carbon fiber/epoxy composite with temperature in the temperature range.
4. Conclusion
- (1)The vertical burning rate of the same kind of sample is higher than the horizontal burning rate. The vertical/horizontal burning rate decreases with the increase of the laying thickness. When the angle of spread layer is the same as the direction of flame spread, it is favorable for flame spread and makes the vertical/horizontal combustion speed greater.
- (2)The oxygen index of the sample increases with the increase of the thickness of the layer. The effect of different laying angle on oxygen index is not obvious.
- (3)The total smoke produvtion increased with the increase of the laying thickness. The peak value of smoke production rate decreased. The time of CO and CO2 to the peak production rate is shortened. The laying angle is different from the flame spreading direction, which is more conducive to the emission of bottom flue gas.
- (4)The influence of the laying thickness on the combustion characteristics is obvious. The influence of the laying angle on combustion characteristics is not obvious. The models of mass loss rate and heat radiation flux were established. The results show that the gasification heat of the samples (A1–A4) with different layer thickness is 2.588 MJ·kg−1, 3.089 MJ·kg−1, 3.866 MJ·kg−1 and 4.713 MJ·kg−1, respectively.
- (5)The more carbon fiber layers are in accordance with the stress direction, the better the mechanical properties are. The fitting functions of mechanical properties of four kinds of carbon fiber/epoxy composites (B1, B3, T1 and D1) in this temperature range were obtained. It can predicte the high temperature mechanical properties by this function.
Acknowledgments
This work was sponsored by Project 51874313 supported by National Natural Science Foundation of China and National Key R&D Program of China (2018YFC0808101).