
Abstract
A majority of geriatric patients experience difficulty in performing sit-to-stand (SiSt) transitions. A detailed assessment of SiSt ability is a prerequisite for successful rehabilitation. Body fixed sensors (BFSs) are increasingly used to assess functional performances. As to date there is no system which analyzes clinically relevant phases of SiSt, the aim of this study was to determine the reliability of an automated approach for quantifying durations and angular velocities of trunk flexion and extension during repeated SiSt transitions using one BFS (DynaPort® Hybrid). Forty multimorbid geriatric patients aged 84.1 ± 6.6 years were included. Each patient participated in two test sessions with a 5 min rest period in between. Intra- and interrater reliability was assessed. Intraclass correlation coefficients (ICCs), absolute and relative standard measurement errors (SEMs, SEMs%) and minimal detectable changes (MDCs95, MDCs95%) were calculated. ICCs were good to excellent for all variables in the total sample (0.80–0.94). The intraobserver group (50%) showed a higher number of excellent ICCs (≥.9) compared to the interobserver subgroup (10%). SEM% was low for all variables (6.9–12.7%). MDC95% ranged 19.2–34.4% and more variables ≤30% were found in the intra- (80%) compared to the inter-observer group (60%). Study results demonstrate that the BFS system provides a reliable analysis of SiSt phases in geriatric patients, and is a substantial improvement over the stopwatch approach used in clinical practice today.
Export citation and abstract BibTeX RIS
1. Introduction
The sit-to-stand (SiSt) movement, which consists of flexion and extension of the trunk combined with extension of the legs (Vander Linden et al 1994), is a key component of functional mobility. However, many older adults have difficulty in performing a SiSt transition successfully (Williamson and Fried 1996, Tinetti et al 1988) and a high occurrence of falls during SiSt has been reported (Tinetti et al 1988). In nursing home residents, SiSt failures are the leading cause of falls (41%) followed by gait (36%) and other causes (23%) (Rapp et al 2012). Difficulties in basic functional performances such as the SiSt are a significant predictor of subsequent disability (Guralnik et al 1995), nursing home admission (Guralnik et al 1994) and mortality (Guralnik et al 1994, Rolland et al 2006).
The SiSt is considered one of the most mechanically demanding functional daily activities (Kerr et al 1997) and older adults generally perform SiSt transitions close to the maximum of their capabilities (Hortobagyi et al 2003). In a sample of 21.604 geriatric patients, only 24% were able to perform five SiSt cycles at the beginning of the rehabilitation (Marburger et al 2008), highlighting the need for effective rehabilitation. Successful intervention requires a detailed assessment which not only focuses on the success or failure of SiSt, but also considers changes in chair rise strategies related to aging (Dubost et al 2005), as well as functional limitations (Scarborough et al 2007), and diseases such as stroke or dementia which are highly prevalent in geriatric patients (Janssen et al 2008a, 2008b, Manckoundia et al 2006). For example, subjects with arthritis or stroke demonstrate exaggerated trunk flexion during SiSt (Scarborough et al 2007), whereas Alzheimer's patients show a decreased trunk flexion angle and duration compared to healthy elderly (Manckoundia et al 2006). Changes in trunk flexion during chair transfer have been discussed as an adaptive mechanism to decrease the risk of anterior disequilibrium in older adults and therefore should be considered during both assessment and intervention (Dubost et al 2005). Since changes in chair rise strategy may be related to sit-back failure, possibly explaining the high fall rate during SiSt (Rapp et al 2012), a detailed analysis of SiSt transitions during rehabilitation is of the utmost importance (Scarborough et al 2007). However, laboratory measures using cameras and/or force plates for accurate quantification of SiSt (Manckoundia et al 2006, Schenkman et al 1990) are not feasible in clinical practice as they are time consuming and require extensive equipment. Today in geriatric rehabilitation, typically a stopwatch is used to determine the time required to complete the repeated SiSt (Bohannon 2006, Guralnik et al 1994), and a diagnosis of a patient's rise biomechanics is not possible.
A promising approach for the SiSt analysis in clinical practice is the use of body fixed sensors (BFSs) as they are relatively inexpensive, can be used in any location and may not need specific personnel depending on the automatization of data analysis. Most BFSs in use today only determine duration of the SiSt (Janssen et al 2008a, Najafi et al 2002, Zijlstra et al 2010) and a few can extract other parameters such as lateral sway (Janssen et al 2008b) or peak power (Zijlstra et al 2010). However, to date no BFS can automatically detect clinically relevant phases of trunk flexion and extension during both sit-to-stand (SiSt) and stand-to-sit (StSi). Moreover, to our knowledge, no study has reported on the BFS-based SiSt analysis during geriatric rehabilitation, although geriatric patients are the main target group for SiSt rehabilitation. So far, studies have only been performed with younger adults (Boonstra et al 2006, Giansanti and Maccioni 2006, Janssen et al 2005, 2008a, 2008b, Zijlstra et al 2010), older adults (Najafi et al 2002, de Bruin et al 2007, Zijlstra et al 2010) and stroke patients (Janssen et al 2008a, 2008b), and all systems were evaluated in convenience samples, substantially hampering the generalizability of results with respect to clinical practice. Furthermore, feasibility during routine assessment is limited since the majority of existing approaches require fixation of multiple sensors to different body locations such as thigh and trunk (Boonstra et al 2006, Janssen et al 2005, 2008a) and some require visual examination of raw signals (Janssen et al 2005, 2008a).
Some studies have evaluated the validity of BFS-based SiSt analysis (Giansanti and Maccioni 2006, Janssen et al 2008a, Najafi et al 2002). One paper reported on the day-to-day and week-to-week reliability of measuring transition counts and average duration of SiSt and StSi (ICC: 0.35–0.78) as assessed by an ambulatory activity monitor in older adults (de Bruin et al 2007). However, to our knowledge, no study has yet examined the reliability of a standardized BFS-based assessment to analyze specific flexion and extension phases during the repeated SiSt in geriatric inpatients.
Reliability is an important property defining the extent to which a measurement is free from random error (Fitzpatrick et al 1998). It can be expressed as both relative reliability and absolute reliability. Relative reliability is obtained by calculating the intraclass correlation coefficient (ICC) that indicates to what extent repeated measurements will reveal consistent positioning or ranking of individuals' scores within a group (Domholdt 2005). Absolute reliability can be determined by the standard error of measurement (SEM) indicating the variability in scores upon repeated testing (Atkinson and Nevill 1998). The SEM then can be used to estimate the minimal detectable change (MDC), interpreted as the smallest amount of change required to designate a change as real and beyond the bounds of measurement error (Hollman et al 2008). MDC values are important for clinicians and researchers to interpret change scores to evaluate the effectiveness of therapeutic interventions (Goldberg et al 2011).
Recently, a new automated approach which quantifies the repeated SiSt using one BFS has been developed (DynaPort® Hybrid, McRoberts, The Hague, the Netherlands). The aim of the present study was to evaluate both the relative and absolute reliability of the BFS-based SiSt analysis during routine administration in geriatric rehabilitation.
2. Methods
Patients were recruited consecutively from three rehabilitation wards of a geriatric hospital between January 2010 and May 2010. Inclusion criteria were as follows: (a) age ≥ 65 years; (b) post-operative full weight bearing allowed; (c) no severe cognitive impairment (mini-mental state examination (MMSE) score ≥17) (Folstein et al 1975); (d) no severe neurological, cardiovascular, metabolic or psychiatric disorders; (e) no severe visual defects; (f) ability to understand test instructions; (g) ability to rise five times from an adjustable chair without use of arms and (h) willing to participate in the study (written informed consent). The study was approved by the Ethics Committee of the Medical Department at the University of Heidelberg.
2.1. Instrumentation and data acquisition
The BFS system was inserted in an elastic belt and positioned on the lower back at the height of the second lumbar vertebra, i.e. an approximation of the body's center of movement in the standing position (figure 1). The small and light measurement system (87 × 45 × 1 mm, 74 g) contains three pre-calibrated seismic accelerometers (STM: sensor rage ± 2 g, resolution 1 mg) and three gyroscopes (EPSON: range ± 100 deg s−1, resolution 0.0069 deg s−1) and has a sampling rate of 100 Hz. The accelerometer signals have been shown to be highly reproducible (ICC = 0.99) (Van Hees et al 2009). Raw data were stored on a Micro-SD card. During raw data collection, the device was connected with a computer via Bluetooth. The supporting acquisition software, which includes the repeated SiSt protocol, was used to start and stop the sensor system and send event markers to mark intervals which were stored with the raw signals.
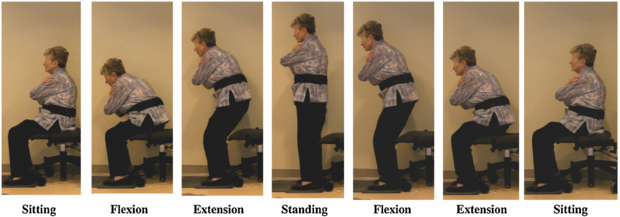
Figure 1. Analysis of the main phases of a SiSt cycle by the BFS inserted in an elastic belt positioned on the lower back.
Download figure:
Standard image2.2. Procedure
Repeated SiSt assessment was conducted according to a standardized written protocol. We used a modified test procedure as described by Dubost et al (2005). The patients were seated on an armless adjustable chair, with the seat placed at knee height as measured from the medial tibiae plateau. They kept their arms folded across their chest and their feet were placed flat, 10 cm apart at the heels, with the shanks positioned at a 10° angle relative to the vertical.
The patients performed a five-chair stand test which is an established functional assessment in older adults (Guralnik et al 1994). Participants were asked to stand up five times from the initial sitting position. They were instructed to come to a full upright standing position and back to the initial sitting position in between each SiSt cycle. A SiSt cycle is comprised of sitting, standing up, standing, sitting down and sitting (figure 1). BFS data were collected from initial sitting to the final standing position at the end of the fifth stand. Data of the four complete SiSt cycles were included in the analysis. SiSt movements were performed at self-selected speed and no physical assistance was allowed during testing. During an earlier practice period, participants were asked to execute two SiSt cycles. If subjects were not able to get up from regular seat height due to motor limitations, the chair was elevated to 110% (120%) of knee height.
2.3. Evaluation of test–retest reliability
This was a single-session test–retest study where the retest was performed approximately 5 min after the first test. The pre- and retest was conducted by one (intraobserver reliability) respectively two (interobserver reliability) therapist/s with over 2 years of experience in geriatric rehabilitation. Both therapists received 2 h of training in handling the BFS and performing the assessment. Testing was performed in a separate and quiet room in the geriatric hospital. After pretesting, patients were randomly assigned to the intra- or interobserver group using the urn design (Wei 1977). To simulate application of the BFS during routine assessment, the elastic belt containing the BFS was detached and reattached between the pre- and retest. The second rater was not allowed to enter the room during the first test to prevent observation of the assessment and the positioning of the equipment.
2.4. Automated signal analysis and outcomes
Trunk angle (ϕ) was calculated using the acceleration and the angular velocity in the sagittal plane (Williamson and Andrews 2001). Subsequently, the sine of the trunk angle (sin(ϕ)) was calculated and drift and noise were removed using the discrete wavelet transform dw_sin(ϕ) (Najafi et al 2002). An estimation of 'true vertical acceleration' was derived by removing the influence of ϕ from the vertical acceleration and vertical velocity was derived by integrating this signal. Successful STS movements were localized by identifying an upward movement followed by a downward movement. These were identified by finding the local maxima local minima, respectively, in the vertical velocity. Changes in the trunk rotation direction were identified by the dips in dw_sin(ϕ) (see figure 2). The beginning of the SiSt was defined as the end of the plateau before the first dip in dw_sin(ϕ). Similarly, the end of the SiSt was defined as the start of the plateau after the first dip in dw_sin(ϕ), the beginning of the StSi as the end of the plateau before the second dip in dw_sin(ϕ) and the end of the StSi as the start of the plateau after the second dip in dw_sin(ϕ). Plateaus were identified where the slope of dw_sin(ϕ) was <0.1. SiSt and StSi movements were divided into a flexion and extension phase. After automated identification of all phases, durations and maximum angular velocity were calculated. Outcomes were the duration of SiSt and StSi, duration and maximum angular velocity of the flexion and the extension phase of SiSt and StSi. Data analysis was executed automatically using on-line software (http://www.mcroberts.nl/analysis).
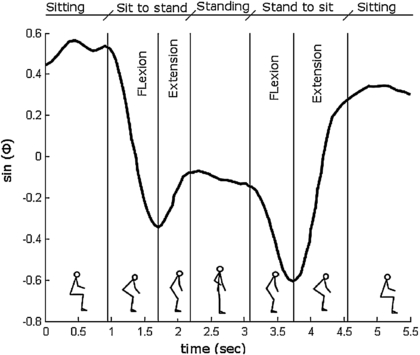
Figure 2. The sine of the trunk angle (sin(ϕ)) is shown during the main phases of a SiSt cycle.
Download figure:
Standard image2.5. Assessment of clinical characteristics
Descriptive data including age, gender, cognitive status (MMSE), screening for depression (15-point geriatric depression scale (GDS) ≥5 points indicate depressive symptoms) (Yesavage et al 1982), fear of falling (single-item question) (Maki et al 1991), pain (visual analog scale, VAS) (Huskisson 1974), diagnosis (number), functional status (short-physical-performance battery, SPPB) (Guralnik et al 1994) and anthropometric data (height, weight) were documented by standardized assessment.
2.6. Statistical analysis
Statistical procedures were performed on SPSS 17.0 for Windows and Matlab 7.1. The means and standard deviations (SD) of the repetitions were calculated for the durations and maximum angular velocities of all phases. The normal distribution of the data was tested with a Kolmogorov–Smirnov test. The presence of heteroscedasticity was checked visually with Bland–Altman plots (Bland and Altman 1999) and formally tested by correlating (Pearson's r) the magnitude of the mean with the absolute difference from test to retest (Aktinson and Nevill 1998).
2.6.1. Relative reliability
The relative reliabilities were expressed as ICCs of the type (2,k) for the total- and interobserver reliability group and ICC type (3,k) for the intraobserver reliability group (Shrout and Fleiss 1979). The ICCs were used to evaluate both systematic and random errors that may affect relative test–retest reliability (Atkinson and Nevill 1998). For ICCs, 95% confidence intervals (CI) were given. An ICC ≥0.7 indicated satisfactory, ≥0.75 good and ≥0.9 excellent reliability (Atkinson and Nevill 1998, Lohr et al 1996, Segura-Orti and Martinez-Olmos 2011).
2.6.2. Absolute reliability
Absolute reliability describes the within-subject variability attributable to repeated measures and was evaluated by established statistical methods used in sports medicine and physical therapy (Atkinson and Nevill 1998, Haley and Fragala-Pinkham 2006, Wagner et al 2008). SEM, a reliability statistic which quantifies measurement error in the same units as the original measurement, was calculated as

Measurement error also was expressed as a percentage of the mean, which was defined as

The mean is the mean for all of the measures for test and retest. The SEM% indicates measurement error independent of the units of measurement and represents the limit for the smallest change that indicates a real improvement for a group of subjects.
The MDC, representing the magnitude of change necessary to exceed the measurement error of two repeated measures at a specified CI, was calculated for the 95% CI as

1.96 is the two-sided tabled z value for the 95% CI and  is used to account for the variance of two measurements.
MDC95 was also expressed as a percentage, which was defined as

The mean is the mean for all of the measures for test and retest.
Agreement between test and retest was plotted graphically by Bland–Altman plots for selected variables. The 95% limits of agreement were calculated as mean difference ±1.96 SD of the differences.
3. Results
3.1. Patient characteristics
Of 188 patients screened for eligibility, 145 did not meet the inclusion criteria and 43 patients were enrolled. Two patients were unable/refused to perform a retest due to motor limitations/pain or lack of motivation. In one case, automated analysis of raw data by using the on-line software failed (figure 3).
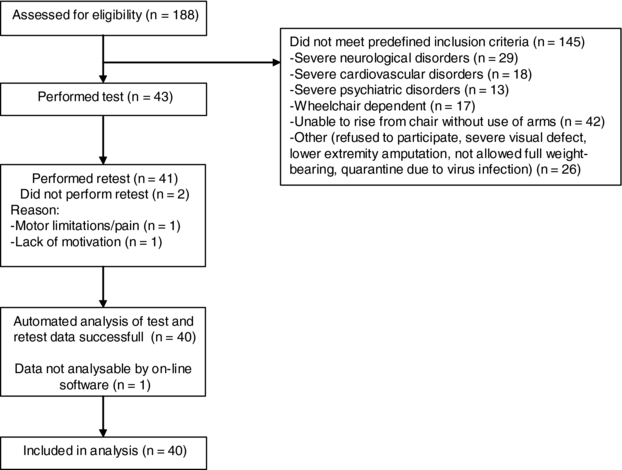
Figure 3. Flow diagram of progress through the phases of screening, enrolment, test, retest and data analysis.
Download figure:
Standard imageForty patients were included in the analysis, where 19 were randomized to the interobserver group and 21 to the intraobserver group. Admission diagnoses were (1) orthopaedic (n = 11, 27.5%), (2) cardiac and respiratory (n = 10, 25%), (3) neurological (n = 6, 15%), (4) gastrointestinal (n = 4, 10%) and (5) miscellaneous diseases such as metabolic disorders or cancer (n = 9, 22.5%). The study sample comprised multimorbid, geriatric patients. Forty-five percent (n = 18) had cognitive impairment (MMSE ≤24) and forty percent had a possible depressive disorder based on the results of the screening tool (GDS). SPPB averaged 6.5 points indicating low physical performance. No significant differences in clinical characteristics were found between the intra- and interobserver groups (table 1).
Table 1. Clinical characteristics of the total group and subgroups.
| Total group | Intraobserver | Interobserver | ||
|---|---|---|---|---|
| Variable | (n = 40) | (n = 21) | (n = 19) | p-valuea |
| Age (years), mean ± SD | 84.1 ± 6.6 | 84.4 ± 7.2 | 83.7 ± 6.2 | 0.743 |
| Female, number (%) | 26 (65.0) | 13 (61.9) | 13 (68.4) | 0.748 |
| MMSE, score, mean ± SD | 23.7 ± 4.7 | 24.0 ± 4.0 | 23.5 ± 5.5 | 0.786 |
| GDS, score, mean ± SD | 4.2 ± 2.8 | 4.6 ± 3.2 | 3.6 ± 2.2 | 0.256 |
| Fear of falling, number | 23 (57.5) | 10 (47.6) | 13 (68.4) | 0.216 |
| of patients (%) | ||||
| VAS, score, mean ± SD | 2.8 ± 2.6 | 3.4 ± 2.6 | 2.1 ± 2.4 | 0.102 |
| Diagnosis, no, mean ± SD | 9.4 ± 3.3 | 9.2 ± 3.6 | 9.6 ± 3.1 | 0.710 |
| SPPB, score, mean, ± SD | 6.5 ± 2.4 | 6.2 ± 2.6 | 6.8 ± 2.1 | 0.387 |
| Height (cm), mean ± SD | 160.9 ± 8.6 | 160.8 ± 10.7 | 161.0 ± 5.9 | 0.950 |
| Weight (kg), mean ± SD | 66.1 ± 13.6 | 64.1 ± 13.9 | 68.2 ± 13.2 | 0.353 |
a p-values for t-tests (age, MMSE, GDS, VAS, diagnosis, SPPB, height, weight) and Chi-square (female, fear of falling) applied to test for differences between the intra- and interobserver subgroup. SD: standard deviation; MMSE: mini mental state examination; GDS: geriatric depression scale (range 0–15); VAS = visual analog scale for pain (range 0–10, higher scores indicate more pain); SPPB: short-physical-performance battery (range 0–12).
3.2. Results of repeated SiSt analysis
Thirty-two patients performed the repeated SiSt at 100% seat height as measured from the medial tibiae plateau. For eight patients (five intraobserver, three interobserver, p = 0.527), the chair was readjusted to 110% (n = 4) respective 120% (n = 4) since patients were unable to perform a chair rise at 100% without using their arms. Results obtained for test and retest are shown in table 2. Durations ranged from 2.05 to 2.32 s for SiSt and from 2.30 to 2.43 s for StSi. For flexion and extension phases, values ranged from 0.89 to 1.33 s for durations and from 36.93 to 92.94° s−1 for angular velocities. Small but significant differences from test to retest were obtained in six out of ten (60%) variables in the total group.
Table 2. Test and retest results of the repeated SiSt assessment using the BFS.
| Total group (n = 40) | Intraobserver (n = 21) | Interobserver (n = 19) | ||||||||
|---|---|---|---|---|---|---|---|---|---|---|
| Durations | Test | Retest | pa | Test | Retest | pa | Test | Retest | pa | |
| Sit-to-stand | Total (s) | 2.19 ± 0.59 | 2.14 ± 0.40 | 0.39 | 2.32 ± 0.66 | 2.20 ± 0.44 | 0.19 | 2.05 ± 0.49 | 2.08 ± 0.35 | 0.75 |
| Flexion (s) | 0.95 ± 0.25 | 0.89 ± 0.15 | 0.01 | 0.99 ± 0.28 | 0.89 ± 0.17 | 0.01 | 0.91 ± 0.21 | 0.89 ± 0.14 | 0.45 | |
| Extension (s) | 1.24 ± 0.41 | 1.25 ± 0.33 | 0.82 | 1.33 ± 0.44 | 1.31 ± 0.36 | 0.77 | 1.15 ± 0.34 | 1.19 ± 0.29 | 0.52 | |
| Stand-to-sit | Total (s) | 2.42 ± 0.59 | 2.30 ± 0.48 | 0.06 | 2.43 ± 0.64 | 2.30 ± 0.55 | 0.12 | 2.41 ± 0.54 | 2.31 ± 0.41 | 0.26 |
| Flexion (s) | 1.29 ± 0.46 | 1.27 ± 0.42 | 0.77 | 1.27 ± 0.48 | 1.28 ± 0.48 | 0.79 | 1.31 ± 0.44 | 1.27 ± 0.34 | 0.60 | |
| Extension (s) | 1.13 ± 0.25 | 1.03 ± 0.20 | 0.00 | 1.16 ± 0.23 | 1.01 ± 0.16 | 0.00 | 1.10 ± 0.26 | 1.05 ± 0.25 | 0.05 | |
| Angular velocities | ||||||||||
| Sit-to-stand | ωmaxflexion (° s−1) | 91.73 ± 21.89 | 86.61 ± 23.32 | 0.02 | 92.94 ± 24.29 | 88.47 ± 23.07 | 0.05 | 90.40 ± 19.48 | 84.57 ± 24.07 | 0.14 |
| ωmaxextension (° s−1) | 42.07 ± 13.20 | 37.65 ± 11.71 | 0.00 | 40.11 ± 14.45 | 36.93 ± 13.30 | 0.01 | 44.24 ± 11.66 | 38.45 ± 9.98 | 0.00 | |
| Stand-to-sit | ωmaxflexion (° s−1) | 44.97 ± 17.09 | 41.13 ± 16.73 | 0.00 | 43.31 ± 20.09 | 41.12 ± 19.76 | 0.17 | 46.81 ± 13.34 | 41.14 ± 13.15 | 0.01 |
| ωmaxextension | 76.63 ± 16.81 | 77.65 ± 18.56 | 0.54 | 75.60 ± 20.47 | 77.42 ± 18.61 | 0.36 | 77.78 ± 11.99 | 77.91 ± 19.02 | 0.96 | |
| (° s−1) | ||||||||||
Given are the means of four repeated SiSt cycles ± SD for the total group and subgroups according to the observer. a p-values for paired t-tests applied to test for differences between the test and retest.
All data were normally distributed. Visual inspection of all Bland–Altman plots revealed a uniform variability for the majority of variables which was confirmed by low correlation coefficients between the magnitude of the mean and the absolute difference from test to retest (r ≤ .01–0.48). However, there were a few examples of nonuniform relationships indicating heteroscedasticity (SiSt-total-duration r = 0.56; SiSt-flexion-duration r = 0.73).
3.3. Relative reliability
Relative reliability statistics (ICCs) obtained for the total sample and subgroups of intra- and interobserver are shown in table 3. In the total sample, relative reliability was good to excellent (ICC = 0.80–0.94) for all variables. Highest ICCs were found for the angular velocity of the flexion (ICC = 0.94) and extension phase (ICC = 0.91) of StSi. Good to excellent ICCs were also found for 90% of variables in the intraobserver (ICC = 0.85–0.97) and for 80% in the interobserver group (0.80–0.94). Only StSi-extension-duration (ICC = 0.60) in the intraobserver group and SiSt-extension-duration (ICC = 0.74) and StSi-flexion-duration (ICC = 0.73) in the interobserver group were below the threshold of good reliability (≤0.75). More variables with excellent ICCs (≥.9) were found in the intraobserver group (n = 5, 50%) compared to the interobserver group (n = 1, 10%). Highest ICCs were obtained for angular velocities of both SiSt (flexion ICC = 0.95, extension ICC = 0.95) and StSi (flexion ICC = 0.97, extension ICC = 0.95) in the intraobserver group.
Table 3. Relative and absolute reliability of the repeated SiSt assessment using the BFS.
| Total group (n = 40) | Intraobserver (n = 21) | Interobserver (n = 19) | ||||||||
|---|---|---|---|---|---|---|---|---|---|---|
| ICC | SEM | MDC95 | ICC | SEM | MDC95 | ICC | SEM | MDC95 | ||
| Durations | (95% CI) | (SEM%) | (MDC95%) | (95% CI) | (SEM%) | (MDC95%) | (95% CI) | (SEM%) | (MDC95%) | |
| Sit-to-stand | Total (s) | 0.85 (0.72–0.92) | 0.20 (9.0) | 0.54 (24.9) | 0.85 (0.65–0.94) | 0.21 (9.4) | 0.59 (26.2) | 0.83 (0.56–0.94) | 0.17 (8.2) | 0.47 (22.7) |
| Flexion (s) | 0.86 (0.71–0.93) | 0.08 (8.5) | 0.22 (23.5) | 0.85 (0.53–0.95) | 0.08 (8.5) | 0.24 (25.9) | 0.88 (0.70–0.96) | 0.06 (6.6) | 0.16 (18.2) | |
| Extension (s) | 0.82 (0.65–0.90) | 0.16 (12.7) | 0.43 (34.4) | 0.85 (0.62–0.94) | 0.16 (11.8) | 0.43 (33.3) | 0.74 (0.32–0.90) | 0.16 (13.6) | 0.44 (37.6) | |
| Stand-to-sit | Total (s) | 0.87 (0.74–0.93) | 0.20 (8.3) | 0.54 (23.0) | 0.89 (0.74–0.96) | 0.19 (8.2) | 0.54 (22.8) | 0.83 (0.59–0.93) | 0.20 (8.5) | 0.55 (23.5) |
| Flexion (s) | 0.87 (0.76–0.93) | 0.15 (12.0) | 0.43 (33.6) | 0.94 (0.86–0.98) | 0.11 (8.9) | 0.31 (24.8) | 0.73 (0.30–0.90) | 0.20 (15.5) | 0.55 (43.1) | |
| Extension (s) | 0.80 (0.52–0.91) | 0.10 (9.3) | 0.29 (26.5) | 0.60 (0.01–0.84) | 0.13 (12.3) | 0.37 (34.3) | 0.94 (0.83–98) | 0.06 (5.7) | 0.17 (15.9) | |
| Angular velocities | ||||||||||
| Sit-to-stand | ωmaxflexion (° s−1) | 0.90 (0.79–0.95) | 7.30 (8.1) | 20.23 (22.7) | 0.95 (0.86–0.98) | 5.36 (5.9) | 14.85 (16.4) | 0.83 (0.56–0.93) | 9.09 (10.4) | 25.20 (28.8) |
| ωmaxextension (° s−1) | 0.90 (0.69–0.96) | 4.02 (10.1) | 11.14 (28.0) | 0.95 (0.84–0.98) | 3.06 (7.9) | 8.47 (22.0) | 0.80 (0.31–0.93) | 4.94 (12.0) | 13.69 (38.0) | |
| Stand-to-sit | ωmaxflexion (° s−1) | 0.94 (0.85–0.97) | 4.28 (9.9) | 11.86 (27.6) | 0.97 (0.92–0.99) | 3.63 (8.6) | 10.07 (23.9) | 0.86 (0.51–0.95) | 4.93 (11.2) | 13.66 (31.1) |
| ωmaxextension (° s−1) | 0.91 (0.83–0.95) | 5.33 (6.9) | 14.80 (19.2) | 0.95 (0.87–0.98) | 4.54 (5.9) | 12.57 (16.4) | 0.85 (0.59–0.94) | 6.17 (7.9) | 17.11 (22.0) | |
| % of variables above/ | ICC ≥0.9 = 40% | SEM% | MDC95% | ICC ≥0.9 = | SEM% | MDC95% | ICC ≥0.9 = | SEM% | MDC95% | |
| below cut-offs | ≤10 =70% | ≤30 =80% | 50% | ≤10 =80% | ≤30 =80% | 10% | ≤10 =50% | ≤30 =60% | ||
Given are ICCs, SEMs, SEMs%, MDCs95 and MDCs95% for the total group and subgroups according to the observer. ICC: intraclass correlation coefficient; CI: confidence interval; SEM = standard error of measurement, SEM% = relative standard error of measurement; MDC95 = minimal detectable change at a 95% confidence level; MDC95% = relative minimal detectable change at a 95% confidence level. All ICCs were significantly different from zero at a 0.01 level.
3.4. Absolute reliability
Absolute reliability statistics are shown in table 3. In the total sample, SEM ranged 0.08–0.20 s for durations and 4.02–7.30 ° s−1 for angular velocities. SEM% was low for all variables (6.9–12.7%). In 70% of variables, a SEM% ≤10% was obtained. SEM ranged 0.08–0.21 s respectively 3.06–5.36 ° s−1 in the intraobserver group and 0.06–0.20 s respectively 4.93–9.09 ° s−1 in the interobserver group. Subgroup comparison revealed a higher number of variables below a threshold (SEM% ≤10%) in the intraobserver group (80%) compared to the interobserver group (50%).
For the total group, MDC95 ranged 0.22–0.54 s for durations and 11.14–20.23 ° s−1 for angular velocities. MDC95% ranged 19.2–34.4% and was ≤30% for the majority of variables (80%). MDC95% was ≤30% for all angular velocities but exceeded 30% for some of the durations (SiSt-extension: 34.4%; StSi-flexion: 33.6%) for the total group. MDC95 ranged 0.24–0.59 s respectively 8.47–14.85 ° s−1 in the intraobserver group and 0.16–0.55 s respectively 13.66–25.20 ° s−1 in the interobserver group. More MDC95% ≤30% were obtained in the intraobserver group (80%) compared to the interobserver group (60%). In particular for angular velocities, the MDC95% was lower in the intraobserver group (16.4–23.9%) compared to the interobserver group (22.0–38.0%).
The variables of the flexion and extension phase of the SiSt with regard to inter- and intraobserver reliability are illustrated in figure 4 by Bland–Altman plots. For durations, both single values of the intra- and interobserver group were outside the 95% limits of agreement. In contrast, for angular velocities, only interobserver values exceeded the 95% limits of agreement indicating higher within-subject variability in this group.
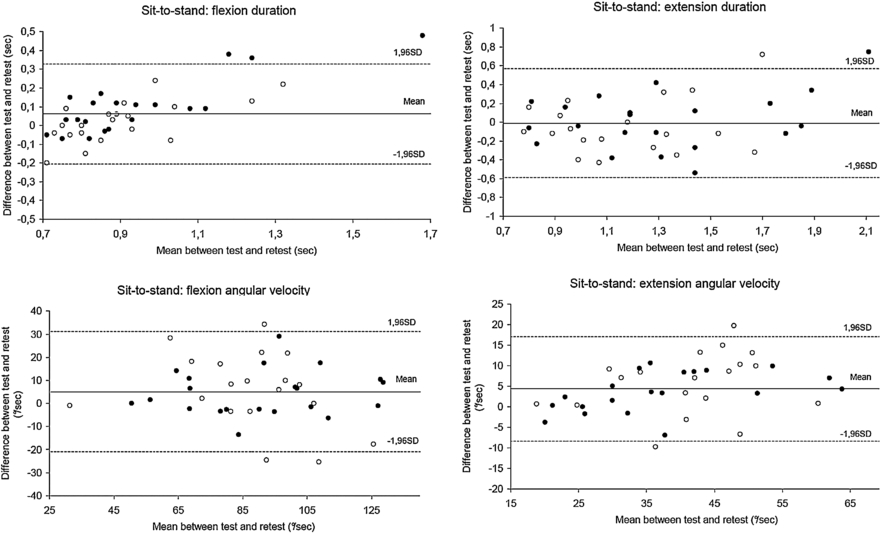
Figure 4. Bland–Altman plots for variables of the flexion and extension phase of the SiSt. Dark dots: intraobserver group; bright dots: interobserver group; solid line: mean difference between test and retest; dashed lines: limits of agreements (±1.96 * standard deviation (SD)).
Download figure:
Standard image4. Discussion
In the present study, we investigated the relative and absolute reliability of a BFS-based SiSt analysis during routine assessment in geriatric rehabilitation. In our sample of multimorbid geriatric patients with low functional performance and partly cognitively impaired, the relative reliability (ICC) was good to excellent for all variables extracted by automated raw data analysis. The MDC95 varied depending on the specific variable but was ≤30% for the majority of variables suggesting that effects of interventions aiming at improving the SiSt can be obtained by the present assessment.
4.1. Relative reliability
The ICC is the commonly used correlation coefficient for obtaining test–retest reliability (Lexell and Downham, 2005). The ICCs found here for the total duration of the SiSt (0.85) and StSi (0.87) are higher compared to those of a previous study which evaluated the day-to-day and week-to-week reliability of similar variables (average transition duration of SiSt and StSi, ICCs: 0.37–0.78) during 11 h of ambulatory activity monitoring in older adults (de Bruin et al 2007). The higher ICCs found in the present study might be due to the standardized assessment protocol which may produce more stable results compared to measurement under free-living conditions as performed by de Bruin et al. To our knowledge, no study has yet evaluated the reliability of a BFS to assess the repeated SiSt under controlled conditions thus preventing a direct comparison of the present results with other research. One study used a similar BFS (DynaPort® Mini Mod) on elderly subjects to assess temporo-spatial parameters of functional performance (walking: step duration, speed) under controlled conditions and reported comparable ICCs for intra- (0.86–0.98) and interobserver (0.90–0.97) reliability (Hartmann et al 2009). The somewhat higher ICCs found in this study might be explained by the different functional task (walking) but also by the fact that a convenient sample of independent healthy elderly subjects (mean age: 73.4 years) generating stable motor performances was used for evaluation. In contrast, reliability in the present study was obtained from a consecutively recruited sample of multimorbid geriatric patients with motor and partial cognitive impairment. Given the motor and cognitive limitations of our patients, the present results are surprisingly good, demonstrating that movement phases during repeated SiSt can be reliably obtained during geriatric rehabilitation by using a standardized BFS-based assessment. ICCs obtained in the present study partly exceed (ICC = 0.80, Ritchie et al 2005) or are similar (ICC = 0.91, Smeets et al 2006; ICC = 0.94, Thomas and Hageman 2002) to those of earlier studies which evaluated conventional SiSt tests in older adults and patient populations. However, in contrast to previous studies which drew from data obtained by stopwatch, the present results highlight that temporo-spatial parameters of relevant phases of task execution can be reliably measured by a single BFS.
In clinical practice, intrarater as well as interrater reliability is important since different therapists might perform pre- and post-assessment. Interestingly, we found that only ICCs for angular velocities but not for durations were positively influenced by the same observer. Several reasons might account for the higher reliability of angular velocities in the intraobserver group. First, the time between detachment and reapplication was short, approximately 5 min. This might have increased the ability of the observer to reattach the belt in the same way and thus positively affected intraobserver reliability, as also found in a previous study which evaluated a similar device (DynaPort® Mini Mod) to obtain walking performance (Van Hees et al 2009). The position of the BFS might have affected the signal since in mechanics, the acceleration of a mass is related to the distance between its center of mass and the axis of rotation (Van Hees et al 2009). In the present study, a slightly altered position of the BFS during retest might have influenced the measurement of angular velocity during trunk movement but not of duration in terms of identifying the start and end of movement phases. To enhance feasibility during clinical practice, the belt was attached on top of the clothes and the exact position of the attachment relative to the axis of rotation was not verified by exact measurement. Second, when measuring functional performances in the frail elderly, in particular the cognitively impaired, the observer plays an important role in terms of giving clear instructions (Hauer and Oster 2008). Thus, higher ICCs in the intraobserver group might be related to a higher consistency in instructing the subject during test and retest. Since instrumental reproducibility of the BFS under controlled conditions was found to be excellent (ICC 0.99) (Van Hees et al 2009), sources of measurement error most likely correlate with changes in the attachment and/or instructions.
4.2. Absolute reliability
Good to excellent relative reliability does not necessarily ensure that individuals' repeated performance will be consistent from test to retest. To obtain the within-subject variability that would typically occur in the routine administration of the assessment, we calculated the SEM which is one of the most common absolute reliability statistics (Atkinson and Nevill 1998). Since probabilities of the normal curve can be applied to SEM values, values from table 3 can be translated to clinical practice using these principles. For instance, there is a 68% probability that a repeated measurement of the angular velocity of trunk flexion during the repeated SiSt will be within 7.30 ° s−1 of the original value (total group). The SEM is lower if assessment is performed by the same (5.36 ° s−1) compared to a different observer (9.09 ° s−1). We are not aware of studies that have reported the SEM for instrumented SiSt assessment in geriatric patients. To allow a comparison with other established functional measures, we calculated the SEM% that is independent of units. SEM% obtained in the present study (6.9–12.7%, total group) was lower compared to static balance assessment in older adults (40.8%) (Goldberg et al 2011) and similar to the timed 'Up & Go' (8.2%) and comfortable gait speed (7.9%) in stroke patients (Flansbjer et al 2005).
We used the SEM to estimate the MDC95, providing clinically useful information in terms of defining the minimal amount of change that is not likely to be attributable to a chance variation in measurement (Haley and Fragala-Pinkham 2006). To our knowledge, no study has examined the MDC of SiSt parameters, even though these parameters have been reported with increasing frequency in the literature (Boonstra et al 2006, Giansanti and Maccioni 2006, Janssen et al 2005, 2008a, 2008b, Manckoundia et al 2006, Scarborough et al 2007, Zijlstra et al 2010) and changes in SiSt parameters are related to effects of interventions (Alexander et al 2001) and various diseases (Manckoundia et al 2006, Scarborough et al 2007). The MDCs95 reported here suggest that the BFS system can identify effects of interventions aiming at improving the SiSt in elderly populations. For example, Alexander et al (2001) obtained training-related changes in the SiSt duration of approximately 0.8 s, substantially exceeding the MDC95 obtained in the present study (SiSt duration: 0.54 s, total group).
Furthermore, our results indicate that the BFS could be used to identify specific chair rise strategies; this knowledge could be helpful in developing therapeutic approaches for neurological diseases such as dementia. Manckoundia et al (2006) found approximately 0.5 s difference in trunk forward displacement during SiSt (video tracked by a shoulder marker) between healthy elderly and Alzheimer's patients. Since the MDC95 obtained here for a similar parameter is considerably lower (SiSt-flexion-duration: 0.22 s, total group), dementia-related changes in SiSt pattern might be detected by the BFS. However, discriminative validity has to be proven by further research.
MDCs95% obtained in this study (19.2–34.4%, total group) were lower compared to other functional measures such as static balance assessment (113.1%) in older adults (Goldberg et al 2011) and similar to the timed 'Up & Go' (23%) and comfortable gait speed (22%) in stroke patients (Flansbjer et al 2005). Higher absolute reliability (lower MDCs95%) was found for angular velocities but not for durations in the intraobserver compared to the interobserver group. In line with our findings on relative reliability, this suggests that to obtain more consistent results for angular velocity during trunk movement, the repeated SiSt should be assessed by the same observer. In agreement with our statistical results, a visual analysis by Bland–Altman plots revealed lower within-subject variability in the intraobserver group for angular velocities but not for durations.
Nonuniform changes (heteroscedasticity) from test to retest were obtained for a few variables (SiSt-total-duration, SiSt-flexion-duration). For these variables, greater differences between test and retest were observed for participants with poor SiSt performance (higher duration) than for participants with better performance. In accordance with other reliability studies (Wagner et al 2008), these data suggest that the severity of motor impairment may have influenced the stability of the assessment from session to session.
4.3. Limitations
There was a small systematic bias from test to retest suggesting a learning effect also found in previous reliability studies (Segura-Orti and Martinez-Olmos 2011, Steffen and Seney 2008). Learning effects negatively influence reliability and can be prevented by a larger number of practice trials (Atkinson and Nevill 1998). However, fatigue due to extensive testing can also cause systematic bias, particularly in the frail elderly. In this study, reliability was computed from within-session measurements, and is not reflective of variation in repeated SiSt performance over longer periods of time. Future studies should evaluate reliability over longer lengths of time and include several SiSt trials to control for learning effects.
4.4. Conclusions
The results of this study demonstrate that clinically relevant phases of the repeated SiSt can be reliably measured in geriatric patients by using one BFS and automated analysis of raw data. The study shows that the BFS system is a substantial improvement over current clinical practice where commonly only a stopwatch is used. Due to high intraobserver reliability, repeated assessment by the same observer is preferable. While further research on measurement properties of the present assessment is needed, our findings support the clinical utility of BFS-based SiSt analysis during geriatric rehabilitation.
Acknowledgments
This study was supported by the Dietmar Hopp Stiftung and Baden-Württemberg Stiftung. We thank Erik Ainsworth for technical support during data collection.