
Abstract
Lung cancer screening aims to detect small pulmonary nodules and decrease the mortality rate of those affected. However, studies from large-scale clinical trials of lung cancer screening have shown that the false-positive rate is high and positive predictive value is low. To address these problems, a technical approach is greatly needed for accurate malignancy differentiation among these early-detected nodules. We studied the clinical feasibility of an additional protocol of localized thin-section CT for further assessment on recalled patients from lung cancer screening tests. Our approach of localized thin-section CT was integrated with radiomics features extraction and machine learning classification which was supervised by pathological diagnosis. Localized thin-section CT images of 122 nodules were retrospectively reviewed and 374 radiomics features were extracted. In this study, 48 nodules were benign and 74 malignant. There were nine patients with multiple nodules and four with synchronous multiple malignant nodules. Different machine learning classifiers with a stratified ten-fold cross-validation were used and repeated 100 times to evaluate classification accuracy. Of the image features extracted from the thin-section CT images, 238 (64%) were useful in differentiating between benign and malignant nodules. These useful features include CT density (p = 0.002 518), sigma (p = 0.002 781), uniformity (p = 0.032 41), and entropy (p = 0.006 685). The highest classification accuracy was 79% by the logistic classifier. The performance metrics of this logistic classification model was 0.80 for the positive predictive value, 0.36 for the false-positive rate, and 0.80 for the area under the receiver operating characteristic curve. Our approach of direct risk classification supervised by the pathological diagnosis with localized thin-section CT and radiomics feature extraction may support clinical physicians in determining truly malignant nodules and therefore reduce problems in lung cancer screening.
Export citation and abstract BibTeX RIS
Introduction
Cancer is a leading cause of death cause worldwide. Recent statistics show that lung cancer has the highest mortality rate of any cancer (Swensen et al 2005, Church et al 2013, Tammemagi and Lam 2014, Callister and Baldwin 2016, Ruparel et al 2016). The early detection of small pulmonary nodules with lung cancer screening is essential to reduce the mortality rate among lung cancer patients. Potential risk factors of lung cancer include cigarette smoking, passive exposure to heavy smokers, family history of cancer, and long-term exposure to particulate matter pollution (Alberg and Nonemaker 2008).
The current regimen for lung cancer screening includes the imaging modality of chest x-ray radiography (CXR) or low-dose computed tomography (LDCT) (Swensen et al 2005, Church et al 2013, Tammemagi and Lam 2014, Callister and Baldwin 2016, Ruparel et al 2016). A CXR scanning test generates a 2D projection radiograph. Small pulmonary nodules are likely to be shielded by overlapping structures and therefore are difficult to identify. In recent years, the number of LDCT scans for annual lung cancer screening has been increasing (Aberle et al 2011, 2013). In particular, the US Preventive Services Task Force recommends LDCT for annual lung cancer screening among the adult population aged 55–80 years with a history of heavy smoking (Aberle et al 2011, 2013). However, low positive predictive value, high false-positive rate, overdiagnosis, overtreatment, anxiety, and depression in recalled patients from lung cancer screening tests in different countries have been reported in the literature (Infante et al 2009, Lopes Pegna et al 2009, Pedersen et al 2009, Van Klaveren et al 2009, Menezes et al 2010, Aberle et al 2011, 2013, Veronesi et al 2012, Takiguchi et al 2013, Patz et al 2014). As shown in table 1, the positive predictive values of CXR and LDCT found in different lung cancer screening trials, i.e. LSS (USA), DEPISCAN (France), DANTE (Italy), ITLUNG (Italy), and NLST (USA), are between 2.43% and 14.07% (Gohagan et al 2004, 2005, Blanchon et al 2007, Infante et al 2008, 2009, Aberle et al 2011, 2013).
Table 1. Findings of lung cancer screening with chest x-ray radiography or low-dose CT from different trials.
| Lung cancer screening trials | LSS-1 | LSS-2 | DEPISCAN-1 | DEPISCAN-2 | DANTE | ITALUNG |
|---|---|---|---|---|---|---|
| Country | USA | USA | France | France | Italy | Italy |
| Screening modality | Low dose CT | Chest x-ray radiography | Low dose CT | Chest x-ray radiography | Low dose CT | Low dose CT |
| Pack-years | 30 | 30 | 15 | 15 | 20 | 20 |
| Cut-off threshold (mm) | N/A | N/A | 5 | 5 | N/A | 5 |
| Total subjects | 1586 | 1550 | 336 | 285 | 1276 | 1406 |
| Positive | 316 | 146 | 152 | 21 | 199 | 426 |
| True positive | 30 | 7 | 8 | 1 | 28 | 21 |
| Positive detection rate (%) | 19.92 | 9.42 | 45.24 | 7.37 | 15.60 | 30.30 |
| Positive predictive value (%) | 9.49 | 4.79 | 5.26 | 4.76 | 14.07 | 4.93 |
| National Lung Screening Trial | NLST-1 | NLST-2 | NLST-3 | NLST-1 | NLST-2 | NLST-3 |
|---|---|---|---|---|---|---|
| The screening round | First year | Second year | Third year | First year | Second year | Third year |
| Country | USA | USA | USA | USA | USA | USA |
| Screening modality | Chest x-ray radiography | Chest x-ray radiography | Chest x-ray radiography | Low dose CT | Low dose CT | Low dose CT |
| Pack-years | 30 | 30 | 30 | 30 | 30 | 30 |
| Cut-off threshold (mm) | 4 | 4 | 4 | 4 | 4 | 4 |
| Total subjects | 26 035 | 24 089 | 23 346 | 26 309 | 24 715 | 24 102 |
| Positive results | 2387 | 1482 | 1174 | 7191 | 6901 | 4054 |
| True positive | 136 | 65 | 78 | 270 | 168 | 211 |
| Positive detection rate (%) | 9.17 | 6.15 | 5.03 | 27.33 | 27.92 | 16.82 |
| Positive predictive value (%) | 5.70 | 4.39 | 6.64 | 3.75 | 2.43 | 5.20 |
The advantage of lung cancer screening with LDCT over CXR is its high detection rate of physical abnormality in the lung (Aberle et al 2011, 2013). However, LDCT is not likely to differentiate between benign and malignant nodules in lung cancer screening. As observed in many large-scale lung cancer screening trials, a high percentage of benign nodules are simultaneously detected and the patients with benign nodules are likely to be recalled for additional imaging diagnosis or received invasive procedures (Veronesi et al 2012, Takiguchi et al 2013, Patz et al 2014). If a technical approach can be applied to directly differentiate these nodules of different biological invasiveness and therefore identify truly malignant nodules from early-detected nodules in recalled patients, then it would be possible to increase the positive predictive value and hence decrease the false-positive rate.
In this work, we conducted a retrospective study to investigate whether an additional procedure of localized thin-section CT is useful to further evaluate these recalled nodules and differentiate different types of early-detected nodules from lung cancer screening tests. The approach of localized thin-section CT was integrated with radiomics features extraction and machine learning. The pathological diagnosis was used to label the malignancy of nodules and supervise the machine learning. A flowchart diagram of our approach is summarized in figure 1. The quantities of classification accuracy, sensitivity, specificity, false positive rate, positive predictive value, and the area under the receiver operating characteristic (ROC) curve are used to report the performance of our technical approach of localized thin-section CT.
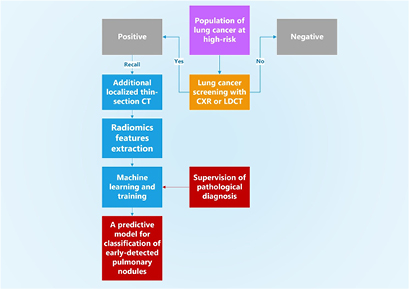
Figure 1. A flowchart diagram of our approach of localized thin-section CT with radiomics features extraction and machine learning. The pathological diagnosis is used to supervise the machine learning for classification. Our approach supervised by the pathological report provides a direct risk for early-detected pulmonary nodules from lung cancer screening tests.
Download figure:
Standard image High-resolution imageMaterial and methods
We reviewed retrospectively 113 sets of localized thin-section CT images from the image archive and communication system at our institution facility between August of 2014 and September of 2015. These patients were recalled from lung cancer screening and later received wedge resection or lobectomy. Localized thin-section CT scans were acquired during the CT-guided localization before the patient was transferred to surgery. The localized thin-section CT scan only covered the cross-sectional area of the nodule which had been previously identified from lung cancer screening. These nodules were completely resected during the surgery and sent for pathological examination. Histology slides of the specimens were fully reviewed by our experienced pathologists. Multiple nodules were identified in nine recalled patients and a total of 122 nodules were reviewed. The smallest size among these 122 nodules was 4.0 mm. The number of benign and malignant nodules were 48 and 74, respectively. There were four patients with synchronous multiple malignant nodules. A list of demographics, nodule classes, and locations are shown in table 2. This study was approved by our institutional review board.
Table 2. Population statistics of patients, nodule types, and locations.
| Statistics of patient population | |
|---|---|
| Age | 57 ± 11 |
| Min age | 29 |
| Max age | 85 |
| Female number | 54 |
| Male number | 59 |
| Total number | 113 |
| Statistics of pulmonary nodule malignancy population | |
|---|---|
| B: benign nodules | 48 (39%) |
| M: malignant nodules | 74 (61%) |
| Total number | 122 (100%) |
| Statistics of pulmonary nodule location | |||
|---|---|---|---|
| Total | B | M | |
| RUL | 30 | 11 | 19 |
| RML | 13 | 8 | 5 |
| RLL | 32 | 15 | 17 |
| LUL | 24 | 8 | 16 |
| LLL | 23 | 6 | 17 |
The slice-thickness of the localized thin-section CT images was 0.625 mm (GE Medical Systems BrightSpeed 16, Milwaukee, WI, USA). The in-plane resolution was 0.877 × 0.877 mm2. The scanning energy was 120 kVp and automatic mAs adjustment was used. The thin-section thickness of 0.625 mm allowed us to generate a sufficient number of pixels for high quality images. We then used these pixels with high spatial resolution for accurate nodule delineation and effective radiomics feature extraction.
We reported and documented the amount of radiation dose in the PACS system in our institution's medical center. The typical amount of radiation dose in the chest x-ray scan was 0.14 mSv, low-dose CT for the lung cancer screening was 1.2 mSV, and the localized thin-section CT was 0.8 mSv. We used DLP (dose-length product) and 0.014 as the factor for the effective dose conversion. DLP is the product of CTDI_vol and scanning length. The guidelines and recommended radiation dose measurement listed in AAPM Report Number 96 from the American Association of Physicists in Medicine were followed.
An open software package Imaging Biomarker Explorer (IBEX) was used in the nodule delineation and quantitative analysis of radiomics feature extraction from the thin-section CT images (Zhang et al 2015). Radiomics is an emerging research area in medical imaging for advanced image analysis in which quantitative features of tumor phenotypes are extracted from an imaging modality such as computed tomography, magnetic resonance imaging, or positron emission tomography (Kumar et al 2012, Lambin et al 2012, Aerts et al 2014, Zhang et al 2015). These phenotypic features include tumor shape, statistical distribution of gray-scale intensities, and texture properties (Kumar et al 2012, Lambin et al 2012, Aerts et al 2014, Zhang et al 2015). In our work using localized thin-section CT with radiomics feature extraction and machine learning, nodules were first manually delineated by an experienced research assistant on the image viewer of IBEX. Final nodule delineation was modified and approved by a radiologist whose expertise is in the lung cancer imaging. Two sets of images of a benign and malignant nodule acquired from the localized thin-section CT scan are shown in figures 2 and 3. Their corresponding pathological photographs and 3D views are also shown.
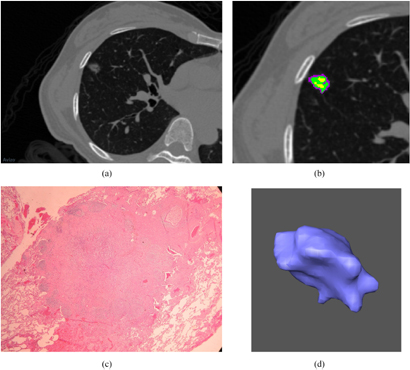
Figure 2. (a) A benign nodule is shown in a localized thin-section CT image. The window level is −500 HU and the window width is 1500 HU. A 49-year-old female has a benign pulmonary nodule in RML. The pathological diagnosis revealed the nodule is composed of fibrosis and pneumocyte hyperplasia due to chronic inflammation after CT-guided localization and wedge resection. (b) An enlarged image of figure 2(a). Different subregions within the benign nodule are identified by clustering pixels based on different CT densities. (c) A pathological photograph of this benign nodule is shown in figure 2(a). The microscopic view of the cellular scale is shown. (d) A 3D view of this benign nodule is shown in figure 2(a). The morphological view is shown by the computer graphic method of surface rendering.
Download figure:
Standard image High-resolution image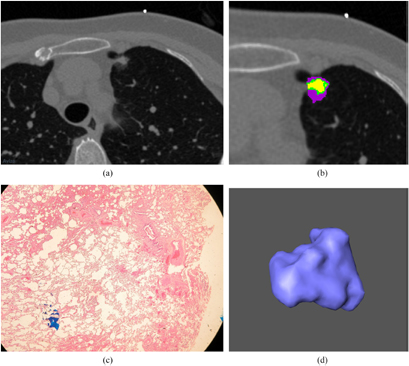
Figure 3. (a) A malignant nodule is shown in a localized thin-section CT image. The window level is −500 HU and the window width is 1500 HU. A 60-year-old female has a speculated and malignant nodule in LUL. (b) An enlarged image of figure 3(a). Different subregions within the benign nodule are identified by clustering pixels based on different CT densities. (c) A pathological photograph of this malignant nodule is shown in figure 3(a). The microscopic view of the cellular scale is shown. (d) A 3D view of this malignant nodule is shown in figure 3(a). The morphological view is shown by the computer graphic method of surface rendering.
Download figure:
Standard image High-resolution image
A total of 374 parameters from IBEX feature sets of shape (shape, n = 17), intensity-direct (intensity-d, n = 55), intensity-histogram (intensity-h, n = 49), intensity-histogram Gauss fit (intensity-g, n = 12), gray-level co-occurrence matrix (GLCM2 and GLCM3, n = 220), gray-level run-length matrix (GLRLM, n = 11), and neighbor intensity difference (NID, n = 10) were used in our image feature extraction (Zhang et al 2015). Table 3 lists the partial sets of features used in our radiomics features extraction.
Table 3. Quantitative image features extracted from localized thin-section CT.
| Quantitative image features extracted from localized thin-section CT | ||||||
|---|---|---|---|---|---|---|
| Intensity direct (55) | Intensity histogram (49) | Intensity histogram Gauss fit (12) | Gray-level co-occurrence matrix (220) | Gray-level run-length matrix (11) | Neighbor intensity difference (10) | Shape (17) |
| Energy | InterQuartileRange | GaussAmplitude | AutoCorrelation | GrayLevelNonuniformity | Busyness | Compactness |
| GlobalEntropy | Kurtosis | GaussArea | ClusterProminence | HighGrayLevelRunEmpha | Coarseness | Convex |
| GlobalStd | MeanAbsoluteDeviation | GaussMean | Clustershade | LongRunEmphasis | Complexity | ConvexHullVolume |
| GlobalUniformity | MedianAbsoluteDeviation | GaussStd | ClusterTendendcy | LongRunHighGrayLevelEmpha | Conttrast | ConvexHullVolume3D |
| InterQuartileRange | Percentile | NumberOfGauss | Contrast | LongRunLowGrayLevelEmpha | TextureStrength | Mass |
| Kurtosis | PercentileArea | Correlation | LowGrayLevelRunEmpha | Max3DDiameter | ||
| LocalEntropy | Quantile | DifferenceEntropy | RunLengthNonuniformity | MeanBreadth | ||
| LocalRange | Range | Dissimilarity | RunPercentage | NumberOfObjects | ||
| LocalStd | Skewness | Energy | shortRunEmphasis | NumberOfVoxel | ||
| MeanAbsoluteDeviation | Entropy | shortRunHighGrayLevelEmpha | Orientation | |||
| MedianAbsoluteDeviation | Homogeneity | shortRunLowGrayLevelEmpha | Roundness | |||
| Percentile | InformationMeasureCorr | SphericalDisproportion | ||||
| Quantile | InverseDiffMomentNorm | Sphericity | ||||
| Range | InverseDiffNorm | SurfaceArea | ||||
| RootMeanSquare | InverseVariance | SurfaceAreaDensity | ||||
| Skewness | MaxProbability | Volume | ||||
| Variance | SumAverage | VoxelSize | ||||
In this work, we used the two-tailed t-test and a p-value threshold of 0.05 to determine the differentiation performance of image features in the radiomics analysis. If the p-value was less than 0.05 for an image feature, we considered this feature useful to differentiate between benign and malignant nodules.
Five different machine learning classifiers in WEKA were used for performance evaluation to differentiate between benign and malignant nodules (Holmes et al 1994, Frank et al 2004). WEKA is a software system for data mining with a collection of high-performance machine learning algorithms. We included the classifiers of logistic, SMO, J48, random forest, and IBK in our work. The logistic classifier builds a linear logistic regression model and the coefficients are estimated by the maximum likelihood algorithm (Witten et al 2011). SMO is a classifier based on a support vector machine and the hyper-plane is determined with sequential minimal optimization (Witten et al 2011). J48 is classifier based on the construction of a decision tree (Witten et al 2011). Random forest is a classifier based on the ensemble learning method in which random vectors are selected for building the decision tree (Witten et al 2011). IBK is an instance-based learner in which the k-nearest neighbor algorithm is implemented (Witten et al 2011).
The training set for machine learning included 374 quantitative features extracted from thin-section CT images of 122 nodules. Their malignancy labels were based on the pathological diagnosis. We applied ten-fold stratified cross-validation for the classification tasks and repeated them 100 times to evaluate the classification performance. The following metrics were used to evaluate the performance of our machine learning and radiomics features extraction: classification accuracy, sensitivity, false-positive rate, positive predictive value, and the area under ROC (Bushberg et al 2011).
These metrics of classification accuracy, sensitivity, false positive rate, and positive predictive value are formulated as
TP is the number of malignant nodules as labeled on the pathological report and these nodules are correctly predicted by the machine learning model as malignant nodules. FP is the number of benign nodules as labeled on the pathological report, but these nodules are incorrectly predicted by the machine learning model as malignant nodules. TN is the number of benign nodules as labeled on the pathological report and these nodules are correctly predicted by the machine learning model as benign nodules. FN is the number of malignant nodules as labeled on the pathological report, but these nodules are incorrectly predicted by the machine learning model as benign nodules.
Results
In our radiomics analysis based on the extraction of quantitative features from localized thin-section CT images, the average volume of 122 nodules was 0.31 cm3 and the diameter was 1.14 cm. Among these nodules, the average volume and diameter were 0.24 cm3 and 1.11 cm for benign nodules, respectively; 0.35 cm3 and 1.15 cm for malignant nodules, respectively. The smallest size among these 122 nodules was around 4.0 mm.
We found the image feature of gray-scale intensity was useful to differentiate between benign and malignant nodules. The gray-scale intensity is also referred as the CT density or Hounsfield unit in CT images. These average gray-scale intensities were −288 ± 22 and −386 ± 21 for benign and malignant nodules, respectively. The t-test suggested that the CT density was useful and discriminative (p = 0.002 518). Among a total of 374 image features, we identified the number of useful image features to differentiate different types of early-detected nodules was 238 (64%).
In previous radiomics research found in the literature, image features which were texture-related such as sigma, skewness, kurtosis, uniformity, and entropy have been shown to be correlated with important aspects of tumor biology and physics (Ganeshan and Miles 2013, Tu et al 2015, 2017). In our work with localized thin-section CT images, we identified image features of sigma, uniformity, and entropy useful to differentiate between different types of nodules. Our calculations showed the average sigma of benign nodules was larger than that of malignant nodules (p = 0.001 675), the uniformity of benign nodules was smaller than that of malignant nodules (p = 0.032 41), and the entropy of benign nodules was larger than that of malignant nodules (p = 0.006 685).
The performance metrics of sensitivity, specificity, false positive rate, positive predictive value, and the area under the ROC curve for five different machine learning classifiers are summarized in table 4. Among these machine learning algorithms, the highest classification accuracy between benign and malignant nodules was 79%. This classification accuracy was obtained by the logistic classifier.
Table 4. Performance of five different classifiers used in our technical approach of radiomics analysis and machine learning with localized thin-section CT.
| Machine learning classifiers | Accuracy (%) | Sensitivity | Specificity | False positive rate | Positive predictive value | Area under the ROC curve |
|---|---|---|---|---|---|---|
| Logistic | 79 | 0.88 | 0.64 | 0.36 | 0.80 | 0.80 |
| SMO | 63 | 0.80 | 0.37 | 0.63 | 0.67 | 0.66 |
| J48 | 71 | 0.85 | 0.49 | 0.51 | 0.73 | 0.70 |
| Random forest | 70 | 0.79 | 0.57 | 0.43 | 0.75 | 0.72 |
| IBK | 58 | 0.57 | 0.58 | 0.42 | 0.68 | 0.60 |
To make a baseline performance comparison with our work, we used the categorical scoring system of Lung-RADS and compared it to that of localized thin-section CT with radiomics feature extraction (McKee et al 2015, Pinsky et al 2015). The Lung-RADS system is a reporting and management guideline which was developed for lung cancer screening. Our experienced radiologist measured maximum diameters from our localized thin-section CT images and documented the malignancy risk for all the nodules based on the Lung-RADS reporting system. Then we compared the performance metrics of the malignancy risk assessment between our machine learning prediction and the Lung-RADS reporting system. The results of the Lung-RADS reporting system and our technical approach are shown in table 5. As shown in table 5, the performance metrics from our technical approach with quantitative radiomics feature extraction and machine learning were better than that of the Lung-RADS reporting system.
Table 5. The baseline performance comparison between the Lung-RADS reporting system and our work. The Lung-RADS system is a reporting and management guideline developed for lung cancer screening.
| Lung-RADS | Our approach | |
|---|---|---|
| Accuracy | 52% | 79% |
| Sensitivity | 57% | 88% |
| Specificity | 45% | 64% |
| False positive rate | 55% | 36% |
| Positive predictive value | 60% | 80% |
Discussion
Lung cancer screening with CXR and LDCT is crucial to the early detection of small pulmonary nodules (Swensen et al 2005, Church et al 2013, Tammemagi and Lam 2014, Callister and Baldwin 2016, Ruparel et al 2016). However, the screening benefit of these tested is significantly limited by the high false-positive rate and low positive predictive value (Infante et al 2009, Lopes Pegna et al 2009, Pedersen et al 2009, Van Klaveren et al 2009, Menezes et al 2010, Aberle et al 2011, 2013, Veronesi et al 2012, Takiguchi et al 2013, Patz et al 2014). These inaccurately diagnosed patients may undergo serious mental or emotional anxiety. Consequently, they may be advised to accept invasive diagnostic procedures or other unnecessary treatments after a positive screening. Additionally, the detection of multiple nodules with unknown malignancies at different lung locations is likely to occur with a LDCT scan. The risk progression of these multiple nodules is not known. These recalled patients may then undergo extreme uneasiness because it is difficult for the clinical physician to create a management plan based on these multiple nodules. In our work, there were four cases of synchronous malignant nodules among nine cases of multiple nodules.
To help reduce the problems associated with lung cancer screening, a technical approach to differentiate these detected nodules of different biological invasiveness is highly desired. In this pilot study, we studied an additional localized thin-section CT to further evaluate these nodules detected from lung cancer screening. The approach of localized thin-section CT is integrated with radiomics feature extraction and machine learning to classify their malignancies between these early-detected nodules. Our technical approach is supervised by the pathological diagnosis and therefore provides a direct risk assessment of these different types of early-detected nodules.
In general, thin-section CT images provide a higher signal-to-noise ratio and hence better image quality than that of LDCT. With the smaller thickness of image slices from thin-section CT, fewer artifacts of partial volume appear than with LDCT. For the risk assessment of sub-solid nodules, it is important to calculate an accurate ratio of solid to non-solid part (Gohagan et al 2004, 2005, Blanchon et al 2007, Infante et al 2008, 2009, Aberle et al 2011, 2013). However, the slice thickness of LDCT is not standardized among lung cancer screening tests. A variety of different slice thicknesses at different medical centers is used. The variation in LDCT slice thicknesses among different clinical trials deviates from 1.0–10.0 mm (Gohagan et al 2004, 2005, Blanchon et al 2007, Infante et al 2008, 2009, Aberle et al 2011, 2013). If localized thin-section CT was added as a standard further follow-up scan, then the quantitative measurement of these early-detected nodules is expected to be more accurate and compliant with management guidelines than that of LDCT.
In the management guideline of the Lung-RADS reporting system, several threshold cut-offs of nodule sizes are defined in different categories for risk assessment and the suggestion of follow-up interval (McKee et al 2015). These thresholds are based on the growth rates or volume doubling times among different types of solid, part-solid, and ground glass nodules. Therefore, the accuracy of the size measurement based on CT images is essential to being compliant with management guidelines. Our approach with the localized thin-section CT for further assessment of recalled patients from lung cancer screening is expected to standardize the size measurement and consistently comply with management guidelines.
In our radiomics work of feature extraction, we observed that the average CT density (gray-scale intensity) of benign nodules (−288 ± 22 HU) was higher than that of malignant nodules (−386 ± 21 HU) (p = 0.002 518). Benign pulmonary nodules are formed due to a variety of causes. Their causes can be the inflammation or fibrosis in the lung from an infection. Also scar tissues may be produced in a benign nodule. When the body responds to infections such as tuberculosis, a benign nodule can be a calcified nodule containing calcium deposits. These biological processes of fibrosis, scar tissue formation, or calcification in benign nodules may increase the CT density as observed in our study of localized thin-section CT images.
The texture-related features such as sigma (benign: 250, malignant: 211, p = 0.002 781), uniformity (benign: 0.0262, malignant: 0.0209, p = 0.032 41), entropy (benign: 5.58, malignant: 5.36, p = 0.006 685) also showed the usefulness of differentiation between benign and malignant nodules. Sigma is a statistical parameter of second-order and represents the standard deviation for a statistical distribution (Ganeshan and Miles 2013). Uniformity is a parameter to represents the gray-intensity variation or fluctuation between pixels in localized thin-section CT images (Ganeshan and Miles 2013). Entropy is a parameter used in statistical mechanics and represents the measure of randomness or complexity in a physical configuration (Ganeshan and Miles 2013). Our radiomics work then suggested that the gray-scale intensities in the localized thin-section CT images of malignant nodules are more uniform or less fluctuated than those of benign nodules among early-detected pulmonary nodules.
When we further considered multiple-comparison testing to reduce the type-I errors, we lowered the p-value threshold from 0.05–0.005 to evaluate the performance of these 374 radiomics features. The number of useful features was reduced from 238 (p = 0.05) to 122 (p = 0.005). Therefore, the percentage of useful features among a total of 374 features decreased from 64%–33%. These useful features from a lower p-value threshold of multi-hypothesis testing included mean (p = 0.001 702), median (p = 0.004 226), standard deviation (p = 0.001 675), autocorrelation (p = 0.00 2094), contrast (p = 0.001 398), dissimilarity (p = 0.000 483), and sum-average (p = 0.001 079) (Zhang et al 2015).
One limitation in our current work was the stability of radiomics features which were affected potentially by the nodule delineation. Some factors that could affect the radiomics feature extraction include inter-observer variations among different radiologists, intra-observer variation in the same radiologist, image quality, and image artifacts. The inter-observer variation is mainly due to the training and clinical experiences among different radiologists. Quite often, there exists a time-dependent intra-stability for the same radiologist to manually draw the contour of the same lung nodule. The question becomes how we reduce these effects and maintain the stability of radiomics features. Different nodule delineations may mainly affect some morphology features in radiomics quantification. Other radiomics parameters which are based on statistical distribution of gray-scale intensities and different texture properties are most likely not affected. In particular, our radiomics features were extracted from localized thin-section CT images in our work. The image quality of these thin-section images was better than that of low-dose CT. In particular, the pixel number was significantly increased in thin-section CT images and hence partial volume artifact was reduced. Consequently, the variations of nodule delineation by different radiologists may be lower.
The accuracy of nodule delineation is affected by the CT image quality (Bushberg et al 2011). Consequently, the performance of our technical approach of quantitative radiomics analysis and machine learning is dependent on the image quality of thin-section CT. These factors which could potentially affect CT image quality include lung motion management, signal-to-noise ratio, image artifacts, image reconstruction method, and post-image processing (Bushberg et al 2011).
To evaluate the clinical feasibility of our study with localized thin-section CT for further assessment on recalled patients from lung cancer screening tests, our next work is to increase the total number of nodule population with a prospective study. An iterative reconstruction algorithm of high performance for image noise reduction and improvement of signal-to-noise ratio will be included in the next study.
Conclusions
In summary, lung cancer screening with CXR or LDCT is essential to the early detection of small pulmonary nodules and mortality reduction. However, the results of different clinical trials for lung cancer screening have shown that the false-positive rate is high and positive predictive value is low.
These recalled patients may suffer unnecessary treatment and experience anxiety of high impact.
In this work, we studied an additional protocol of localized thin-section CT to further evaluate these small pulmonary nodules detected from lung cancer screening. This approach of localized thin-section CT was integrated with quantitative radiomics feature extraction and machine learning. The machine learning classification was supervised by the pathological diagnosis. Among a total of 374 features extracted from localized thin-section CT images, 238 quantitative features were found useful in differentiating between benign and malignant nodules, we obtained the highest classification accuracy of 79% with the logistic classifier. Our approach of localized thin-section CT provides direct risk assessment for recalled patients. Our work is expected to assist radiologists, clinical physicians, or thoracic surgeons to increase the accuracy of malignant nodule identification among early-detected nodules from lung cancer screening tests.
Acknowledgments
This work was supported in part by research grants from the Ministry of Science and Technology in Taiwan and the Department of Medical Research at Linkuo Chang Gung Memorial Hospital (CMRPD1G0091 and CIRPG3D0273).