

Abstract
The tumor suppressor p53 is at the hub of the cellular DNA damage response network. P53-dependent cell fate decision is inseparable from p53 dynamics. A type of non-coding microRNA miR-34 has the function of enhancing p53 content. An intriguing question arises: How does miR-34 affect p53 kinetics? To address this question, we reconstruct a p53 signal transduction network model containing miR-34. Some experimental phenomena of p53 pulses are reproduced to explain the rationality of the model. The method of numerical bifurcation is used to investigate the effect of miR-34 on p53 kinetics. We point out that appropriate or higher miR-34 transcription rates can prevent DNA-damaged cell proliferation by causing p53 oscillation or high steady-state kinetic behavior, respectively. However, the lack of miR-34 synthesis ability will induce p53 to remain at a low level, and cells cannot respond correctly to DNA damage. These results are well in line with the anti-cancer role of miR-34. Our work sheds light on how miR-34 carries out its tumor-suppressive function from tuning p53 dynamic aspect.
Export citation and abstract BibTeX RIS
1. Introduction
P53, one of the most important genetic guardians, can suppress the canceration of a variety of cells [1]. As a transcription factor, p53 enables a large number of target genes to be transactivated. These target genes are involved in cell senescence, programmed cell death, cell cycle arrest, metastasis inhibition, and DNA damage response, etc [2]. More than half of human cancers are related to p53 gene defects: for example, p53 gene loss or mutation [3, 4]. MicroRNA (miR) is a class of non-coding RNA molecules, which bind to the untranslated region of messenger RNA in a specific sequence, causing translation to be inhibited [5]. Among them, miR-34 has a positive effect on p53 level [6]. Therefore, it is not surprising that the down-expression of miR-34 occurs in a lot of p53-related tumors [7]. Conversely, the over-expression of miR-34 induced by p53 suggests that miR-34 has an anticancer effect in many human cancer cells [8]. It has been found experimentally that the cell fate after DNA damage is regulated by p53 dynamics, that is, the periodic pulse dynamics of p53 level makes cells stop cell division, stable medium concentration of p53 triggers cell senescence, and a monotonous increase in p53 concentration leads to cell apoptosis [9, 10]. Therefore, it is necessary to explore the kinetic regulation of p53. However, how miR-34 finely controls the dynamics of p53 after DNA damage is not fully understood.
In the progress of p53 kinetics research, both biological experiments and mathematical models have played a very important role [11]. The mathematical models are very predictable. For example: (i) as early as 2002, Tiana et al [12] used the p53-Mdm2 (the major negative regulator of p53) motif to add a large time delay, which resulted in a stable limit cycle for the dynamic system, although the undamped oscillation of p53 had not been discovered at that time; (ii) as early as 2011, Zhang et al [13] employed a mathematical model to demonstrate that there may be two-stage dynamics in the p53 system, as far as we know, this phenomenon was not reported experimentally until 2020 [14]. As we all know, negative feedback loop (NFL) is essential to generate pulses dynamic in protein signal networks, and the periodic pulse dynamics requires time lag in NFL [15]. Time delay plays a role in many oscillating or chaotic systems [16–18]. In fact, most of the p53 vibrator models have two elements, i.e. NFL and delay. Delay differential equations obviously include time lag, and ordinary differential equations (ODE) can also include an invisible time delay. There are hidden delay in the p53 models that distinguishes the cytoplasm and the nucleus [19]. Similarly, supposing an intermediate substance between p53 and Mdm2 is also a way to hide the time lag [20]. Adding a positive feedback loop (PFL) to the NFL can also produce continuous and stable vibration, because PFL can provide delay for NFL [21]. In a variety of biological networks, the NFL-PFL coupling model is more tunable and therefore more realistic [22–24].
Motivated by the above considerations, we develop a NFLs-PFLs coupled p53 ODE model containing miR-34. Our model is derived by modifying the model of Zhuge et al [25]. Their model used a nonlinear sigmoidal function (the generalized Hill function) to adapt the model established by Zhang et al [26], and explained the mediation of p53 co-factor on p53 dynamics and cell fate well. In this work, we ignore the role of co-factor and add miR-34 pathway to the p53 vibrator module to rebuild a mathematical model in order to analyze the effect of miR-34 on p53 dynamics under DNA damage. For a detailed description of the model, see section 2. We first reproduce the continuous or damped oscillation of p53 found in the experiments [27, 28]. Secondly, the method of numerical bifurcation is applied to the model, and we find that this ODE system has two kinds of stability under standard parameters, one is a stable limit cycle, and the other is a stable fixed point. The appropriate expression of miR-34 is required for p53 oscillation. Finally, we investigate the kinetics of p53 under the combined action of the parameter regulated by DNA damage and the production parameter of miR-34. The dynamic effect of miR-34 on p53 system is verified again. The anticancer effect of miR-34 is explained from the perspective of p53 kinetics.
2. Model
In resting cells, the ubiquitin-proteasome degradation pathway caused by Mdm2 results in low levels of p53 [29]. In turn, p53 can promote the expression of Mdm2. In the case of DNA damage, the mutual regulation between p53 and Mdm2 is altered. The protein kinase ATM first senses DNA damage and is activated by phosphorylation [30]. After being activated, ATM catalyzes the phosphorylation of p53 and Mdm2 [31]. Phosphorylated p53 has more transcriptional activity, while phosphorylated Mdm2 is more easily degraded [32]. Interestingly, phosphorylated Mdm2 can also increase the translation efficiency of p53 messenger RNA [33]. On the one hand, p53 triggers the dephosphorylation (inactivation) of ATM by inducing the expression of phosphatase (Wip1), forming a NFL [34]. On the other hand, p53 induces the transcription of miR-34, and miR-34 hinders the translation of the protein (Mdm4) required for Mdm2 to ubiquitinate p53. Therefore, miR-34 inhibits the pro-degradation function of Mdm2 on p53, forming a PFL [6]. The schematic diagram of the model is shown in figure 1. Here Mdm2 is divided into three categories, i.e. Mdm2 in the nucleus (Mdm2n), Mdm2 in the cytoplasm (Mdm2c), and phosphorylated Mdm2 in the cytoplasm (Mdm2p). According to the law of mass action, the equations are as follows:


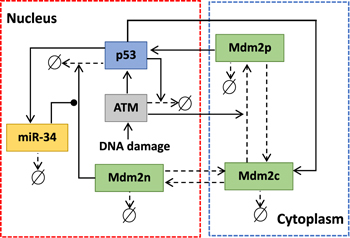
Figure 1. Schematic depiction of ATM-p53-Mdm2 module regulated by miR-34. Arrow-headed and solid-circle-headed solid lines denote promotion and inhibition, respectively. Arrow-headed dashed lines represent state transition or degradation.
Download figure:
Standard image High-resolution imageHere [] represents the dimensionless concentration and prime means its differentiation to time. All promotion or inhibition are expressed as the generalized Hill functions. The sub-functions are as follows:


Numerical solution is done by MATLAB Euler method. The numerical bifurcation is performed with the free software XPPAUT. The parameter values and descriptions are shown in the table 1. These parameters mainly come from [25], and some parameters are adjusted with 'trial and error' method. Limited to experimental data, the real parameter values are usually difficult to obtain, and the 'trial and error' approach is popular, for example in [35]. The concentration units of the parameters are dimensionless 'C', the proportional constants have no unit marked as '\', and the time unit is minutes ' '.
'.
Table 1. Simulation parameters.
| Parameter | Description | Values (units) |
|---|---|---|
| vatm | ATM activation rate | 1.2 (C min−1) |
| datm | ATM maximum inactivation rate | 0.53 ( ) ) |
| vp53 | P53 maximum production rate | 0.95 (C min−1) |
| dp53 | P53 maximum degradation rate | 1.2 ( ) ) |
| vmdm2 | Mdm2 maximum production rate | 0.153 (C min−1) |
| kp | Mdm2 maximum phosphorylation rate | 0.65 ( ) ) |
| kq | Mdm2 dephosphorylation rate | 0.24 ( ) ) |
| kin | The rate of Mdm2 transfer from the cytoplasm to the nucleus | 0.14 ( ) ) |
| kout | The rate of Mdm2 transfer from the nucleus to the cytoplasm | 0.01 ( ) ) |
| dmdm2 | Mdm2c degradation rate | 0.034 ( ) ) |
| vmir | miR-34 maximum production rate | 0.035 (C min−1) |
| dmir | miR-34 degradation rate | 0.05 ( ) ) |
| ρ0 | P53-dependent ATM inactivation proportional constant | 0.9 (\) |
| ρ1 | ATM-dependent p53 activation proportional constant | 0.9 (\) |
| ρ2 | Mdm2p-dependent p53 production proportional constant | 0.98 (\) |
| ρ3 | Mdm2n-dependent p53 degradation proportional constant | 0.97 (\) |
| ρ4 | P53-dependent Mdm2 production proportional constant | 0.98 (\) |
| ρ5 | ATM-dependent Mdm2 phosphorylation proportional constant | 0.9 (\) |
| ρ6 | P53-dependent miR-34 production proportional constant | 0.99 (\) |
| k0 | Half-saturated concentration of p53-dependent ATM inactivation | 1 (C) |
| k1 | Half-saturated concentration of ATM-dependent p53 activation | 0.3 (C) |
| k2 | Half-saturated concentration of Mdm2p-dependent p53 production | 0.057 (C) |
| k3 | The maximum half-saturated concentration of Mdm2n-dependent p53 degradation | 0.5 (C) |
| k4 | Half-saturated concentration of p53-dependent Mdm2 production | 4.43 (C) |
| k5 | Half-saturated concentration of ATM-dependent Mdm2 phosphorylation | 1 (C) |
| k6 | Half-saturated concentration of p53-dependent miR-34 production | 0.8 (C) |
| α | Proportional constant of miR-34-regulated half-saturated | |
| concentration of Mdm2n for p53 degradation | 0.9 (\) | |
| κ | Half-saturated concentration of miR-34-regulated half-saturated | |
| concentration of Mdm2n for p53 degradation | 1 (C) | |
| r0 | Mdm2n and Mdm2c degradation rate ratio | 1.7 (\) |
| g0 | Mdm2p and Mdm2c degradation rate ratio | 3.58 (\) |
3. Results
3.1. Reproduction of p53 oscillation dynamics
The vibration dynamic of p53 under the deterministic case is exhibited in figure 2(a). The p53 oscillation period is between 4 and 7 h, which is consistent with the pulse interval in the experiment [27]. The long-lasting and stable-interval pulse of p53 means that the system has the possibility of a stable limit cycle. To explain this point clearly, we draw a trajectory in the three-dimensional space in figure 2(b). The trajectory from the origin quickly converges to a stable circle, which is the limit cycle. In real cells, p53 will not oscillate indefinitely because the damaged DNA will be repaired during the p53 pulse phase. When DNA damage drops to a certain level, p53 may recover to a basal concentration [36]. The above analysis are the p53 oscillation dynamics under the ideal condition. Due to the PH and temperature etc in the real cells are fluctuation, or the number of molecules in a cell is not very large, the ODE model cannot reflect the dynamics of the protein well. There may be internal noise or external noise disturbing the system [37]. Therefore, we will consider the oscillation of p53 corresponded to the stochastic differential equation (SDE) next.
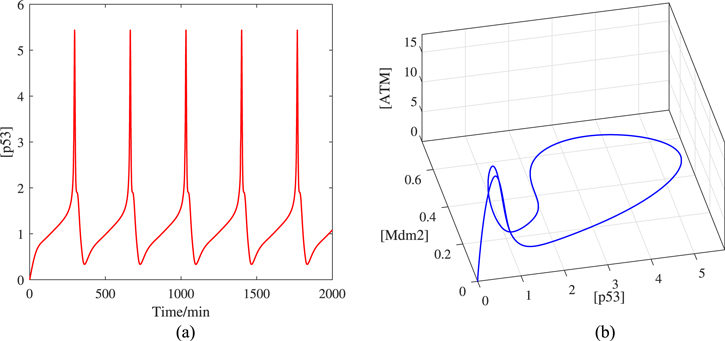
Figure 2. (a) Time series of [p53] and (b) trajectory in the deterministic case. Here [Mdm2] = [Mdm2n] + [Mdm2c] + [Mdm2p].
Download figure:
Standard image High-resolution imageThe ODE dx/dt = F(x) can be rewritten as SDE dx/dt = F(x) + ξ, here ξ is the noise term. ξ is usually assumed Gaussian white with zero mean, i.e. 〈ξ(t)〉 = 0 and  , where δ(t) is the Dirac function and D is the homogeneous constant matrix, which describes the intensity of noise. A noise system with such properties can further obtain the Fokker–Planck equation by introducing a probability flow. Therefore, this SDE system is used to create the potential landscape related to steady probability distribution [38]. As mentioned above, the cellular networks have internal or external noise, and this additive noise is closer to the internal noise [39]. We display 50 single-cell samples in figure 3(a). All of them exhibit significant p53 pulse. Unlike the deterministic case, the pulse interval and height of p53 are uncertain in the random simulation. In other words, the p53 oscillations are not synchronized in the population of cells. It is easy to understand that the oscillation of p53 is damped in the population cells, because the condition of population cells is the average result of all single cells, as shown in figure 3(b). Thus, the p53 oscillation behavior observed experimentally by Western blotting is damped [28].
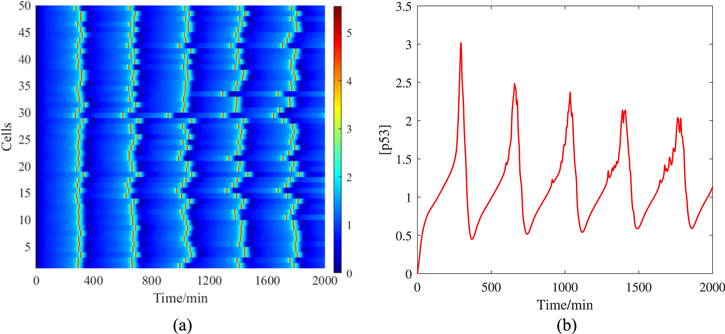
Figure 3. Time series of [p53] under random simulation. The noise intensity D is set to 10−7. (a) is 50 single-cell samples, and the color bar represents the dimensionless concentration of p53. (b) is the average of 50 single cells.
Download figure:
Standard image High-resolution image3.2. The kinetics of p53 mediated by miR-34
The function of miR-34 in the p53 signaling network has been initially discovered, but how miR-34 regulates p53 dynamics remains mysterious. Figure 4 depicts the p53 kinetics of three miR-34 expression rate (vmir) scenarios. When miR-34 is expressed at a low level (vmir = 0.02), p53 remains at a low level; when miR-34 is expressed at a high level (vmir = 0.04), the p53 level first increases monotonically, then decreases and finally stabilizes at a higher level. The model shows that for p53 to oscillate, miR-34 needs to maintain a medium production rate, similar to the prediction in [40]. In order to fully reflect the correlation between miR-34 generation rate and p53 kinetics, we draw a bifurcation diagram in figure 5. There are four key points in figure 5(a), the saddle node bifurcation point at the steady-state branch (SN), the Hopf bifurcation point (HB), the saddle node bifurcation point at the limit cycle branch (SNL), and the saddle node invariant circle bifurcation point (SNIC). The oscillation originates from HB and ends at SNIC. These four bifurcation points divide this parameter into five intervals: (i) when vmir ∈ [0, SN], p53 maintains a low steady state; (ii) when vmir ∈ (SN, SNIC], the system appears excitable state; (iii) when vmir ∈ (SNIC, HB], p53 has only stable oscillation; (iv) when vmir ∈ (HB, SNL], p53 has both stable steady state and stable oscillation; and (v) when vmir ∈ (SNIC, + ∞), p53 finally high steady state will be achieved.
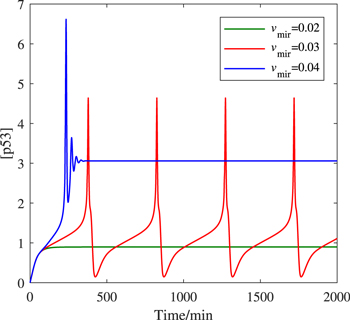
Figure 4. Time occurs of [p53] at different vmir values.
Download figure:
Standard image High-resolution image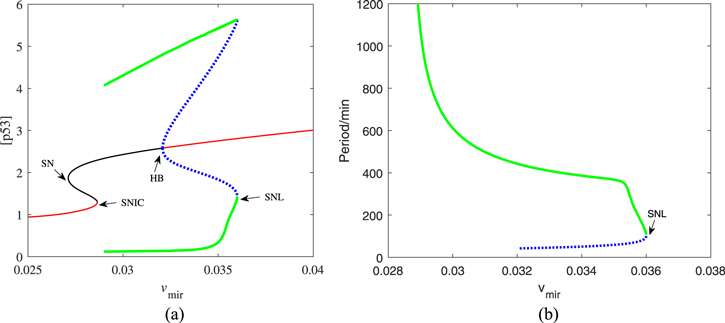
Figure 5. (a) Codimension-one bifurcation diagram of [p53] versus the parameter vmir. The red solid and the black solid lines represent stable and unstable equilibria, respectively. The green solid lines and the blue dotted lines are the maxima and minima of stable and unstable limit cycles, respectively. (b) The oscillation period as a function of vmir. The green solid lines and the blue dotted lines are the period of stable and unstable limit cycles, respectively.
Download figure:
Standard image High-resolution imageThis oscillator has a remarkable characteristic that the oscillation appears in the form of 'all or none', that is, all the oscillation is of large amplitude, and there is no ambiguous phenomenon of either seeming or non oscillation. Such oscillation feature may be attributed to the existence of PFL [41]. And the oscillation produced by this vibrator has a variety of rhythms, as shown in figure 5(b). A wide range of frequencies is required by many biological processes (like heartbeats and cell cycles) [24]. Therefore, our model may be more suitable for the truth. Moreover, the bifurcation diagram shows that in addition to stable oscillation, there is also a stable steady state in the dynamic system under the default parameters. As shown in figure 6, there are one stable limit cycle and one stable fixed point in the phase diagram. Which dynamic of the system can appear is historically dependent. Indeed, p53 pulsed cells accounted for a certain percentage after DNA damage, but not all in the experiment [27]. Thereby, it is plausible that the p53 dynamic system has other stability.
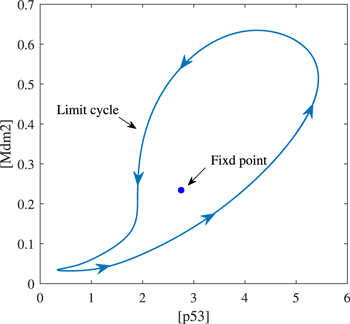
Figure 6. Phase diagram on ([p53], [Mdm2]) plane.
Download figure:
Standard image High-resolution image3.3. The combined effect of miR-34 and ATM on p53 dynamics
The above analysis suggest that different miR-34 expression capabilities cause distinct p53 kinetics. In order to make these results more solid, we further combine vmir with another parameter vatm to analyze. As a sensor, ATM activation parameter vatm is affected by DNA damage [30]. Figure 7 depicts the bifurcation curve of p53 steady-state branch as a function of vatm under different vmir values. P53 keep low concentration when vmir = 0.02 despite vatm varying. The bifurcation curve is 'S' shaped when vmir = 0.03: the lower branch is composed of stable nodes; the middle branch is consist of unstable saddle points; and the upper branch is the unstable focus in a large vatm range. The bifurcation curves corresponding to vmir = 0.04 and vmir = 0.03 are qualitatively similar, and the only difference is that the oscillation is compressed in a very narrow vatm interval. As vatm increases, the unstable focus becomes stable nodes after encountering HB. The bifurcation curves also mean that: (i) if the expression of miR-34 is low, p53 will not reach a high concentration; (ii) the appropriate expression of miR-34 will make p53 oscillation conditions more relaxed; and (iii) when miR-34 is expressed in large quantities, p53 is more likely to be at a high concentration. These agree well with the previous analysis in section 3.2.
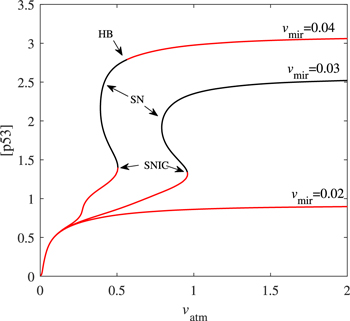
Figure 7. Codimension-one bifurcation diagram of [p53] versus the parameter vatm at the given vmir. Only steady-state branches are presented here. The red solid and the black solid lines represent stable and unstable steady-state, respectively.
Download figure:
Standard image High-resolution imageWe further extend the four bifurcation points in figure 5(a) on the (vmir, vatm) parameter plane, as shown in figure 8. This parameter region is divided into five subregions by four bifurcation curves: (i) p53 is low expressed in the R1 region; (ii) the p53 regulatory network is excitable in the R2 region; (iii) in the R3 area, p53 has repeated pulses; (iv) the p53 dynamic system appears atypical bistable (stable steady state and stable vibration) when the parameters are in the R4 region; and (v) in the R5 region, p53 cascade occurs. The co-dimension two bifurcation graph confirms the correctness of co-dimension one bifurcation graphs. When the abnormal DNA signal is sufficient to fully activate ATM, miR-34 can finely regulate the dynamics of p53 motif. Furthermore, the two PFLs coupled dynamical systems have the potential to produce tristability [42]. In our model, in addition to the miR-34 pathway, the Mdm2p pathway is also a PFL. When the expression level of miR-34 is extremely high, as plotted in figure 9, the lower branch of the 'S' shaped curve is folded. Since the intermediate steady state of the tristable state is very low and close to the low steady state, we do not do the extra research.
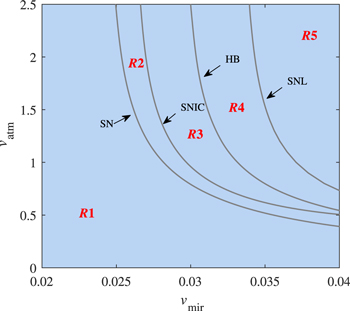
Figure 8. Codimension-two bifurcation diagram for parameters vmir and vatm.
Download figure:
Standard image High-resolution image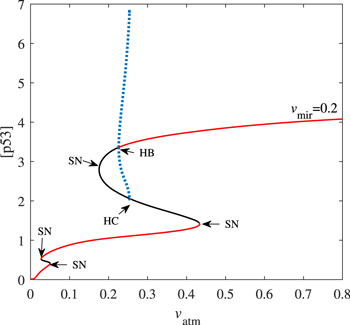
Figure 9. Codimension-one bifurcation diagram of [p53] versus the parameter vatm when vmir = 0.2. Here HC is the homoclinic bifurcation point. The red solid and the black solid lines represent stable and unstable steady-state, respectively. Blue dotted lines are the maxima and minima of unstable limit cycles.
Download figure:
Standard image High-resolution image4. Discussion and conclusion
Our ODE model does not include the equations of Wip1 and Mdm4, but the roles of these two proteins in the signal transduction network have been considered, i.e. p53 promotes ATM inactivation, and miR-34 inhibits the effect of Mdm2n on p53 degradation. In addition to Mdm4, miR-34 suppresses SIRT1 protein is also a possible mechanism [6]. SIRT1 does not participate in the degradation of p53, but converts active p53 into inactive p53. Therefore miR-34 prevents p53 inactivation. If this pathway is introduced, the reduction coefficient  should be the multiplication of two Hill functions (degradation multiply by inactivation), which is similar to the generation coefficient
  (production multiply by activation). We reset
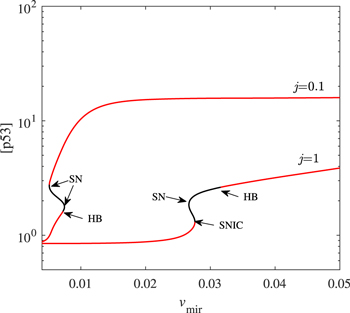
 ![${\overline{d}}_{{\rm{p}}53}={d}_{{\rm{p}}53}(1-{\rho }_{3}+{\rho }_{3}\displaystyle \frac{{[\mathrm{Mdm}2{\rm{n}}]}^{4}}{{\overline{k}}_{3}^{4}+{[\mathrm{Mdm}2{\rm{n}}]}^{4}})(1-\alpha +\alpha \tfrac{{j}^{4}}{{j}^{4}+{[\mathrm{miR}-34]}^{4}})$](https://content.cld.iop.org/journals/0253-6102/73/3/035601/revision3/ctpabd84cieqn13.gif) . The parameter j is negatively related to the strength of this pathway. When this effect of miR-34 on this way is not very strong (j = 1), our results remain unchanged. But as the intensity of this effect increases (j = 0.1), the p53 oscillation behavior will be destroyed and replaced by an ultra-high steady state (see figure 10). However, the inhibition of miR-34 on SIRT1 does not seem to occur in some cases [6].
. The parameter j is negatively related to the strength of this pathway. When this effect of miR-34 on this way is not very strong (j = 1), our results remain unchanged. But as the intensity of this effect increases (j = 0.1), the p53 oscillation behavior will be destroyed and replaced by an ultra-high steady state (see figure 10). However, the inhibition of miR-34 on SIRT1 does not seem to occur in some cases [6].
Figure 10. The scenario of another miR-34 pathway is introduced into the model. Codimension-one bifurcation diagram of [p53] versus the parameter vmir at the given j. Only steady-state branches are presented here. The red solid and the black solid lines represent stable and unstable steady-state, respectively.
Download figure:
Standard image High-resolution image
In summary, the main reason of cancer is DNA damage [11]. This paper uses numerical methods to study a mathematical model of miR-34 and p53 motif crosstalk after DNA damage. If cells fail to respond appropriately to DNA damage, it may lead to uncontrolled cell proliferation [11]. We find that miR-34 plays an important role in p53-mediated cellular DNA damage response. If ATM is fully activated, the moderate miR-34 synthesis rate triggers p53 oscillation, leading to cell cycle arrest. The larger miR-34 production rate is conducive to the high concentration of p53, causing cell senescence or apoptosis. Too low miR-34 production will make cells with low p53 concentration, meaning that DNA damaged cells can also proliferate. This may be the reason why the miR-34 content in many tumors is low. Moreover, miR-34 can also be related to the apoptosis regulatory network downstream of p53 [43], which is worthy of further research in the future. We hope that our work will be helpful to the design of biological experiments and anti-cancer strategies.
Footnotes
- *
Project supported by the National Natural Science Foundation of China under Grant No. 11762011.