
Abstract
Objective. Non-invasive electromyographic techniques can detect action potentials from muscle units with high spatial dimensionality. These technologies allow the decoding of large samples of motor units by using high-density grids of electrodes that are placed on the skin overlying contracting muscles and therefore provide a non-invasive representation of the human spinal cord output. Approach. From a sample of >1200 decoded motor neurons, we show that motor neuron activity can be identified in humans in the full muscle recruitment range with high accuracy. Main results. After showing the validity of decomposition with novel test parameters, we demonstrate that the same motor neurons can be tracked over a period of one-month, which allows for the longitudinal analysis of individual human neural cells. Significance. These results show the potential of an accurate and reliable assessment of large populations of motor neurons in physiological investigations. We discuss the potential of this non-invasive neural interfacing technology for the study of the neural determinants of movement and man-machine interfacing.
Export citation and abstract BibTeX RIS

Original content from this work may be used under the terms of the Creative Commons Attribution 3.0 licence. Any further distribution of this work must maintain attribution to the author(s) and the title of the work, journal citation and DOI.
Introduction
The introduction of the concentric needle by Adrian and Bronk [1] opened the era of motor unit investigations. Motor neurons are the only neural cells that can be accessed individually in humans without surgery and therefore constitute a unique experimental potential in the study of the neural control of movement. Over the years, a number of principles of motor neuron control during voluntary contractions have been observed. Muscle force is controlled by progressive recruitment and derecruitment of motor neurons and by modulation of their discharge rates. In most conditions, motor neurons are recruited and de-recruited orderly by size and begin discharging at the recruitment threshold at rates of five to eight pulses per second, increasing their discharge rate with the increase in force [2–4]. Although these general principles of motor neuron behavior are largely accepted and have been extensively confirmed, more detailed aspects of motor neuron behavior are conversely debated since decades [5–10], and this is mainly due to the small observation window from classic EMG techniques [10–12].
The main reasons for the controversy in many principles of motor neuron behavior are, first, the relatively small sample of motor neurons that can be concurrently investigated with conventional techniques and, second, the limitations in accuracy and variability over time of the EMG decomposition methods. Intramuscular recordings, which have been the main means for motor neuron investigation over the past 90 years, indeed only provide a very small observation window, limited to three to five motor units at a time and, usually, at relatively low forces. Moreover, the small observation window implies variability of the results in different studies and in different experimental sessions within the same studies. These limitations have been overlooked in the past but it is now apparent that some of the established principles of motor unit physiology may need to be revised because of the experimental and methodological limitations with which they were observed [13].
Recently, non-invasive EMG signals have been used for motor unit investigations [13, 14]. Although these approaches have been in principle already proposed two decades ago [15, 16], only in the past ten years it has been possible to develop decoding algorithms for the surface EMG that match in accuracy those applied to intramuscular EMG [17, 18]. Moreover, the lower spatial selectivity of surface EMG compared to invasive EMG has also allowed the increase in the sample of concurrently identified motor units [11, 19]. The latter characteristics has revolutionized the study of neural control of movement by substantially enlarging the observation window into the output circuits of the spinal cord, in a completely non-invasive way. The identification of relatively large samples of motor units has also decreased the variability of the observations [17, 20] and increased reliability of the results, which has been further improved by the possibility of tracking the same motor units over time in different experimental sessions [19, 21].
The accuracy of surface EMG decomposition has been previously shown in a number of studies [11, 17, 21–23]. The tracking of the same motor neurons over time in different sessions, which limits the variability in the assessment of motor neuron behavior, has also been proven [19, 21]. Nonetheless, accuracy and reliability of these methods are still strongly debated and uncertainty on surface EMG decomposition is still considered the main obstacle in furthering our physiological understanding of motor neuron behavior in humans [10]. For this reason, here we combine for the first time an analysis of accuracy and of reliability over time performed over >1200 motor neurons across the full recruitment range of the tibialis anterior muscle, with the aim of providing a definite proof of the accuracy, reliability, and robustness of the surface EMG technology for human motor neuron interfacing. We use novel parameters to assess the robustness of motor unit decomposition and introduce metrics to assess the validity of decomposition.
The accuracy and tracking analysis demonstrate that high-density surface EMG decomposition has the potential to open a new era in the study of the neural control of movement, in the same way as the concentric needle did 90 years ago. With these technologies and their ultimate validation presented here, we have the possibility to observe a much greater window from the spinal cord and in a more reliable way over time than it has been previously possible, in a fully noninvasive way.
Materials and methods
Participants
Fourteen healthy men volunteered to participate to this study, whose procedures and protocols were approved by the local Ethical Committee of the University of Rome 'Foro Italico' (approval no. 44 680) and complied with the standards set by the Declaration of Helsinki. Prior to their involvement, participants were thoroughly informed about the purpose of the study alongside with the experimental procedures and the potential side effects involved. Volunteers were non-smoking recreationally active individuals without any previous history of neuromuscular disorders and/or lower limb surgery. Participants' eligibility to the study and physical activity habits were assessed with a standard health survey and with the IPAQ (International Physical Activity Questionnaires) questionnaire [24]. Only volunteers with light to moderate aerobic physical activity up to a maximum of twice per week and not involved in any regular physical activity program were considered eligible to participate to the study. Because of personal reasons not pertaining to the study, two out of fourteen individuals withdrew, which resulted in a total of 12 participants (age: 25.1 ± 2.9 year; height: 1.78 ± 0.06 m; weight, 73.3 ± 8.0 kg; IPAQ: 2161 ± 1128 MET min · wk−1) completing the study. A written informed consent was obtained by all participants prior to the beginning of the study.
Overview of the study
The research was designed as a cross-sectional study characterized by three distinct laboratory visits over a period of seven weeks. Session one was dedicated to a familiarization with the experimental setup and testing protocol, involving the practice of maximal voluntary contractions (MVCs) and submaximal trapezoidal isometric contractions of ankle dorsiflexors. Session two, which was carried out three to five days after the familiarization, was dedicated to the main baseline assessment and included the concomitant recordings of ankle dorsiflexor forces exerted during maximal and submaximal isometric contractions and of high-density surface EMG (HDsEMG) signals from the tibialis anterior muscle of the dominant limb. Session three was held four weeks after session two and included the repetition of the same baseline measurements. Participants were thoroughly instructed to maintain their physical activity daily habits and to keep their diet unchanged throughout the four-week period of the study.
Experimental protocol
All the experimental sessions took place in the Integrated Exercise Physiology Laboratory (LIFE) of the Department of Movement, Human and Health Sciences of the University of Rome, Italy. All the experimental sessions (sessions 1-to-3) were conducted on the same customized ankle ergometer (see below).
Each testing session started with a brief standardized warm-up and was followed by the main task involving isometric maximal (MVCs) and submaximal (trapezoidal contractions) voluntary ankle dorsiflexions of the dominant foot (self-reported). Warm-up consisted of eight isometric dorsiflexions (4 × 50%, 3 × 70%, 1 × 90% of self-perceived maximum) separated by 15–30 s of rest. After the warm-up, participants performed 3-to-4 maximal isometric voluntary contractions (MVCs) in order to determine the peak maximal voluntary force (MVF) of dorsiflexor muscles. Each MVC was separated by a recovery period of 30 s. During the MVC tasks, participants were instructed to 'push as hard as possible' for 3-to-5 s and were verbally encouraged to exert peak force within each trial. A feedback of the peak force achieved during each previous MVC was provided through a horizontal bar displayed on a monitor. After filtering the force with a 20 Hz low-pass filter, ankle dorsiflexors' MVF, corresponded to the highest force recorded among any MVC contractions, was used as a reference to establish the intensity of the submaximal contractions.
Five minutes after the completion of the MVCs, the participants performed a total of six submaximal isometric trapezoidal contractions at three force targets (2 × 35%, 2 × 50%, 2 × 70% of MVF), with three to five min of rest in between. Each trapezoidal contraction was characterized by a linear increase in force up to a target level, maintenance of a steady state at the target force (10 s), and a linear decrease of force to the baseline values. The contraction speed during the ascending and descending phase of the trapezoidal contraction was kept constant at 5% MVF·s-1 in all contractions. As practiced in the familiarization session, participants had to match as precisely as possible a trapezoidal template displayed on a monitor placed at 1-m distance with a constant 88 x 88 px/%MVF visual gain. The muscle force expressed during each contraction was also provided on the monitor as visual biofeedback. These trials were randomized and for each participant, the same randomization order of the baseline measurement was maintained in the post assessment.
Participants were asked to avoid vigorous physical exercise (48 h) and caffeine consumption (24 h) before the main measurement sessions. Potential effect of diurnal variability in muscle contractility and hence force production were also taken into account by carrying out the two main measurement sessions at the same time of the day [25].
Force signal recording
The experimental setup consisted of a custom stiff ankle ergometer (OT Bioelettronica, Turin, Italy), secured to an examination table by adjustable straps (see figure 1). The adjustability of the ergometer allowed a tailored regulation of its placement according to individual lower limb length. The individual experimental configuration was defined during the familiarization visit and re-adopted in the main experimental sessions. The volunteers were comfortably seated on the massage table, with the hips flexed at ~120° (180° = neutral position), the knees fully extended at ~180° (180° = neutral position) and the ankle of the dominant foot at ~100° of plantar flection (90° = neutral position). The ankle joint and the foot were tightly fastened to an adjustable foot plate by means of Velcro straps (~3 cm width) arranged on the distal third of metatarsals and on the foot dorsum, respectively. The foot plate was in turn connected in series with a calibrated force transducer (CCT Transducer s.a.s, Turin, Italy), which was positioned perpendicular to the plantar surface of the foot. In order to limit unnecessary movements, the dominant knee was also secured by a strap positioned above the patella. The contralateral leg (non-dominant) rested on the massage table.
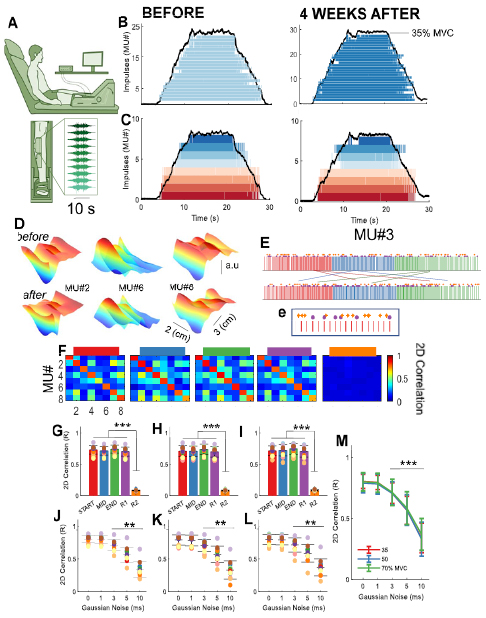
Figure 1. Interfacing humans with motor neurons. High-density EMG recordings and motor unit decomposition accuracy. (A) The experimental setup consisted of an isometric dynamometer that recorded ankle-dorsiflexion force concurrently with two high-density EMG grids (64 electrodes each) during isometric voluntary force contractions ranging from 35% to 70% of maximal voluntary force. (B) The high-density EMG signals were decomposed in individual motor units by blind source separation. The left side of panel B shows a population of identified motor unit during an isometric ramp contraction at 35% of MVC for a representative subject before and after (right panel) four weeks. It can be noted a different number of total identified motor units within the two experimental sessions. We then aimed in identifying the motor units in common in these two experimental sessions. (C) The discharge timings identified in B were used to obtain a spatial representation of the motor unit action potential. The motor units showing a similar 2D cross-correlation from these two separate recordings were considered to be similar. In this figure, each color corresponds to the discharge timings of the same motor unit before and after four weeks. It can be noted that there was a significant reduction in the total number of identified motor units. (D) Three-dimensional (3D) representation of three distinct motor unit action potentials before and after four weeks. The 3D action potential was plotted as a function of the row and column of the high-density EMG grids and with an amplitude corresponding to the center of the motor unit action potential. Note the strong similarity in the 3D waveform before and after four weeks. (E) Validation of the decomposition accuracy. We extracted the motor unit action potential waveform via spike trigger averaging across five different time windows within each motor unit spike train. The discharge times in red correspond to the ramp up phase of the contraction (START), blue to the plateau (MID), and green to the ramp-down (END). The purple dots in (e) correspond to random locations (R1) of the motor unit firings across the whole duration of the contraction with a total number matching the average of the spikes obtained during the ramp-up, plateau, and ramp-down. The yellow diamonds correspond to random instants of time (R2) across the motor unit spike train window length. The number of random spike instants corresponded to the average number of motor unit impulses for each individual. (F) Confusion matrix of the 2D cross-correlation value of the tracked motor units that are shown in (C). (G)–(I). The motor unit action potential waveform across these five distinct phases were cross-correlated across all possible combinations (E) and for each target force (35% F, 50% g, and 70% of maximal force). The average value of the specific correlations for each contraction phase against the others is shown in the bar plot. It can be noted that the 2D correlation (2D) did not change as a function of phase of the contraction. However, when the spikes were selected randomly (orange bar), the 2D correlation was eight-fold lower compared to any other conditions. Subjects are color-coded. (J)–(l) We inserted random gaussian noise ranging from 1 to 10 ms in the motor unit that were tracked across the four weeks (35% I, 50% l, and 70% m, of maximum). As little as 3 ms of gaussian noise disrupted the correlation between the tracked motor unit action potentials and this was independent of contraction intensity (M). *** = P < 0.001, **P = <0.01.
Download figure:
Standard image High-resolution imageThe analogue signal from the load cell was amplified (×200), sampled at 2048 Hz and converted to digital with an external 16-bit analogue-to-digital (A/D) converter (EMG-Quattrocento, OT Bioelettronica, Turin, Italy). The force signal was recorded with the software OTbiolab (OT Bioelettronica, Turin, Italy) and the force visual feedback was provided to the participants through a custom-made software (LabVIEW 8.0: National Instruments, Austin, TX, USA).
High-density EMG signal recording
Surface EMG signals were detected from the dominant tibialis anterior muscle during submaximal isometric ankle-dorsiflexions. In particular, two high-density adhesive grids of 64 equally spaced electrodes (13 rows × 5 columns; gold-coated; diameter 1 mm; inter-electrode distance (IED) of 8 mm; OT Bioelettronica, Turin, Italy) were positioned on the muscle belly (1st grid) and on the distal portion (2nd) of TA muscle, respectively. The baseline noise in the EMG signals was set a threshold of 20 µV (average peak-to-peak amplitude over 6 s, monopolar signals).
Before placing the two high-density grids, an experienced operator identified through palpation the perimeter of the muscle and marked its profile with a surgical pen. A 16-electrodes dry array (silver bar 5 mm long; 1 mm thick; IED of 5 mm; OT Bioelettronica, Turin, Italy) was adopted to locate the distal innervation zone (IZ) of TA and to estimate the anatomical direction of muscle fibres. The linear array was moved over the muscle parallel to the lateral margin of the tibia and sensibly adjusted in order to clearly observe the point of inversion in propagation direction of action potentials (APs) along the column of electrodes [11, 22]. The estimation of anatomical direction of muscle fibres was assessed by an experienced operator who visually inspected a clear propagation of motor unit action potentials from the innervation zone to the tendon without significant changes of APs waveforms. Once identified, both the IZ and estimated direction of muscle fibres were marked with a surgical pen for optimal electrode placement and following this procedure, the skin was prepared (shaving, light skin abrasion and cleansing with 70% ethanol). In order to guarantee an optimal skin-electrode contact, the two adhesive grids were attached to the skin above the muscle with disposable bi-adhesive foam layers whose cavities, in correspondence with electrodes, were filled with conductive paste (SPES Medica, Salerno, Italy). The first grid was positioned over the distal portion of TA muscle with the first column of electrodes oriented to the direction of muscle fibres and the fourth row over the IZ. In order to cover most of TA proximal area, the second grid was positioned more proximally on the muscle belly. The boundaries of the HDsEMG grids was marked with a surgical pen. The participants were asked to mark these boundaries for the whole duration of the study.
Two reference electrodes, one for each grid, were placed on the tuberosity of the tibia (1st grid) and on the medial malleolus (2nd grid) of the dominant leg, respectively. The main ground electrode was placed on the styloid process of the ulna of the tested side.
The signals were recorded in monopolar derivation, amplified (×150), sampled at 2048 Hz, band-pass filtered (10–500 Hz) and converted to digital by means of a 16-bit multichannel amplifier (EMG-Quattrocento, OT Bioelettronica, Turin, Italy). HDsEMG signals were synchronized with force signal at source by the same acquisition system.
Force and HDsEMG signal analysis
The recorded data were processed offline using custom-written Matlab programs (MATLAB R2018, MathWorks, Natick, MA, USA). Before being low-pass filtered with a fourth-order, zero-lag Butterworth filter (cut-off frequency 15 Hz), the force signal was converted to newtons (N) and the offset was removed by gravity compensation. Only one of the two ramp contractions at each force intensity was analyzed. The ramp contractions yielding the lowest deviation from the reference (force trajectory) signal was used for decomposition analysis. Monopolar HDsEMG signals were digitally band-pass filtered between 20–500 Hz using a second-order, zero-lag Butterworth filter, prior to signal decomposition. Then, they were decomposed into the activity of individual motor units with an algorithm based on convolutive blind source separation [23, 26]. Briefly, the HDsEMG signals consist of convolutive mixtures of motor neuron spike trains. The relative large dimension of the electrode grid allows for an accurate spatial sampling of the waveforms of the motor unit action potentials. It has been previously demonstrated that motor unit discharge times can be identified from these recordings for a broad range of forces [11, 17, 23]. The decomposition accuracy was first assessed using the pulse-to-noise ratio (PNR) and accordingly, only motor units with a PNR > 30 dB and/or interspike intervals <2 s were retained for further analysis [23, 27]. Therefore, all identified motor units were manually inspected by an experienced operator who only retained MUs characterized by a high PNR and a reliable discharge pattern. In some rare cases, the same motor unit was identified at two different force intensities. For these motor units, only the discharge timings of the motor unit identified at the lowest force level was maintained for further analysis. We then tested the decomposition accuracy with novel parameters, described in the following.
Since the decomposition algorithm identifies only motor unit discharge times, action potential waveforms for each identified motor unit (MUAPs) were estimated with the spike-triggered averaging technique [22, 28]. In particular, MUAP waveforms were extracted by averaging monopolar HDsEMG signals over 35 ms (MUAP duration) intervals, using the discharge times as triggers. The extracted 2D waveforms were used to track motor units across sessions. The tracking procedure the motor unit action potentials and then computes 2D cross-correlations between the spatial representations of the waveforms identified before and after the four weeks period of the study (figure 1).
The motor units with the highest 2D coefficient of correlation (R) were then visually inspected by an experienced investigator. The spike trigger average was performed in three distinct phases of the ramp contraction. Figure 1(E) shows one tracked motor unit discharge times with three distinct colors. These colors correspond to the ramp-up phase (red), plateau (blue), and ramp-down (green). The cross-correlation between 2D MUAPs extracted by spike triggered averaging in these three phases were compared across all possible conditions (figure 1(E)). Moreover, the MUAP was extracted also using random time instants corresponding to the discharge timings during the whole duration of the contraction (figure 1(E) purple dots) and for random time instants that did not correspond to the discharge timings identified by decomposition (figure 1(E) yellow diamonds). We then injected noise in the estimated motor unit discharge timings (figure 2(A)). A similar approach has been recently used for feline motor units [29]. The noise levels followed a gaussian distribution that had a standard deviation of 1, 3, 5, and 10 ms. It must be noted that these procedures are mainly related to the validation of the MUAP waveform and therefore physiological parameters such as rate coding, motor unit recruitment and derecruitment thresholds, are not taken into account in this analysis. We successively performed a physiological validation of the decomposition. For this purpose, we estimated the recruitment threshold of the motor neuron as the force value corresponding to the occurrence of the first MUAP. The de-recruitment threshold corresponded to the force value at the discharge of the last MUAP. The discharge rate was the inverse of the interspike interval and was estimated during the first ten MUAP at the plateau of the ramp contraction.
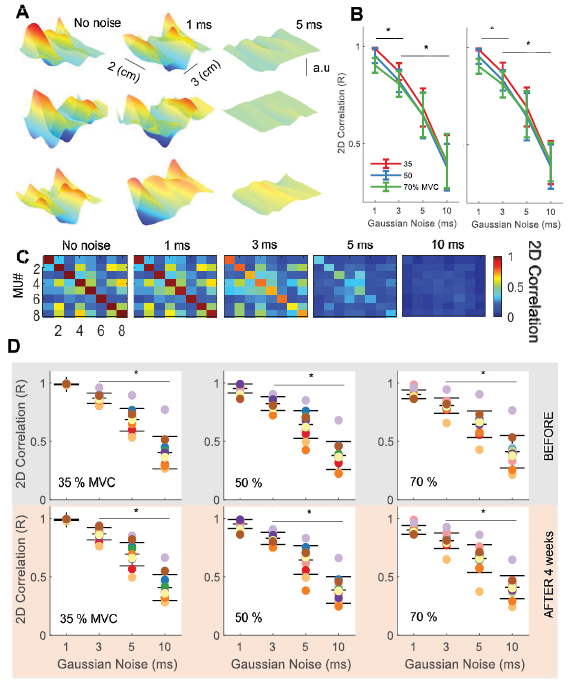
Figure 2. The effect of random gaussian noise in the motor unit discharge times identified by decomposition. (A) Three-dimensional (3D) motor unit action potentials. The first column corresponds to the three different motor unit waveforms extracted during an isometric ramp contraction. We then injected random gaussian noise in the discharge times of the motor unit and extracted the 3D waveform. It can be noted that as little as 5 ms are necessary to disrupt the action potential waveform. (B) The effect of contraction intensity on gaussian noise. There was a statistically significant effect for contraction intensity at low levels of gaussian noise (1, 3 ms). Each contraction intensity is color-coded (see legend). © Confusion matrix of 2D cross-correlation values for eight motor units in a representative subject during a ramp contraction at 35 % MVF that are plotted as a function of gaussian noise. (D) We performed the analysis in A for all subjects (color-coded) and motor units. We found a decrease in the 2D correlation value when adding 3 ms of gaussian noise (Pearson-P < 0.001), for all contraction intensities (35%–70% of maximal force).
Download figure:
Standard image High-resolution imageStatistical analysis
We used the Shapiro-Wilk test to assess the normality of distribution of the data, before the comparisons of the MUAP waveforms and physiological parameters of the motor units. The assumption of sphericity was verified by the Mauchly's test and when the assumption was violated the Greenhouse-Geisser correction was applied. Most of the variables included in the study exhibited a normal distribution. Two-way repeated measure ANOVAs (contraction condition and noise level or motor unit location) were adopted to examine the effect of contraction intensity, noise level, and MUAPs during the different phases of the contraction. Non-parametric independent t-tests (Mann-Whitney U test) were used when the data was not normally distributed. The relationship before and after four weeks of the physiological motor unit variables was assessed by Pearson statistics at the individual subject level. The coefficient of determination (R) and mean standard deviation (±) is reported in the text. The P value was set at P < 0.05.
Results
Accuracy of surface EMG decomposition
We applied grids of electrodes that recorded the myoelectrical activity of the tibialis anterior muscle in two experimental sessions separated by four weeks. The contractions consisted of voluntary force modulation at varying intensities, from low (35% of the maximal voluntary contraction, MVC, force) to higher forces (70% MVC). The total number of identified motor neurons from the twelve subjects in the two experimental sessions was 1270 and ~30% of these motor neurons were tracked in both sessions (an average of 18.15 ± 3.14 motor units and 5.66 ± 1.72 for the tracked motor units per subject and contraction). The average number of identified motor units across subjects and for each contraction intensities for both the total and tracked motor units is shown in table 1.
Table 1. The average number of decomposed motor units for each contraction intensity across all participants in the two experimental sessions. The last column of the table shows the number of tracked motor units. The average and standard deviation is shown.
| RAMP (%MVF) | Number of decomposed motor units | ||
|---|---|---|---|
| Session 1 | Session 2 | Tracked | |
| 35% | 21.33 ± 6.74 | 21.33 ± 7.40 | 7.25 ± 3.36 |
| 50% | 19.18 ± 8.53 | 18.27 ± 5.74 | 5.9 ± 2.87 |
| 70% | 14.75 ± 8.05 | 14.08 ± 8.15 | 3.83 ± 1.99 |
Figure 1 shows an example of motor unit identification before and after four weeks (blue motor neuron spiking, figure 1(B)). In the two sessions, the EMG grids were placed approximately on the same position over the tibialis anterior and covered most of the surface of the muscle. The EMG decomposition identified motor unit action potentials by blind source separation [18, 26]. From the decoded discharge instants (figure 1(B)), we extracted the motor unit action potential waveforms by spike-triggered averaging [14]. The correlation (2D, row and column corresponding to the high-density grids) between all the combinations of the waveforms was used to track the same action potentials across sessions. Figure 1(C) shows an example of the discharge timings of eight (out of ~25) longitudinally tracked motor neurons over one month for a representative subject. In this example, the recruitment order, assessed by the timing of the first activation of the motor neurons, was the same before and after four weeks.
The analysis of accuracy was based on the extracted action potential waveforms. The assumption was that the decomposition identified the correct discharge times if they provided stable action potential waveforms when used as triggers for spike-triggered averaging the interference EMG. Therefore, we compared the estimated motor unit action potentials with those extracted by artificially perturbing the discharge times provided by decomposition. Figure 1(D) shows three motor unit action potentials in a 3D representation before and after four weeks. The 3D waveform corresponds to the shape of the action potential at a fixed time instant and it is possible to observe very small variance in the waveform pattern. The next step was to quantify the variability of these waveforms when changing the set of discharge timings used as trigger. For this purpose, we used a 2D cross-correlation function of the motor unit action potential. We compared the shape of the action potential during the ramp-up phase, the plateau, and the ramp-down phase of the contraction (red, blue, and green firings respectively in figure 1(E)). Moreover, we selected random motor unit discharge timings across the whole duration of the contraction for triggering the motor unit waveforms (purple dots figure 1(E(e)) and random instants of time within the average motor unit spike train window (yellow diamonds figure 1(E(e)). Successively, we performed 2D correlations between all possible combinations of the action potentials extracted in these five conditions. The motor units that showed a 2D correlation above 0.65 (when using the motor unit discharge timings across the whole contraction) were considered as similar. The confusion matrix for the individual phases of the ramp contractions are shown in figure 1(F). The 2D cross-correlation between the decomposed motor units showed high discriminability among the action potentials. This step confirms that each motor unit had a unique signature. Indeed, the average correlation for the tracked motor units was consistently higher than 0.6 for all subjects and contraction conditions (figures 1(G)–(M)). On the other hand, the average 2D correlation value was lower than 0.5 for all motor units, with an average of 0.34 ± 0.12 across subjects and contraction conditions. We then followed this procedure for all subjects and contraction conditions (figures 1(G)–(M)).
The random conditions consistently showed a 2D correlation that was eight-fold lower when compared with the spikes selected by the decomposition instead of randomly (figures 1(G)–(I)) and were independent of the location during the ramp contraction (P > 0.05, figures 1(G)–(I) and of the force level (P > 0.05 figures 1(G)–(I) and (M)).
We then added gaussian noise in the times of discharge of the tracked motor units at the different force levels (figures 1(J)–(L)). The noise standard deviation ranged from 1 ms to 10 ms, and the 2D cross-correlation was tested between all tracked motor units with different levels of noise. As little as 3 ms of standard deviation in the gaussian noise disrupted the correlation between the motor unit action potential before and after four weeks (figures 1(J)–(L)), and independently of the force level (figure 1(M)). We then tested the accuracy of decomposition by adding gaussian noise to all the pulse trains identified by decomposition and testing the changes in estimated motor unit action potential waveforms as a function of the added noise (figure 2). Across all motor units and subjects, with 5 ms standard deviation of the gaussian noise in the discharge times, the 3D action potential waveform was reduced in amplitude to the noise baseline of the EMG (figure 2(A)). These observations were consistent for all subjects and motor units (figures 2(A)–(D). There was an effect of contraction level in this 2D correlation analysis when all motor units were taken into account (figure 2(B), P < 0.05), which is consistent with the increase in baseline activity (i.e. activity of motor units beside the triggered one) with increasing force. Figure 2(C) shows the confusion matrix for these five contraction conditions. Each motor unit action potential showed strong distinctiveness with the action potentials from other motor units. This observation was consistent across all subject and contraction intensities.
The above analysis indicates highly accurate decomposition of the EMG. We then further extended this validation by assessing the tracking over time of motor units. The longitudinal tracking revealed not only the possibility to follow the behavior of motor neurons in separate experimental sessions, but it also provided a further proof of validation of accuracy. Indeed, the likelihood of identifying the same motor unit action potentials in experimental sessions separated by a month, with independent decompositions of signals recorded with electrode replacement, is negligible unless the decomposition is highly accurate.
Longitudinal tracking
The analysis of accuracy presented in figures 1 and 2 is based on the characteristics of the motor unit action potential waveforms that are determined by the properties of the muscle unit and of the volume conductor. Because the decomposition is achieved with blind procedures, we then compared several neurophysiological parameters of the tracked motor neurons before and after four weeks. For this purpose, we calculated the discharge rate, recruitment and derecruitment thresholds of the tracked motor units (figure 3) and the relationship between discharge rate and recruitment thresholds for each subject and contraction condition.
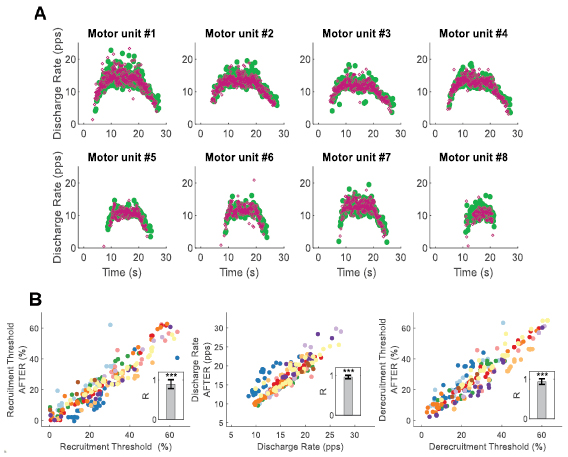
Figure 3. Physiological parameters of the tracked motor units. (A) Eight longitudinally tracked motor units of a representative subject during a 35% maximal voluntary force ramp contraction (green before and purple after four weeks). Note the similarity in the discharge patterns of each motor unit. (B) Recruitment threshold, discharge rate, and derecruitemt thresholds (DR), before and after four weeks for all the unique motor units identified during the three ramp contractions, subjects are color-coded. The discharge rate is the average instantaneous firing of each motor unit across the full contraction. The recruitment and derecruitment thresholds represent the normalized force level (in percentages of maximal voluntary force) corresponding to the first and last discharge of each motor unit, respectively. The barplot in the inset shows the average (SD) coefficient of correlation (R) for the regression values across all subjects. For all subjects the motor unit physiological parameters were significantly correlated before and after four weeks (R > 0.84, Pearson-P < 0.001).
Download figure:
Standard image High-resolution image
We performed correlation analyses between the neural properties of the motor units obtained before and after four weeks. Figure 3(A) shows the discharge rate for eight representative motor units during a ramp contraction at 35% of maximal force. The discharge rate values across the tracked motor units were highly correlated between the two experimental sessions (figure 3(B), Pearson P < 0.0001, average correlation between subjects, R = 0.88 (0.12)). Figure 3(B) shows the subject individual values (color-coded) for the tracked motor units. Similarly, the recruitment and derecruitment thresholds were comparable across the tracked motor units before and after four weeks (figure 3(B), P < 0.0001, R = 0.94 (0.8)). Since the two decompositions were performed weeks apart independently, this analysis not only proves the ability to track motor units over time but also confirms that the blind separation of the individual motor unit action potential from the high-density EMG was highly accurate.
Discussion
We have provided an extensive analysis of accuracy of high-density EMG decomposition by using various metrics and including separate experimental sessions. Accuracy was proven from the consistency of action potential waveform shapes across conditions, and their disruption once the identified discharge timings were perturbed, as well as from the reliability of properties associated to motor neuron behavior when tracked over time.
Validity of decomposition
One of the most critical aspects of using non-invasive EMG to identify individual motor units is the ability to validate the decomposition results. This challenge is far more relevant for surface EMG than intramuscular EMG decomposition since surface EMG signals cannot be manually decomposed, contrary to intramuscular signals. This is due to the greater level of interference in the surface EMG and explains why surface EMG decomposition methods have been developed three decades after intramuscular EMG decomposition algorithms. Therefore, while manual decomposition may be used as gold standard for intramuscular EMG decomposition, surface EMG decomposition cannot be assessed against the reference decomposition by an expert operator. This crucial difference has generated a debate on surface EMG decomposition accuracy and methods to validate such accuracy [10, 30–32]. While the comparison of results against those from concurrently recorded intramuscular EMG signals is the direct evidence for accuracy [17, 32], this approach is limited by the small number of common sources decoded at the surface and into the muscle [32] and can only be used on representative data. Therefore, signal-based methods for validating accuracy are needed.
In this study, we have provided the most extensive validation of surface EMG decomposition so far presented. The relevance of this validation is far beyond a test of accuracy of an innovative methodology and extends to the proposal of a reliable method for interfacing human neural cells and following their properties over time. We have combined an analysis of consistency of motor unit action potential waveforms following a number of perturbations, with metrics of reliability of variables associated to motor neuron behavior when assessed in two independent recording sessions separated by one month. The latter is not presented here as a reliability measure, as in [33], but rather as a validation for decomposition and tracking. The rationale for this approach is that the signals in the two sessions have been recorded independently, at a distance of one month and with repositioning of the surface grid. It would be extremely unlikely that the estimated properties of motor neuron behavior over the two sessions following independent decomposition of the EMG data would be consistent if the decomposition was incorrect. Conversely, the observation that both the neural properties of the identified motor neurons and the waveforms of the spike-triggered averaged action potentials match over the two sessions with independent decompositions necessarily implies that the decomposition algorithm has extremely high accuracy. It has to be noted, in this view, that the shapes of the motor unit action potentials were not used by the decomposition algorithm and therefore they were not a direct output of the algorithm. The algorithm only identifies the discharge timings in a blind way [23, 26] and the action potential waveforms are then obtained by using the identified discharge times in an averaging process [14,19]. The likelihood of obtaining extremely similar action potential waveforms in two experimental sessions in these conditions, as observed in this study, is practically null unless the decomposition is highly accurate. There are however some limitations with the proposed technology. First, the high-density EMG grids must be placed in the same location during longitudinal studies. Second, the motor unit tracking technique requires further validation during sustained contractions (e.g. fatigue) since the increase in extracellular potassium significantly disrupts the shape of the action potentials [34, 35]. Third, there is no ground-truth for the validation of the motor unit tracking technique, since the tracking of the same motor unit with intramuscular EMG is not possible.
The evidence of all the approaches of validation that we have provided indicates that the decomposition results are highly accurate. Moreover, at the same time, we also proved that it is possible to sample the same motor units in different experimental sessions that can be used to consolidate experimental results. While the conventional intramuscular EMG decomposition approach allows the observation of a few motor units concurrently and in one experimental session only, we have now proven that high-density EMG decomposition allows for the concomitant observation of tens of motor units, tracking them in multiple recording sessions. This characteristic provides solid data samples and allows not only to repeat measures on the same neural cells over multiple experimental sessions but also to monitor changes within the same cells over time. The proposed methodology therefore uniquely allows non-invasive studies in human spinal neural cells.
In conclusion, we have proposed an accurate, reliable neural interface with the spinal motor neurons that surpasses the precision of any previous approach for the study of motor neurons. Our results show that is possible to interface humans directly with the spinal cord output over time. These characteristics open new perspectives in the study of neural control of movement and in human neural interfacing.
Acknowledgments
General
We thank Prof Francesco Felici and Mr Andrea Casolo for their help during the experiments.
Author contributions
ADV & DF conceived the experiment, ADV & DF worked on experimental design. ADV performed experiments and analyzed the data. ADV & DF drafted the paper, revised and edited the manuscript.
Competing interests
We declare no conflicts of interests.
Funding
This project has received funding from the European Research Council (ERC) under the European Union's Horizon 2020 research and innovation programme (project NaturalBionicS; grant agreement No 810346).