
Abstract
Objective. To explore the viability of developing a computer-aided diagnostic system for Parkinsonian syndromes using dynamic [11C]raclopride positron emission tomography (PET) and T1-weighted magnetic resonance imaging (MRI) data. Approach. The biological heterogeneity of Parkinsonian syndromes renders their statistical classification a challenge. The unique combination of structural and molecular imaging data allowed different classifier designs to be tested. Datasets from dynamic [11C]raclopride PET and T1-weighted MRI scans were acquired from six groups of participants. There were healthy controls (CTRL n = 15), patients with Parkinson's disease (PD n = 27), multiple system atrophy (MSA n = 8), corticobasal degeneration (CBD n = 6), and dementia with Lewy bodies (DLB n = 5). MSA, CBD, and DLB patients were classified into one category designated as atypical Parkinsonism (AP). The distribution volume ratio (DVR) kinetic parameters obtained from the PET data were used to quantify the reversible tracer binding to D2/D3 receptors in the subcortical regions of interest (ROI). The grey matter (GM) volumes obtained from the MRI data were used to quantify GM atrophy across cortical, subcortical, and cerebellar ROI. Results. The classifiers CTRL vs PD and CTRL vs AP achieved the highest balanced accuracy combining DVR and GM (DVR-GM) features (96.7%, 92.1%, respectively), followed by the classifiers designed with DVR features (93.3%, 88.8%, respectively), and GM features (69.6%, 86.1%, respectively). In contrast, the classifier PD vs AP showed the highest balanced accuracy (78.9%) using DVR features only. The integration of DVR-GM (77.9%) and GM features (72.7%) produced inferior performances. The classifier CTRL vs PD vs AP showed high weighted balanced accuracy when DVR (80.5%) or DVR-GM features (79.9%) were integrated. GM features revealed poorer performance (59.5%). Significance. This work was unique in its combination of structural and molecular imaging features in binary and triple category classifications. We were able to demonstrate improved binary classification of healthy/diseased status (concerning both PD and AP) and equate performance to DVR features in multiclass classifications.
Export citation and abstract BibTeX RIS

Original content from this work may be used under the terms of the Creative Commons Attribution 4.0 license. Any further distribution of this work must maintain attribution to the author(s) and the title of the work, journal citation and DOI.
1. Introduction
Parkinsonian syndromes are a group of movement disorders characterised by diverse primary motor (tremor at rest, postural instability, bradykinesia and rigidity) and non-motor symptoms with variable expression [1]. They include, among others, Parkinson's disease (PD), dementia with Lewy bodies (DLB), multiple system atrophy (MSA) and corticobasal degeneration (CBD) [2]. DLB, CBD, and MSA are categorised as atypical Parkinsonism (AP). This designation is used to categorise disorders presenting with symptoms of progressive Parkinsonism together with additional symptoms atypical of idiopathic PD. The symptomatic heterogeneity and partial overlap of these conditions can lead to delayed diagnosis and misdiagnosis [1].
Parkinsonian syndromes are understood to be consequence of degeneration and dysfunctions that lead to dopaminergic deficiency across multiple pathways. The nigrostriatal pathway plays a pivotal role in this [3]. The gold standard approach to diagnostic confirmation of Parkinsonian syndromes is still post-mortem neuropathological examination. Voxel-based morphometry (VBM), diffusion tensor imaging (DTI), or single-photon emission computed tomography (SPECT) and positron emission tomography (PET) computational techniques (dynamic PET protocols, compartmental models and multiple-time graphical analysis) have been applied to quantify syndrome-specific alterations in brain morphology and physiology [4, 5].
PET and SPECT molecular imaging have been used to investigate neurotransmitter activity in Parkinsonian syndromes [6]. Here, we opted to use dynamic [11C]raclopride PET to quantify the availability of the postsynaptic D2/D3 dopamine receptors. It has been suggested that PET imaging these receptors is a valuable means of discriminating between controls (CTRL), PD and AP groups. In contrast to PET imaging of presynaptic dopaminergic pathways, which shows a common tendency to reduced striatal binding among PD, MSA, CBD and DLB [6], PET imaging of postsynaptic pathways reveals distinct profiles for CTRL, PD (preserved or higher binding in the putamen and caudate, particularly in the caudal putamen) [7] and AP (reduction of postsynaptic D2/D3 receptor binding) patients [4, 6].
Currently, there are several software solutions for automated voxel-wise segmentation of T1-weighted brain scans into grey matter (GM), white matter (WM) and cerebrospinal fluid (CSF); for instance, the Statistical Parametric Mapping (SPM) tool [8]. The study of local brain morphology reveals either subtle atrophy or normal findings in PD [5, 9] and pronounced but heterogeneous patterns of atrophy in AP [10–14].
Most machine learning approaches to single-subject classification of Parkinsonian syndromes [15] have focused on the separate use of structural or molecular imaging.
Distinct approaches have used structural brain images. VBM analysis of the cerebellum has been performed [16] using support vector machine (SVM) to differentiate PD patients from CTRL group. In [17], the volumetry of 22 subcortical regions of interest (ROI) were integrated using a decision tree algorithm to identify PD, progressive supranuclear palsy (PSP) and MSA. An analogous approach was followed in [18], combining the volumetry of 44 atlas-based ROI in an SVM model to distinguish CTRL and PD, PSP and MSA. Alternative techniques, such as diffusion-weighted MR [19] and DTI [20], have been used to classify patients with PD and AP (MSA vs PSP), and with PD and MSA patients, respectively.
No previous machine learning molecular imaging approaches have used kinetic parameters obtained from dynamic [11C]raclopride PET data, although the dopaminergic system has been studied in this context using other tracers. Recently, Oliveira et al (2021) applied the quantitative analysis of [123I]ioflupane SPECT data to differentiate healthy CTRL from DLB and PD [21]. Segovia et al used [18F]DMFP PET to quantify postsynaptic D2/D3 striatal dopamine receptors and designed SVM classifiers to distinguish between PD, MSA and PSP patients [22]. Other works [23, 24] have studied regional glucose metabolism using [18F]FDG PET, and developed automatic classifiers to discriminate between patients with PD, MSA and PSP.
This work presents a novel approach that combines magnetic resonance imaging (MRI) GM volumetric data and kinetic parameters obtained from dynamic [11C]raclopride PET data to develop different binary and multiclass classifiers. The performance of the proposed classifiers and the predictive value of the features utilised were tested by integrating MRI and PET features both independently and simultaneously within the same model.
2. Methods
2.1. Participants
A group of 61 participants (27 with PD, 8 with MSA, 6 with CBD, 5 with DLB, and 15 CTRL) was enrolled in this study from April 2013 to February 2017. The subgroup of AP, defining a classification category, includes the MSA, CBD and DLB patients. CTRL individuals were spouses and carers of the patients, or volunteers for health sciences research recruited from an institutional database (https://voluntarios.cibit.uc.pt/). A brief interview excluded a personal or family history of neurological and psychiatric disorders. Patients were recruited from Movement Disorder Clinic at the Coimbra University Hospital Centre. Patients qualified for recruitment after the diagnosis was established by a movement disorders specialist according to published consensus criteria for PD [25], MSA [26], CBD [27], DLB [28]. The motor disability of patients was assessed using the part III of the Unified Parkinson's Disease Rating Scale (UPDRS-III) and classification of Hoehn & Yahr stage (H&Y). Total levodopa equivalent dose (LED) was calculated for each patient [29]. Exclusion criteria included other forms of Parkinsonism, severe dementia (score of Mini-Mental State Exam < 15) or any psychiatric disorder. All participants provided written informed consent to a study approved by the local Ethics Committee of the Faculty of Medicine of the University of Coimbra and in accordance with the Declaration of Helsinki. Each participant underwent the PET imaging and MRI data acquisition sessions, described in sections 2.2 and 2.3, in a single day. Demographic and clinical data are summarized in table 1. The classifiers designed and tested in our study do not use features obtained from demographic or neurological variables described in table 1.
Table 1. Demographic and clinical information reproduced from [SciDraw.io]. CC BY 4.0.
| CTRL | PD | AP | |
|---|---|---|---|
| N | 15 | 27 | 19 |
| Age (years) | 60.7 (58.3–66.3) | 65.2 (59.1–71.8) | 64.8 (60.3–74.7) |
| Gender distribution (female/male) | 10/5 | 13/14 | 8/11 |
| UPDRS III (score) | n/a | 28 (24–41) | 44 b (35–51) |
| H&Y stage (score) | n/a | 2 (2–3) | 4 b (3–4) |
| Total LED (mg/day) | n/a | 750 (600–1000) | 550 a (300–750) |
| Disease duration (years) | n/a | 7 (6–12) | 5 a (5–7) |
Median (95% confidence interval for the median) a Missing data from one AP participant. b Missing data from two AP participants.
2.2. [11C]raclopride PET data
2.2.1. Data acquisition
[11C]raclopride PET data were acquired at Institute of Nuclear Sciences Applied to Health (ICNAS), University of Coimbra, using a Philips Gemini GXL PET/CT scanner (Philips Medical Systems, Best, the Netherlands). The participants performed a dynamic three-dimensional (3D) PET scan of the entire brain and a low-dose brain CT scan, for attenuation correction. The dynamic [11C]raclopride PET scan consists of 30 frames (total duration of 90 min: 4 × 15 s + 4 × 30 s + 3 × 60 s + 2 × 120s + 5 × 240s + 12 × 300s). The [11C]raclopride PET acquisition started immediately after the intravenous bolus injection of approximately 555 MBq of [11C]raclopride. To minimize head movement, the patient's head was restrained with a soft elastic tape. The [11C]raclopride PET images were reconstructed to a 128 × 128 × 90 matrix, with isotropic voxels of 2 mm width, using the LOR RAMLA algorithm (Philips PET/CT Gemini GXL) with attenuation and scatter correction.
Patients suspended any Parkinsonism related medication or other that can interfere with the [11C]raclopride uptake at least 12 h prior the PET scan. All participants (CTRL and patients) abstained from the consumption of alcohol, tobacco, and coffee, as well as other addictive substances, also in the 12 h prior to the scan.
2.2.2. Data pre-processing and quantitative analysis
The ROI-based quantitative analysis of [11C]raclopride images was implemented in the PET images native space using an in-house made software used previously in other PET studies [30]. In this [11C]raclopride PET study, the reversible tracer binding to D2/D3 receptor was quantified by the distribution volume ratio (DVR) model parameter [31]. DVR in a target region expresses the ratio of the radiotracer concentration in that region (ideally with specific binding sites) to a reference region devoid of specific binding. For each target ROI described in section 2.2.3, DVR was computed by applying the Logan plot method [31] at the ROI level, selecting the cerebellar GM as reference region due to negligible D2/D3 expression [32].
The reference region and target ROIs described in section 2.2.3 were delineated using an atlas in the Montreal Neurological Institute (MNI) space. The atlas was transformed to subject-specific PET images native space following a two-step process. First, the atlas was resampled from the MNI space to the subject-specific MRI native space using a non-linear transformation, the inverse of the transformation estimated in section 2.3.2 during the pre-processing of MRI data. Second, the atlas in the subject-specific MRI native space was resampled to the subject-specific PET native space using a rigid transformation. The rigid transformation was estimated running the software 3D Slicer 4.8.1 (www.slicer.org) [33] with the subject-specific T1 MRI data and a weighted (duration) sum image of the respective dynamic [11C]raclopride PET.
2.2.3. ROI
For each participant, the DVR of the [11C]raclopride PET images was studied in eight bilateral target ROI, which cover the regions of the brain with known relevant expression of D2/D3 receptor [32]. The target ROI (anterior putamen, posterior putamen, anterior caudate, posterior caudate, core of nucleus accumbens, shell of nucleus accumbens, anterior globus pallidus, posterior globus pallidus) were defined using the Melbourne subcortex atlas [34]. The reference ROI presented in section 2.2.2, cerebellar GM, was extracted from the anatomical automatic labelling (AAL) atlas [35]. Table S1 (available online at stacks.iop.org/JNE/18/046037/mmedia) in the supplementary materials provides additional details about the description of the ROIs.
2.3. MRI data
2.3.1. Data acquisition
MRI data were collected at the ICNAS, University of Coimbra, using a Siemens Magnetom TIM Trio 3 Tesla scanner (Siemens, Munich, Germany) with a phased array 12-channel birdcage head coil. For all the 61 participants, the protocol comprised 3D structural MRI scans using a T1- weighted MPRAGE (magnetization-prepared rapid gradient echo) MRI pulse sequence (repetition time (TR) 2530 ms; echo time (TE) 3.42 ms; inversion time (TI) = 1100 ms; flip angle 7°; 176 single-shot interleaved slices with no gap with isotropic voxel size 1 × 1 × 1 mm3; field-of-view (FOV) 256 mm).
2.3.2. Data pre-processing and volumetric analysis
All 3D imaging data were pre-processed and analysed in MATLAB version R2019a (MathWorks Inc., Natick, MA, USA) using the SPM12 toolbox (Wellcome Trust Centre for Neuroimaging, London, UK; www.fil.ion.ucl.acuk/spm/software/spm12/) and the Computational Anatomy Toolbox (CAT12) (C. Gaser, Structural Brain Mapping Group, Jena University Hospital, Jena, Germany; http://dbm.neuro.uni-jena.de/cat/). In the different processing and analysis-steps, the default parameters, suggested in the tutorials elaborated by the SPM12 and CAT12 authors, were used, unless indicated otherwise. T1 images were registered to a CAT12 standard DARTEL template [36] in MNI space (voxel size: 1.5 × 1.5 × 1.5 mm3). The normalized images were corrected for bias-field inhomogeneities and segmented into GM, WM, and CSF images. The segmented images were modulated to preserve in the MNI space the native total amounts of GM, WM, and CSF. The total intracranial volume (TIV) of each participant, corresponding to the sum of the GM, WM, and CSF volumes, was determined using CAT12. Prior to and after segmentation, overall image quality was accessed by visual inspection and using CAT12 statistical tools, checking for artefact detection and inter-subject homogeneity.
The volumetric analysis of the GM images of each participant consisted in the determination of a GM percentage of TIV (PTIV) for several ROI. For each ROI described in section 2.3.3, the GM PTIV was calculated by dividing the total volume of GM of the ROI by the TIV of the participant and multiplying this value by 100. This approach allows the definition of features describing regional patterns of the GM volumetric distribution across the brain, independently of total brain size.
2.3.3. ROI
For each participant, the regional patterns of the GM distribution were assessed by the volumetric analysis of 25 different bilateral ROIs, defined in the MNI space, and comprising cortical, sub-cortical, and cerebellar regions. Nine subcortical ROI (anterior putamen, posterior putamen, anterior caudate, posterior caudate, nucleus accumbens, globus pallidus, hippocampus, amygdala, thalamus) were defined using the Melbourne subcortex atlas [34]. Concerning the cortical ROI, due to the diversity of findings reported in the literature describing regional patterns of GM atrophy in PD, MSA, CBD, and DLB patients, the Schaefer atlas [37] was adopted to investigate 15 cortical ROIs (SomMotA, SomMotB, DorsAttnA, DorsAttnB, SalVentAttnA, SalVentAttnB, LimbicB, LimbicA, ContA, ContB, ContC, DefaultA, DefaultB, DefaultC, TempPar). These 15 cortical ROIs provide a reasonable level of detail and coverage of established functional brain networks (somatomotor, temporal parietal, dorsal attention, salience/ventral attention, limbic, default, control) [38]. A single cerebellar ROI (cerebellum) was delineated employing the AAL atlas [35]. Table S1 in the supplementary materials provides additional details about the description of the ROIs.
2.4. Subject-level automatic classification
The subject-level predictive value of the volumetric descriptors and the [11C]raclopride DVR descriptors, presented in sections 2.3.2 and 2.2.3 respectively, was studied by developing a machine learning approach to automatically assign group membership from subject-level imaging-based features. Three different sets of features were investigated: 25 GM volumetric features; 8 [11C]raclopride DVR features; 33 multimodal features combining the GM volumetric descriptors and the [11C]raclopride DVR descriptors.
The different sets of features were tested in two type of classifiers. The binary classifiers (CTRL vs PD; CTRL vs AP; PD vs AP) were designed as SVM with a linear kernel [39] and using a Lasso (L1) regularization approach during training [40]. The multiclass classifiers (CTRL vs PD vs AP) were designed as an ECOC model (Error-Correcting Output Codes) using a one-vs-one binary coding scheme [41]. This design reduces the problem of classification with three classes to a set of binary classification problems. The binary learners were defined as SVM with a linear kernel [39] and a Lasso (L1) regularization approach during training [40]. The binary and multiclass classifiers were implemented in MATLAB R2019a using the native Statistics and Machine Learning Toolbox.
The performance of the binary and multiclass classifiers was evaluated by training and testing the classifiers following a stratified ten-fold cross-validation approach, which tries to create folds with an approximated proportion of classes as in the full datasets. The features of the training and testing folds were standardized (z-score) using the mean and standard deviation determined from the data points of the training folds. The performance of the binary classifiers was described using the area under the receiver operating characteristic curve (AUROC), sensitivity, specificity, and balanced accuracy. The multiclass classification performance was characterized by the balanced accuracy of each group, CTRL vs (PD + AP), PD vs (CTRL + AP), AP vs (CTRL + PD), which were determined from the multiclass confusion matrix, and summarized by the weighted balanced accuracy. To evaluate the robustness of the performance, different random partitions of the dataset were analysed. The training and testing procedure using a ten-fold cross-validation approach was repeated 50 times for each classifier. The weighted balanced accuracy of the multiclass classifier (CTRL vs PD vs AP), and the balanced accuracy for each type of binary classifier (CTRL vs PD, CTRL vs AP, PD vs AP) were compared between different set of features (DVR, GM, DVR-GM) using the independent samples Kruskal–Wallis test and post-hoc tests with multiple-comparisons Bonferroni correction. A significance level of 5% was defined.
The binary and multiclass classifiers were designed using linear SVM. During the training sessions of the classifiers, a weight was assigned to each feature. For a given classifier, the absolute value of the weights of each feature can be interpreted as the relative relevance of that feature to the performance of the classifier [42, 43].
3. Results
3.1. Features' extraction
The distribution of the features' values extracted from the MRI GM images and from the [11C]raclopride PET images is represented in figure 1. Between-group differences were assessed with the independent samples Kruskal–Wallis test (uncorrected) and post-hoc tests with multiple-comparisons Bonferroni correction. A significance level of 5% was defined. The results are presented in the tables S2 and S3 of the supplementary materials and summarized in figure 1. Although our study follows a ROI-based approach to extract the features, figure S1 of the supplementary materials depicts, for illustrative purposes, the mean whole-brain voxelwise DVR map and modulated GM map in the healthy participants. The two main sets of features, GM PTIV in 25 subcortical, cortical, and cerebellar ROI, and [11C]raclopride DVR in 8 subcortical ROI, revealed distinct patterns of GM atrophy and D2/D3 receptor availability across the brain, between the three groups of participants (CTRL, PD, AP). The subject-level predictive value of these features was assessed using a machine learning approach presented in section 3.2.
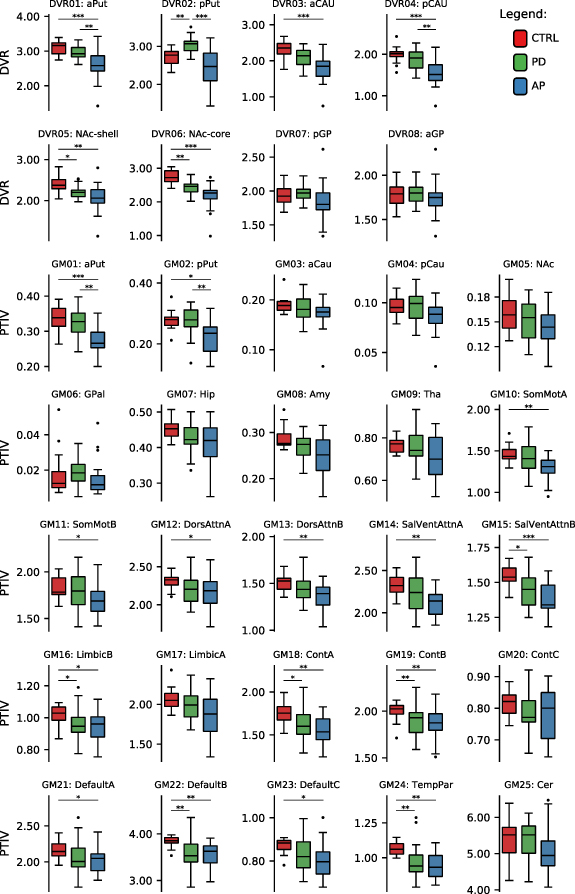
Figure 1. Boxplots of the features extracted from the MRI GM images and from the [11C]raclopride PET images, across participants in each group. ROIs are described in table S1 in the supplementary materials section (*p < 0.05, **p < 0.01, ***p < 0.001).
Download figure:
Standard image High-resolution image3.2. Subject-level automatic classification tool
The binary and multiclass classification results are presented in tables 2 and 3, respectively. The binary classifiers (CTRL vs PD, CTRL vs AP) achieved the highest balanced accuracy by integrating DVR-GM features (96.7%, 92.1%, respectively), followed by the classifiers designed with DVR features (93.3%, 88.8%, respectively), and GM features (69.6%, 86.1%, respectively). In contrast, the binary classifier PD vs AP showed the highest balanced accuracy (78.9%) by using the DVR features only. The integration of DVR-GM (77.9%) or GM features (72.7%) provided lower performances for this type of classifier, for this binary distinction. For each type of binary classifier, all the differences in performance, caused by the integration of distinct sets of features were considered statistically significant, except for the balanced accuracy of the binary classifier CTRL vs AP.
Table 2. Performance of binary classifiers.
| Balanced accuracy | |||||||
|---|---|---|---|---|---|---|---|
| Binary classifier | Features | AUROC | Sensitivity | Specificity | Statistic | P-value | |
| CTRL vs PD | DVR | 0.965 (0.963–0.968) | 100.0 (100.0–100.0) | 86.7 (86.7–86.7) | 93.3 (93.3–93.3) | χ2(2) = 116.8 | <0.001 a |
| GM | 0.693 (0.686–69.6) | 55.6 (55.6–59.3) | 86.7 (80–86.7) | 69.6 (69.3–71.1) | |||
| DVR-GM | 0.995 (0.988–1.000) | 98.1 (96.3–100.0) | 100.0 (93.3–100.0) | 96.7 (94.8–98.1) | |||
| CTRL vs AP | DVR | 0.921 (0.916–0.926) | 84.2 (84.2–84.2) | 93.3 (86.7–93.3) | 88.8 (85.4–88.8) | χ2(2) = 82.0 | <0.001 b |
| GM | 0.896 (0.891–0.909) | 78.9 (78.9–84.2) | 93.3 (93.3–93.3) | 86.1 (85.4–86.1) | |||
| DVR-GM | 0.926 (0.923–0.930) | 84.2 (84.2–84.2) | 100.0 (100.0–100.0) | 92.1 (92.1–92.1) | |||
| PD vs AP | DVR | 0.824 (0.819–0.827) | 100.0 (100.0–100.0) | 57.9 (57.9–63.2) | 78.9 (78.9–81.6) | χ2(2) = 97.4 | <0.001 c |
| GM | 0.764 (0.760–0.768) | 77.8 (77.8–77.8) | 68.4 (63.2–68.4) | 72.7 (70.5–73.1) | |||
| DVR-GM | 0.818 (0.807–0.825) | 90.7 (88.9–92.6) | 63.2 (63.2–68.4) | 77.9 (76–79.4) | |||
Median (95% confidence interval for the median)Post-hoc tests a DVR-GM vs DVR: PBonf < 0.001; DVR-GM vs GM: PBonf < 0.001; DVR vs GM: PBonf < 0.001; b DVR-GM vs DVR: PBonf < 0.001; DVR-GM vs GM: PBonf < 0.001; DVR vs GM: PBonf =0.945; c DVR-GM vs DVR: PBonf < 0.001; DVR-GM vs GM: PBonf < 0.001; DVR vs GM: PBonf < 0.001;
Table 3. Performance of multiclass classifiers.
| Balanced accuracy a | Weighted balanced accuracy | ||||||
|---|---|---|---|---|---|---|---|
| Multiclass classifier | Features | CTRL vs (PD + AP) | PD vs (CTRL + AP) | AP vs (CTRL + PD) | Statistic | P-value | |
| CTRL vs PD vs AP | DVR | 79.1 (78.0–81.3) | 83.4 (82.4–83.8) | 75.6 (75.4–76.8) | 80.5 (79.0–80.6) | χ2(2) = 100.0 | <0.001 b |
| GM | 65.0 (63.9–67.2) | 54.9 (53.4–56.4) | 60.7 (59.5–61.8) | 59.5 (57.8–61.0) | |||
| DVR-GM | 84.7 (84.6–85.8) | 81.6 (81.2–83.1) | 74.2 (74.2–75.4) | 79.9 (79.8–81.3) | |||
Median (95% confidence interval for the median)Post-hoc tests: aDetermined from the multiclass confusion matrix. bDVR-GM vs DVR: PBonf = 1.000; DVR-GM vs GM: PBonf < 0.001; DVR vs GM: PBonf < 0.001;
The multiclass classifier CTRL vs PD vs AP showed the highest weighted balanced accuracy by integrating the DVR (80.5%) or the DVR-GM features (79.9%). The classifier designed with the DVR-GM features produced a slightly lower performance, but the difference was not statistically significant. The lowest performance (statistically significant differences) was displayed by the classifier designed with the GM features only (59.5%).
For each classifier, the feature weighting was embedded in the learning algorithm of the SVM classifiers (Lasso regularization). The sets of ROI (DVR, GM, DVR-GM) used to test the different designs of classifiers were the same for all the classification problems (CTRL vs PD, CTRL vs AP, PD vs AP, CTRL vs PD vs AP). The ROI were defined a priori based on previous and independent published studies and atlas. This conservative approach avoided the inflation of the performance metrics which might have been caused by a circular analysis. The median magnitude (50 runs) of the weights assigned to the features by the learning algorithms of the binary and multiclass classifiers is presented in tables S4, S5, and S6 in the supplementary materials. The figures 2 and S2 illustrate the relative median weight of each feature. For each classifier, the weights were normalized to an interval between 0 and 1 (the weights were divided by the maximum weight of each classifier).

Figure 2. Normalized magnitude of the feature weights for binary classifiers designed with DVR, GM, and GM-DVR features. For the sake of simplicity, DVRx and GMx features were labelled as Dx and Gx, respectively.
Download figure:
Standard image High-resolution image
4. Discussion
This work utilises a novel approach, combining features of structural and molecular imaging in both binary and ternary category classifications of Parkinsonian syndromes. The classification performance of this method surpasses previous approaches. Although several studies have indicated that postsynaptic molecular imaging provides a robust framework with which to discriminate between PD and AP, few have used [11C]raclopride dynamic PET or alternative radiotracers to differentiate between CTRL, PD, and AP (MSA, CBD, DLB) groups. Most previous works have developed machine learning approaches to discriminate between Parkinsonian syndromes (PD, MSA, CBD, DLB and PSP) using either structural (volumetric or microstructural) or molecular imaging techniques independently with different cohorts. In the present study, we investigated these modalities in combination, building upon previous research. We were able to demonstrate the robustness of our classifiers' performance with molecular imaging features both alone and in combination.
The SVM classifiers designed using only the GM PTIV features showed the lowest (weighted) balanced accuracy (CTRL vs PD: 69.6%, CTRL vs AP: 86.1%, PD vs AP: 72.7%, CTRL vs PD vs AP: 59.5%) of the different classification problems studied. Low performance was particularly evident in those classification problems involving the PD and CTRL groups. These results align with the poor discriminability between CTRL and PD groups found in previous research analysing between-groups statistical differences and in studies of binary and multiclass machine learning model performance. Focke et al (2011) used whole-brain GM VBM data to develop binary classifiers that successfully discriminate between PD vs PSP and PD vs MSA. However, patients with PD could not be differentiated from CTRL group [44]. Huppertz et al (2016) used measures of GM and WM volume from 44 different brain regions to develop multiclass SVM with 62.9% balanced accuracy in the discrimination of CTRL, PD, PSP, and MSA groups [18]. The low performance was due to poor discrimination of the PD group. When they implemented a multiclass SVM model that included only the Parkinsonian syndromes (PD, PSP, MSA), they obtained a higher balanced accuracy of 81.8%. Zeng et al (2017) reported high classification accuracy (above 95%) between CTRL and PD groups using T1-weighted MRI data. They achieved this by applying an SVM classifier to VBM data for the GM of the cerebellum [16]. Like [18], our work included an ROI that incorporated the GM of the cerebellum. However, we found no significant between-group differences in that ROI (see figure 1) and low weights were assigned to that ROI by the binary and multiclass classifiers (figures 2 and S2). The GM PTIV features normalised the GM volumes using TIV to minimise the impact of confounders.
In PD, the reduction of GM volume is very subtle in some of the cortical ROI, yielding relatively normal findings in subcortical ROI (see figure 1), as described in [5, 9]. As shown in figures 2 and S2, the CTRL vs PD classifier assigned the highest weights to cortical regions associated with salience/ventral attention GM15:SalVentAttnB (lateral prefrontal cortex, medial posterior prefrontal cortex), control GM18:ContA (intraparietal sulcus, lateral prefrontal cortex), control GM19:ContB (lateral ventral prefrontal cortex), default mode GM22:DefaultB (temporal, inferior parietal lobule, dorsal prefrontal cortex, lateral prefrontal cortex, ventral prefrontal cortex) and GM24:TempPar (temporoparietal). AP tends to manifest more pronounced GM atrophy than PD in most of the cortical and subcortical ROI. ROI related to GM01:aPut (anterior putamen), GM10:SomMotA (somatomotor) and GM24:TempPar made the greatest contributions to the performance of the CTRL vs AP classifier. The PD vs AP classifier showed modest performance. The highest weighting factors resulting from the PD vs AP classifier was subcortical region GM01:aPut. The wide range for disease duration among the PD group and the heterogeneity within the AP group may have challenged the learning algorithms of the binary and multiclass classifiers, to a greater extent than the classifiers that used other sets of features. Disease duration for the PD group in this study ranged from 2 to 36 years, with a median of seven years. Scherfler et al (2016) have suggested that the volumetric data of PD patients with longer disease duration tends to contribute to the performance of classifiers that discriminate PD from CTRL [17]. GM atrophy does not become pronounced across multiple brain regions until the later stages of PD [45]. The AP group in this study consisted of MSA, CBD and DLB patients. Although the ROI covered most brain regions with relevant amounts of GM (cerebellum, cortex and sub-cortical regions), previous works [10–14] have shown that MSA, CBD and DLB are characterised by both common and very distinct patterns of GM atrophy across brain regions.
Molecular imaging has proven a powerful tool in the differentiation of Parkinsonian syndromes, even in the early stages. This is due to its ability to detect molecular and cellular dysfunctions before to regional volumetric abnormalities [46]. In contrast, to those of our classifiers designed with only GM PTIV features, the binary and multiclass SVM classifiers implemented using [11C]raclopride PET DVR features consistently showed a (weighted) balanced accuracy above 79% (CTRL vs PD: 93,3%, CTRL vs AP: 88.8%, PD vs AP: 78.9%, CTRL vs PD vs AP: 80.5%) (see tables 2 and 3).
[123I]ioflupane SPECT has been successfully used to discriminate PD from CTRL with balanced accuracies as high as 98% [47, 48]. Nicastro et al (2019) have showed that [123I]ioflupane SPECT data and other radiotracers mapping presynaptic functions are ineffective at discriminating PD from AP such as MSA [49] or PSP [50] due to the similarity between their patterns of presynaptic striatal dopamine transporter availability [51]. However, a recent study [21] with post-mortem confirmed diagnosis shows that [123I]ioflupane SPECT can discriminate PD from DLB with high accuracy.
As in the present study, Segovia et al (2016) assessed postsynaptic striatal function in PD, MSA and PSP patients using [18F]DMFP PET to quantify D2/D3 striatal dopamine receptors but with a different radiotracer to that used here [22]. Their best performance was achieved with an SVM model, which provided a classification accuracy of 90% for PD, but a modest 50% for MSA and 58% for PSP. Better results have been achieved using [18F]FDG PET [23, 24] to assess patterns of regional glucose metabolism and automatically differentiate PD, MSA and PSP. The binary classifiers designed in [23] and [24] showed classification balanced accuracies ranging from 80 to 95%. Although the approach presented herein used a different radiotracer to map and quantify the postsynaptic dopaminergic functions, [11C]raclopride, and a smaller cohort; the performance values of the binary classifiers are within the same range. Furthermore, our work also evaluates a multiclass classifier designed using the DVR features, which includes a CTRL group.
As illustrated in figure 1, the DVR features reveal between-group differences in most of the subcortical ROI. The weights assigned to DVR features by the SVM classifiers (figures 2 and S2) confirm the contribution of some of those features: DVR02:pPut (posterior putamen) and DVR06:NAc-core (core of nucleus accumbens), DVR06:NAc-core, and DVR02:pPut to discriminate CTRL vs PD, CTRL vs AP, and PD vs AP, respectively. While there have been few [11C]raclopride PET studies with MSA, CBD and DLB, finding suggest a common tendency towards reduced postsynaptic D2/D3 receptor binding, evident in comparison to CTRL [4, 6]. Conversely, [11C]raclopride PET studies in PD have shown preserved or higher binding in the putamen and caudate (particularly in posterior putamen) than in CTRL [7]. This is due to a mechanism that increases the availability of D2/D3 receptors to compensate for the reduced levels of dopamine released by the presynaptic terminals. These distinct profiles were replicated in our work (figure 1) and explored by the learning algorithm of the classifiers. Future development of this work using dynamic [11C]raclopride PET should study larger cohorts of MSA, CBD and DLB patients to assess differences between these atypical Parkinsonian syndromes. However, using more than three classes may prove challenging.
An innovation proposed in this work was the designing and testing of classifiers by integrating features obtained from structural and molecular imaging. The combination of [11C]raclopride PET DVR and GM PTIV features in the design of SVM classifiers improved the weighted balanced accuracy of some of the binary classification tests (CTRL vs PD: 96.7%, CTRL vs AP: 92.1%), and showed performance equivalent to [11C]raclopride PET with DVR features in multiclass classification tests (CTRL vs PD vs AP: 79.9%). The results of the binary classifiers CTRL vs PD and CTRL vs AP demonstrate the synergistic effect of a multimodal imaging protocol (MRI and PET) for the discrimination of PD and AP from CTRL.
As demonstrated in figures 2 and S2, the highest weighting factors extracted from all the classifiers included DVR and GM features. Even the performance of the CTRL vs PD classifier, which strongly relied on DVR features DVR02:pPut and DVR06: NAc-core, seems to have benefited from the contribution of GM PTIV features, namely the cortical features GM23:DefaultC (retrosplenial, parahippocampal cortex) and GM24:TempPar. The weights extracted from the PD vs AP classifier confirmed the relevance of the subcortical features GM01:aPut and DVR02:pPut suggested by the single modality classifiers. The CTRL vs AP classifier revealed additional relevant contributions from sub-cortical and cortical ROI not assigned with high weights by the single modality classifiers, namely subcortical features DVR04:pCau (posterior caudate), DVR05:NAc-shell (shell of nucleus accumbens), GM02:pPut (posterior putamen), salience/ventral attention GM15:SalVentAttnB and default mode GM22:DefaultB. However, a limitation remained concerning those classification problems likely to have the greatest impact in clinical practice: PD vs AP or PD vs AP vs CTRL (non-degenerative Parkinsonism). The results did not reveal the added value expected from implementing a protocol requiring distinct structural and molecular imaging examinations.
Our findings also highlight the robustness of [11C]raclopride PET and its potential to discriminate between CTRL, PD, and AP using a single imaging protocol. These findings should be consolidated in future works with larger cohorts. Greater sample sizes would allow the implementation of gold-standard validation (hold-out) of the classifiers through the application of independent datasets not used in the training sessions. In light of the small cohort used in this study, we followed best practices [52], implementing a ten-fold cross-validation strategy to assess the performance of the binary and multiclass classifiers. The robustness of performance was evaluated by repeating this cross-validation 50 times per classifier to train and test different dataset partitions. The implementation of large multimodal cohorts is challenging due to the financial and operational requirements of data acquisition (using [11C]raclopride molecular imaging and structural MRI), the recruitment of CTRL, PD and AP participants, and consistent control of data quality (e.g.: potential misdiagnoses, multisite harmonisation).
Previous works [17, 23] have emphasised that misdiagnoses of patients used in datasets, particularly in, early-stage patients, who provide the most interesting patient profiles, are relevant and transversal obstacles to the development of reliable, generalisable machine learning approaches to differentiation of Parkinsonian syndromes. In most studies using supervised machine learning approaches, including our own, the ground truth diagnosis used as a benchmark to train and test the performance of models is not confirmed by post-mortem neuropathological examinations, but taken from the most recent diagnosis of each participant following several years of clinical follow-up (table 1). While this is less diagnostically certain, it is nevertheless a reliable source of information. Recent reviews suggest that developments to handle label noise in supervised machine learning have gone largely unnoticed by the medical image analysis community [53–55]. In future works, the association of intrinsic uncertainty to clinical diagnoses of Parkinsonian syndromes used to label the datasets at a given time point might be a fundamental development in the implementation of reliable and impactful support tools for use in clinical diagnoses of Parkinsonian syndromes.
5. Conclusion
We found that the combination of [11C]raclopride PET DVR and GM PTIV features in the design of SVM classifiers improved weighted balanced accuracy in binary classification between CTRL and either PD or AP, and showed a performance equivalent to [11C]raclopride PET DVR features in multiclass (CTRL vs PD vs AP) classification tests. This indicates an increased value of having a multimodal imaging protocol (MRI and PET) to discriminate PD and AP from CTRL, although it remains a big challenge to discriminate between broad sets of clinical categories. The binary and multiclass classifiers designed with only [11C]raclopride PET DVR features consistently showed high (weighted) balanced accuracy.
Data availability statement
The data generated and/or analysed during the current study are not publicly available for legal/ethical reasons but are available from the corresponding author on reasonable request.
Funding
This work was supported by Foundation for Science and Technology, Portugal (UID/NEU/04950/2020, CEECINST/00041/2018, DSAIPA/DS/0041/2020, PAC - MEDPERSYST, POCI-01-0145-FEDER-016428, Centro 2020, BIGDATIMAGE, CENTRO-01-0145-FEDER-000016, Centro 2020 FEDER, COMPETE).
Conflict of interest
The authors declare no conflict of interest.