
Abstract
Objective. Brain-computer interfaces (BCIs) that record neural activity using intracortical microelectrode arrays (MEAs) have shown promise for mitigating disability associated with neurological injuries and disorders. While the chronic performance and failure modes of MEAs have been well studied and systematically described in non-human primates, there is far less reported about long-term MEA performance in humans. Our group has collected one of the largest neural recording datasets from a Utah MEA in a human subject, spanning over 5 years (2014–2019). Here we present both long-term signal quality and BCI performance as well as highlight several acute signal disruption events observed during the clinical study. Approach. Long-term Utah array performance was evaluated by analyzing neural signal metric trends and decoding accuracy for tasks regularly performed across 448 clinical recording sessions. For acute signal disruptions, we identify or hypothesize the root cause of the disruption, show how the disruption manifests in the collected data, and discuss potential identification and mitigation strategies for the disruption. Main results. Neural signal quality metrics deteriorated rapidly within the first year, followed by a slower decline through the remainder of the study. Nevertheless, BCI performance remained high 5 years after implantation, which is encouraging for the translational potential of this technology as an assistive device. We also present examples of unanticipated signal disruptions during chronic MEA use, which are critical to detect as BCI technology progresses toward home usage. Significance. Our work fills a gap in knowledge around long-term MEA performance in humans, providing longevity and efficacy data points to help characterize the performance of implantable neural sensors in a human population. The trial was registered on ClinicalTrials.gov (Identifier NCT01997125) and conformed to institutional requirements for the conduct of human subjects research.
Export citation and abstract BibTeX RIS
1. Introduction
In the past decade, brain–computer interfaces (BCIs) have gained traction as a viable intervention to circumvent damaged neural pathways and link the central nervous system directly with an external end-effector or the peripheral nervous system. BCI systems have utilized several neural signal acquisition modalities, including scalp electroencephalography (EEG), epidural or subdural electrocorticography (ECoG), and intracortical microelectrode arrays (MEAs) [1, 2]. Compared to EEG and ECoG, implanted MEAs allow for higher information transfer rates [3, 4], enabling more precise neural decoding and greater control of functional abilities [5]. Using MEA BCIs in the lab setting, individuals with tetraplegia have successfully controlled robotic arms [6, 7], computer cursors for communication and web surfing [8, 9], and functional electrical stimulation systems to reanimate their paralyzed limbs [10, 11]. More than 20 individuals with paralysis have successfully used implantable Utah MEAs (Blackrock Microsystems, Inc., Salt Lake, UT) across several clinical trials [6, 7, 9–21].
Recent longitudinal studies have provided long-term safety profile data of MEAs in human participants and demonstrated the longevity of adequate signal quality is better than anticipated [22–27]. In some cases, BCIs using Utah arrays have sustained high-performance for over 5 years [6, 15]. Despite these recent advancements, understanding of the MEA life cycle in humans is still limited. The chronic use and failure modes of MEAs have been well studied and systematically appraised in non-human primates (NHPs), with at least 78 MEAs implanted and analyzed [28, 29]. However, the conditions these arrays and associated recording hardware are subject to in NHPs are different than in humans. For instance, NHPs may exhibit incautious behavior during active periods and mechanically damage BCI hardware. In NHPs, the majority of MEAs fail within a year [28], whereas device lifetimes are substantially longer in humans [6, 15, 26]. Current models of local biological reactions and MEA material degradation predict substantial deterioration of MEA signal quality, but evidence suggests that the rate and occurrence of both chronic and acute signal disruptions may differ between arrays implanted in NHPs and humans [23, 26, 28]. Additional insight into long-term MEA performance in humans is critical for the widespread adoption of the technology, as current barriers include limited understanding about the chronic performance and expected lifetime of the device. Furthermore, this information can inform the US Food and Drug Administration (FDA's) regulatory decisions around implant duration for MEA studies.
In addition to long-term performance concerns, there are a wide variety of issues that can acutely disrupt neural signals recorded from a MEA. Signal disruptions are events that impact the neural recordings and can occur from issues related to biological phenomena, material degradation, mechanical failures, or a combination of mechanisms [30]. These disruptions can significantly impact BCI performance and often require physical repairs or algorithmic compensation to mitigate performance issues. These disruptions pose a major concern for individuals who use or have expressed interest in using BCIs, as evidenced by multiple end-user surveys reporting the importance of robust and high-performing BCIs [31–33]. Thus, identifying and understanding the root cause of MEA signal disruptions that occur in human use cases is critically important for advancing the BCI field; such analyses inform the development of methods for fast disruption diagnosis and remediation, which will be necessary for these technologies to transition to broader usage.
Our group has collected extensive neural recording data sets from an MEA in a human subject, spanning over 5 years in duration (2014–2019). The goals of this work are to quantitatively illustrate array performance over time and present several instances of acute disruptions we encountered throughout the 5 year study. This report introduces a new dataset for the quantification of chronic trends of standard neural features provided in a prior study [23], provides additional insight into the stability of the MEA over time, and adds a disruption analysis with case examples to the literature regarding MEA performance.
2. Methods
This investigational clinical trial was approved by FDA under an investigational device exemption and The Ohio State University Wexner Medical Center Institution Review Board (Columbus, Ohio) and registered on ClinicalTrials.gov (Identifier NCT01997125). The participant referenced in this work provided permission for photographs and videos and completed a written informed consent process prior to commencement of the study.
2.1. Study participant and implanted MEA
The study participant sustained stable, non-spastic tetraplegia from a cervical SCI that occurred four years prior to his enrollment in the trial. The participant's neurologic level based on the International Standards for Neurological Classification of SCI is C5 complete tetraplegia (ASIA Impairment Scale A) with a zone of partial preservation to C6. The participant was implanted with one Utah MEA (Blackrock Microsystem Inc., USA) in the hand region of his left, dominant motor cortex. The hand region was identified using preoperative fMRI activation maps corresponding to imagined and observed right hand movement. The MEA comprised 96 platinum-coated recording electrodes, 1.5 mm in length. Full details on the participant's injury level and surgical procedure can be found in Bouton et al [10].
2.2. Clinical sessions and datasets
Clinical trial sessions with the participant began 23 d post-implantation and were typically conducted 2–3 times per week for the duration of the study. Each clinical session lasted 3–4 h. A total of 448 clinical recording sessions were conducted over an 1855 d post-implantation period. This set of intracortical recordings is one of the largest and longest-duration collections of its kind and offers insight into the chronic recording capabilities of a Utah array implanted in a human.
We analyzed three datasets that were collected across the entire clinical study. The first dataset consisted of MEA electrode impedances measured at the start of each recording session. The second dataset consisted of MEA recordings while the participant rested with his eyes closed for 60 s. This rest task was performed in 397 sessions and was the first task on these days. Impedance values and 60 s rest recordings were used to assess long-term MEA recording characteristics and identify acute signal disruptions. The third dataset consisted of MEA recordings during a four-movement motor imagery task (section 3.5). This task was performed periodically from day 85 post-implantation through the remainder of the study for a total of 216 sessions. The motor imagery dataset was used to evaluate chronic BCI performance.
2.3. Neural recordings, impedance, and signal processing
Intracortical signals were recorded from the MEA and digitized using a NeuroPort neural data acquisition system (Blackrock Microsystem Inc., Salt Lake City, Utah, USA). Neural recordings at each of the 96 channels of the MEA were sampled at 30 kHz with a 0.3 Hz first-order high-pass and a 7.5 kHz third-order low-pass Butterworth analog hardware filter. Neural recordings were processed and analyzed offline using MATLAB (release 2019a, The MathWorks, Inc., Natick, Massachusetts, USA).
To evaluate chronic signal quality and identify intracortical recording disruptions we analyzed impedance and calculated the following standard metrics using the 60 s rest data: root-mean-square voltage (VRMS), peak-to-peak voltage (Vpp), firing rate (FR), signal-to-noise ratio (SNR), number of identified units, and channel correlation. These metrics were chosen because they are either commonly used in signal processing or have been used in other MEA studies to quantify signal quality [23, 26, 28, 34]. All signal metrics were calculated using intracortical recordings with transient voltage artifacts removed. Artifact waveforms were consistent with electrostatic discharge (ESD) events. Artifacts were removed using the MATLAB built-in findpeaks function (The MathWorks, Inc.) to detect voltage transients using a minimum peak prominence of 125 μV and a maximum peak width of ten samples. The removed transients were refilled with a linear interpolation to reduce edge effects during filtering. Artifact waveforms were detected and removed in 29 of the rest recordings. Unless otherwise stated, electrode impedance and signal metrics were evaluated per channel and then averaged across all 96-channels of the MEA.
2.3.1. Impedance
Electrode impedance measurements were performed at the beginning of each clinical session using the Blackrock Impedance Tester (Blackrock Microsystem Inc.). The impedance of each electrode was measured at 1 kHz using a 10 nA peak-to-peak sinusoidal current.
2.3.2. Signal metrics
Signal metrics were calculated per channel, each session, using the full 60 s rest recordings.
- (a)VRMS was calculated by first applying a digital 250 Hz fourth-order high-pass Butterworth filter to the neural recordings and then applying the following formula to each of the 96 signals:where N is the number of samples.

- (b)FRs were calculated for each channel by dividing the total number of detected threshold crossings in the filtered data by the recording duration in seconds. Threshold crossing waveforms (1.6 ms in duration) were detected using a threshold of −4.5 times the VRMS of each channel.
- (c)Vpp was calculated per channel as the average peak-to-peak amplitude of all threshold crossing waveforms.
- (d)SNR for each channel was calculated using the following:where signal was defined as Vpp, and noise was VRMS.
- (e)Number of identified units was calculated using Wave Clus software [35] for spike detection and sorting. In brief, this process uses an amplitude threshold to detect spikes, applies a wavelet transform to the spikes, and then uses the resulting wavelet coefficients as input to a clustering algorithm (see [35] for further details). Units were identified de novo each day starting with default sorting parameters, adjusting parameters manually as needed, and without influence from the sorting results of previous sessions. The number of identified units represented the total number of units across the entire MEA for each session.
- (f)Channel correlation was calculated by first correlating 60 s raw voltage waveforms for each channel with all other channels. Correlation was calculated using the MATLAB built in corrcoef function (The MathWorks, Inc.), resulting in a 96 × 96 matrix. Averaging across each row, produces a coefficient for each channel quantifying how correlated it is to the rest of the MEA. These average channel correlations were calculated for each recording session. Average channel correlations were used to detect conductive bridging or shorting and instances where channels became isolated from the rest of the array. Global MEA correlation was also calculated for each session by taking the mean of all average channel correlation coefficients each day.


2.4. Identifying disruption cases
We used both a top-down and bottom-up method to identify disruption cases that occurred in our clinical study. During each clinical session with the participant, detailed notes were recorded regarding signal quality, performance, and irregularities. The bottom-up method involved analyzing these notes to retrospectively identify cases of signal disruptions and then classifying the disruptions by studying the signal and documented evidence. The top-down method involved analyzing the chronic signal to identify trends associated with array failure modes reported in the literature. Signal metric plots are annotated with the identified disruptions. The signal disruptions presented in this case series are highlighted at a system level in figure 1 alongside an image of the study participant.
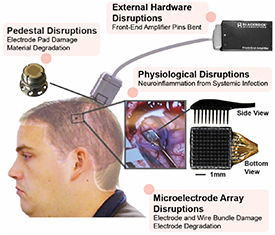
Figure 1. Overview graphic highlighting the signal disruptions observed across the study along with the study participant. The signal disruptions are grouped based on the identified or hypothesized root-cause location in the system (either MEA, pedestal, external hardware, or physiological) and highlighted in pink. Images of each subcomponent are not to scale. The implanted MEA location is indicated on the inlaid brain, which is a post-operative computed tomography (CT) scan of the participant's brain. An image of the MEA during surgery is also shown.
Download figure:
Standard image High-resolution image2.5. Chronic BCI performance during a motor imagery task
The participant performed the same motor imagery task weekly for the duration of the study [24]. We recorded intracortical signals during the task and used this dataset to quantify the effects of chronic disruptions on BCI performance. In the motor imagery task, the participant was cued with a virtual hand on a computer monitor to imagine either index finger flexion, index finger extension, wrist extension, or wrist flexion. The participant received no feedback. A trial consisted of four cue repetitions of each movement. Movement cues were 2.5 s in duration and interleaved with rest cues that were 4 s in duration, resulting in trials with 16 movements and 16 rest periods across 104 s. Movement cue order was randomized for each trial. The motor imagery task consisted of two consecutive trials with a brief rest period in between. Figure 2 illustrates the experiment.

Figure 2. Illustration of the motor imagery experiment. The participant faced a computer monitor while connected to the BCI system. He was cued with an on-screen hand to imagine index finger flexion, index finger extension, wrist extension, or wrist flexion. The timeline demonstrates a representative trial in which movement cues (2.5 s) were repeated four times with rest periods (4 s) interleaved. Movement cues were randomized during data collection. A brief 2 min break was taken between consecutive trials. No feedback was provided to the participant during the experiments.
Download figure:
Standard image High-resolution imageFor each session, we trained a non-linear support vector machine (SVM) decoder [36] to classify motor intent by outputting one of five classes (rest, index finger flexion, index finger extension, wrist extension, or wrist flexion). The classifier generated a prediction of motor intent every 100 ms based on the prior 1000 ms of neural data. We used data from the first trial to train the decoder and calculated accuracy by testing the decoder on the second trial. Decoders were built offline, retrospectively. Accuracy was calculated by dividing the total number of correct predictions by the total number of predictions within each 104 s trial. Accuracy at chance was calculated by assuming the most prevalent class, rest, would be predicted for the duration of the task. Mean wavelet power (MWP) in the multi-unit frequency band was used as the decoder input feature since it correlates well with motor intent [10, 37]. MWP was calculated by first performing a wavelet decomposition on the neural signal using the 'db4' mother wavelet and 11 wavelet scales. Wavelet coefficients for scales 3–5 (frequency band 234–1875 Hz) were averaged per scale every 100 ms. The mean scale coefficients were individually standardized by subtracting the mean and dividing by the standard deviation over a given trial. Data from both trials in each task were Z-scored using the mean and standard deviation from the first trial of that day. For each channel, the standardized scale coefficients were averaged to a single feature, resulting in 96 features per 100 ms time bin. The MWP features were then smoothed using a one second boxcar filter.
2.6. Statistical analysis
Average electrode impedance and signal metrics across the study duration were fit with statistical models and the estimates were assessed for significance. Impedance, VRMS, and Vpp were fit with an exponential decay model with n − 3° of freedom:

where, y0 is the starting value and decays towards yf at a rate α. FR, SNR, number of identified units, and decoding accuracy were fit with a linear model with n − 2° of freedom:

where, yi is the response of interest for ith observation, Xi is the corresponding predictor (days) with random error εi, β0 and β1 are the population intercept and slope coefficient respectively. Channel correlation was fit with a cubic model with n − 4° of freedom:

where, yi is the response of interest for ith observation, Xi is the corresponding predictor (days) with random error εi, β0 is the population intercept, and β1, β2, and β3 are the regression coefficients of 1st, 2nd, and 3rd order variable Xi , respectively.
Locally weighted regressions (LOESSs) were fit to each of the signal metrics for visualization purposes. Interquartile ranges (IQRs) shown in figures were smoothed using LOESS for visual clarity. Statistical analyses were performed in MATLAB (release 2019a, The MathWorks, Inc., Natick, Massachusetts, USA) and R (version 3.5.1), and p < 0.05 was considered statistically significant. Unless otherwise stated, results are presented as mean ± standard deviation.
3. Results
We summarize the major identified disruptions in figure 1. We classify a disruption as major if it persists over the course of days and causes significant signal changes that could negatively impact performance. There were likely other disruptions that were not identified, though we believe the disruptions that caused substantial signal changes are represented in these results. As of July 2021, the study participant remains implanted, and his array remains functional and the BCI performance remains robust, with a decoder accuracy above 80%.
3.1. Chronic impedance and signal
To assess the chronic recording stability, we evaluated changes over time in impedance and six metrics derived from the neural recordings: VRMS, FR, Vpp, SNR, number of identified units, and channel correlation. We present these metrics here as averages across the array channels. Figures are annotated based on notes documented during recording sessions and with identified signal disruption events (figures 3(a) and 4). We also labeled the figures according to the different laboratory spaces where data was collected to account for any environmental effects on signal quality. Many of the signal metrics exhibit trends that indicate a chronic decrease in signal quality, though notable acute changes were also identified.
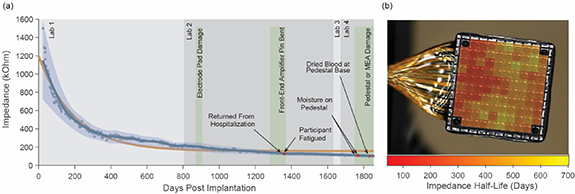
Figure 3. Chronic impedance across the 5 year study. (a) Average impedance at reference A. Each data point represents the average impedance across the MEA. The data was fit with a LOESS regression (blue line) and an exponential decay model with a 95% confidence interval (orange line). Blue shaded area represents smoothed IQR. Single-day disruptions are colored in red and annotated accordingly. Green regions indicate sustained disruptions. Gray regions indicate lab spaces where data collection was performed. (b) Impedance half-life overlaid on an MEA. Exponential decay models were fit to the impedance data for each channel, and the calculated half-lives were then topographically mapped to the MEA. Notably, electrodes that experienced a more rapid decay were positioned nearest the wire bundle.
Download figure:
Standard image High-resolution image
Figure 4. Neural recording metrics across the 5 year study. Each data point represents the average metric value across all channels of the MEA. The data for each metric was fit with either an exponential decay, linear regression, or cubic model with a 95% confidence interval (orange line) as well as a LOESS regression (blue line). Blue shaded area represents smoothed IQR. Single-day disruptions are colored in red and annotated accordingly. Labeled green regions indicate sustained disruptions. The backmost gray regions indicate lab spaces where experiments were conducted. (a) VRMS, (b) FR, (c) Vpp, (d) SNR, (e) number of identified units, and (f) channel correlation. *Outliers in Vpp (3950 μV) and SNR (47.69 dB) were observed on day 1781 post implantation.
Download figure:
Standard image High-resolution image3.1.1. Impedance
On the day of implantation, the average ex vivo pre-implant impedance (performed in saline) was 885.88 ± 192.88 kOhms. Electrode impedance in tissue was 1498.48 ± 630.63 kOhms during the first recording session, 23 d post-implantation (figure 3(a)). The average impedance of the MEA electrodes decreased rapidly in the first 300 d of the study (day 23: 1498.48 ± 630.63 kOhms; day 300: 352.36 ± 121.58 kOhms) and decreased at a slower rate for the remainder of the study (day 1855: 101.21 ± 22.18 kOhms). We found that the change in rate of decay (α, equation (3)) across the entire study duration was significant (exponential decay, p < 0.001, 95% CI: (0.0048, 0.0054)) with a half-life of 135 d. The impedance trend is presented in figure 3(a). Exponential decay models were fit to the impedance data for each channel and the calculated half-lives were topographically mapped to the MEA (figure 3(b)). Impedance decayed fastest for electrodes near the wire bundle.
3.1.2. Root-mean-square voltage
Similar to impedance, the average VRMS of the neural signal decreased rapidly in the first 300 d of the study (day 56: 11.45 ± 2.04 μV; day 302: 6.52 ± 1.39 μV) and decreased at a much lower rate for the remainder of the study (day 1848: 5.45 ± 0.87 μV) (figure 4(a)). We found that the change in rate of decay (α, equation (3)) across the entire study duration was significant (exponential decay, p < 0.001, 95% CI: (0.0062, 0.0089)) with a half-life of 93 d. Interestingly, on day 1781, the average VRMS was much higher than normal with a value of 16.08 μV. This outlier occurred during a period when we noticed hardware issues related to either the pedestal or MEA. We address this disruption later in section 4.2.2.
3.1.3. Firing rate
We observed that the average FR increased rapidly in the first 71 d of the study (day 23: 1.78 ± 2.68 spikes/second; day 71: 3.60 ± 3.93 spikes/second) and then decreased shortly after (day 167: 1.34 ± 2.08 spikes/second) (figure 4(b)). Following the initial peak in FR, there was a gradual increase until about day 800 and then a gradual decrease for the remainder of the study. Overall, we found no statistically significant difference in firing rate (linear regression, p = 0.171, 95% CI: (−0.000 18, 0.000 03)) across the entire study duration.
3.1.4. Peak-to-peak voltage
Average Vpp exhibited a slightly different trend than the impedance and VRMS (figure 4(c)). There was a rapid increase in the first 50 d of the study (day 23: 93.63 ± 37.61 μV; day 50: 120.76 ± 45.09 μV) followed by a rapid decrease (day 302: 54.63 ± 22.61 μV). There was a gradual decrease for the remainder of the study (day 1848: 42.99 ± 10.32 μV). We found that the change in the rate of decay (α, equation (3)) across the entire study duration was significant (exponential decay, p < 0.001, 95% CI: (0.009 11, 0.011 42)) with a half-life of 68 d. There were several notable outliers in the average Vpp identified that we discuss later in the section 4.2.
3.1.5. Signal-to-noise ratio (SNR)
We observed that the average SNR increased rapidly in the first 48 d of the study (day 23: 18.6 ± 2.21 dB; day 48: 19.76 ± 2.37 dB) and decreased rapidly shortly after (day 113: 18.44 ± 1.95 dB) (figure 4(d)). Following this period, SNR remained stable for the remainder of the study. We found no statistically significant difference in SNR (linear regression, p = 0.947, 95% CI: (−0.000 27, 0.000 29)) across the entire study duration.
3.1.6. Number of identified units
The average number of identified units exhibited a behavior similar to FR, where the average number of identified units increased rapidly in the first 71 d of the study (day 23: 64 units; day 71: 100 units) and decreased rapidly shortly after (day 178: 43 units) (figure 4(e)). There was a gradual increase for about 1000 d following this initial peak and then a gradual decrease for the remainder of the study. We found that the difference across the entire study duration was statistically significant (linear regression, p < 0.001, 95% CI: (−0.007 84, −0.003 79)), with a slope of −0.0058 units d−1. There were several interesting outliers that were associated with observed disruptions in the average number of identified units identified that we address later in section 4.2.
3.1.7. Channel correlation
3.2. Signal disruption case series
3.2.1. Acute neuroinflammation due to a systemic infection
During the 5 year study, our participant experienced a complicated infection (days 1325–1357), unrelated to the study, that required hospitalization. The participant took a short course of anti-inflammatory medications following this hospitalization. When he returned for recording sessions, and was maintained on IV antibiotic treatment, we noticed a period of significant mental fatigue. The recordings from these sessions revealed a substantial but transient increase in both the number of identified units (figure 4(e)) and FR (figure 4(b)). The number of units increased to levels observed during the MEA implant recovery period at the beginning of the study (day 69: 90 units; day 1357: 90 units) (figure 4(e)), also at a time of resolving inflammation. For approximately 100 d following the infection, we observed a sharp decrease in the number of identified units (figure 4(e)) and SNR (figure 4(d)). Other groups have identified links between systemic inflammation and central nervous system (CNS) modulation [38, 39], and though the effects on BCI performance remain unclear, systemic illness and its treatment may have caused the observed signal fluctuations.
3.2.2. Pedestal or MEA damage
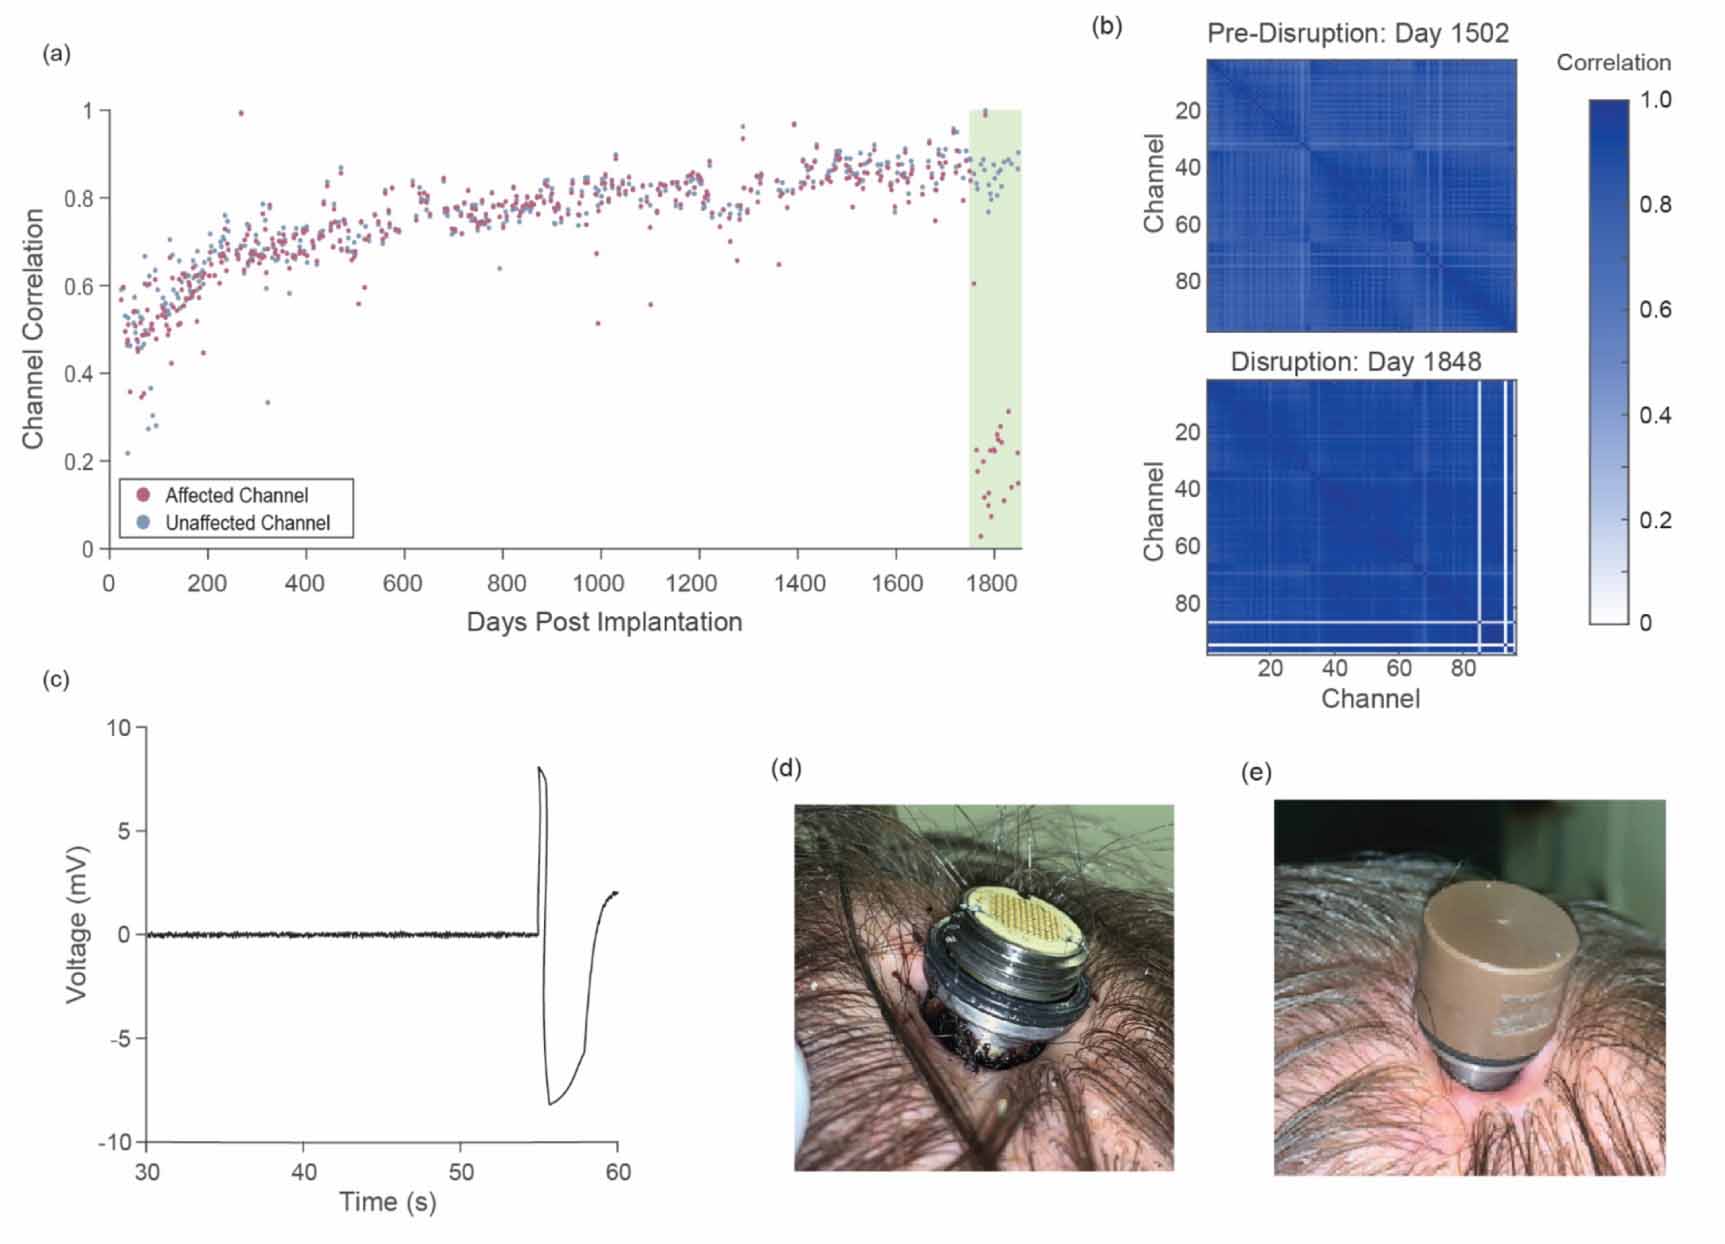
Over long-term use, both the MEA and pedestal are susceptible to mechanical damage and material degradation [28]. Toward the end of the 5 year study (days 1749–1857), we noticed that certain channels began to electrically float, suggesting a break in MEA conductor pathways. The affected channels recorded electrical noise and appeared to be disconnected from MEA electrodes. Though we are not certain of the reason for this disruption, we were able to narrow the location to the pedestal or MEA. Engineers at Blackrock suggested that damage at the pedestal and wire bundle interface may have caused this disruption. We observed significant reductions in the correlation between affected channels and unaffected channels (figures 5(a) and (b)), as well as an abnormally high correlation between affected channels. This disruption persisted through the end of the study.

Figure 5. Signal disruption due to pedestal or MEA damage. (a) Correlation of a floating channel (red) and a non-floating channel (blue) with the other channels in the array. The green region highlights the duration of the damaged pedestal or MEA disruption. (b) Cross-correlation matrix for all channels on representative days both prior to (day 1502) and during (day 1848) damage. Three channels (85, 93, and 96) were affected on this day. (c) Unfiltered neural recordings of all 96-channels of the MEA. In the final ∼5 s of the recording, the upper and lower voltage limits were reached. (d) During this disruption period, we observed dried blood on the base of the pedestal at the tissue opening on day 1834. (e) A clinician cleaned the skin-pedestal interface, removing the dried blood.
Download figure:
Standard image High-resolution imageIn two of the sessions following the initial electrode disruptions, we observed moisture, that we believed to be serous fluid, on top of the pedestal (days 1763 and 1772 post-implantation). On day 1781, there was a large outlier in Vpp (figure 4(c)). Upon further investigation, we noticed that the unfiltered neural recordings at all MEA channels exhibited a ∼5 s rail-to-rail waveform that reached the upper and lower voltage limits of the amplifier (figure 5(c)). This event is likely due to ESD, but the array susceptibility to this disruption may be linked to the fundamental hardware damage that caused channel disconnections and allowed fluid ingress.
Lastly, we observed dried blood on the base of the pedestal at the skin interface on day 1834 (figure 5(d)). The clinical team cleaned the skin-pedestal interface (figure 5(e)), found no signs of active bleeding, and approved recording from the array. There were no metric outliers on this day (figures 4(a)–(f)). This event may have been associated with the underlying hardware damage or due to mild head trauma. Relationships between the observed channel disconnections, fluid ingress, and hemorrhage are further examined in the discussion section.
3.2.3. Front-end amplifier pin bent
Repetitive connections and disconnections of the patient cable increase the chance of connector damage. In this case, we noticed one of the front-end amplifier pins bent during a session. The bent pin caused an electrical contact misalignment and prevented signal transmission on the affected channel. As a result, the recorded voltage on the channel flatlined. This disruption was observed across most individual channel metrics and can be easily visualized in the VRMS and impedance data (figure 6). The issue was present for about three months (days 1281–1368). The disruption was repaired by an engineer realigning the bent pin and restoring the electrical contact. Following the repair, signal metrics on the affected channel returned to typical values.

Figure 6. Disruption caused by a bent pin of the front-end amplifier. (a) VRMS values flatlined on the affected channel during the disruption. (b) Impedance values also flatlined on the affected channel during the disruption. The green region highlights the damage duration. Values for both metrics are plotted for the affected channel (red) and a baseline channel (blue).
Download figure:
Standard image High-resolution image3.2.4. Pedestal electrode pad damage
Damage may occur to the pedestal or patient cable while connecting these components since the interface electrode pads are delicate and can easily break. In this case, a technician was connecting the patient cable to the pedestal and accidentally scratched the pedestal surface, damaging multiple electrode pads (figure 7(a)). Fortunately, the damage was minor, and we did not notice a significant effect on long-term signal quality. However, a metal fragment from the electrode 78 pad electrically shorted electrode 78 to electrode 87. Once identified, the issue was resolved by cleaning the pad thoroughly, including removing the electrode pad fragment and small particulates caused by the damage. The issue persisted for about a month after the initial damage, until it was identified and resolved (days 871–906).
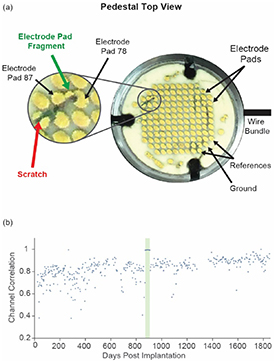
Figure 7. Disruption caused by damage to the pedestal electrode pad. (a) An image of the pedestal electrode pads during the disruption period. The scratch location is denoted with a red arrow. The green arrow indicates where the electrode pad fragment broke from pad 78 that electrically shorted pads 78 and 87. (b) The green region highlights the duration of the pedestal electrode pad damage. During this period, the two channels were electrically shorted and became highly correlated. The channel correlation returned to its baseline level after the electrode pad fragment was removed.
Download figure:
Standard image High-resolution imageThis disruption is easily observed in the raw signal correlations between channels 78 and 87 (figure 7(b)). As expected, the shorted channels were highly correlated. The signals were effectively copied across the two electrodes, making it difficult to detect the disruption using metrics other than channel correlation. Immediately following remediations, the two affected channels returned to their previous signal correlation. Metric trends indicated that signal disruptions due to the scratched pedestal completely resolved.
3.3. Chronic BCI performance
Despite the significant decline in many of the neural signal metrics, chronic BCI performance was not significantly impacted. A linear regression fit to decoder performance revealed a stable accuracy during the motor imagery task (linear regression, p = 0.076) (figure 8). The accuracy remained at 84.54 ± 5.57% on average for the duration of the study (accuracy at chance = 61.5%). Additionally, the participant reported no subjective loss in the ability to control the decoder to perform functional tasks over time.

Figure 8. BCI SVM decoder performance during a motor imagery task across the 5 year study. Each data point represents decoder accuracy during the motor imagery task conducted during a given session. For each session, SVM decoders were trained on trial one and tested on trial two of the motor imagery task. The data was fit with a linear regression model and 95% confidence interval (orange line). The decline did not reach statistical significance (p = 0.076), indicating stable performance for the duration of the study. The dashed gray line indicates accuracy at chance level. Single-day disruptions are colored in red and annotated accordingly. Labeled green regions indicate sustained disruptions. The backmost gray regions indicate lab spaces where the data was recorded.
Download figure:
Standard image High-resolution image
4. Discussion
This study details the chronic performance of an MEA implanted in a human during a BCI clinical study for over 5 years. We analyzed both the electrode impedances and neural signals across the duration of the study and identified a wide variety of interesting biological, material, and mechanical disruption cases that resulted in mild to severe signal corruption. A summary of the disruption events is presented in table 1. These results provide critical insights for developing novel methods to detect and predict failures, remediate signal quality, and ultimately improve overall BCI performance.
Table 1. Intracortical BCI signal disruptions.
| Disruption case details | Time of occurrence (days post-implant) | Signal impact |
|---|---|---|
| Acute neuroinflammation due to a systemic infection | Participant returned from hospitalization (1357). Participant was abnormally fatigued (1364). | Rapid increase during infection followed by rapid decrease post-infection in single units, FR, and SNR across the array. |
| Pedestal or MEA damage | 1749–1857. Moisture observed on pedestal (1763, 1772). Dried blood observed on pedestal base (1834). | Low channel correlation between affected and unaffected channels. High channel correlation between affected channels. Rapid increase in Vpp during ESD events. |
| Front-end amplifier pin bent | 1281–1368 | VRMS and impedance flatline on affected channels. |
| Pedestal electrode pad damage | 871–906 | ∼100% channel correlation between shorted channels. |
4.1. Chronic impedance and signal
To understand the chronic neural signal quality, we analyzed trends in impedance, VRMS, FR, Vpp, SNR, number of identified units, and channel correlation. These metrics provide insight to the chronic material and biological processes that affect signal quality. In the following, we compare the trends of these metrics to prior reports of chronic MEA signal quality. We then consider potential underlying mechanisms that influence these trends.
The impedance profile of chronically implanted MEAs in animal models typically show a large increase in the first weeks after implantation and then a decline through the remainder of the study [28, 40–42]. We did not record from the MEA or take impedance measurements during the initial 3 weeks when impedance is predicted to peak. From 23 d post-implant we observed a 93% total decline in average impedance with a half-life of 135 d. Similarly, Barrese et al analyzed chronic impedance in 26 MEAs implanted in NHPs and reported on average a ∼60% decline in impedance over an 1800 d period post-implant [28]. In a recent human subject study, Hughes et al reported an 85% decrease in impedance across 1500 d post-implantation [26]. The impedance trend reported in Hughes et al exhibited an exponential decline immediately post-implantation very similar to the data we present here.
We observed an overall decline in the number of identified units across the study duration, consistent with previous studies [26, 28, 43–47]. Throughout our study, the number of identified units varied session-to-session and followed an unusual long-term trend (figure 4(e)). We observed an initial peak in the number of identified units within the first 71 d followed by a sharp decline through day 178. A similar transient increase of units within 100 d post-implantation is occasionally observed in other studies [46, 48]. Contrary to other reports, we observed a gradual increase in the number of identified units for multiple years following the initial decline. Interestingly, a second sharp decline occurred around day 1400. This decrease coincided with a systemic infection that hospitalized the participant. The potential relationship between these two events is addressed in the case series discussion. Throughout the entire study, the FR trend closely paralleled the identified units trend. Indeed, an initial peak around day 71, recovery through day 1400, and secondary decline are evident in figure 4(b).
We next analyzed trends in Vpp. Similar to the number of identified units and FR, we observed a transient increase in Vpp within the first months after implantation. This Vpp trend is evident in some human and NHP recordings [28, 48]. Overall, we observed a 54% total decline in average Vpp with a half-life of 68 d. These findings are comparable to both NHP and human studies that examined Vpp of threshold crossings. Barrese et al reported an average ∼33% decline in Vpp over an 1800 d period post-implant, averaged across data from 47 MEAs implanted in NHPs [28]. Hughes et al reported a 46% decrease in Vpp across 1500 d post-implantation in a human study participant [26].
The electrode impedance and neural recording metrics reported in this study exhibit chronic trends that suggest gradual deterioration in signal quality (figures 3(a) and 4). Similar results have been reported in NHPs and some humans [23, 26, 28, 48–50]. We did not observe a relationship between laboratory recording location and signal metrics, suggesting that environmental factors such as electromagnetic interference did not bias metric trends. Without device explanation, we cannot be certain of the underlying disruptions that impacted long-term MEA performance. However, the longitudinal metric trends suggest a combination of biological and material disruptions occurred throughout the clinical study.
MEA implantation directly damages cortical tissue, disrupts the blood brain barrier, and initiates a neuroinflammatory response leading to a neurotoxic environment [30]. This local neurotoxicity causes a neuronal 'die-back' from the implanted electrodes within the critical recording radius [43–45, 47, 51]. Interestingly, some studies suggest the neuroinflammatory response and local neuronal density is multi-phasic in the first 16 weeks post-implantation [43, 45]. Though we did not record for the first three weeks post implantation, we did observe an early transient increase in the number of units. This peak may represent a transition from resolving local neural inflammation and edema to chronic neuronal degeneration or other mechanisms that rapidly deteriorated signal quality. The secondary decline in the number of identified units occurring around day 1400 may also be associated with neuroinflammation and is further analyzed in the case series discussion.
Another common biological response to MEA implantation is glial scarring. Rapidly after device implantation, glial cells are activated and recruited to the electrode interface where they form an encapsulating scar [52–55]. Scar formation is hypothesized to affect neural recordings through a number mechanisms including electrical insulation, neuronal displacement, and modulation of nearby neurons [30]. Consistent with its role as an electrical barrier, glial scar formation temporally aligns with an early increase in electrode impedance [29, 40, 41, 56]. The initial rise in impedance typically occurs within the first two to three weeks after implantation. In the following months, the impedance may stabilize or continue to rise as the glial sheath thickens. Though we did not record impedance during the initial weeks, our results conflict with the predicted impedance profile and instead reveal a rapid decline starting from day 23 post implantation. Early impedance may have been dominated by other biological factors including resolving post-implant edema and inflammation or MEA material processes such as water absorption and infiltration. Nevertheless, the possibility remains that glial scar expansion caused the first decline starting around day 50 of multiple metrics including Vpp, and SNR (figure 4). Studies examining the glial scar progression have shown dynamic changes in scar morphology within the first 16 weeks post implantation [43, 45]. A dramatic change in scar density could attenuate signals from local neurons and explain the synchronized decline across metrics. However, the consistent decline in impedance we observed during this time does not support a delayed glial response. Ultimately, glial scarring did not appear to diminish long-term signal quality. In fact, several metrics including the number of identified units and SNR improve in the first three to four years of recording after the initial spike in metrics.
Perhaps the most threatening biological failure mode of implanted MEAs is meningeal fibrosis and array ejection from the cortex. This failure mode accounts for approximately 50% of chronic MEA failures in NHPs [28]. Meningeal cells, including fibroblasts and inflammatory cells, migrate to the MEA following implantation [57, 58]. Fibroblasts grow under around the array as well as infiltrate down electrode shafts from the cortical surface to encapsulate the implant [28, 29, 58, 59]. These cells deposit collagen, which over time forms a fibrous capsule that can eject the array from the cortex. Observations of fibrous encapsulation in NHPs reveal substantial variability in time-to-fail, ranging between a few weeks to less than a year [28]. This period aligns with the early decrease we observed in several of the neural signal metrics such as Vpp and number of identified units. The process causing this decline appeared to stabilize within the first year, matching the reported upper time range of MEA failures due to meningeal encapsulation in NHPs. However, little is known about the progression of meningeal encapsulation beyond one year post implant, so we cannot draw any definitive conclusions.
In addition to the range of biological disruptions affecting signal quality, MEAs are also susceptible to material degradation. Insulation deterioration has been observed in explanted Utah arrays that were chronically implanted in animal models. Specifically, scanning electron microscopy has revealed irregular parylene-C and platinum (Pt) interfaces and insulation cracking along electrode shafts [29, 60]. Insulation degradation can increase effective conductor surface area which, in turn, lowers impedance [61]. Increased conductor exposure also averages neural signals over a larger geometric area and attenuates recorded potentials [61]. The continual decline in average electrode impedance and Vpp observed in our study is consistent with ongoing material degradation throughout the study. Analyses of chronically implanted NHP MEAs predict that material degradation is a major factor that limits the usable lifetime of these devices to less than 10 years [28]. Other groups with chronically implanted Utah arrays in humans have observed similar trends in impedance [26].
Our results regarding spatial topography of impedance decay on the MEA (figure 3(b)) provide additional evidence that material degradation is likely contributing to chronic impedance decline and signal deterioration. The electrodes nearest the wire bundle experienced a more rapid decay relative to other electrodes. Though the localized decay may be due to a concentrated biological response, this side of the MEA could be exposed to additional strains from the wire bundle. Recent research demonstrated that the mechanical mismatch at material interfaces and strains on weak structural components contribute to the failure of electrodes on planar neural probes [62]. Mechanical damage near the wire bundle interface could also introduce material defects that accelerate other failure mechanisms including fluid infiltration and electrical bridging between channels. Furthermore, we observed a chronic increase in channel correlation across the study (figure 4(f)), suggesting ongoing material degradation and increased channel crosstalk. Lastly, near the end of the clinical study, the implanted BCI hardware suffered an acute material disruption. This event is further addressed in the following case series discussion.
4.2. Case series discussion
4.2.1. Acute neuroinflammation due to a systemic infection
We identified a relationship between signal quality and a systemic infection our participant experienced (figures 4(b) and (e)). This data suggests that transient inflammation arising outside the nervous system can influence MEA signal quality. This is consistent with studies that have elucidated several cytokine-mediated communication pathways that influence neuronal activity and behavior, including lethargy and depression, during systemic infections [38, 39]. Furthermore, these responses may be exaggerated in neurologically compromised individuals [38]. Interestingly, we noticed a large increase in both the firing rate and the number of identified units in the sessions immediately after the participant's return from the hospital. These metrics reached values similar to those observed at their peak early in the study following implantation. During this time signal quality was likely influenced by the neuroinflammatory response or by medications. We also noticed a sharp decline in SNR and the number of identified units following the infection. The chronically open blood-brain barrier near the electrodes permits infiltration of pro-inflammatory myeloid cells and cytokines [63] that may have been elevated during the infection. Exacerbated local inflammation degrades chronic signal quality through several mechanisms including neurodegeneration [30] and may explain the decline in the number of identified units and SNR in the weeks following the infection.
Infections are more common in people with SCI, so exploring methods of signal disruption mitigation is essential for this case. Anti-inflammatory medications may decrease the potential inflammatory response near the electrode-tissue interface. Although adaptive decoders and other algorithmic strategies may help mitigate the detriment to BCI performance [30], medical treatment and biological healing remain the most effective remediation.
4.2.2. Pedestal or MEA damage
Toward the end of the study period (days 1749–1857), we observed that specific channels became highly correlated with each other and simultaneously less correlated with the remaining channels on the MEA. The affected channels were electrically floating, thus recording electrical noise instead of neural activity. We tried to identify the root cause by testing different cables and front-end amplifiers, and ultimately determined that the pedestal or MEA was malfunctioning. Specifically, the signals from the Blackrock neural signal simulator were unaffected, indicating a hardware failure upstream of the amplifier. Engineers at Blackrock suggested that this disruption was possibly caused by damage at the pedestal and wire bundle interface. This interface is susceptible to high mechanical stresses and friction from titanium tack downs. The silicone that encapsulates this region degrades over time, consequently exposing the wire bundle to fluid and mechanical stresses. Current theories suggest that because the silicone is water permeable, fluid can penetrate this barrier and create conductive bridges that lead to an increase in the correlation between affected channels [28].
Interestingly, we noticed moisture, that we believed to be serous fluid, on the top of the pedestal during multiple sessions (days 1763 and 1772 post-implantation). Degraded silicone potting may have allowed fluid to creep up the sides of the pedestal and pool on the connector pads. Fluid may also have wicked up patient cable alignment prongs and settled on the pedestal surface. In chronic NHP studies, blood and serous fluid were discovered on the connector pads of the pedestal when material failures occurred (33). Similarly, we observed dried blood on the base of the pedestal at the tissue opening on day 1834 (figure 5(d)). A clinician inspected the pedestal site for open wounds and thoroughly removed fluid from the pedestal. The clinician also cleaned the skin-pedestal interface, removing the dried blood (figure 5(e)). After replacing the O-ring and the pedestal cap, fluid pooling was no longer observed. No additional dried blood was observed for the remainder of the study. The participant mentioned a minor head impact he had experienced during travel the week prior, so the dried blood may be unrelated to the identified disruption and instead associated with a physical trauma. However, the participant and their caregivers did not notice any signs of injury or bleeding following the head impact.
Because this issue affected implanted hardware and is irreversible without surgical intervention, this case resulted in permanent signal corruption on three recording channels. Monitoring correlation amongst channels is one method to reveal this type of disruption. To remediate the effects of this disruption, damaged channels should be excluded from the decoder models.
4.2.3. Front-end amplifier pin bent
For around 2.5 months, one of the pins on the front-end amplifier was bent, causing electrical contact misalignment and flatlined recordings from the affected channel. The channel disruption was immediately identified by monitoring channel impedance, though the bent pin was not initially identified as the root cause. Since affected channel signals are flatlined during this type of event, features derived from these channels may negatively impact decoder performance, depending on feature and decoder selection. This type of disruption is more likely to occur in long-term use applications due to repetitive connection and disconnection events.
This case resulted in complete signal loss on the affected channel, but mechanical repairs were sufficient to restore the signal. This type of issue can be permanently resolved by replacing or fixing the front-end amplifier. However, if the root cause cannot be immediately determined or replacement parts are not available, the impacted channels should be excluded from the decoder.
4.2.4. Pedestal electrode pad damage
In this case, the pedestal electrode pad was scratched by a technician during patient cable connection. This mistake damaged multiple electrode pads and shorted two channels with an electrode pad fragment. The damage was not identified for several sessions. Upon identification, the electrode pad fragment and small particulates were removed. This disruption was subtle because the signals from the shorted channels were combined and remained within typical ranges of most signal metrics. Later, we performed a retrospective analysis that revealed a nearly perfect positive correlation between the two channels, supporting that an electrical short had occurred. Fortunately, the ground and reference electrode pads were not damaged, as this could have led to permanent device failure. Similar failure modes have been reported in NHP studies [28].
Pedestal electrode pad damage can result in permanent signal disruptions since electrode pads are irreplaceable. Fortunately, in this case, the damage was reversible. After cleaning and particulate removal, the electrode shorting signal disruption was corrected. However, this type of disruption, if more severe, could result in a malfunctional pedestal, in which case pedestal removal and MEA explantation may be necessary. Monitoring of channel correlation is a good approach for detecting shorts between channels, which may be difficult to detect via other metrics. Rapid identification would expedite repairs, mitigating the opportunity for further damage to weakened or compromised hardware, and reduce the time to resolve signal issues and restore BCI performance. Like the previous case, removal of the affected channels can improve decoder performance. Design improvements to the connector and patient cable alignment prongs can reduce the likelihood of traumatic hardware damage during system setup. However, to completely prevent these types of disruptions, fully implanted neural recording systems are necessary.
4.3. Chronic BCI performance
The combination of biological and material disruptions observed in our study affected signal stability at both acute and chronic timescales. Acute disruptions rapidly change signal characteristics and neural features which can impair neural decoding performance. For instance, we observed substantial day-to-day variability in the number of identified units and resting firing rate (figures 4(b) and (e)), consistent with previous NHP and human studies [48, 64, 65]. Variability in the number of identified units influences traditional decoder features (e.g. threshold crossings) and can decrease decoding performance. MWP may be more robust against this disruption because it captures a population response from a wider recording region by leveraging subthreshold multiunit activity. Other acute disruptions such as connection failures or hardware malfunctions fundamentally change recorded signals and decrease information transfer from the array. Disruptions such at these may require specialized signal preprocessing or decoding techniques to recover BCI performance.
Chronic MEAs also suffer material degradation that attenuate signals and may limit functionality. Despite the chronic decline in multiple neural signal metrics (figures 3(a) and 4) that suggest array deterioration, the study participant was able to sustain high BCI performance (>83%) throughout this 5 year study (figure 8). Though there were many types of significant disruptions during the study, decoder performance remained accurate, supporting the use of advanced neural features such as MWP. Many signal disruptions become increasingly problematic when predictive models are used across days since disruptions may appear that are not in the model's training set. The decoders used here were retrained de novo each day using only data from that day, which can help counteract disruptions. Additionally, many of the disruptions described here had minor signal effects that only affected a few channels. Optimal selection of neural features and predictive models is critical for combating the effects of signal disruptions on BCI performance.
4.4. Future directions
As intracortical BCI research advances, more devices will be deployed for at-home use [66, 67]. Identifying the types of disruptions that can be anticipated and understanding how they are expressed in the data is essential for these devices to operate optimally outside of the lab. In comparison to existing lab-based systems, at-home systems will encounter several additional challenges that may disrupt optimal performance. Rapid, automated identification of disruptions without the presence of trained technicians is critical for stable, long-term use. Without a method for real-time signal quality monitoring, disruptions may go undetected, and BCI performance can suffer substantially. We have identified many of the disruptions that occurred in our 5 year clinical study and associated the events to representative neural metrics. We plan to leverage this dataset in a future study to develop a framework that detects disruptions during BCI use and can notify the user, caregivers, medical team, and technicians, or automatically adjust decoding parameters as needed. Linking this dataset to signal evaluation tools, such as statistical process control [68], will enable real-time signal quality monitoring and detect outliers associated with mild to severe disruption. Improvements in hardware will hopefully reduce the occurrence of some of the disruptions that we encountered, although they may introduce new types of disruptions as well. However, the timeline for algorithmic advances regarding BCI technology is typically shorter than with hardware developments. Algorithm advancements to address signal disruptions is the logical step to making an immediate impact on BCI performance and expanding the technology to deployable home-use devices in the near-term.
4.5. Study limitations
The case studies reported in this study do not systematically appraise this technology in humans. The dataset presented here is representative of one study participant. We do, however, compare our chronic results to other human intracortical BCI studies. Additionally, we cannot be certain of the etiology of disruptions acting on concealed hardware components. Root cause classifications were based on evidence in the literature, signal characteristics, timeline of events, and consultation with Blackrock Microsystems. Without device explantation, we can only hypothesize about the material and mechanical state of the array, wire bundle, and pedestal.
5. Conclusion
Our data demonstrates intracortical BCI operation with a Utah MEA beyond 5 years post-implantation in a human subject, which has positive implications for the potential use of this technology as an assistive device. A long-term goal for MEA-BCI research is to deploy systems that can improve the daily lives of individuals suffering from neurological disorders. Widespread adoption will require these systems be robust enough to maintain stable, long-term performance despite the wide range of unpredictable disruptors encountered during daily use. A thorough characterization of the signal disruptions encountered during chronic use of MEAs implanted in humans will inform future directions for hardware and algorithm development. This study provides real-world examples to assist engineers and researchers with developing novel methods to detect and predict failure modes during chronic MEA use, which will be critical as BCI technology progresses towards clinical usage. Our work helps to fill the gap in knowledge around long-term MEA performance in humans and provides longevity and efficacy data points to help characterize the performance of implantable neural sensors in a human population.
Acknowledgments
The authors would like to thank the study participant for his contributions and exceptional dedication to the clinical study. We would also like to acknowledge Dr Eric Meyers, Dr Justin Sanchez, and members of the Blackrock Microsystems team for reviewing the manuscript. Financial support for this study came from Battelle Memorial Institute, The Ohio State University Department of Physical Medicine and Rehabilitation, and the Defense Advanced Research Projects Agency (Grant Number HR00111990043).
Data availability statement
The data generated and/or analyzed during the current study are not publicly available for legal/ethical reasons but are available from the corresponding author on reasonable request.