

Abstract
Objective. To compare neurological and functional outcomes between two groups of hospitalised patients with subacute tetraplegia. Approach. Seven patients received 20 sessions of brain computer interface (BCI) controlled functional electrical stimulation (FES) while five patients received the same number of sessions of passive FES for both hands. The neurological assessment measures were event related desynchronization (ERD) during movement attempt, Somatosensory evoked potential (SSEP) of the ulnar and median nerve; assessment of hand function involved the range of motion (ROM) of wrist and manual muscle test. Main results. Patients in both groups initially had intense ERD during movement attempt that was not restricted to the sensory-motor cortex. Following the treatment, ERD cortical activity restored towards the activity in able-bodied people in BCI-FES group only, remaining wide-spread in FES group. Likewise, SSEP returned in 3 patients in BCI-FES group, having no changes in FES group. The ROM of the wrist improved in both groups. Muscle strength significantly improved for both hands in BCI-FES group. For FES group, a significant improvement was noticed for right hand flexor muscles only. Significance. Combined BCI-FES therapy results in better neurological recovery and better improvement of muscle strength than FES alone. For spinal cord injured patients, BCI-FES should be considered as a therapeutic tool rather than solely a long-term assistive device for the restoration of a lost function.
Export citation and abstract BibTeX RIS

Original content from this work may be used under the terms of the Creative Commons Attribution 3.0 licence. Any further distribution of this work must maintain attribution to the author(s) and the title of the work, journal citation and DOI.
1. Introduction
Brain computer interface (BCI) systems have the capability of using brain activity to control an external device or to train users to voluntary modulate the activity of their brain. Motor imagery (MI) based BCI in combination with functional electrical stimulation (FES) is an application which serves both purposes; MI is used as a strategy to control an external device (FES) and at the same time it activates the sensory-motor cortex, the activity of which might be affected by various neurological conditions. BCIs controlled FES has two main applications for neurologically injured patients: to restore the lost function as an assistive device for a long term use (Pfurtscheller et al 2003) or to improve a partially preserved function. In the latter case, BCI-FES is used as a rehabilitative device on a short-term basis (Fei et al 2008, Daly et al 2009, Tan et al 2011, Tam et al 2011, Li et al 2014, Mukaino et al 2014, Young et al 2014).
The electrical stimulation of muscles through FES simultaneously activates sensory and motor pathways; the evidences of the therapeutic effect of FES involve both functional and neurological recovery (Gater et al 2011, Knutson et al 2015, Lai et al 2016). Likewise, there are evidences that MI promotes neurological and functional recovery in stroke patients (Page et al 2007, 2009). It is believed that the main advantages of rehabilitation based on BCI-FES over FES or BCI alone, is that it relies on patient's active intention to move and it simultaneously activates sensory and motor pathways, thus promoting neuroplasticity based on associative, Hebbian learning (Hebb 1949). Experiments on able-bodied people showed that motor evoked potential is enhanced more when grasp function was guided by BCI-FES than when it was guided by either BCI or FES alone (McGie et al 2015). In a recent study by our group (Reynolds et al 2015) we compared event-related desynchronization (Pfurtscheller and Lopes da Silva 1999) in three experimental paradigms: passive FES, motor imagery (MI) until FES activation and motor imagery throughout FES, showing strongest desynchronisation for a combined MI and FES action.
Most publications advocating BCI-FES for rehabilitation purpose are case studies on stroke patients (Fei et al 2008, Daly et al 2009, Tan et al 2011, Tam et al 2011, Mukaino et al 2014, Young et al 2014). Larger studies or studies including other groups of patients are rare and only recently a BCI-FES study on stroke patients has been published including a control and a treatment group (Li et al 2014). Li et al study demonstrated that compared to patients receiving FES alone, patients receiving BCI-FES achieved better functional and neurological recovery. Another randomised controlled trial on stroke patients (Kim et al 2015) showed better functional improvement in patients receiving BCI-FES as compared to patients receiving FES only. However, they did not present brain activity pre and post therapy, thus lacking the evidence of neurological recovery. Also recently, our group showed the feasibility of BCI-FES therapy on two sub-acute spinal cord injured patients. In that study we showed that BCI-FES could be repeatedly therapeutically used in incomplete tetraplegic patients in a hospital setting (Vučković et al 2015) but we did not measure the effect of the therapy. In the current pilot study, we present the neurological and functional outcomes of a treatment by measuring the range of motion (ROM), muscle strength, the intensity of event-related synchronisation/desynchronisation and somato-sensory evoked potential (SSEP). We compare outcomes between the group of patients receiving 20 sessions of BCI-FES hand therapy with a control group receiving the same number of therapy sessions with passive FES.
2. Materials and methods
2.1. Patients
Twelve subacute patients with tetraplegia (12 male, 51.7 ± 18.4; min 20, max 75) participated in the study. All patients were three months or less post-injury, therefore they were still at a hospital and were receiving a daily standard hand therapy in addition to the experimental therapy (table 1). All patients had incomplete injury, ASIA B or C. This means that they had a partially preserved sensation but no preserved movement (ASIA B) or had partially preserved both sensation and movement (ASIA C) (Marino et al 2003). Their level of injury was cervical, C4–C7 affecting both arms/hands and legs. The semi-random order of recruitment was created in advance assigning patients to one or the other treatment group, due to the small number of patients. The study has been approved by the National Healthcare Service Regional Ethical Committee. This study is a registered clinical trial NCT01852279.
Table 1. Information about patients. First 7 patients received BCI-FES therapy, last 5 received FES.
| Ps | Injury level | ASIA | Age |
|---|---|---|---|
| 1 | C6 | C | 70 |
| 2 | C4 | B | 25 |
| 3 | C6 | B | 32 |
| 4 | C5 | C | 20 |
| 5 | C6 | C | 74 |
| 6 | C5 | B | 51 |
| 7 | C6/7 | C | 61 |
| 8 | C5 | C | 36 |
| 9 | C5/6 | C | 61 |
| 10 | C6 | C | 75 |
| 11 | C4 | B | 51 |
| 12 | C6 | C | 64 |
2.2. Initial and final assessments
The study consisted of three phases: initial assessment, treatment/therapy sessions and final assessment. The initial and final assessments consisted of identical tests. The tests were divided into neurological and functional. The neurological tests comprised cue-based movement attempts (MA) which involved electroencephalography (EEG) recording during the attempted movements of the left and right hand and the SSEP of the median and ulnar nerves of both hands (i.e. 4 nerves were tested per patient). A functional assessment consisted of the measurement of the ROM of the left and right wrist and of the Oxford Manual Muscle Test MMT, (Porter 2013) of the hand, arm and shoulder muscles. In order to minimise patients' discomfort functional and neurological assessments were performed on different days.
2.2.1. Cue-based movement attempt
A standard cue-based paradigm was implemented with rtsBCI, a part of the open source Biosig toolbox (Vidaurre et al 2011), implemented under Simulink, MATLAB. Patients sited in their wheelchairs approximately 1.5 m from a computer screen. A trial started at t = −3 s and ended at t = 3 s. At t = −1 s a warning cue (a cross) was presented at the screen, followed by an execution cue (an arrow) at t = 0 s. The warning cue stayed on the screen till t = 3 s, and thereafter the screen stayed blank for a random period which was between 1 and 3 s before the next trial began. The total time between two trials was random, between 7 and 9 s. There were two types of arrows i.e. execution cues, an arrow pointing to the right for MA of the right hand and to the left for the MA of the left hand. Patients were instructed to attempt waving their hand continuously from t = 0 s till t = 3 s, i.e. while they saw a cross on the screen. Note that unlike able-bodied persons, paralysed people can differentiate between the imagination of movement, a movement attempt, and an overt (executed) movement. We considered MA being more appropriate task than the imagination of movement, because the aim of the study was the restoration of voluntary hand movement. There were 120 trials (60 for the right and 60 for the left hand) divided in 4 runs each consisting of 30 trials (15 for each hand).
During this task patients' multichannel EEG was measured with 48 electrodes placed according to 10/10 system (Jurcak et al 2007) using usbamp device (Guger technologies, Austria). Electrodes covered the central region of the sensory-motor cortex, the parietal cortex and sparsely covered the frontal and occipito-temporal cortices. Forty seven electrodes were used to record EEG while one electrode was placed at the lateral cantus of the orbicularis oculi of the right eye to record electrooculogram (EOG). EEG was recorded with the sampling frequency of 256 samples s–1 with respect to the linked-ear reference. Impedance was initially set and later kept under 5 kΩ, occasionally checking its values on a graphical user interface of a usbamp proprietary Simulink block in between experimental sub-sessions. A ground electrode was placed at the electrode location AFz. EEG signal was filtered on-line between 0.5 and 60 Hz and was notch filtered at 50 Hz using the IIR digital Butterworth filter built into a modular amplifier.
2.2.2. Off-line analysis of EEG during movement attempt
Continuous data were split into 6 s long trials, starting at t = −3 s and ending at t = 3 s, with respect to an execution cue. Datasets of each patient were decomposed into independent components (IC) (Hyvarinen and Oja 2000) using 'Infomax' algorithm implemented in EEGlab (Delorme and Makeig 2004) under Matlab. IC transformation provides IC components and a transformation matrix. The components were visually inspected and components corresponding to instrumental and biological interferences (line noise, EOG, EMG and ECG) were removed by setting their value to 0, through EEGLab graphical user interface. On average 5–10 components were removed. Following this, signal was back projected from IC into EEG domain by multiplying new IC matrix with the inverse of the transformation matrix. A common average reference was computed for all channels.
Time-frequency analysis was performed in EEGlab based on event-related spectral perturbation (Makeig 1993), the extension of event-related synchronisation/desynchronisation (ERD/ERS) analysis (Pfurtscheller and Lopes da Silva 1999). The baseline period was selected from t = −2 s till t = −1 s. The Morlet wavelet transform was used to perform a time frequency analysis in 3–60 Hz, with a Hanning-tapered window applied; the number of cycles was set to 3 at the lowest frequency.
An average ERD/ERS across patients was calculated in EEGlab. This was used to create the average ERD/ERS scalp maps for a chosen frequency band and time window. A statistical non-parametric method with Holm's correction for multiple comparisons (Holms 1979) was used to test for statistically significant differences between ERD/ERS scalp maps before and after treatments of patients within a group, with a significance level set to p = 0.05.
2.2.3. Somato-sensory evoked potential
A SSEP is the response of the central nervous system to an electrical stimulation (Gugino and Chabot 1990, Cruccu et al 2008). The SSEP may infer motor functions on the assumption that an injury severe enough to damage the sensory pathways may also affect the motor pathways. The purpose of SSEP analysis was to detect the latency and the amplitude of the N20 peak that occurs around 20 ms following the electrical stimulation of the upper limbs. The peak has a highly repeatable latency in able-bodied people. The increased delay of N20 is an indicator of the damage of the neural pathways, resulting in axon demyelination. The demyelination in turn causes the reduced propagation velocity of action potentials along the axon, manifested as the increased latency of N20 peak. In more severe cases, when some nerve fibres are severely damaged, the amplitude of N20 is reduced or completely absent (Curt and Dietz 1999). The recovery of the neural pathways, followed by re-myelination, may result in the re-appearance of N20 and in a reduced N20 latency.
In the current study SSEP was measured for the left and right median and ulnar nerves, as these two nerves share innervation of the wrist and fingers. Electrodes were attached on the surface of the skin above the corresponding nerves at the wrist. The nerves were stimulated one at the time using a short pulse electrical stimulation (Model DS7, Digitimer, UK). A stimulation intensity was set so that a small visible twitch could be observed at the thumb for the median nerve and at the little finger for the ulnar nerve. For each nerve, electrical stimulation was delivered 250 times with a frequency of 3 Hz. SSEP of the right hand median and ulnar nerve was measured at electrode location CP3 and of the left hand nerves at the electrode location CP4. EEG was recorded with usbamp, with a sample rate 4800 Hz. The EEG signal was band pass filtered between 2 and 2000 Hz and notch filtered at 50 Hz; individual responses were averaged with respect to the onset of stimulation.
2.2.4. Measurement of the ROM of the wrist
In patients with incomplete tetraplegia who have partially preserved control of movement, the ROM is reduced, as compared to the able-bodied people. The ROM of the right and the left hand wrist, during extension and flexion was measured using a Zebris system (Zebris Medical GmbH, Germany) which measures the travel time of ultrasonic pulses. The pulses are emitted by three stationary transmitters and are recorded by small markers which are ultrasound microphones attached to the hand. The Zebris system markers were placed on the following bony landmarks on the subject's hand: the radius (marker 1), carpometacarpal joint (marker 2) and the carpometacarpal bone (of the index finger or the thumb, marker 3). The ROM was calculated as an angle between the intersecting imaginary lines formed between markers 2–3 and markers 1–2.
2.2.5. Manual muscle test
The original test has 6 grades, ranging from 0 to 5. The score of 0 equals no contractions in the muscle, 5 equals the ability to hold test position against strong pressure. We used the extended version with subgrades: 0, −1, 1, 1+, −2...5 (Freze et al 1987 adapted) which were converted into integer numbers 0, 1.2, 3....14 for the purpose of a statistical analysis. Due to the nature of the injury, patients initially had better preserved the voluntary control of muscles in the shoulders and upper arms (MMT = 3 to 4, i.e. (3) can move against gravity and (4) can also withstand moderate resistance) than of the forearm, wrist and hand. The initial MMT of most of the forearm/hand muscles was between 0 and 2 (MMT = 2 moves through the ROM through a horizontal plane, i.e. cannot resist gravity). Muscles included in the analysis were muscles tested as the part of a regular clinical practice at the hospital. From the reason of low functionality of hands, we did not test the activities of daily living, as they would be typically tested in e.g. stroke patients. While each muscle has been tested individually, because of the small number of participants, we grouped muscles according to their function, thereby getting larger numbers for statistical analysis. We tested muscles controlling the shoulder, upper arm, forearm/wrist, hand extensor and hand flexor muscles, although we expected that treatment would primarily influence wrist and hand/finger muscles. Muscles were grouped as follows: muscles controlling shoulder (latissimus dorsi, pectoralis major, serratus anterior and deltoid), upper arm muscles (triceps, biceps), lower arm muscles controlling flexion, supination and pronation (supinator, pronator, brachioradialis), extensor muscles of fingers and wrist (extensor digitorum communis, extensor carpi radialis brevis and longus), flexor muscles of fingers and wrist (flexor carpi radialis and flexor digitorum profundis). Nonparametric statistical analyses were performed due to the relatively small number of samples (minimum 10 per group, e.g. 2 muscles in the group of 5 patients). To compare the results of MMT test within a group, a paired Wilcoxon sign rank test was used, while to compare between groups a Wilcoxon rank sum test was applied. Following this, a Holm–Bonifferoni correction for the multiple comparisons was applied. All numerical procedures were performed in Matlab (Mathworks, USA).
2.3. Therapy sessions
Treatment consisted of 20 sessions, organised 3–5 times weekly. Each session lasted approximately one hour, depending on patients' availability. One group of patients received active therapy; they attempted hand movements that were detected by BCI which then activated FES applied to their hand muscles (BCI-FES group). The other group of patients received passive on–off FES therapy (FES group). The FES group got the same amount of stimulation as BCI-FES group but the stimulator was activated automatically, following 10 s on and 10 s off pattern. In both groups, one hand was trained at a time, as that is a standard practice in a conventional therapy.
2.3.1. Off-line cue-based BCI feature extraction and classifier computation
At the start of a therapy session, a quick off-line EEG recording was obtained. The EEG recording consisted of 20 trials of MA for each hand and followed the experimental protocol described in 2.2.1. BCI features were based on time-domain parameters (TDP) (Vidaurre et al 2009). The recorded data was separated for each hand and the data for each hand was further split into baseline (from t = −3 to t = 0 s) and MA (from t = 0 to t = 3 s). The aim was to use the data to classify between the MA and the baseline, for each hand separately. Performing such classification should provide a reasonable initial classification accuracy for the on-line session and reduce the need to record large training data. We previously tested the algorithm on able-bodied people (Osuagwu and Vuckovic 2014), showing that a small training data set of about 20 trials results in an initial classification accuracy between 75% and 100%. Computed classifier parameters were then further updated and refined during an on-line BCI session, as described later in section 2.3.2. in order to improve the online performance.
The time domain features of the separated data were calculated for 7–30 Hz EEG frequency band using equation (1)

where X(t) is a wide-band EEG, t is a current sample, j is a derivative (p = 9), 'var' is a variance operator and 〈.〉 represents a smoothing/averaging operator. The variance operator in this equation acts as a band-power operator since the variance of filtered centred (mean = 0) signal is equal to the band power (Vidaurre et al 2009). The BCI setup showing the computation of TDP is shown in figure 1. The squaring and smoothing, performed over 1 s is the part of a band-power calculation. Following the band-power calculation, the logarithmic transformation of TDP parameters was performed to enforce a normal distributions needed for classifier based on linear discriminant analysis (LDA) (Fukunaga 1990). LDA is a technique used to project data onto a low dimensional space to enable the separation of the data into classes. The classes are separated using a hyperplane that maximizes data separability. LDA can be expressed as

where fc(M, q) denotes an M dimensional feature matrix with q observations of class c (c = 1, 2), A is a transformation and h(f) is a linear discrimination function. The expected value and the measure of scatter for each class in the projection space are obtained from the corresponding values in the original space μc and Σc using transformations


The best line on which to project f is determined by maximising the Fisher's criteria

where the numerator is a between class scatter and the denominator is a within class scatter.
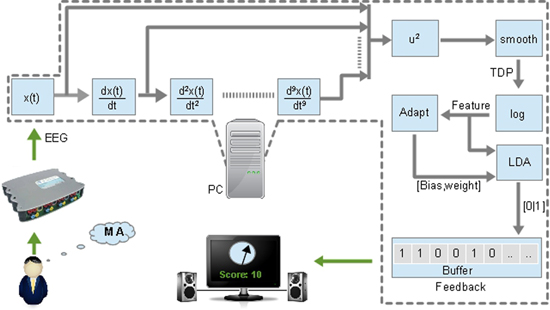
Figure 1. BCI setup showing computation of TDP.
Download figure:
Standard image High-resolution imageThe class of the output h depends on which side of the separation plane it lies. The TDP features were used to compute an initial LDA classifier, which classified between a MA and a baseline for each hand. The initial classifiers were stored and later used as initial values for an online classifier.
2.3.2. On-line BCI based on movement attempt
During a therapy session, a BCI was used on-line with classifiers to discriminate between a hand movement and no movement. To improve the performance of BCI on-line LDA classifier, the mean values of both classes and a within class covariance matrix (equations (3) and (4)) were updated on-line. This was necessary due to the small number of off-line trials. Short off-line training was needed due to a limited availability patients had for the study. Typically patients had 1 h for BCI setup and for training of both hands.
During therapy sessions, patients' EEG was recorded from three pairs of bipolar electrodes, CP3–CF3, CPz–CFz and CP4–CF4, located over the sensory-motor cortex. Bipolar configuration is convenient for supressing the common sources of interferences recorded over both electrodes, such as line noise, EOG or EMG interference. EEG was recorded with usbamp, with a sampling frequency 256 Hz, band-filtered online between 0.5 and 30 Hz (5th order Butterworth filter). The ground electrode was attached to the left ear, monopolar reference to the right ear and the impedance was kept under 5 kΩ.
A difficulty or the threshold of activation of a BCI could be adjusted, so the difficulty could be e.g. increased to reduce a false positive rate or decreased to make the activation easier for a patient who is tired or has a low concentration. The difficulty was adjusted by setting the length of the buffer, i.e. a time sequence containing a classifier output in which a desired class (a left or right hand MA) had to be successfully detected. A classifier made a decision based on the EEG sequence of length b (typically b = 1.5–2 s, while the maximum allowed length was B = 3 s or 768 samples). However, the classifier could make a decision based on a portion period called f. So if a total sequence for a particular training day is b = 2 s, with maximum sequence B = 3 s and f = 75% then difficulty d is 50% (equation (6)). Note that this only affected the length of the buffer containing the outputs of a classifier, and did not in any way affect classifier features or a single outputs of a LDA classifier.

On each therapy session a patient performed 30–40 MA of each hand, separated in sub-sessions, consisting of 20 trials. Each successfully detected movement attempt resulted in the activation of a FES, as described later in the text.
During therapy sessions, a patient sit in front of a computer screen, attempting a movement upon the appearance of a visual cue. The MA was facilitated by a feedback in the form of a gauge (figure 1). Patients were told that during a MA, when a gauge indicator reaches 0, there will be the activation of the set of electrodes attached to their hand muscles in a predefined order. After each trial sub-session, patients got a numerical score (out of 20 trials) on the screen about their performances.
Four bipolar electrodes were attached over the wrist and hand/thumb extensor and flexor muscles. This setup enabled patients to perform a grasp by opening and closing their hand. The electrodes were attached to sequentially stimulate the extensor digitorum, extensor pollicis longus (extensor muscles), flexor digitorum superficialis and flexor policis brevis (flexor muscles). The stimulation of the first two muscles resulted in opening of the hand and four fingers (index finger to pinkie), followed by a thumb abduction; a subsequent stimulation of two flexor muscles resulted in closing of the hand. The whole stimulation sequence, including the opening and closing of a hand, lasted 10 s. The same setup was used for both patient groups. The main difference was that BCI-FES group had to activate FES by attempting to open and close the hand and for FES group stimulator was activated automatically repetitively with 10 s on and 10 s off. A temporal sequence for one MA attempt in BCI-FES group is shown in figure 2.
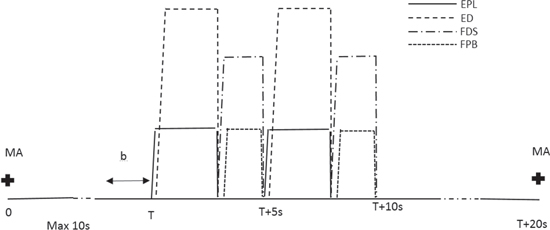
Figure 2. The timing of one trial during a therapy session for BCI-FES group. A motor attempt (MA) started upon the presentation of a cue (a cross) on a computer screen and lasts for maximum 10 s. The initiation of FES stimulation sequence, based on the content of buffer b, of a classification output, started at time T. The FES sequence consisted of a repetitive hand opening and closing in total duration of 10 s, until T + 10 s. The system was silent (cold not be activated) for a semi-random period of time, between 1 and 4 s. Following this, another cue was presented on a computer screen to commence next MA. EPL:Extensor pollicis longus; ED: Extensor digitorum; FDS: Flexor digitorum superficialis; FPB: Felxor policis brevis.
Download figure:
Standard image High-resolution image2.3.3. Functional electrical stimulation
FES was delivered using a multichannel FES device (Rehastim, Hasomed, Germany). The frequency of stimulation was 26 Hz, the pulse width was 200 μs and the current amplitude varied between 15 and 35 mA and was individually chosen for each patient to produce a visible muscle contraction without discomfort.
3. Results
3.1. Attempted movement ERD/ERS
Average ERD/ERS scalp maps during a MA for both groups were created for θ, α, β1 (12–16 Hz) and β2 (16–24 Hz) bands. A difference in scalp maps before and after therapy was calculated for each group. Largest differences were found for BCI-FES group in β1 for both hands (figure 3). Both groups had a strong widespread ERD activity, including frontal and parietal regions, before the therapy. For the left hand, a strong ERD can be noticed not only in the alpha and beta bands but also in the theta band. Although statistically significant differences in BCI-FES group were found in the alpha and lower beta bands only, a spatial shift of ERD towards the central region can be noticed in all frequency bands. It should be mentioned that a correction for multiple comparison was applied, which prevents type I error on each single electrode but does not take into account relations between adjacent electrodes. i.e. changes in the spatial distribution of ERD. The stronger lateralisation of ERD during MA of the left hand, towards the right side of the cortex can be noticed, in particular in the theta and the alpha band. Contrary, in the FES group, ERD remained unchanged following the therapy.
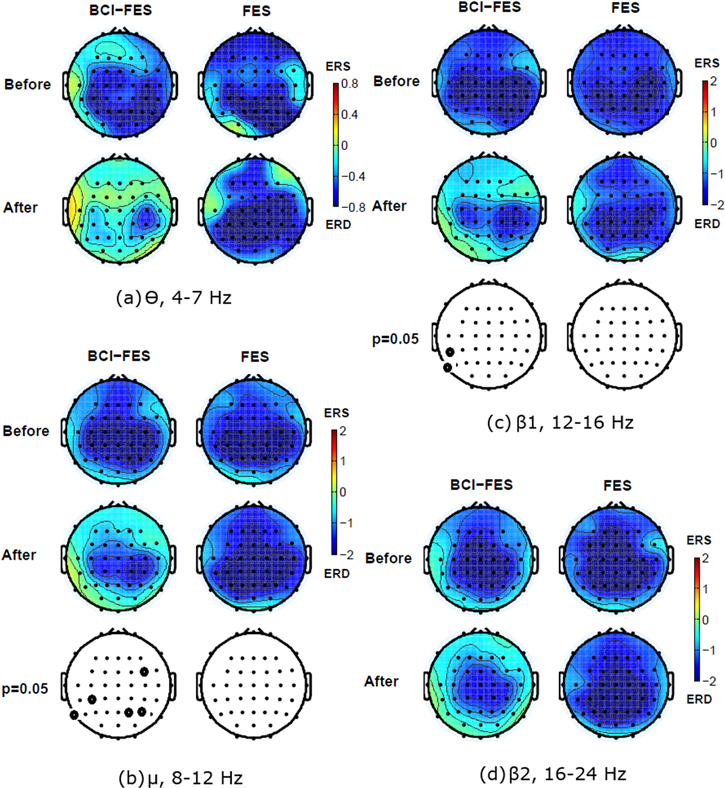
Figure 3. Averaged event-related desynchronization/synchronisation maps (ERD/ERS) for different frequency bands averaged over t = 0.5–2 s, during the movement attempt of the left hand in two patient groups before and after 20 therapy sessions. Electrodes marked in bold show the electrode locations with statistically significant differences between 'before' and 'after' condition. (a) Theta θ band (4–8 Hz), (b) Mu/alpha μ band (8–12 Hz), (c) Beta β1 band (12–16 Hz), (d) Beta β2 band (16–24 Hz).
Download figure:
Standard image High-resolution imageSimilar situation can be observed for the MA of the right hand in BCI-FES group, with statistically significant changes in the theta and lower beta band, the overall shift of ERD towards the central region and a lateralisation to the left side of the cortex (figure 4). The ERD activity remained strong and wide spread following a therapy in FES group.
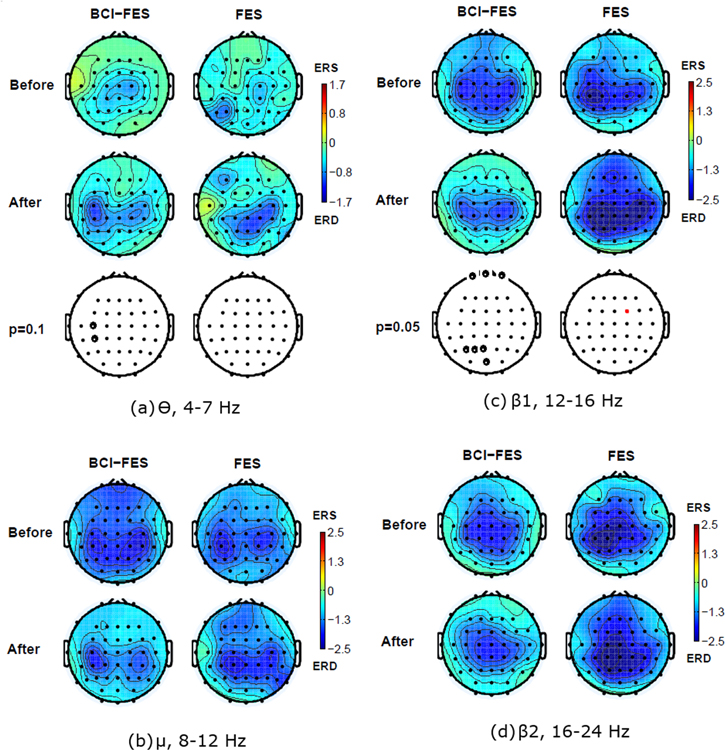
Figure 4. Averaged event-related desynchronization/synchronisation maps (ERD/ERS) for different frequency bands averaged over t = 0.5–2 s, during the movement attempt of the right hand in two patient groups before and after 20 therapy sessions. Electrodes marked in bold show the electrode locations with statistically significant differences between 'before' and 'after' condition. (a) Theta θ band (4–8 Hz), (b) Mu/alpha α band (8–12 Hz), (c) Beta β1 band (12–16 Hz), (d) Beta β2 band (16–24 Hz).
Download figure:
Standard image High-resolution imagePrevious studies indicated that initially, a parietal shift of ERD is due to an injury (figures 3 and 4, both groups, row 'before') and that in patients who functionally recover the activity, the cortical activity shifts back toward the central region (Green et al 1998), as seen in able-bodied people.
In FES group only, a single electrode (CF1) showed a significant ERD increase for the β1 (12–16 Hz) band for the MA of the right hand. No significant changes were noticed in the frontal, parietal or occipital regions.
3.2. Somato-sensory evoked potentials
All seven patients from BCI-FES and four from BCI (one patient missing) were available for this test. Results in table 2 show the number of patients in whom a SSEP response had a visible N20 peak of the medial and ulnar nerve pre- and post-therapy. SCI often results in delayed SSEP responses (Spiess et al 2008). Therefore we were looking into a prominent negativity morphologically similar to N20 in able-bodied people (Cruccu et al 2008) that would occur at around 20 ms or within the following 10 ms.
Table 2. The number of patients who had visible N20 peak in their SSEP pre/post therapy in both patent groups.
| Median | Ulnar | |||||||
|---|---|---|---|---|---|---|---|---|
| Left | Right | Left | Right | |||||
| Before | After | Before | After | Before | After | Before | After | |
| BCI-FES | 4 | 6 | 2 | 5 | 1 | 3 | 1 | 2 |
| FES | 2 | 2 | 1 | 0 | 1 | 1 | 0 | 0 |
In all patients in BCI-FES group who initially had a visible N20, the latency of the peak was reduced post-therapy, indicated the faster propagation of APs due to re-myelination. The average N20 latency over all SSEP of both hands and both nerves was 25.0 ± 3.1 ms pre-therapy and 23.5 ± 2.7 ms post-therapy, indicating neurological recovery. On the contrary, in FES group, N20 latency slightly increased from 23.5 ± 1.6 ms to 23.9 ± 1.9 ms showing no evidences of recovery. Figure 5 shows an example of SSEP peak N20 pre and post therapy in patient 1 (ps1 in table 1) who received BCI-FES therapy. The N20 latency decreased from around 29 ms pre- to 24 ms post-therapy and the amplitude (peak to peak) increased.
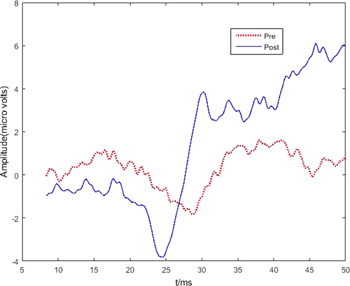
Figure 5. Somato-sensory evoked potential of the left ulnar nerve in ps 1, before (pre) and after (post) 20 therapy sessions. In pre-recording N20 is visible around 29 ms while in post-recording it can be noticed at 24 ms as first and maximum negativity in the SSEP.
Download figure:
Standard image High-resolution image3.3. The ROM
Eight patients were available for both initial and final assessment of the ROM of the wrist: five patients from BCI-FES group and three patients from FES. All patients in both groups, except patient 11 (ps11) from FES group, achieved the increased ROM of both wrists following the therapy (right hand shown in figure 6, left hand in figure 7). Patient 11 had not regained any wrist movement (ROM stayed 0) hence no bar is shown. In this patient, corresponding MMT scores were zero. Numerical values of ROM before and after therapy, expressed as angles in degrees, are shown separately for flexion (figures 5(a) and 6(a)) and extension (figures 5(b) and 6(b)). For BCI-FES group, a median ROM for the right hand (flexion & extension) increased from 9.9° pre- to 25.2° post-therapy while for the left hand it increased from 6.7° to 23.5°. For FES group, a median ROM for the right hand increased from 19.4° pre- to 37.8° post-therapy while for the left hand ROM it slightly increased from 24.4° to 27.8°. It was not possible to perform a statistical analysis due to the small number of participants (not all participants took part in this test).
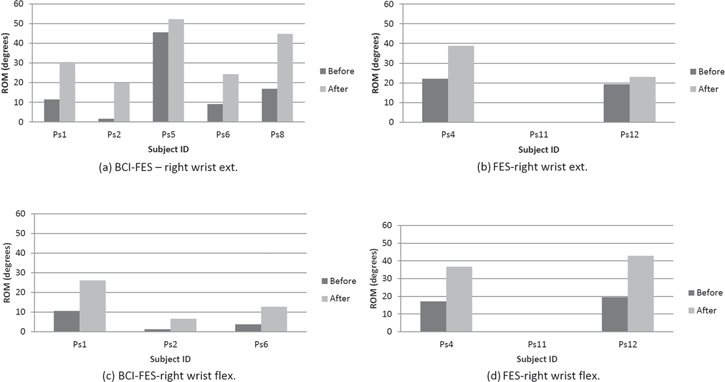
Figure 6. The range of motion during right hand wrist extension (upper row, (a) and (b)) and flexion (lower row, (c) and (d)) of the right hand wrist before and after therapy for each single patient in both groups.
Download figure:
Standard image High-resolution image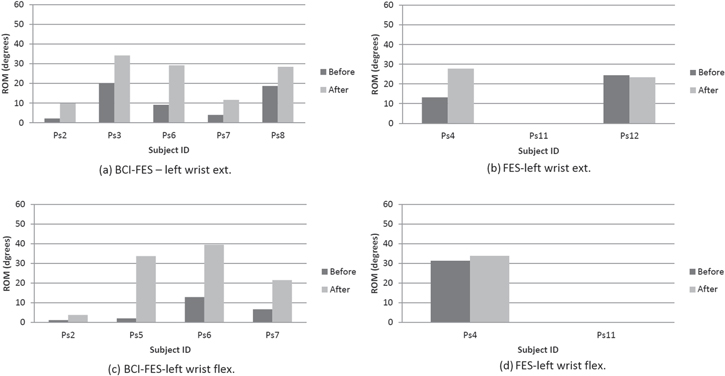
Figure 7. The range of motion during left hand wrist extension (upper row, (a) and (b)) and flexion (lower row, (c) and (d)) of the right hand wrist before and after therapy for each single patient in both groups.
Download figure:
Standard image High-resolution image
3.4. Manual muscle test
The strength of muscles was tested before and after a therapy for 14 different muscles in all 12 participants. Muscles have been grouped for a statistical analysis into five groups: muscles controlling shoulder, muscles of the upper arm, muscles controlling lower arm and muscles located in the lower arm controlling wrist/hand flexion and extension.
A Wilcoxon rank sum test showed no statistically significant difference in MMT scores before the therapy between BCI-FES and FES groups for any of the muscle groups (right shoulder p = 0.7189, right upper arm p = 0.0997, right forearm p = 0.4928, right wrist/fingers extension p = 0.7460, right wrist/finger flexion p = 0.2902, left hand shoulder p = 0.7433, left hand upper arm p = 0.4149, left lower hand p = 0.4060, left wrist/finger extension p = 0.5910, left wrist/finger flexion p = 0.9100).
Following treatment MMT significantly improved in all muscle groups of the right hand in BCI-FES group while FES group improved strength only in shoulder muscles and muscles controlling flexion. For the left hand, in BCI-FES group, MMT scores significantly improved for all muscles groups. On the contrary, for FES group, MMT scores significantly improved for shoulder muscles only (table 3). When Holm–Bonifferoni test for correction for multiple comparisons (5 comparisons per group) was applied, all MMT scores for BCI-FES group remained statistically significant while none of MMT scores for FES showed a statistically significant improvement.
Table 3. Results of a Wilcoxson sign rank test (p values) between MMT scores before and after 20 therapy sessions, averaged over muscles within the same group. 'R' is for the right hand and 'L' is for the left hand. Significance level was p = 0.05.
| Shoulder | Upper arm | Lower arm | Extension | Flexion | |
|---|---|---|---|---|---|
| BCI FES R | 0.00005 | 0.0313 | 0.00038 | 0.00028 | 0.0039 |
| FES R | 0.0104 | 0.0977 | 0.0630 | 0.1335 | 0.0352 |
| BCI-FES L | 0.000023 | 0.0039 | 0.00026 | 0.000.2 | 0.0078 |
| FES L | 0.0184 | 0.1719 | 0.4424 | 0.1968 | 0.1406 |
4. Discussion
This study demonstrates the application of BCI-FES as a rehabilitative device for patient with incomplete tetraplegia. Patients who are still in a hospital post-injury have a very limited time for a BCI-FES therapy (Rupp 2014) because they already receive a standard daily hand therapy. BCI algorithms should therefore have a quick electrode setup and should require the minimum (if any) daily offline adjustment of parameters. We applied a BCI algorithm based on time domain parameters with an on-line adaptation (Vidaurre et al 2009), which allows the brief update of training parameters and requires smaller number of electrodes than what is required for algorithms based on common spatial patterns (16–63 electrodes Fei et al 2008, Li et al 2014). Six EEG electrodes (3 bipolar recordings) used in this study is a comparable number with the number of electrodes required for algorithms based on classical EEG bandpower and features extracted from a specific frequency bands (2–12 electrodes Tam et al 2011, Mukaino et al 2014, Young et al 2014, Vučković et al 2015).
Due to the injury to the spinal cord rather than to the brain, most research groups consider BCI-FES to be an assistive rather than a rehabilitative device for spinal cord injured patients. Our paper however compares the neurological and functional outcome of two hand therapies in incomplete sub-acute tetraplegic patients. A BCI-FES therapy involved active participation of patients, resulting in the combined activation of the efferent and afferent pathways while FES therapy involved a passive stimulation of the sensory-motor pathways. Although the role of a patient in FES therapy is passive, there are evidences that the electrical stimulation of muscles also promotes a functional and neurological recovery (Gater et al 2011). The difference between recoveries of two groups of patients cannot be solely attributed to BCI because the combination of BCI and FES is likely to promote a better recovery than each of these therapies independently. Therefore, ideally, there should be another group receiving a BCI therapy only, but this was not feasible due to the small number of available patients.
Previous BCI-FES rehabilitation studies on stroke patients reported increased ERD, from electrode located over the sensory-motor cortex, following therapy (Li et al 2014, Mukaino et al 2014). In a previously published report on a subset of 4 patients included in this study we noticed the same phenomena (Osuagwu et al 2014). In addition, we noticed the unusual pattern of gamma band ERS in parallel with alpha/beta ERD during MA, in some patients. This confirms the results of previous studies, on patients with complete spinal cord injury (Müller-Putz et al 2007) reporting altered ERS/ERD patterns as compared to able-bodied people.
The novelty of the current study is that rather than analysing ERD at isolated electrodes, we analysed changes of ERD over the whole cortex, presented by scalp maps, which enabled us to recognise the spatial restoration of the cortical activity. Before a therapy, both groups had a strong, wide spread, cortical activity during MA, which spread towards the parietal and frontal cortex. Following the therapy, only BCI-FES group, actively involved in the therapy, restored a centrally located cortical activity during MA. The same trend was noticed across all four analysed frequency bands accompanied with the visible lateralisation of cortical activity following the treatment. Most consistent changes were noticed in the lower beta (12–16 Hz) band for both hands though significant changes in the activity of the parietal cortex were also found in the alpha band for MA of the left hand and in the theta band for MA of the right hand. For FES group, there was no reduction of ERD outside the sensory-motor cortex; significant changes in ERD were found for MA of the right hand in the lower beta band at electrode location CF1 only.
BCI-FES studies in stroke patients which rely on measurement of movement-related cortical potentials (MRCP) advocate the importance of precise matching of efferent and afferent stimulus to promote recovery through a Hebbian type learning mechanism (Mrachacz-Kersting et al 2012, 2016). In a study by Mrachacz-Kersting et al (2016) only patients receiving a single pulse stimulus precisely matched with the maximum negativity of MRCP improved their speed of walking. Interestingly, although patients practiced isolated ballistic foot dorsiflexion it translated to the improvement of walking. In our study, there was no precise matching between MA and FES, yet neurological recovery translated, to some extent, to a functional recovery. We hypothesise that in our case, MA mediated neuromodulation pre-conditioned the sensory-motor cortex activity. This potentially amplified the effect of a subsequent FES. In addition, patients were instructed to carry on with MA during FES. It is of interest that it seemed less relevant to match MA motor task (hand waving) with grasp sequence produced by FES, probably because both waving and grasp activate the motor cortex of hand.
It has been documented in literature that following spinal cord injury, the cortex undergoes reorganisation both early post injury and in a later chronic phase. Stronger cortical activity in parietal regions following injury, that shifts towards the central region upon recovery, as seen in BCI-FES group, has been previously reported in patients with spinal cord injury, where the restoration of cortical activity was related to a functional recovery (Green et al 1998). This result is further supported by a fMRI single case study (Mukaino et al 2014) which showed an initial diffuse blood oxygenation level and the lateralisation of this activity following BCI-FES training.
SSEP was not assessed in BCI-FES studies in stroke patients probably because they have injury to the brain so assessing the integrity of neural pathways was less relevant. In SCI patients however, this is the useful additional indicator of recovery. Although it measures the recovery of the sensory pathways in both peripheral and central nervous system, due to the nature of the injury in SCI patients, it is assumed that SSEP mostly measures a recovery in the spinal cord. In BCI-FES patients group, SSEP following recovery showed re-appearance of N20 peak and the reduced latency of the existing peaks. Though this was primarily noticed in BCI-FES group, due to the small number of patients, a statistical comparison between groups was not performed Curt and Dietz (1999). showed a relation between SSEP of the lower limbs and the recovery of walking which should have an equivalent effect in the recovery of the upper limbs.
Improvement in ROM was noticed in both groups, but due to the small number of patients available for ROM test results are inconclusive. This functional assessment is sometimes also used in studies in stroke patients (Kim et al 2015), though they more often use Action Research Arm Test and Fugl-Meyer Assessment of Motor Recovery (Li et al 2014, Kim et al 2015) which assess the activities of daily living. We have not used any test which assesses the activities of daily living because SCI patients in the current study had more severe motor deficits than stroke patients and were not able to perform any of these tasks; therefore an individual muscle strength was measured. MMT is not a straightforward measure as each muscle is tested individually. In this study we analysed the improvement in MMT score of the group of functionally related muscles, due to the small number of participants and because the statistical analysis of each separate muscles is not a good indicator of related functional improvement. While both groups initially had similar MMT scores, a statistically significant improvement was noticed in BCI-FES group for all muscles groups and for both arms/hands. On the contrary, in FES group strength has been improved only in muscles controlling shoulder and in flexor muscles of the right hand. While we expect that both therapies primarily affect the forearm and hand, it is possible that motor activation through MA and a sensory feedback through FES actually have an effect on the wider areas of the sensory-motor cortex, thus indirectly improving the voluntary control of the whole arm.
Neurological recovery normally precedes functional recovery. Patients in this study received 20 therapy sessions and had the last assessment shortly following the last therapy sessions. There are two possible scenarios of a long-term outcome: first one is that FES patients may reach the same level of neurological recovery as BCI-FES patients but after a prolonged period of time. The second one is that BCI-FES group may show an even larger long-term functional recovery than FES group due to a better neurological recovery. It would be necessary to follow up patients for a prolonged period of time (e.g. up to 6 months) to establish whether those who showed better neurological recovery would also achieve better functional recovery. Therefore it would be necessary to organise studies on the larger number of patients to establish a clear correlation between a neurological recovery, as measured by a cortical activity, and a functional recovery. Due to the low incidence of SCI this would require either a long term or a multi-centre trial.
We noticed strong ERD in the theta band in both groups prior to the therapy, which has been subsequently reduced in BCI-FES group only. In our previous study in which we compared ERD spatial cortical maps during imagined movement between spinal cord injured patients with and without chronic central neuropathic pain (Vuckovic et al 2014), we found that patients with pain had strong theta ERD. This type of pain is a secondary consequence of an injury that can occur months or even years after the injury and is related to the overactive cortex and thalamo-cortical dysrhythmia (Sarnthein and Jeanmonod 2008). Thus neurological recovery induced by BCI-FES therapy might potentially prevent secondary consequences of spinal cord injury such as chronic pain and spasticity (Pikov 2002). Although these complications are caused by disuse plasticity in the spinal cord, they also reflect themselves in the cortical activity (Wrigley et al 2009, Vuckovic et al 2014). In the future in would be useful having BCI-FES studies which also involve these symptoms in the outcome measures and follow which percentage of patients in a treatment and a control group, treated early post-injury, develop these symptoms in a chronic stage.
5. Conclusions
This randomised pilot study indicates that BCI-FES therapy of the hand in sub-acute tetraplegic patients has a positive effect on neurological and to some extent on functional recovery. The effect of BCI-FES was larger than the effect of control FES therapy. In summary, the study demonstrates the positive effect of BCI-FES as a neurorehabilitation therapy following spinal cord injury. Larger, possibly multicentre, trials are required to assess the effect of the therapy on functional recovery on a larger number of patients and over a prolonged period of time.
Acknowledgments
This work has been partially funded by EPSRC funded PhD scholarship EP/P505534/1. We would like to thank to Dr Purcell and Dr McLean for their help with recruiting patients and to all patients for participating in the study.