


Abstract
Nitrogen dioxide and ozone are two interrelated oxidative pollutants in the atmosphere. Few studies have evaluated the health effects of combined oxidant capacity (Ox). We investigated the short-term effects of Ox on fractional exhaled nitric oxide (FeNO), a well-established biomarker for airway inflammation, in a group of chronic obstructive pulmonary disease patients. Real-time concentrations of Ox were obtained by calculating directly the sum of nitrogen dioxide and ozone. Linear mixed-effect models were applied to explore the acute effects of Ox on FeNO levels. Short-term exposure to Ox was significantly associated with elevated FeNO. This effect was strongest in the first 24 h after exposure, and was robust to the adjustment of PM2.5. A 10 μg m−3 increase in 24 h average concentrations of Ox was associated with 4.28% (95% confidence interval: 1.19%, 7.37%) increase in FeNO. The effect estimates were statistically significant only among males, elders, and those with body mass index ≥24 kg m−2, a comorbidity, higher educational attainment, or moderate airflow limitation. This analysis demonstrated an independent effect of Ox on respiratory inflammation, and suggested that a single metric Ox might serve as a preferable indicator of atmospheric oxidative capacity in further air pollution epidemiological studies.
Export citation and abstract BibTeX RIS

Original content from this work may be used under the terms of the Creative Commons Attribution 3.0 licence. Any further distribution of this work must maintain attribution to the author(s) and the title of the work, journal citation and DOI.
Introduction
Nitrogen dioxide (NO2) and ozone (O3) are commonly known as oxidative and irritant atmospheric pollutants. Previous epidemiological studies have reported their significant associations with adverse respiratory outcomes (Bell et al 2005, Samoli et al 2006, Chen et al 2012b). The inhalation of NO2 and O3 may lead to airway inflammation and high responsiveness due to their strong oxidizing properties, which mainly contribute to their hazardous effects on the human respiratory system (Dadvand et al 2014).
Epidemiological studies typically evaluated the associations between NO2 or O3 and a health outcome using single-pollutant or bi-pollutant regression models (Chen et al 2012b, Peng et al 2013). However, the explanation of the epidemiological findings was problematic due to the inextricably chemical conjunction between O3 and NOx (=NO + NO2) (Clapp and Jenkin 2001). They can also interchange over a timescale from minutes to days dependent on a number of factors such as photochemical reactions (Ghazali et al 2010). Furthermore, any resultant reduction in NO2 is invariably but not linearly accompanied by an increase in O3 (Clapp and Jenkin 2001). Consequently, the existing epidemiological results of NO2 and O3 were largely limited by the complex collinearity and confounding from each other.
The term 'combined atmospheric oxidant capacity' (Ox) was naturally developed by denoting Ox as the sum of NO2 and O3 because the sum and its oxidizability was largely constant in a certain timescale (Clapp and Jenkin 2001). Few studies have assessed the use of Ox in exploring the association between air pollution and heath endpoints. Only two time-series studies have considered Ox in the associations with daily hospital admissions for respiratory diseases (Chardon et al 2007) and with daily all-cause mortality (Williams et al 2014). However, bias was inevitable in the two investigations because of the ecological nature in design. Besides, it was unknown whether the associations remained when the potentially confounding effects of PM2.5 were controlled. Furthermore, the underlying mechanisms were also not clear about the observed associations of Ox exposure with respiratory hospital admissions and mortality.
We therefore designed a longitudinal panel study to explore the effects of Ox on respiratory inflammation in a group of patients with chronic obstructive pulmonary disease (COPD) in Shanghai, China. Respiratory inflammation was evaluated using fractional exhaled nitric oxide (FeNO), a non-invasive biomarker commonly used in previous studies (Liu et al 2009, 2011, Malerba et al 2014).
Material and methods
Study design
In this study, we initially recruited 30 retired COPD patients from a central urban community (1.9 km2 in area) in Shanghai, China. The inclusion criteria included: (1) doctor-diagnosed COPD based on the results of spirometry; (2) local residents who lived in this Community for at least 3 years; and (3) retirees aged more than 40 years. We excluded those who were currently active or passive smokers (at home); consumed any alcohol; had severe comorbidities or inflammatory diseases; and had received antibiotic treatments during the past month. We further excluded those patients with unstable and severe COPD in this study to reduce the influence of respiratory medication on our results. Subjects who took anti-inflammatory medications during follow-ups would be excluded from final analyses.
From 27th May to 5th July, 2014, we scheduled six repeated follow-ups every week. The subjects were randomly divided into three subgroups and were invited to participate in FeNO examinations on Tuesday, Thursday or Saturday, respectively at the Community Health Service Center. For each patient, examinations were scheduled at the same time (1:30 p.m. to 2:30 p.m.) on the same day of the week to control for potential circadian rhythms and day-of-week variations in FeNO levels (Spanier et al 2008). Self-administered questionnaires were applied to collect individual baseline information including residential address, age, gender, height, weight, educational status, duration of COPD and chronic comorbidities. Spirometry was performed at baseline to assess the severity of airflow limitation in these COPD patients, according to the Global initiative for Chronic Obstructive Lung Disease guidelines (Vestbo et al 2013). These subjects were also asked to record any COPD symptoms and medications, and whether they left the central urban areas of Shanghai during the entire study period. This study was approved by the Institutional Review Board of the School of Public Health, Fudan University. Written consent forms were obtained from all subjects.
FeNO measurements
FeNO levels were measured with a portable NIOX MINO machine (Aerocrine AB, Solna, Sweden) according to the standardized procedures issued by the American Thoracic Society and the European Respiratory Society (Dweik et al 2011). Briefly, subjects were asked to avoid eating and drinking for at least 1 h before examinations. They were instructed to inhale from the machine as fully as they can and then exhale into the machine for 10 s without a break. A visible indicator was shown during exhalation to help subjects maintain a constant flow rate of 50 ml s−1. At last, the results would display automatically after a 90 s interval. The quality control was autonomically performed and it would not display a reading once the subject exhaled below or above the required speed of flow rate.
Environmental data
We obtained the hourly data on NO2 and O3 from a nearby government-controlled monitoring station that was approximately 3 km away from this community. This station was not in the direct vicinity of major air pollution sources including traffic. We calculated Ox as the sum of real-time concentrations on NO2 and O3. In order to allow for the adjustment of potential confounding of other environmental variables, we also collected the hourly concentrations of particulate matter with an aerodynamic diameter less than 2.5 μm (PM2.5) from the same fixed-site station and weather data (mean temperature and mean relative humidity) from a meteorological station that was 5 km away from the community. The concentrations of PM2.5, NO2 and O3 were measured using the methods based on tapered element oscillating microbalance, chemiluminescence and ultraviolet absorption, respectively.
Statistical analysis
Environmental and individual health data were linked by the time of physical examinations. FeNO levels were natural log-transformed before statistical analyses because they were approximately right-skewed distributed.
We applied linear mixed-effect models to examine the associations between air pollutants and FeNO. In the basic model, FeNO was a dependent term, and Ox was introduced as an independent fixed-effect term. Several covariates were also incorporated as fixed-effect terms: (1) an indicator variable for 'week' to adjust for any unknown weekly time trends in FeNO levels; (2) an indicator variable for 'day of the week' to exclude any unknown variations in FeNO levels within a week; (3) mean temperature and relative humidity on the concurrent day to adjust for the confounding effects of meteorological conditions; and (4) individual characteristics, including age, sex, body mass index. We did not further adjust for educational attainment, duration of COPD and prevalence of a chronic comorbidity (hypertension, coronary heart disease, diabetes,) because the model fit statistic was not further improved, characterized by smaller Akaike information criterion (AIC) (Akaike 1973). At last, we included a random intercept for each subject to account for the autocorrelations among repeated FeNO measurements.
To fully explore the time windows for the short-term effects of Ox on FeNO, we evaluated the models using multiple lag periods of Ox exposure preceding FeNO measurements, i.e., single lags of 0–6 h (h), 7–12 h, 13–24 h, 0–24 h (0 d), 25–48 h (1 d) and 49–72 h (2 d). We did not explore lags longer than 72 h because most previous studies found that the short-term effects of air pollution on respiratory outcomes were limited in the first 3 days after exposure (Dominici et al 2006, Williams et al 2014, Chen et al 2015).
To compare the individual effects of NO2 and O3 with combined Ox, we fitted the same models as described above for NO2 and O3, and further evaluated the mode fit based on the AIC statistic (Akaike 1973).
As a sensitivity analysis, we fitted two-pollutant models to evaluate whether the effects of Ox were sensitive to the adjustment of PM2.5, another source of atmospheric oxidative activity.
At last, in order to explore the potential effect modification of individual characteristics, we further performed stratification analyses by sex, age (<65 and ≥65), BMI (<24 and ≥24 kg m−2), educational status (low: illiteracy, primary school and junior middle school; high: senior middle school and above), presence of comorbidities (hypertension, coronary heart disease or diabetes) and severity of COPD (mild and moderate).
Statistical tests were two-sided, and the effects of p-values ≤0.05 were considered to be statistically significant. All analyses were performed in R software (Version 3.1.1, R Foundation for Statistical Computing, Vienna, Austria) with the 'lme4' package. The effect estimates were presented as the percent change and their 95% confidence intervals (95% CI) associated with a 10 μg m−3 increase of air pollutant concentrations.
Results
Descriptive statistics
Two subjects were excluded from the analysis because they took anti-inflammatory medications during follow-ups. The descriptive statistics on individual characteristics of the remaining 28 subjects were shown in a previous publication of this project (Chen et al 2015). According to the results from self-administered questionnaires, they did not go out of the central urban area of Shanghai, have an exacerbation of COPD or take anti-COPD medication during the study period. Based on the results of spirometry at baseline, there were 12 mild and 16 moderate COPD patients.
Table 1 shows the summary statistics of FeNO measurements, 24 h averages of air pollutant concentrations and meteorological variables preceding each follow-up visit. In total, we obtained 168 valid measurements of FeNO. The mean level of FeNO is 24.4 ppb with apparent variations (standard deviation: 23.2 ppb). During the study period, the averaged 24 h mean concentrations for NO2, O3, Ox and PM2.5 are 47.2 μg m−3, 82.4 μg m−3, 129.6 μg m−3 and 56.1 μg m−3, respectively. The daily mean temperature and relative humidity are 23.8 °C and 71.7%, respectively. There are no missing data in our study.
Table 1. Summary statistics of FeNO measurements, 24 h average air pollution levels and meteorological conditions.
| Variables | Mean | SD | Min | P25 | Median | P75 | Max |
|---|---|---|---|---|---|---|---|
| FeNO (ppb) | 24.4 | 23.2 | 5.0 | 12 | 17.0 | 23.0 | 122.0 |
| NO2 (μg m−3) | 47.2 | 13.2 | 28.3 | 36.7 | 42.9 | 59.2 | 70.0 |
| O3 (μg m−3) | 82.4 | 30.4 | 29.9 | 62.5 | 75.9 | 103.7 | 143.5 |
| Ox (μg m−3) | 129.6 | 34.0 | 89.9 | 109.5 | 117.4 | 150.1 | 211.2 |
| PM2.5 (μg m−3) | 56.1 | 30.8 | 11.9 | 35.2 | 47.0 | 61.7 | 147.3 |
| Temperature (°C) | 23.8 | 1.6 | 21.5 | 22.2 | 23.3 | 25.5 | 27.2 |
| Relative humidity (%) | 71.7 | 12.7 | 43.0 | 66.0 | 72.0 | 83.0 | 90.0 |
Abbreviations: SD, standard deviations; FeNO, fractional exhaled nitric oxide; PM2.5, particulate matter with an aerodynamic diameter less than 2.5 μm; NO2, nitrogen dioxide; O3, ozone; Ox = NO2 + O3.
Table 2 shows the spearman correlation coefficients among environmental variables. Generally, the 24 h average concentrations of Ox are more strongly correlated with O3 than with NO2. Ox is moderately positively correlated with PM2.5, moderately positively correlated with temperature and weakly negatively correlated with relative humidity. There were moderate or strong correlations of FeNO (r = 0.44–0.92) among the subgroups with male sex, older age, higher BMI, the prevalence of comorbidity and higher educational status.
Regression results
Table 3 provides the associations between Ox and FeNO using different lag periods. The associations are statistically significant within the first 24 h after exposure with the strongest effects occurring in the sub-period of 13–24 h. Then, the associations attenuate substantially and turn to be non-significant from lag 0 d to 2 d. For example, FeNO increase by 4.28% (95%CI: 1.19%, 7.37%) corresponding to a 10 μg m−3 increase in 24 h average concentrations of Ox.
Table 3. Percent changes in FeNO (mean and 95% confidence interval) associated with a 10 μg m−3 increase in Ox using different lag structures, with or without adjustment of PM2.5.
| Lag structure | Without adjustment | Adjustment |
|---|---|---|
| 0–6 h | 2.51 (−0.30, 5.32) | 3.74 (0.84, 6.64)a |
| 7–12 h | 2.86 (−0.39, 6.11) | 4.00 (0.38, 7.64)a |
| 13–24 h | 3.09 (0.72, 5.46)a | 2.76 (0.29, 5.23)a |
| 0 d | 4.28 (1.19, 7.37)a | 4.27 (1.16, 7.39)a |
| 1 d | 2.44 (−0.52, 5.42) | 3.19 (−3.02, 9.44) |
| 2 d | −1.50 (−6.23, 3.25) | −1.51 (−6.84, 3.84) |
Abbreviations: FeNO, fractional exhaled nitric oxide; PM2.5, particulate matter with an aerodynamic diameter less than 2.5 μm; Ox = NO2 + O3. ap < 0.05.
Table 3 also shows the results of sensitivity analyses after adjusting for PM2.5. In comparison with the unadjusted results, the adjusted estimate increases and turned to be statistically significant within the first 12 h after exposure; it is quite similar using the 24 h averaged exposure; it remains non-significant on lag 1 or 2 days.
The effects of O3 and NO2 are not statistically significant at almost all lags using single-pollutant models, but increase substantially and become significant in the first 24 h when adjusting for each other (table 4). The AIC values obtained in single-pollutant models with Ox is smaller than with NO2 and O3 (i.e., 139.6 versus 143.4 and 143.4, respectively, for 24 h averages). The values are also obviously lower than those obtained in two-pollutant models with NO2 and O3.
Table 4. Percent changes in FeNO (mean and 95% confidence interval) associated with a 10 μg m−3 increase in O3 and NO2 in single- or two- pollutant models.
| O3 | NO2 | |||
|---|---|---|---|---|
| Lag | — | +NO2 | — | +O3 |
| 0–6 h | 2.38 (−1.81, 6.60) | 0.40 (−4.29, 5.11) | 6.16 (0.34, 12.02)a | 5.89 (−0.78, 12.60) |
| 7–12 h | 1.00 (−1.21, 3.22) | 4.88 (1.05, 8.73)a | 1.39 (−3.48, 6.28) | 10.30 (1.86, 18.81)a |
| 13–24 h | 1.78 (−0.16, 3.73) | 4.55 (1.91, 7.19)a | 2.00 (−4.18, 8.21) | 12.10 (3.85, 20.41)a |
| 25–48 h | 2.70 (−0.89, 6.30) | 2.24 (−1.60, 6.09) | 5.08 (−3.7, 13.95) | 3.19 (−6.13, 12.60) |
| 49–72 h | −2.14 (−7.32, 3.07) | −2.21 (−7.67, 3.27) | 0.47 (−5.80, 6.78) | −0.31 (−6.87, 6.30) |
| 0 d | 2.69 (−0.15, 5.54) | 4.38 (1.31, 7.45)a | 4.56 (−2.58, 11.76) | 9.40 (1.78, 17.08)a |
| 0–1 d | 2.90 (−0.41, 6.22) | 3.46 (0.15, 6.78)a | 7.10 (−2.44, 16.73) | 8.88 (−0.60, 18.46) |
| 0–2 d | 5.80 (−0.38, 12.03) | 5.18 (−1.47, 11.87) | 5.83 (−4.34, 16.11) | 2.84 (−7.90, 13.70) |
Abbreviations: FeNO, fractional exhaled nitric oxide; NO2, nitrogen dioxide; O3, ozone. aP < 0.05.
Figure 1 illustrates the effects of 24 h average Ox on FeNO levels in different subgroups. The effect estimates were statistically significant only among males, elders, and those with body mass index ≥24 kg m−2, a comorbidity, higher educational attainment, or moderate airflow limitation.
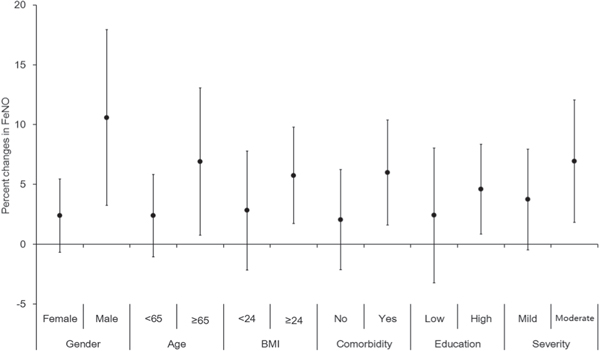
Figure 1. Percent changes in FeNO (mean and 95% confident interval) associated with a 10 μg m−3 increase in the 24 h average concentrations of Ox, stratified by gender, age, BMI, comorbidity, educational status and severity of airflow limitation. The X-axis refers to the categorization; the Y-axis refers to the percent changes in FeNO. Abbreviations: FeNO, fractional exhaled nitric oxide; BMI, body mass index.
Download figure:
Standard image High-resolution image
Discussion
In this panel study among COPD patients, we found significant evidence of positive associations between short-term exposure to Ox and increased levels of FeNO in Shanghai, China. This effect was strongest in the first 24 h after exposure, and robust to the adjustment of PM2.5. Furthermore, males, elders, and those with body mass index ≥24 kg m−2, a comorbidity, higher educational attainment, or moderate airflow limitation were more susceptible. To our best knowledge, this analysis was the first epidemiological study to investigate the impact of combined atmospheric oxidant capacity on FeNO, a well-established indicator of respiratory inflammation.
Oxidative stress was believed to be one of the main pathways through which air pollutants affect human health (Brook et al 2010). Oxidative activity of air pollutants can lead to the generation of reactive oxygen species upon the interaction with epithelial cells and macrophages, resulting in systematic inflammatory responses and oxidative injuries. NO2 and O3 were both key oxidative gaseous pollutants. Their strong chemical interrelationship that vary in direction and magnitude by different spatial-temporal scales made it difficult to separate their individual effects (Williams et al 2014). Ox is thus introduced in atmospheric chemistry to represent the combined oxidative capacity of NO2 and O3. It has the advantage of characterizing well the combined oxidative stress on the exposed population from simultaneous exposure to the two pollutants. This seems to be supported by our findings that the use of Ox could generate stronger or more precise risk estimates as well as better model fit than O3 or NO2.
Another support for the use of Ox as a single metric for airborne oxidative capacity may originate from the problems associated with single- or two- pollutant models. A number of previous studies have found the significant associations between short-term exposure to photochemical pollutants (NO2 and O3) and respiratory outcomes, but only a few of them considered NO2 and O3 jointly (Saez et al 2002, Gryparis et al 2004, Samoli et al 2006). We reported larger increases in both risk estimates when the two pollutants were assessed simultaneously in bi-pollutant models than in single-pollutant models. The larger effect estimates was consistent with a previous investigation based on daily mortality (Williams et al 2014). However, interpretation of the results from two-pollutant models was problematic because of the different magnitude of exposure measurement errors and uncertain linear assumptions about the concentration-response functions (Kim et al 2007, Baxter et al 2010). Besides, double-counting in risk estimates may also occur when evaluating NO2 and O3 separately or jointly.
Atmospheric oxidative agents mainly comprised particulate matter, NO2 and O3. PM oxidative potential has also been recognized in several cell assays and epidemiological studies (Delfino et al 2013, Liu et al 2014, Kelly and Fussell 2015). However, few previous studies have evaluated whether the observed effects of Ox were dependent on the simultaneous exposure to PM2.5. In this study, the association between Ox and FeNO was robust to the adjustment of PM2.5, suggesting the oxidative effects of Ox on respiratory system might be independent of PM2.5. Nevertheless, confirming the independent effects of Ox requires additional investigations.
We reported a significant increase of 4.18% in FeNO levels associated with a 10 μg m−3 elevation in Ox among COPD patients. FeNO is a well-established biomarker of respiratory inflammation in both clinical practice and epidemiological studies (Lin et al 2011, Malerba et al 2014). FeNO is predominantly produced in airway epithelial cells by inducible nitrogen monoxide synthase. This synthase can be activated by proinflammatory cytokines, reactive oxygen species or hypomethylation of the synthase gene, which may be stimulated by the inhalation of exogenous oxidants (Chen et al 2015). Elevated FeNO levels corresponded to higher levels of inflammatory response, which played important roles in the development and exacerbation of COPD. Our findings on FeNO supported previous epidemiological results on the associations between Ox (including NO2, O3) and daily mortality (Chardon et al 2007, Williams et al 2014).
Few previous studies have examined the modifications by age, sex, BMI, educational, comorbidities and disease severity in the Ox-mediated health effects. In this study, high responsiveness among males may be explained by the reduced exposure measurement error due to more outdoor activities, or simply by the incomparable statistical power between the male and female group. The susceptibility of elders may be due to their relatively frail physique, airway hyper-responsiveness and higher prevalence of chronic comorbidities (Chen et al 2012a). Obese people may have a chronic inflammation state, and a higher prevalence of chronic comorbidities (Li et al 2016), thus they are sensitive to the inflammatory response triggered by Ox (Lu et al 2013). Higher effects in subjects with high educational attainment might be explained by higher average BMI than those with low educational attainment (e.g. 24 kg m−2 versus 23 kg m−2 in this study). The larger effects observed in those having worse airflow capacity and in those with comorbidity might be due to their intrinsic vulnerability to external toxics.
This study has several strengths. First, this was a longitudinal panel study which allowed us to control for potential individual confounders including age, sex, BMI (Olin et al 2006). Second, COPD patients who were sensitive to air pollution were recruited in this study. Third, FeNO were repeatedly measured at the same daytime once a week within 6 weeks to avoid any unknown time-varying patterns, such as the diurnal rhythm and inherent seasonality (Spanier et al 2008).
The limitations of our study should be also addressed. First, as in most of previous studies, exposure measurement errors are still inevitable because we obtained data from a nearby fixed-site monitor rather than personal measurements. However, we did not think that the errors had led to substantial bias on our findings because the distance between the fixed-site monitor and the community was reasonable (about 3 km) and all the subjects were retirees who may share similar time-location patterns. Second, the sample size in our study is relatively small, which may add uncertainty to our results on main analyses and stratification analyses. Third, the generalizability of our results is limited because our subjects are COPD patients and most of them are females.
In summary, this analysis demonstrated an independent effect of Ox on respiratory inflammation among COPD patients. Our results also suggested that a single metric Ox might serve as a preferable indicator of atmospheric oxidative capacity in further air pollution epidemiological studies. Further work is still needed to confirm our findings using larger sample size and more health outcomes.
Acknowledgments
The study was supported by the Public Welfare Research Program of National Health and Family Planning Commission of China (201502003 and 201402022), National Natural Science Foundation of China (81502774 and 81502775), and China Medical Board Collaborating Program (13-152).
Conflict of interest
The authors declared no conflicts of interests.